progress report - dnr
TRANSCRIPT

116 TFW-AM9-99-010
TFW Effectiveness Monitoring and Evaluation Program
PROGRESS REPORT
For the period:
July 1997 to June 1999
by:
Dave Schuett-HamesAllen Pleus
Amy MorganMyla McGowan
andDevin Smith
Northwest Indian Fisheries Commission
August 1999

TABLE OF CONTENTS
1 INTRODUCTION.. ..................................................................................................................................................... 1
2 PROGRESS REPORT FOR THE 1997-99 BIENNIUM.. .......................................................................................... 1
2.1 TFW EFFECTIVENESS MONITORING AND EVALUATION PROGRAM DEVELOPMENT.. ..................................................... 12.1.1 Development of the TFW E/jectiveness Monitoring and Evaluation Program Plan.. .......................................... 12 .1 .2 Development of Effectiveness Monitoring Strategies, Approaches and Monitoring Methods. ............................. 1
Mass wast ing. . ............................................................................................................................................................................ 1Surface Erosion ........................................................................................................................................................................... 1Ripaim LWD and Shade ............................................................................................................................................................ 2Fish Passage ................................................................................................................................................................................ 2Sediment Reduction on Forest Reads.. ......................................................................................................................................... 2Watershed-Scale Monitoring ........................................................................................................................................................ 2Stratification ............................................................................................................................................................................... 2
2.1.3 Efjectiveness Monitoring Pilot Projects ............................................................................................................ 2. . .Ripalian prescrIptIon effectrveness.. ............................................................................................................................................. 2Northeast Washington ripaian stand dynamics and LWD recruitment ........................................................................................... 3Intentional LWD placement ......................................................................................................................................................... 3wood in small streams- astern Cascades .................................................................................................................................... .3Watershed-scale monitoring of LWD abundance- Coweeman WAU ............................................................................................ .3Baseline LWD prescription effectiveness and LWD abundance in the Acme WAU ....................................................................... 4. . . .Road drainage and erosion m&&on- westem Washington.. ......................................................................................................... .4Mass \~sting prescription effectiveness in the Acme WAU ........................................................................ _. ................................ 4Watenhed-scale monitoring to determine WSA effectiveness- Quartz Mountain WAU ................................................................. 4
2.2 COOPERATIVE MONITORING SERVICES TO ASSIST TFW PARTICIPANTS ....................................................................... 42 .2 .1 Training, Technical Assistance. Qua@ Assurance andMethods Testing.......................................................... 5
Monitoring Training.. .................................................................................................................................................................. 5Watershed Analysis Monitoring Training.. ................................................................................................................................... 6TechnIcal Assistance ................................................................................................................................................................... 6Development of Training Materials .............................................................................................................................................. 6Quality Assurance ....................................................................................................................................................................... 7Methods Testing and Refmement ................................................................................................................................................. 8
2.2.2 Database Support,, .......................................................................................................................................... 8Data Input .................................................................................................................................................................................. .8Database Development ............................................................................................................................................................... .8TFW-EMEP Web Page and Effectiveness Monitoring Infomlation Bank.. ................................................................................... .8
3 FUTURE DIRECTION FOR TfIE TFW EMEP INTHE 1999-2001 BlENNIUM ................................................... 9
3.1 SITE-SCALE P RACTICE E FFECTIVENESS MONITORING ................................................................................................. 93.1.1 Riparion practice eflctiveness. ........................................................................................................................ 93 .1 .2 Efjectiveness of road maintenance and abandonment plans in reducing sediment delivery.. ............................ IO3.13 Fish passage effectiveness ot stream crossing structures onforest roads ......................................................... I O
3.2 WATERSHED-SCALE MONITORING ........................................................................................................................... 1 03.3 DATABASE AND TFW EFFECTIVENESS h40~li-01~~~ INFORA~ATION BANK DEVELOPMENT.. ...................................... 103.4 EFFECTIVENESS MONITORING SUPPORT SERVICES .................................................................................................... 113.5 ADAPTIVE MANAGEMENT SUPPORT.. ....................................................................................................................... 11
4 CONCLUSIONS ...................................................... . ................................................................................................ 1 1
5 REFERENCES ............. , .............................................................................. ., ............................................................ 12
APPENDIX A TFW-EMEP METHODS TESTING AND REFINEMENT PROJECT DESCRIPTION
APPENDIX B TFW-EMEP EFFECTIVENESS MONITORING INFORMATION BANK DESCRIPTION

1 IntroductionThis document reports on the activities of the TFW Effectiveness Monitoring and Evaluation Program(TFW-EMEP) during the biennium beginning July 1, 1997 and ending June 30, 1999. Work was focusedin two major areas during this period: 1) developing and initiating the TFW effectiveness monitoringprogram, and 2) providing services to help TFW cooperators successfully undertake and completemonitoring projects. Section 2 describes progress in these areas during the last biennium. Section 3discusses future direction and tasks for the program in the next two years and section 4 summarizesconclusions.
2 Progress Report for the 1997-99 Biennium
2. I TFW Effectiveness Monitoring and Evaluation Program DevelopmentThe major focus of the program during this biennium was to develop and begin implementing a programto monitor and evaluate the effectiveness of forest practices rules in reducing impacts to aquatic resourcesfrom forest practices on state and private forest land. The program is based on the TFW effectivenessmonitoring strategy (Schuett-Hames et al., 1996) which called for monitoring the effectiveness ofindividual practices on a site-scale and for monitoring aquatic resource response to cumulative effects offorest practices on a watershed scale. Work was done in three areas during this biennium including: 1)development of a TFW Effectiveness Monitoring and Evaluation Program Plan; 2) development ofspecific monitoring approaches and methods for high priority topic areas, and 3) pilot projects to testeffectiveness monitoring approaches and begin answering questions concerning effectiveness.
2.1.1 Development of the TFW Effectiveness Monitoring and Evaluation Program PlanA draft TFW Effectiveness Monitoring and Evaluation Program Plan was completed in the spring of1998. The plan was presented to TFW cooperators in two workshops and at DNR regional TFWcooperators meetings. The plan was updated in the spring of 1999 to incorporate changes based onexperience gained through the pilot projects (Schuett-Hames et al., 1999). The updated plan identifiesTFW effectiveness monitoring goals, objectives and monitoring questions, presents a conceptual modelfor identifying forest practice-aquatic interactions, and identities monitoring topic areas approaches, andparameters for both site-scale monitoring of practice effectiveness and watershed-scale monitoring ofcumulative effects. An implementation plan is also included.
2.1.2 Development of Effectiveness Monitoring Strategies, Approaches and Monitoring MethodsExtensive progress was made developing monitoring strategies, approaches and methods for high priorityeffectiveness monitoring topic areas. Study design guidelines and methods were developed to monitor theeffect of forest practices on mass wasting, surface erosion (roads and harvest units), riparian shade andLWD recruitment, and fish passage. Each of these is discussed briefly below.
Draft study design guidelines and procedures were developed for monitoring and evaluating theeffectiveness of forest practices in preventing mass wasting on both the site (individual practice) andwatershed scale (Sasich, 1998a).
Surface ErosionDraft study design guidelines and procedures were developed for monitoring and evaluating theeffectiveness of forest practices in preventing surface erosion on both the site (individual roads and timberharvest practices) and watershed scale (Sasich, 1998b).
1

Riparian LWD and ShadeDraft study design guidelines were developed for monitoring and evaluating the effect of forest practiceson riparian LWD recruitment and shade on both the site and watershed scale (Smith and Schuett-Hames,1999). A riparian stand survey method was also developed to document changes in riparian standcondition, composition, growth and LWD recruitment following timber harvest (Smith, 1999). Theriparian stand survey is currently being refined following pilot testing.
Fish PassageA drag monitoring approach and methods were developed for monitoring and evaluating the effectivenessof forest road stream crossing structures in providing passage for resident and anadromous salmonids atindividual crossing structures (Terrapin Environmental, 1999). The document includes a separateapproach for assessing the effects of many crossing structures on habitat availability and fragmentation ona watershed scale.
Sediment Reduction on Forest RoadsBuilding on previous work done developing methods and approaches for monitoring surface erosion andmass wasting effectiveness monitoring, this project refined and tested procedures for monitoring theeffectiveness of sediment reduction (road maintenance and abandonment) plans on forest roads. Theresult is a draft comprehensive monitoring approach for evaluating sediment delivery from forest roads(Veldhuisen et al., 1999).
Watershed-Scale MonitoringWork was initiated on development of a strategy and approach for conducting watershed-scaleeffectiveness monitoring. The purpose of watershed-scale monitoring is to determine the cumulativeeffects of forest practices on watershed input processes, and to document the channel, habitat, waterquality and biotic response to management-induced changes in input processes. Progress during thisbiennium included: 1) development of a draft approach for watershed-scale monitoring (Schuett-Hames,1999) 2) a critical review of the approach by the University of Washington Center for Streamside Studies(Sibley and Bolton, 1999); and 3) development of a pilot watershed-scale monitoring plan (O’ConnorEnvironmental, 1999).
StratificationThis project assessed options for stratifying the landscape for the purposes of conducting effectivenessmonitoring for mass wasting and surface erosion. The assessment recommended a stratification systembased on physiographic regions, geology, and landform types (Sasich, 199%). Based on theserecommendations, a GIS coverage was developed for geology that condenses DNR geology units into 17geology groups and for physiographic regions based on EPA level III and IV eco-regions.
2.1.3 Effectiveness Monitoring Pilot Projects
Nine pilot projects were undertaken to test monitoring approaches and procedures prior to initiating full-scale statewide monitoring projects. The objectives for the pilot projects were: 1) to test TFW-EMEPstudy design guidelines, methods and procedures; 2) to test the TFW cooperative monitoring system; and3) to gather preliminary information on effectiveness for several key monitoring questions. A descriptionof the pilot projects and their status follows.
Rinarian prescriotion effectivenessThis project is designed to evaluate the effectiveness of Watershed Analysis (WSA) riparian LWD andshade prescriptions in the North Cascades physiographic region. The project will: 1) evaluate and
2

compare the effectiveness of WSA riparian prescriptions in maintaining stream temperatures andproviding LWD recruitment, 2) examine the influence of physical site conditions on RMZ effectiveness,and 3) provide information on riparian buffer dynamics, LWD recruitment and the persistence andtinction of LWD (Smith et al, 1998). The pilot project will examine the feasibility of monitoring andinterpreting data t?om sites where harvest has already been done versus sites where baseline data can begathered prior harvest, Potential monitoring sites were identified in the Deer Creek, Grifftn-TokulHansen, Hazel, Hutchinson Creek, Jordan-Boulder, Lake Whatcom, Skookum, and Tolt WAUs. Sixteensites were selected, including ten post-harvest sites and six pre-harvest sites. Sampling sites werestratified by buffer width and stream gradient. Data was gathered using the TFW-EMEP riparian standinventory procedure and the TFW LWD and habitat unit surveys. A preliminary report is in preparation,
Northeast Washinaton rioarian stand dvnamics and LWD recruitmentThis project is designed to examine riparian LWD recruitment processes and stand dynamics in threetypes of riparian stands in the Onion Creek WAU, located in the Northern Rockies eco-region in northeastWashington (Schumaker et al., 1998). The objectives ofthe project are to: 1) generate information onLWD recruitment including tree fall rates and fall direction to improve models to estimate recruitmentover time, 2) to document current stand conditions and recruitment rates during normal years and episodicevents, and 3) to determine the persistence and function of recruited wood. Data was collected using theTFW-EMEP riparian stand inventory procedure and the TFW LWD and habitat unit surveys. Apreliminary report is in preparation
Intentional LWD ulacementThis project is designed to examine the effectiveness of Watershed Analysis LWD prescriptions foradding LWD to stream channels in the Coweeman WAU in the Cascades eco-region near Vancouver.The objectives of the project are: 1) to document the characteristics of the wood added to the channel; 2)to determine ifthere is an initial, quantifiable response in channel morphology (pool formation andsediment storage); and 3) to determine if the added pieces are stable and continue to function over time(Beech, 1998). Data was collected at four sites adjacent to harvest units where pieces were placed in thechannel by yarding unmerchantable wood or directional falling during harvest operations and one sitewhere a log bridge with old-growth stringers was demolished. A preliminary report is in preparation.
Wood in small streams- eastern CascadesThis project is designed to monitor riparian stand conditions and wood quantity and function in small,steep stream channels in the east Cascades eco-region. The project objectives are: 1) to determine thefunction of both large and small wood in small streams, and 2) to determine the type of forest standconditions needed to provide adequate amounts of wood to provide those Iimctions (chesney, 1999). Datafrom eleven managed (harvested) sites was compared with five unmanaged sites. Data was collected onriparian stand density and composition, channel wood abundance, and the fimction of wood in forming“steps” (obstructions that store sediment and dissipate energy). A preliminary report is in preparation.
Watershed-scale monitoring of LWD abundance- Coweeman WAUThis project is designed to establish a baseline for monitoring changes in LWD abundance on awatershed-scale. The project objectives are: 1) to document current LWD loading levels throughout theCoweeman WAU; 2) to document LWD loading levels adjacent to units scheduled for harvest within fiveyears; and 3) to examine the relationship between current riparian stand condition and current LWDloading levels (Volkhardt, 1998). The study design involves a watershed-scale sampling scheme thatplaces all stream segments in the WAU into 15 strata based on five stream gradient classes and threeconfinement classes. Sixty-eight ofthe 91 segments in the WAU were sampled for LWD size andabundance and riparian stand condition. A preliminary report is in preparation.
3

Baseline LWD nrescriution effectiveness and LWD abundance in the Acme WAUThis project is designed to establish a baseline for monitoring changes in LWD abundance and WatershedAnalysis riparian prescription effectiveness in the Acme WAU (North Cascades-west eco-region). Theproject objectives are: 1) to document current LWD loading in fish-bearing streams and determinechanges in LWD loading over time response to the riparian prescriptions; 2) to determine how timberharvest on Type 5 waters affects LWD recruitment and loading; and 3) to determine how the wood budgetin a small sub-basin responds to management under WSA prescriptions compared to one where harvestactivity is not occurring (Soicher, 1999). A preliminary report is in preparation.
Road drainage and erosion initiation- western WashimztonThis project is designed to examine the effect of road drainage and relief culvert spacing on initiation ofmass wasting and surface erosion at culvert outlets. The objectives are to: I) determine if standards forculvert spacing and drainage guidelines are preventing erosion at culvert outlets; and 2) determine ifWatershed Analysis identifies situations where erosion at culvert outlets is likely to occur and addressesthem appropriately (Russell and Veldhuisen, 1999). Four WAUs representing a range of geographic,climatic and landform conditions were selected for study, including Deer Creek, Mashel, Upper Chehalisand Hoko. A total of seventeen road segments ranging in length from 0.5-2.2 miles were sampled. Ineach segment, all culverts were visited to determine the spacing and drainage area and to identify andmeasure erosion features. A report is in preparation.
Mass wasting orescriotion effectiveness in the Acme WAUThis project is designed to evaluate the effectiveness of Watershed Analysis mass wasting prescriptions inthe Acme WAU. The objectives are to determine: 1) if sediment delivery from management-inducedmass wasting decreases over time in the WAU under the prescriptions; 2) if the prescriptions for roadconstruction in sensitive areas prevent delivery of sediment from mass wasting: 3) if the mass wastingbuffers adjacent to inner gorges are effective in preventing mass wasting and windthrow in the buffer; and4) if prescriptions for selective harvest in the ground-water recharge zone of deep seated landslides areeffective in preventing re-activation of the slides (Soicher, 1999). A preliminary report is in preparation,
Watershed-scale monitoring to determine WSA effectiveness- Ouartz Mountain WAUThis project is designed to determine the effectiveness of Watershed Analysis in an eastern CascadeWAU. The project objectives are: 1) to determine the effectiveness of mass wasting, surface erosion, andriparian prescriptions; 2) to document changes in inputs of sediment, LWD, thermal energy and peakflows; 3) to determine the response of aquatic resource conditions to changes in inputs; and 4) to evaluatethe performance of the WSA hazard identification procedures. Preliminary sampling of aquatic resourceconditions has occurred, and additional work to document changes in input processes is planned in thecoming year in conjunction with the WSA five-year review.
2.2 Cooperative Monitoring Services to Assist TFW Participants
An important tinction of the TFW Effectiveness Monitoring and Evaluation Program is to provideservices to assist the TFW organizations conducting monitoring. To produce monitoring information thatTFW can use with confidence, success&d monitoring studies must be well planned and implemented.This requires quality work at every step of the monitoring process, including study design, selection ofparameters, collection of data, and analysis of results. The TFW Effectiveness Monitoring and EvaluationProgram provides monitoring manuals, training, quality assurance, and database support to help TFWcooperators achieve quality results. Each of these aspects is discussed below.
4

2.2.1 Training, Technical Assistance, Quality Assurance and Methods Testing
Monitoring TrainingThe TFW-EMEP provides comprehensive training services to promote consistent application of TFWmonitoring methods throughout the state. These services are available through annual training workshopsand on-site field training and assistance visits. During this biennium we conducted annual trainingsessions TFW monitoring methods (Table 1). The annual training workshops are generally conductedduring the second week of June and the fourth week of July. Four days of training are provided in theJune workshops to cover Stream Segment Identification, Wadeable Stream Discharge Measurement, andthe Reference Point, Habitat Unit, Large Woody Debris, and Stream Temperature Surveys. The Julyworkshop consists of three days covering Salmonid Spawning Gravel Composition, Salmonid SpawningHabitat Availability and Salmonid Spawning Gravel Scour
Table 1. Participation at TFW EMEP annual training workshops (attended/registered by workshop).
Stream Segment ’JuneIdentification Method
7 7 36146 44154 so/75 50/70 30131 33136
Reference Point/Large ,, 7Woody Debris Surveys 22134 43154 46164 49169 36139 35136
Habitat Unit Survey and ,,Discharge Method ,, 24134 41153 44161 41165 31140 42143
Stream TemperatureSurvey N/A N/A 19131 41155 44161 41165 24125 29129
JulySpawning GravelComposition Survey N/A ? 36150 37162 32158 30162 34135 35*
Spawning HabitatAvailability Survey N/A N/A. N/A N/A 41171 35110 35135 35*
Spawning Gravel ScourSurvey N/A N/A N/A N/A 40166 29166 31/33 35*
Total # People/day 55* a9* 137 206 303 281 221 244*
“‘?“=attended/registered figures not available; “N/A”=workshop not offered; “*“=estimated attendance
On-site field training and field assistance services are offered throughout the year on an appointmentbasis. Cooperators who cannot attend the annual workshops or require further training to address localwatershed conditions use this service. These visits provide individual training in all the survey methodscovered at the workshops, plus assistance in study design development and implementation strategies,On-site training also provides an opportunity to focus on method application under local conditions.Cooperators in the more remote areas of the state find this service to be most valuable. TFW-EMEPprovided 12 on-site geld training and assistance visits for a total of 40 people in 1997 and 8 visits for atotal of 34 people in 1998 (Table 2). There have been 11 on-site training visits conducted for a total of 53people in 1999 to date.
5

Table 2. Training provided by the TFW EMEP through workshops and on-site visits.
* as of 6130199
Watershed Analvsis Monitoring TrainingTFW-EMEP staff continued to conduct training in the Watershed Analysis monitoring identificationprocedure in cooperation with DNR at WSA training sessions during this biennium (Table 3).
Table 3. Training provided by the TFW-EMRP at DNR-sponsored Watershed Analysis training sessions.
Training Session Date Participants in Monitoring Lab Type of Session
June 16 - 20. 1997 1 1 Newly Qualifying Analysts
(( December 8 - 12, 1997 ( 10 I Re-qualifying Analysts II
II January 26 - 28, 1998 I 12 Newly Qualifying Analysts #
July 6 - 10, 1998 Re-qualifying Analysts
Technical AssistanceThe TFW-EMEP provides technical assistance to TFW cooperators in designing monitoring projects.During this period, we provided assistance in monitoring project design for Quartz Mt. WAIJ, the WeycoLLP, Thurston County assessment for Scatter Creek, Martin Fox’s LWD study, and the riparianeffectiveness pilot project. Technical review of monitoring plans and monitoring reports for the pilotprojects was also provided (see section 2.1.3, effectiveness monitoring pilot projects).
Develooment of Training MaterialsThe 1994 TFW method manual, the 1996 Salmonid Spawning Habitat Availability Survey manual, andthe 1995 Salmonid Spawning Gravel Scour Survey manual have been completely revised. The mostobvious change is separating the 1994 comprehensive manual into stand-alone manuals for each specificmethod or survey. This structure allows quicker refinements to individual manuals in the future, easierreferencing, and portability. The internal structure of the manuals has been adjusted and expanded toprovide a user-friendly lineal format to facilitate high quality data collection from study design to datamanagement. This format fills many gaps that were identified as problems in training, QA review, anddata entry sessions, We found that cooperators require more guidance in study design development, pre-and post-survey tasks, and procedures. In general, the structure was refined to provide step-by-stepguidance in application of the methods. Each step begins with a clear task, followed by in-depthexplanations for less experienced crews. The data management sections were refined to provideinformation on data analysis and summary report contents, The appendices include refinements to thefield forms, examples of completed field forms, and other resources and information required to conductthe specific survey. Almost every graphic has been refined or replaced and many new graphics have beenadded to improve comprehension.
6

Implementation ofa Puget Sound Water Quality Action Team (PSQAT) Public Information andEducation (PIE) grant resulted in completion of a training video for the Salmonid Spawning GravelComposition Survey. Response was very positive at two training workshops where the video has beenshown. 230 copies of the video have been distributed to a wide variety of TFW and other cooperatorsincluding Puget Sound educators, Washington State Extension agencies and county conservation districts.Several copies are available for loan purposes. Over 500 people have viewed the video. The PIE grant,with donations of additional equipment from the Point No Point Treaty Council and the Skokomish Tribe,provided the resources for purchase of a new McNeil gravel sampler and construction of a completevolumetric processing station. This equipment is now available for loan.
Oualitv AssuranceQuality Assurance (QA) services are offered to individual cooperators to ensure and document consistentapplication of the TFW-MP standard methods by field crews (Table 4). These services are availablestatewide throughout the year. QA Reviews have been conducted for the program since 1992. During thistime, the QA Review system has developed into a rigorous and scientifically sound testing and evaluationformat that provides insights into factors influencing monitoring variability. This system is unique amongstate and regional monitoring programs.
Table 4. Number of QA Reviews by survey type and year.
“N/A” means workshop was not offered; “*” as of 6/30/99
There are three goals for QA Review services: 1) to help cooperators collect the highest quality datapossible; 2) to provide feedback to both the cooperator and TFW-EMEP on factors affecting data qualityand repeatability; and 3) to identify specific topics for projects to test and refine the methods. Asuccessful monitoring QA plan includes TFW-EMEP training, practice in application of the methods onstudy area streams, and a pre-season QA Review. Cooperators who utilize these services have stated thatit provides them with confidence in the abilities of their crews and the resulting data quality. Thistranslates into confidence that baseline and trend monitoring studies accurately depict initial channelconditions and changes in those conditions over time.
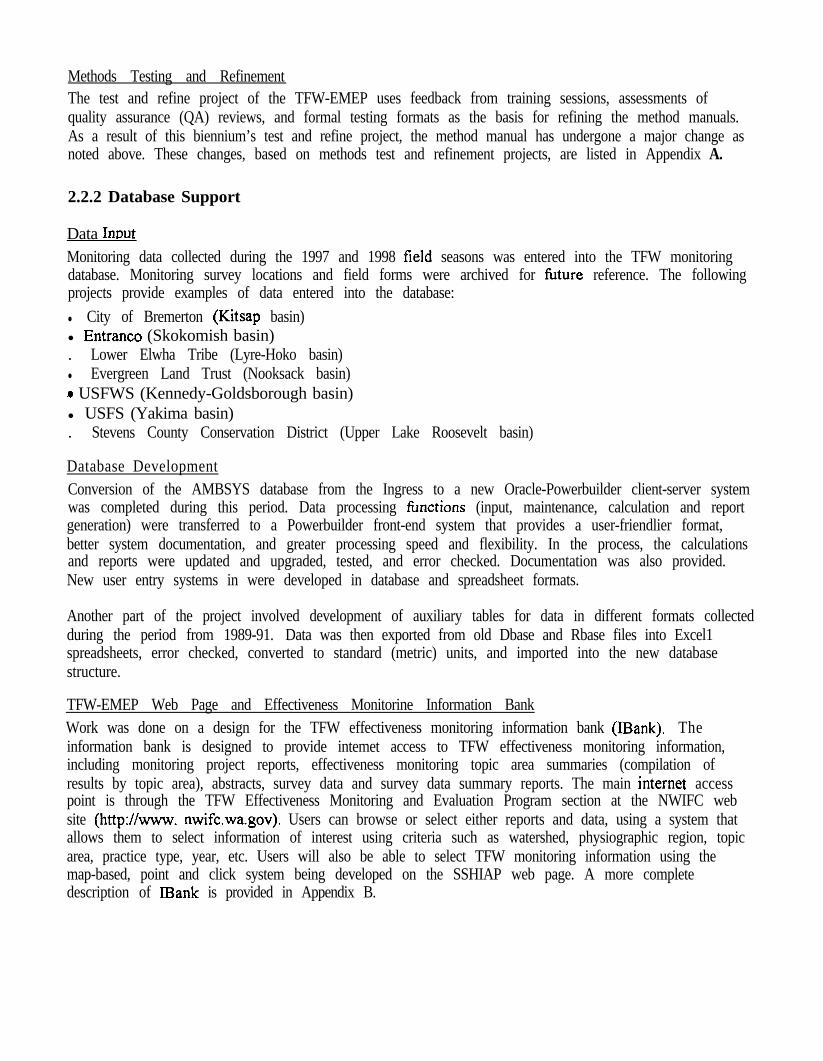
Methods Testing and RefinementThe test and refine project of the TFW-EMEP uses feedback from training sessions, assessments ofquality assurance (QA) reviews, and formal testing formats as the basis for refining the method manuals.As a result of this biennium’s test and refine project, the method manual has undergone a major change asnoted above. These changes, based on methods test and refinement projects, are listed in Appendix A.
2.2.2 Database Support
Data InuutMonitoring data collected during the 1997 and 1998 field seasons was entered into the TFW monitoringdatabase. Monitoring survey locations and field forms were archived for tirture reference. The followingprojects provide examples of data entered into the database:
l City of Bremerton (Kitsap basin)l Entrance (Skokomish basin). Lower Elwha Tribe (Lyre-Hoko basin)l Evergreen Land Trust (Nooksack basin).a USFWS (Kennedy-Goldsborough basin)l USFS (Yakima basin). Stevens County Conservation District (Upper Lake Roosevelt basin)
Database DevelopmentConversion of the AMBSYS database from the Ingress to a new Oracle-Powerbuilder client-server systemwas completed during this period. Data processing tlmctions (input, maintenance, calculation and reportgeneration) were transferred to a Powerbuilder front-end system that provides a user-friendlier format,better system documentation, and greater processing speed and flexibility. In the process, the calculationsand reports were updated and upgraded, tested, and error checked. Documentation was also provided.New user entry systems in were developed in database and spreadsheet formats.
Another part of the project involved development of auxiliary tables for data in different formats collectedduring the period from 1989-91. Data was then exported from old Dbase and Rbase files into Excel1spreadsheets, error checked, converted to standard (metric) units, and imported into the new databasestructure.
TFW-EMEP Web Page and Effectiveness Monitorine Information BankWork was done on a design for the TFW effectiveness monitoring information bank (IBank). Theinformation bank is designed to provide intemet access to TFW effectiveness monitoring information,including monitoring project reports, effectiveness monitoring topic area summaries (compilation ofresults by topic area), abstracts, survey data and survey data summary reports. The main internet accesspoint is through the TFW Effectiveness Monitoring and Evaluation Program section at the NWIFC website (http://www. nwifc.wa.gov). Users can browse or select either reports and data, using a system thatallows them to select information of interest using criteria such as watershed, physiographic region, topicarea, practice type, year, etc. Users will also be able to select TFW monitoring information using themap-based, point and click system being developed on the SSHIAP web page. A more completedescription of IBank is provided in Appendix B.

3 Future Direction,for the TFW EMEP in the 1999-2001 BienniumThe TFW Monitoring Advisory Group (MAG) has requested funding for the TFW-Eh4EP in the next.biennium to support: 1) the adaptive management component developed as part of the forestry modulenegotiations (USFWS et al., 1999); 2) the WSA five-year review process; and 3) the adaptivemanagement elements of the state salmon strategy. MAG proposes to implement statewide effectivenessmonitoring to answer a limited number of key effectiveness monitoring questions. Several of theproposed statewide monitoring projects are focused on evaluating the effectiveness of specific forestpractice prescriptions that are being implemented under the forestry module agreement and WSAprescriptions, Another project is designed to answer watershed-scale effectiveness questions involvingchanges in input processes and associated aquatic resource response. Work is also proposed in databaseand information bank development and maintenance and in monitoring support services, Plans for theeffectiveness monitoring projects are currently under development and will be submitted to Ch4ER forreview prior to the next biennium. The proposed projects are discussed briefly below.
3. I Site-Scale Practice Effectiveness Monitoring
The following projects will evaluate the effectiveness of specific forest practices in protecting aquaticresources on a site-scale. The information will be used to determine how design of the practices andphysical site conditions influence effectiveness, and to identify how performance can be improved,
3.1.1 Riparian practice effectiveness
Rinarian RMZs on fish-bearing watersThis project will evaluate the effectiveness of riparian practices in providing LWD recruitment and shadeon fish bearing waters. The objectives of the project are to: 1) evaluate effectiveness of riparian practicesin providing LWD recruitment; 2) to evaluate effectiveness of riparian practices in providing shade; and3) to determine how site conditions influence riparian practice effectiveness. The project design will bebased on the riparian effectiveness monitoring study design guidelines (Smith and Schuett-Hames, 1998).Sampling sites will be selected in each physiographic region and stratified by forest stand type, channelgradient-confinement class and RMZ design. Riparian stand conditions will be documented beforeharvest, immediately after harvest, and over time to evaluate the effects of timber harvest on LWDrecruitment and shade. Changes in stream temperature, in-channel LWD, pool habitat and sedimentstorage will be documented.
Rioarian hardwood conversion.This project will evaluate the effectiveness of prescriptions for thinning/hardwood conversion in changingstand composition and tree size to increase LWD recruitment. The effect of these practices on shade andstream temperature will also be documented. Stratification and site selection will be similar to the designfor monitoring riparian Rh4Z prescriptions (above). Riparian stand composition, LWD recruitmentpotential and shade will be documented before and after application of the prescriptions. Changes instream temperature and in-channel LWD will be documented.
Rinarian nrotection for non-fish bearing wmThis project will evaluate the effectiveness of riparian buffers on small, non-fish-bearing streams inpreventing adverse changes in stream bank integrity, LWD function and stream temperature regimes.Sampling sites will be stratified by physiographic region, forest stand type, buffer design, and streamchannel gradient/confinement class. Changes in riparian stand condition, stream bank erosion, LWDloading and fimction, and stream temperature will be documented.
9

3.12 Effectiveness of road maintenance and abandonment plans in reducing sediment deliveryThis project will evaluate the effectiveness of road maintenance and abandonment plans in preventingsediment delivery from surface erosion and mass wasting. A sample of road maintenance plansdeveloped under the proposed forest practices rules will be selected to represent different physiographicregions, geology groups and sediment reduction strategies. Evaluation of sediment reductioneffectiveness will occur on a WAU or WAU sub-basin scale. Within the WAU, physical sitecharacteristics and road type/use categories will fkther stratify road segments. Road segments will bevisited before and at intervals after implementation of the road maintenance plan to collect data on roadcharacteristics and to identify mass wasting erosion features. Sediment delivery from surface erosion willbe estimated for both the pre- and post-implementation conditions to determine the effectiveness of theplans in controlling surface erosion. Pre- and post-implementation data on mass wasting rate, volume andpotential will be compared to determine effectiveness of the plans in controlling mass wasting.
3.1.3 Fish passage effectiveness at stream crossing structures on forest roads
This project will evaluate the ~effectiveness of forest road culverts installed according to the criteria in therules in providing passage for various salmonid species and life history stages. Sites will be stratified byphysiographic region, stream gradient/confinement class and crossing structure type. Information on fishmovement, together with data on the physical and hydraulic characteristics of the crossing structure andthe fish distribution response will be used to evaluate effectiveness.
3.2 Watershed-Scale MonitoringThis project will evaluate the effectiveness of the forest practice management system in preventingchanges in watershed processes and aquatic resource conditions due to cumulative effects From forestpractices on a watershed-scale. The objectives are to answer the following questions:I) How do inputs of sediment from surface erosion and mass wasting, LWD input, thermal energy inputchange over time in response to the cumulative effects of forest practices?2) How do aquatic resources respond to changes in the inputs induced by forest practices conducted underthe state forest practice management system?
The approach for designing the watershed-scale effectiveness monitoring project is to identify a sample ofsmall watersheds (WAUs) where the predominant land use is state and private forest land. Thephysiographic regions will stratify WAUs and a sample will be selected to represent the different geologicand climatic conditions. To determine changes in input processes, management-induced changes in masswasting, surface erosion, LWD recruitment potential, and shade will be documented (Schuea-Hames,1999). This information will be used to evaluate the effectiveness of the forest practice managementsystem in controlling adverse changes in input processes in different situations and identify ways thatperformance can be improved. To determine the response of aquatic resources to changes in inputs, aseries of response reaches will be selected for monitoring. Monitoring reaches will be stratified by“response situation”, (defined by channel type, input process regime and geology). A hypothesis will bedeveloped for each reach that predicts how aquatic resource conditions in the reach will respond tochanges input processes. Monitoring will determine trends in aquatic resource conditions over time toevaluate if the management system is effective in creating conditions that provide protection and/or allowrecovery of aquatic resources. Finally, information on the response of input processes to forest practiceswill be used to determine the effectiveness of the management system in identifying sensitive areas foreach input process and areas of resource vulnerability.
3.3 Database And TFWEffectiveness Monitoring Information Bank DevelopmentAdditional database development is planned to manage data collected in effectiveness monitoringsurveys. Databases are planned for mass wasting data, surface erosion data, road erosion data, riparian
IO

stand survey data, and fish passage data. Work will involve development of a database structure tocontain survey data, data entry systems, and development and documentation of applications to performstandard calculations and to generate survey data summary reports. Construction of the internet interfacefor the information bank is scheduled to occur during this period.
3.4 Effectiveness Monitoring Support ServicesDuring the next biennium the TFW-EMEP proposes to continue providing study design assistance,training and quality assurance services to TFW cooperators participating in effectiveness monitoringprojects. Development of method manuals and training services for the riparian stand survey and roadsediment surveys is planned. Additional work is planned to continue testing and refining existingmonitoring methods. These projects will be integrated with future effectiveness monitoring projects.Test and refine projects will be designed to I) determine if surveys are repeatable by different observersunder similar conditions; 2) determine the influence of discharge on repeatability of surveys; 3) determineif survey sites can be accurately relocated; and 4) determine if TFW monitoring parameters and methodsare able to detect management-induced change over time.
3.5 Adaptive Management SupportThe results of the effectiveness monitoring projects will be conveyed to CMER and the TFW adaptivemanagement committee in the form of written reports, presentations and field trips. The reports willprovide preliminary results, identify situations where performance needs to be improved, and discussoptions for improving effectiveness.
4 Conclusions
The past two years have been a dynamic time of change, characterized by rapid and extensive work toimplement the 1996 effectiveness monitoring strategy in the areas ofl Development of a TFW effectiveness monitoring and evaluation program plan
. Identification and prioritization of effectiveness monitoring topic areasl Development of effectiveness monitoring approaches and methods. Implementation of pilot projects to test approaches and produce preliminary resultsAt the same time the program has continued to provide and refine training, quality assurance and databaseservices for TFW cooperators.
Future effort will be focused on statewide implementation of projects to test the effectiveness of therevised forest practices rules adopted to protect salmon stocks. Priority projects include:. Riparian RMZ prescriptions on fish bearing watersl Riparian practices on non-fish bearing waters. Riparian hardwood stand conversion practicesl Road sediment reduction (road maintenance and abandonment plans). Fish passage at stream crossing structures on forest roadsl Watershed-scale monitoring of cumulative effects of forest practicesIn addition, the program will continue to provide training, quality assurance and database services forTFW cooperators. New databases will be developed to support the new effectiveness monitoring projects,the intemet interface for the TFW effectiveness monitoring information bank will be implemented, andthe results of effectiveness monitoring projects will be reported to TFW field managers and policy-makers.
1 1

5 References
Beech, S. 1998. The,effects of the intentional addition of LWD to stream channels in the UpperCoweeman River basin. Final Monitoring Plan. Northwest Indian Fisheries Commission. Olympia.
chesney, c. 1999. Wood in small streams project, channel reference site network. Monitoring planNorthwest Indian Fisheries Commission. Olympia.
O’Connor Environmental Inc., BioAnalysts Inc., and S. Toth. 1999. Watershed-scale monitoring plan forevaluating fine sediment input in the Quartz Mountain WAU. TFW Effectiveness Monitoring and.Evaluation Program. Northwest Indian Fisheries Commission, Olympia.
Russell, P. and C. Veldhuisen. 1999. Monitoring plan: road drainage and erosion initiation in four west-cascade watersheds. TFW Effectiveness Monitoring and Evaluation Program. Northwest IndianFisheries Commission. Olympia.
Sasich, J. 1998a. Monitoring effectiveness of forest practices and management systems. Mass wastingstudy design guidelines, procedures and methods, TFW Effectiveness Monitoring and EvaluationProgram. Northwest Indian Fisheries Commission. Olympia.
Sasich, J. 1998b. Monitoring effectiveness of forest practices and management systems. Surface erosionstudy design guidelines, procedures and methods, TFW Effectiveness Monitoring and EvaluationProgram. Northwest Indian Fisheries Commission. Olympia.
Sasich, J. 199%. Stratification approaches for effectiveness monitoring of mass wasting and surfaceerosion- a comparison, TFW Effectiveness Monitoring and Evaluation Program. Northwest IndianFisheries Commission. Olympia.
Schuett-Hames, D., N. Sturhan, K. Lautz, R. McIntosh, M. Gough and C. Rodgers. 1996. Proposal for aTFW monitoring strategy to determine the effectiveness of forest practices in protecting aquatic resources.TFW-AM9-96-007. TFW Effectiveness Monitoring and Evaluation Program. Northwest Indian FisheriesCommission, Olympia.
Schuett-Hames, D., K. Lautz., J. Light, R. McIntosh, D. Smith, N. Sturhan, K. Sullivan and G. Wilhere.1999. TFW effectiveness monitoring and evaluation program plan. TFW Effectiveness Monitoring andEvaluation Program. Northwest Indian Fisheries Commission. Olympia.
Schumaker, R., C. Kessler and D. Glass. 1998. Onion Creek watershed large woody debris recruitmenteffectiveness monitoring plan. TFW Effectiveness Monitoring and Evaluation Program. NorthwestIndian Fisheries Commission. Olympia.
Sibley, T. and S. Bolton (eds.). Review of the TFW Monitoring Program: watershed-scale monitoringpilot project. Univ. Washington Center for Streamside Studies. TFW Effectiveness Monitoring andEvaluation Program. Northwest Indian Fisheries Commission. Olympia.
Smith, D. 1999. TFW-EMEP riparian stand inventory procedure. TFW Effectiveness Monitoring andEvaluation Program. Northwest Indian Fisheries Commission. Olympia.
1 2

Smith, D., D. Schuett-Hames and J. Grizzel. 1998. Monitoring plan for a pilot project to evaluate theeffectiveness of riparian forest practices in the NW cascades region. TFW Effectiveness Monitoring andEvaluation Program. Northwest Indian Fisheries Commission. Olympia.
Smith, D. and D. Schuett-Hames. 1999. Guidelines for monitoring and evaluating effectiveness of forestpractices and forest management systems: riparian LWD recruitment and shade. TFW EffectivenessMonitoring and Evaluation Program. Northwest Indian Fisheries Commission. Olympia.
Soicher, A. 1999. Monitoring plan for assessing the effectiveness of mass wasting and large woodydebris prescriptions in the Acme watershed. TFW Effectiveness Monitoring and Evaluation ProgramNorthwest Indian Fisheries Commission. Olympia.
Terrapin Environmental and RTG Fisheries Research and Photography. 1999. Monitoring procedures toevaluate effectiveness of culverts in providing upstream passage of salmonids. TFW EffectivenessMonitoring and Evaluation Program. Northwest Indian Fisheries Commission. Olympia.
Veldhuisen, C., S. Toth, S. Faulkner, and L. Miller. 1999. Monitoring approach for evaluating sedimentdelivery from forest roads in Washington. TFW Effectiveness Monitoring and Evaluation Program.Northwest Indian Fisheries Commission. Olympia.
Volkhardt, G. 1998. A baseline inventory of large woody debris in the upper Coweeman WAU: amonitoring plan. TFW Effectiveness Monitoring and Evaluation Program. Northwest Indian FisheriesCommission. Olympia.
1 3

APPENDIX A
TFW EMEP METHODS TESTING AND REFINEMENT PROJECT DESCRIPTION
The test and refine project of the TFW Monitoring Program uses feedback from training sessions,assessments of quality assurance (QA) reviews, and formal testing formats as the basis for refining themethod manuals. As a result of this biennium’s test and refine projects, the method manual has undergonea major change. The following section describes specific refinements made during this biennium bygeneral and individual manual.
General Manual Refinements
There are nine general refinements that have been made to the TFW Monitoring Program method manual.The most obvious change is separating the 1994 comprehensive manual into stand-alone manuals basedon specific methods and surveys. This structure is designed to allow quicker refinements to individualmanuals in the future, easier referencing, and portability. The internal structure ofthe manuals has beenadjusted and expanded to provide a user-friendly and lineal format to facilitate high quality data collectionfrom study design to data management. This format tills many method application gaps that wereidentified as problems during training, QA review, and data entry sessions. We found that cooperatorsrequired more guidance in study design development, pre- and post-survey tasks, and procedures. Ingeneral, the method section structure was refined to provide step-by-step method application guidancewith each step beginning with a clear task, followed by in-depth explanations for less experienced crews.The data management section has been refined to follow database development and to provideinformation on data analysis and summary report contents, The appendix includes refinements to all of thefield forms, examples of completed field forms, and other resources and information required forconducting the specific survey. Almost every previous graphic has been refined or replaced and manynew graphics have been added to improve method comprehension. These and other general refinementsare listed below. Specific refinements to method parameters and criteria will be discussed by individualsurvey.
1. New stand-alone manual format2 . Refined and expanded introduction section includes previous purpose and training, field assistance,
and quality control sections3. New study design section4. New pre-survey preparation section5. Refined methods section6. New post-survey documentation section7 . New data management section refines and expands previous data processing and analysis section8. Refined and expanded appendix section9. Refined and new graphics
A-l

Individual Manual Refinements
Stream Segment Identification
Refinements were made to the method, field segment verification, and appendix sections of the StreamSegment Identification manual. Refinements to the segmenting method were made with the assistance ofthe Salmon and Steelhead Habitat Inventory and Assessment Project (SSHIAP). These refinements weremade to improve consistency in segment and boundary identification. An optional sub-segmentingtechnique has been introduced to provide flexibility for cooperators to meet individual needs, yet maintainthe integrity of the core method. A new field verification section has been developed to translate remotesegmenting applications into actual field identification procedures. These and other specific refinementsare listed below.
1. Refined segmenting methodl Refined and expanded preparation proceduresl New flow, gradient, and confinement layering technique* New lumping and splitting rulesl New optional sub-segmenting technique
2. New field segment verification section3. Refined and expanded appendix section
* New materials, equipment and information sources* Refined Form 1l New lump/split worksheetsl New glossary of terms. New completed examples of Form 1 and lump/split worksheets* New data management examples* New segmenting task checklist* Refined gradient and quarter of quarter template* Updated Watershed Analysis tables* New standard field and vehicle gear checklist
Reference Point Survey
Results of QA reviews and follow-up testing projects showed a need for refinements to the ReferencePoint Survey method manual. Establishing and documenting reference points has been refined to promoteplacing reference points on both banks at each segment boundary and 100 meter reference point.Documentation of reference point locations is now supported by complete triangulation procedures and anew Form 2T. Variability in bank&II width measurements was caused by biased and inaccurate bankfullchannel edge identification. The problem was that crews were biasing identification towards their lowestconfidence range and this typically underestimated the channel’s bankfill width. As a result, theconfidence/default identification technique was improved and given higher prominence. Variability inbankfull depth measurements was caused in part by bankfull channel edge identification, but also by aninaccurate mean depth measurement protocol. A follow-up testing project using a variety of existing andnew bankfull depth techniques produced the new 10 percent cell procedure. Variety in canopy closuremeasurements was found to be caused by problems with equipment type, accuracy, and consistency increw use. A follow-up testing project showed significant differences between the convex and concavespherical densiometer types, inadequate manufacturer instructions, and an impossibly complexmeasurement procedure. Instructions are now provided to modify and stabilize the equipment, and toimprove the measurement procedure with clear criteria. Reference photograph procedures have been
A-2
expanded to support more rigorous studies and documentation. Procedures have been added to address thereconstruction and relocation of lost reference point tags or sites due to factors such as tag removal orchannel migration. These and other specific refinements are listed below.
1, Refined method section. Refined establish and document reference points procedure. Refined banktill channel edge identification procedurel Refined banktill depth measurement procedure. Refined canopy closure measurement procedurel Refined reference photograph procedurel New reconstruction and relocation of lost reference points procedure
2. Refined and expanded appendix sectionl Dropped scan entry Form 2l New task checklistl New materials, equipment and information sources. New Forms 2H and 2T, and retined Form 2D (Form 2D .replaces previous Form 2)l New standard field and vehicle gear checklistl New completed examples of field forms 2H, 2T, and 2D. New bankfull depth cell method interval matrix. Refined and expanded data management examplesl New glossary of terms
Habitat Unit Survey
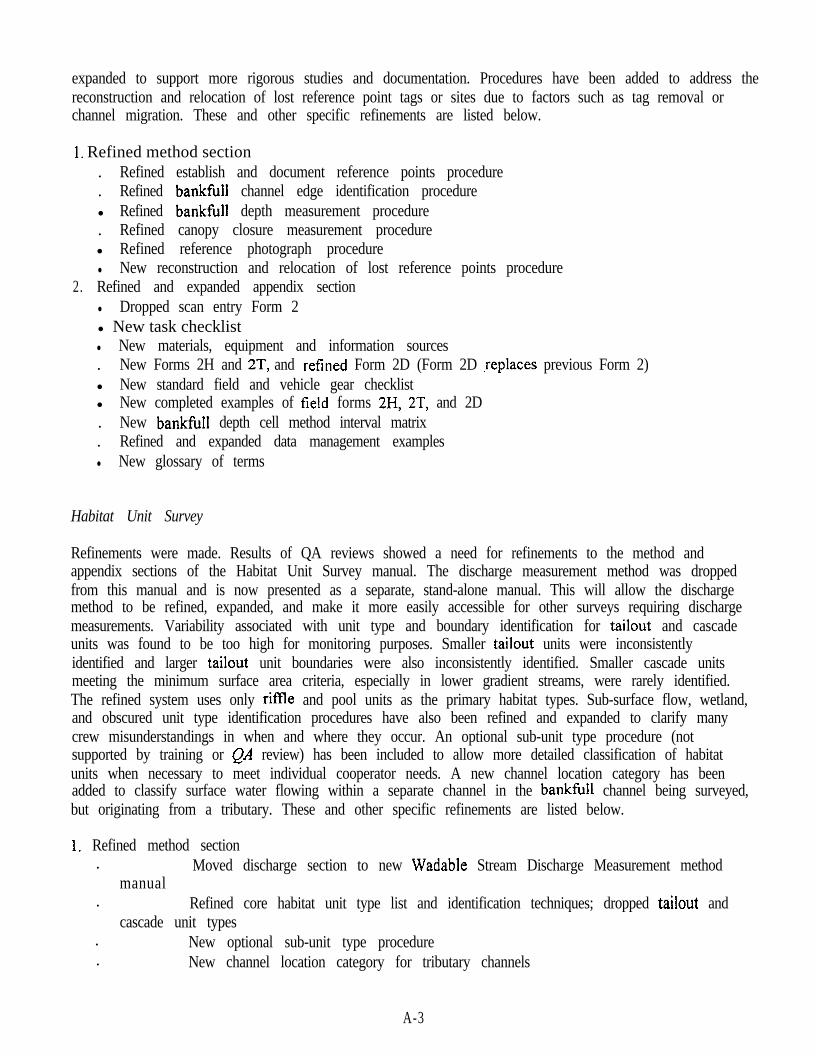
Refinements were made. Results of QA reviews showed a need for refinements to the method andappendix sections of the Habitat Unit Survey manual. The discharge measurement method was droppedfrom this manual and is now presented as a separate, stand-alone manual. This will allow the dischargemethod to be refined, expanded, and make it more easily accessible for other surveys requiring dischargemeasurements. Variability associated with unit type and boundary identification for tailout and cascadeunits was found to be too high for monitoring purposes. Smaller tailout units were inconsistentlyidentified and larger tailout unit boundaries were also inconsistently identified. Smaller cascade unitsmeeting the minimum surface area criteria, especially in lower gradient streams, were rarely identified.The refined system uses only riffle and pool units as the primary habitat types. Sub-surface flow, wetland,and obscured unit type identification procedures have also been refined and expanded to clarify manycrew misunderstandings in when and where they occur. An optional sub-unit type procedure (notsupported by training or QA review) has been included to allow more detailed classification of habitatunits when necessary to meet individual cooperator needs. A new channel location category has beenadded to classify surface water flowing within a separate channel in the banktill channel being surveyed,but originating from a tributary. These and other specific refinements are listed below.
1. Refined method section. Moved discharge section to new Wadable Stream Discharge Measurement method
manual. Refined core habitat unit type list and identification techniques; dropped tailout and
cascade unit types. New optional sub-unit type procedure. New channel location category for tributary channels
A-3

2. Refined and expanded appendix section. Dropped completed discharge Form 7, blank Form 7, scan entry Forms 3,4 and 3B, and
metric conversion chart. New Form 3.0 and refined Form 3. I (Form 3.1 replaces previous Form 3). New completed examples ofForms 3.0 and 3. I. New habitat criteria and code field sheet replaces previous TFW ambient monitoring
code sheet. New standard tield and vehicle gear checklist. Refined and expanded data management examples
Lxxge Woody Debris Survey
Results of QA reviews showed a need for refinements to the method and appendix sections of the LargeWoody Debris Survey manual. Variability in LWD jam identification was found to be caused byproblems with the “in contact/touching” criteria and general jam identification guidelines. Refinementswere made to clarify jam identification and to include pieces that are not directly in contact with anotherqualifying piece, but are associated with jam structure. Variability in LWD jam piece count was caused byproblems with the 10 piece criteria and whether to count associated jam pieces totally in zone 4. Therefined procedure provides clear instructions that jam identification still requires a minimum of 10qualifying pieces (including associated zone 4 pieces), but that jam counts reflect only those individualpieces with lengths extending into zones 1,2, and 3. Level 1 and 2 surveys have been refined to includeoptional supplemental parameters that have been identified as important to cooperators, but are notsupported by training or QA review services. The new parameters include key pieces as defined byWatershed Analysis, pieces with lowest portion of their lengths extending only into zone 3, two optionsfor both channel orientation and decay class parameters, and a simple yes/no sediment storage parameter.Problems with jam piece counts where a single jam influences two or more survey segments has beenaddressed by assigning piece counts based on the midpoint locations of individual pieces. These and otherspecific refinements are listed below.
1. Refined method sectionl Refined jam identification and recorded piece count criterial New optional Level I supplemental key piece and zone 3 data collection proceduresl New optional Level 2 supplemental zone 3, channel orientation, decay class, and sediment storage
data collection proceduresl New splitting jams at segment boundaries procedurel New optional jam supplemental zone 3 and key piece data collection procedures
2. Refined and expanded appendix sectionl Dropped scan entry field forms and decay class codesl New Form 4.0 and refined Forms ,4. I, 4.2, and 4.3 (Form 4.3 replaces previous Form 5)l New completed examples of Forms 4.0, 4. I, 4.2, and 4.3l New LWD criteria and code field sheet replaces previous HabitaULWD code sheetl New standard field and vehicle gear checklistl Refined and expanded data management examples
A-4

Wahble Stream Discharge Measurement
The Wadable Stream Discharge Measurement method manual is an expanded version of the procedurepreviously provided in the Habitat Unit Survey. Placing the method in the general manual formatfacilitates the refinement, expansion, and access of those methods for other surveys requiring dischargemeasurements, Research into the previous discharge measurement procedure did not provide cleardocumentation or scientific basis for reducing the number of measurement stations from the USGSminimum of 25 to the recommend 15-20. USGS does state that on smaller streams the number can bereduced, but this is a very subjective call. An attempt was made to improve the decision-making processfor justifying a smaller number, but ultimately this is letI to the discretion ofthe cooperator. A minimumaveraged velocity criteria per measurement station has also been added to meet USGS standards, Theseand other specific refinements are listed below.
1. . Refined method section. Refined minimum number measurement station criteria to meet USGS standards. New minimum averaged velocity criteria to meet USGS standards
2. New appendix section. New Form 7.0 and refined Form 7.1l New completed examples of Forms 7.0 and 7.1. New standard field and vehicle gear checklist. New USGS float and volumetric measurement technique
Stream Temperature Survey
Results oftraining sessions and discussions with WDOE water quality personnel showed a need forrefinements to the study design, calibration, method, and appendix sections ofthe Stream TemperatureSurvey manual. The study design section has been refined to reflect the temperature station and thermalreach format, guidelines for determining monitoring parameters, and selecting temperature recordinginstruments. The calibration section has been refined to meet the needs of the newer generation of dataloggers, The method section replaces the Level I method with the temperature station data collectionprocedure and the Level 2 and 3 methods with the optional thermal reach data collection section, Thethermal reach data collection section refines procedures to follow other current survey methods forparameter measurements such as bankfull width and depth. The thermal reach riparian zonecharacterization procedures were refined and expanded to follow Watershed Analysis methods. These andother specific refinements are listed below.
1, Refinement and expansion of study design section2. Refinement of temperature instrument calibration section3. Refined method section
. Replaced Level I method with thetemperature station data collection procedure; refined installation, documentation, periodic fieldcheck, and removal techniques
. Replaced Level 2 and 3 methods with theoptional thermal reach data collection procedure; refined bankfull width and depth, wetted widthand depth, and canopy closure procedures to follow 1998 Reference Point Survey methods;Refined and expanded riparian management zone characterization
4. Refined appendix section
A-S

. Dropped previous Form 8.0, calibration worksheet for thermographs, previous Form 8. 1,max/min temperature worksheet, and canopy closure field worksheet
l New Forms 8.0, 8. IL, 8. IM, 8.2, 8.2L, 8.2M, 8.3, and 8.3R. New completed examples of Forms 8.0, 8. IL, 8. IM, 8.2, 8.2L, 8.2M, 8.3, and 8.3R. New standard field and vehicle gear checklist. New data management examples. Revised and expanded Washington State Water Quality Standards Classification List. New Sullivan et al., 1990 stream gradient measurement method
Salmonid Spawning Gravel Composif ion Survey
Results of QA reviews and experience from the 1996 shovel/McNeil test project showed a need for a fewrefinements to the method and appendix sections of the Salmonid Spawning Gravel Composition Surveymanual, The gravel patch identification and inventory procedure was completely changed based onresearch and development of criteria for the Salmonid Spawning Habitat Availability Survey. A newtransect strategy was developed with assistance from a NWIFC biometrician for estimating the samplepopulation of gravel patches. The sample population strategy has been refined to include all riffle crestsand gravel patches that have at least one estimated sample. Sample point identification has been refined inthe collection section to replace the old one-half/two-thirds technique with a quick calculation criteria. Toreduce the weight of sample buckets for removal from the field, a decanting technique has been added,These and other specific refinements are listed below.
1, Refined method section. Refined and expanded section structure into pre-method, method, and post method tasks. Refined and expanded riffle crest identification and inventory procedure. New gravel patch identification and inventory procedure. New sample population identification procedures*Refined and expanded sample collection section including a new sample point identification and
sample bucket decanting techniques2 . Refined and expanded appendix section
l Restructure and refinement of field forms: new Form 6.0, old 6.0 = new 6. 1, old 6.1 = new 6.2,and old 6.2 = new 6.3
l New completed examples of Forms 6.0, 6.1, 6.2, and 6.3l New standard field and vehicle gear checklistl New sample tracking slip refines previous labels for sample buckets. New data management examplesl Refined random number table
Salmonid Spawning Habitat Availability Survey
The results oftraining sessions and cooperator feedback showed that refinements were needed to themethod and appendix sections of the Salmonid Spawning Habitat Availability Survey manual. Severalrefinements were made to reflect changes in other surveys such as bankfull width measurement and patchboundary identification techniques following current Reference Point and Habitat Unit Survey methods.A new patch/sub-patch system has been implemented to track patch connectivity while providing the
A - 6

highest surface area measurement accuracy. Measurement of the wetted channel surface area has beengiven its own procedures section and field form. These and other specific refinements are listed below.
1. Refined method sectionl Refined tranesect survey. BankfUll width measurement to follow 1998 Reference Point Survey methods. Refined identification and new lumping rules for size class boundaries. New SHA patch survey replaces previous spawning habitat patch survey (Part 3). New patch/sub-patch identification technique. Refinement of patch boundary and surface area measurement techniques to follow 1999 Habitat
Unit Survey methodsl New wetted channel width measurement procedure
2. Refined and expanded appendix section. New Forms 9.0 and 9.3; refined Forms 9.1,9.2. New completed examples ofForms 9.0, 9.1,9.2, and 9.3. New SHA field code sheet. New standard field and vehicle gear checklist. New data management examples
Salmonid Spawning Grmjel Scour Swvey
The results of training sessions and cooperator feedback showed that manual refinements were neededmade to the method and appendix sections of the Salmonid Spawning Gravel Scour Survey manual.Specific refinements are listed below.
1. New monitoring approach, products, and cooperator services sub-sections2. Refined and expanded study design section3. New equipment calibration section4. Refined method section for greater clarity5. Refined and expanded appendix section
. New Form 10.0 and refined Forms 10.1, 10.2,10.3, and 10.4l New completed examples ofForms 10.0, 10.1, 10.2,10.3, and 10.4. New standard field and vehicle gear checklistl New data management examples
A-7

APPENDIX B. TFW-EMEP EFFECTIVENESS MONITORING INFORMATION BANK
IntroductionThe TFW effectiveness monitoring and evaluation program encourages TFW cooperators across the stateto generate comparable monitoring information. A means to collect, organize and store this informationand make the results available to TFW cooperators for use in adaptive management is needed. The TFWEffectiveness Monitoring Information Bank is designed to meet this need.
OverviewThe TFW Effectiveness Monitoring Information Bank (IBank) is a system for organizing and storinginformation on the effectiveness of forest practices in protecting aquatic resources and making it availableto TFW cooperators for adaptive management purposes. IBank supports adaptive management by:l Providing access to effectiveness information for TFW cooperators, field managers, and prescription
teams for use in designing effective’forest practices, restoration measures, and management systems.. Assembling information From many sites and cooperators for use by the TFW adaptive management
group and TFW policy committee in the formal TFW adaptive management process to improveaquatic resource protection throughout the state.
Information is contributed to IBank by CMER-sponsored projects, TFW cooperators, and otherparticipating organizations. The type of information contributed to IBank includes effectivenessmonitoring survey data and reports that present results and conclusions that address effectivenessmonitoring questions identified in the TFW Effectiveness Monitoring and Evaluation Plan. Projectscontributing information to IBank are screened to ensure that MAG guidelines for study design, datacollection, data analysis, and data interpretation have been met. This ensures the comparability ofinformation and consistency in evaluation and interpretation of results. Incoming survey data is stored inthe existing AMBSYS database system, while reports are stored in electronic format. Xnformation isorganized by topic area, and sorted into categories based on the type of practice or management systemand physical setting (situational category). This system of organization allows information to beaccumulated for regional and statewide analysis by topic area and situation, and for results to beextrapolated to similar situations. TFW cooperators and interested parties query IBank through aninternet interface that is accessed from the user’s personal computer. The query capability lets the usersort and select data or reports by attributes such as topic area, situational category, type of survey, orgeographic location. The system of situational categories allows users to quickly identify and retrieverelevant information from similar situations. Products available as outputs from IBank include:l Monitoring survey data (unanalyzed data).
l Survey summary reports (data with basic calculation performed).. Effectiveness monitoring project reports (results and conclusions from individual monitoring
projects).l Topic area summary reports (summaries of the results of many projects by topic area and situational
category).
Description of IBank System Components
IBank consists of a data input and storage system, data access and query options, and outputs (Figure 1).
Inout and Storage of Information. The following section describe how monitoring survey data andeffectiveness monitoring reports are stored in the IBank system.
B-l

Monitoring Survey Data. Monitoring survey data is housed in an Oracle database at NWIFC. Thedatabase, known as AMBSYS, is designed to store TFW monitoring data. Monitoring survey dataproduced by TFW cooperators and TFW Monitoring Program staff is input into the database viaspreadsheets or an Access database application. Data is error checked by cooperators and screened byTFW monitoring program staff for accuracy and compatibility before input into the AMBSYS database.A Powerbuilder application is used to process data, maintain and query the database, perform standardcalculations and generate survey data summary reports.
EffectivenessMonitoring Reports. Two types of reports are stored in IBank, reports presenting the resultsof individual monitoring projects and reports that summarize results of two or more projects for aparticular topic area. TFW Monitoring Program staff or TFW cooperators produce reports on monitoringprojects. Reports summarizing results of various projects by topic area are produced by TFW monitoringprogram staff under guidance of MAG. Reports under go review by CMERJMAG prior to being acceptedinto IBank. Electronic versions of reports are stored on the server connected with the TFW Monitoringweb page. Hard copies of reports are kept on file with the TFW Monitoring Program at NWIFC and theDNR Forest Practices Division. Backup copies of reports on disk are kept at both these locations.
Information Access and Guerv Ootions. Users can to identify and access information they need fromIBank either via the internet through the NWIFC web site or by requesting lists of information from theTFW Monitoring Program.
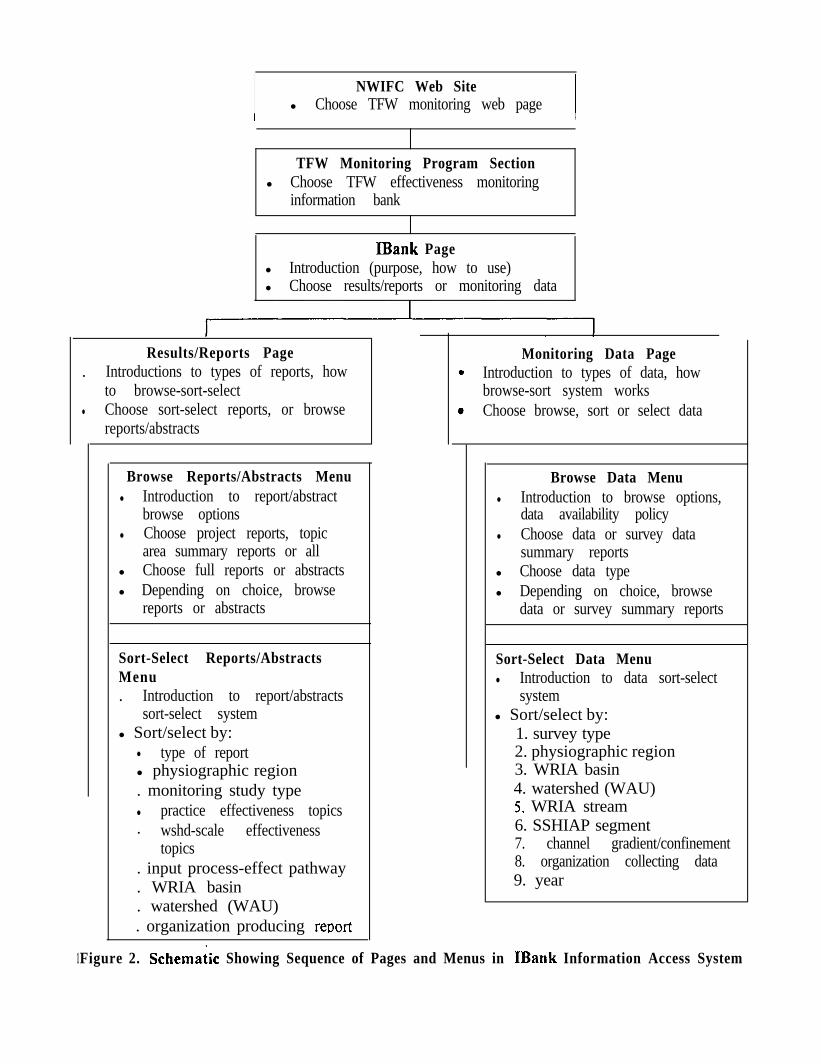
Internet access. The main access to IBank is through TFW monitoring area of the NWIFC web site athttp://www.nwifc.wa.gov. The IBank section of the TFW monitoring area provides an introduction toIBank and a tabular menu system that allows users to browse, sort, select and download information(Figure 2). Reports can be sorted by topic area, location or other situational criteria and downloadeddirectly from the web page. Survey data can be sorted by survey data type, location, date, source, andother criteria. A map-oriented system that allows users to point and click on maps of stream systems toselect various types of data is being planned for the Salmon and Steelhead Inventory and AssessmentProgram (SSHIAP) area of the NWIFC. A link to SSHIAP area will be developed for those interested ina map-oriented data selection option. SSHIAP will develop a GIS layer showing the location of TFWmonitoring surveys. Users will be able to select TFW effectiveness monitoring data of interest using thissystem. The SSHIAP map-oriented data selection system will be linked to IBank and the AMBSYSdatabase to provide access to TFW effectiveness monitoring information selected.
Lists ofinjormation. An alternative access route for those without Internet access consists of listsdescribing the effectiveness monitoring reports and monitoring survey data in available in IBank. Usersidentify information of interest on the list and call, fax, mail or email requests for effectivenessmonitoring information of interest to TFW monitoring program.
Outout Ontions. Survey data and survey data summary reports are available for downloading through theIBank section of the NWIFC web site. The data in IBank is available to any interested party, except whenthe cooperators contributing the data request that permission be obtained from them before data isreleased. Survey data without restrictions can be downloaded directly, as can data summary reports forthose surveys. Copies of survey data are also available on floppy disk or via email from the TFWmonitoring program at NWIFC. Data requiring permission is shown on the survey list, but is notavailable for viewing or downloading. This data is sent via disk or email once permission has beenobtained. Hard copies of data summary reports are also available from NWIFC. Effectivenessmonitoring reports can be browsed or downloaded directly from the web site. Paper copies ofeffectiveness monitoring reports are available from the TFW monitoring program and the DNR forestpractices division.
B-2

I 1 I I I 1
Information Access and Query Options Information Storage Output Options
NWIFC Web Site
TFW Monitoring Program IBankSection
Data browse-sort-select menu system
TFW Monitoring Program IBank. EMReports. Abstracts
TFW Monitoring Database (AMBSYS)
Download From TFW MonitoringProgram IBank
Effectiveness Mon. Reportsl Project Reportsl EM topic area sum reportse Abstracts
I
Oracle database (tables organized D a t aby survey type) l Data
Survey summary reports (generatedl Data Swey Reports
in Powerbuilder)
iSSHIAP Page
I , 1l Map Orienlcd, Point and Click ’ SSKIAP Database
Data Selection System----I . D a t a
Segment database l Data Survey Reports
GIS layer GIS coverage of monitoringsurvey locations
Paper Copies Stored at TFWMonitoring Program
rI
- . EMProjectReports. EM Topic Area Sum. Reportsl Survey summary reports
Paper Copy Lists of Reports and Surveys- l Distributed by TFW Monitoring Program
I I II 1
Mailed or Faxed From TFWMonitoring Program. EMreports. Data survey summary reportsl Data on floppy disk
I
Paper Copies Stored at DNR ForestPractices Division
Mailed From DNR Forest PracticesDivision
. EM Project Reports
. EM Result Summariesl EMreporls
Figure 1. Schematic showing linkages between the IBank information access options, the IDank information storage system, and outputs.
1
I NWIFC Web Sitel Choose TFW monitoring web page
TFW Monitoring Program Sectionl Choose TFW effectiveness monitoring
information bank
IBank Pagel Introduction (purpose, how to use)l Choose results/reports or monitoring data
Results/Reports Page Monitoring Data Page. Introductions to types of reports, how * Introduction to types of data, how
to browse-sort-select browse-sort system worksl Choose sort-select reports, or browse * Choose browse, sort or select data
reports/abstracts
Browse Reports/Abstracts Menul Introduction to report/abstract
browse optionsl Choose project reports, topic
area summary reports or alll Choose full reports or abstractsl Depending on choice, browse
reports or abstracts
Browse Data Menul Introduction to browse options,
data availability policyl Choose data or survey data
summary reportsl Choose data typel Depending on choice, browse
data or survey summary reports
Sort-Select Data MenuSort-Select Reports/AbstractsMenu. Introduction to report/abstracts
sort-select systeml Sort/select by:
l type of reportl physiographic region. monitoring study typel practice effectiveness topics. wshd-scale effectiveness
topics. input process-effect pathway. WRIA basin. watershed (WAU). organization producing report
Figure 2. Schemaiic Showing Sequence of Pages and Menus in IBank Information Access System
l Introduction to data sort-selectsystem
l Sort/select by:1. survey type2. physiographic region3. WRIA basin4. watershed (WAU)5. WRIA stream6. SSHIAP segment7. channel gradient/confinement8. organization collecting data9. year