progress report on iaea dust crp: statistics on dusts in kstar, … · 2012-02-16 · 3 suk-ho...
TRANSCRIPT

Progress Report on IAEA Dust CRP: Statistics on dusts in KSTAR, Dust transport and removal
experiments in TReD
Suk-Ho Hong
With contribution of Kyung-Rai Kim, Hun-Jae Park, Soon-Gook Cho, Eun-Kyung Park, Woong-Chae Kim, Tae-Hyep Rho, Suk-Jae Yu, Kyu-Sun Chung
cEps

2 Suk-Ho Hong, IAEA dust CRP, 2011.11.30. Vienna, Austria
Ⅰ
Ⅱ
Ⅲ
Procedures for IAEA dust database
Dust sampling in KSTAR
Ⅳ Some statistics on dusts in KSTAR
Ⅴ CDG & TReD Experiments
Ⅵ Summary
Validation of the methods and procedures
3 Suk-Ho Hong, IAEA dust CRP, 2011.11.30. Vienna, Austria
Ⅰ. Procedures for IAEA dust database
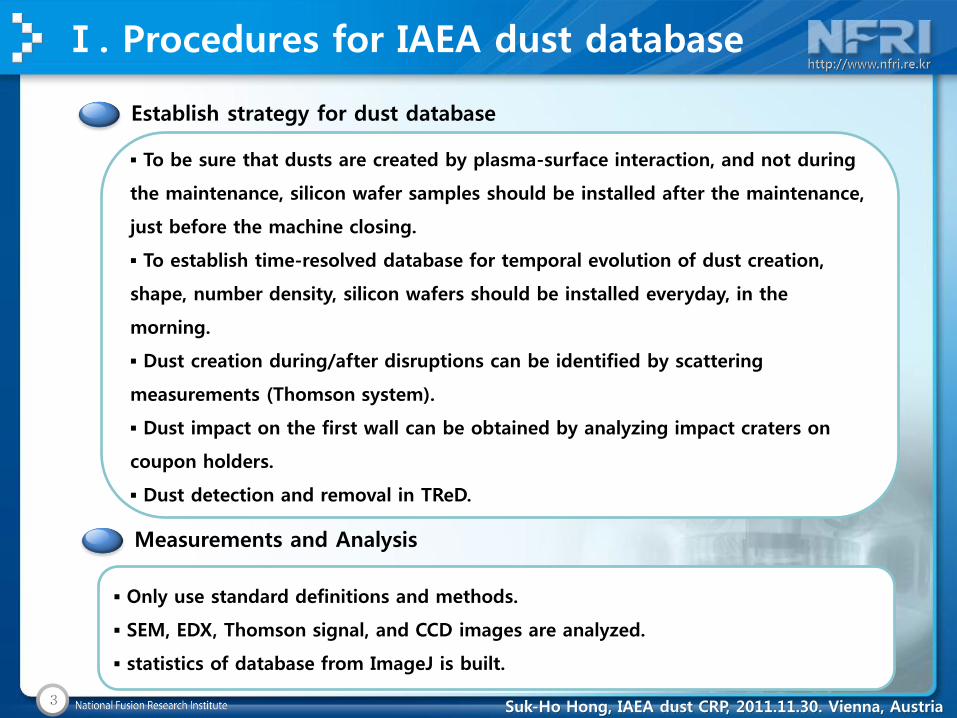
▪ To be sure that dusts are created by plasma-surface interaction, and not during
the maintenance, silicon wafer samples should be installed after the maintenance,
just before the machine closing.
▪ To establish time-resolved database for temporal evolution of dust creation,
shape, number density, silicon wafers should be installed everyday, in the
morning.
▪ Dust creation during/after disruptions can be identified by scattering
measurements (Thomson system).
▪ Dust impact on the first wall can be obtained by analyzing impact craters on
coupon holders.
▪ Dust detection and removal in TReD.
Establish strategy for dust database
Measurements and Analysis
▪ Only use standard definitions and methods.
▪ SEM, EDX, Thomson signal, and CCD images are analyzed.
▪ statistics of database from ImageJ is built.

4 Suk-Ho Hong, IAEA dust CRP, 2011.11.30. Vienna, Austria
Ⅱ. Validation of Methods and Procedures
Standard Parameters
▪ Shape description depends strongly on magnification (minimum pixel size), brightness & contrast (edge structure). ▪ Observation area by SEM has to be large enough to get reliable number density of dusts, but not so large to get correct shape description. ▪ Pixel threshold should be defined to show clear edge of dusts with minimum number of “1 pixel”. ▪ Size threshold should be defined to detect dusts correctly, not “noise” due to contrast (e.g., larger than 4 pixels).
x500 x1000 x5000
588 nm/pixel 293 nm/pixel 75 nm/pixel
5 Suk-Ho Hong, IAEA dust CRP, 2011.11.30. Vienna, Austria
Ⅱ. Validation of Methods and Procedures
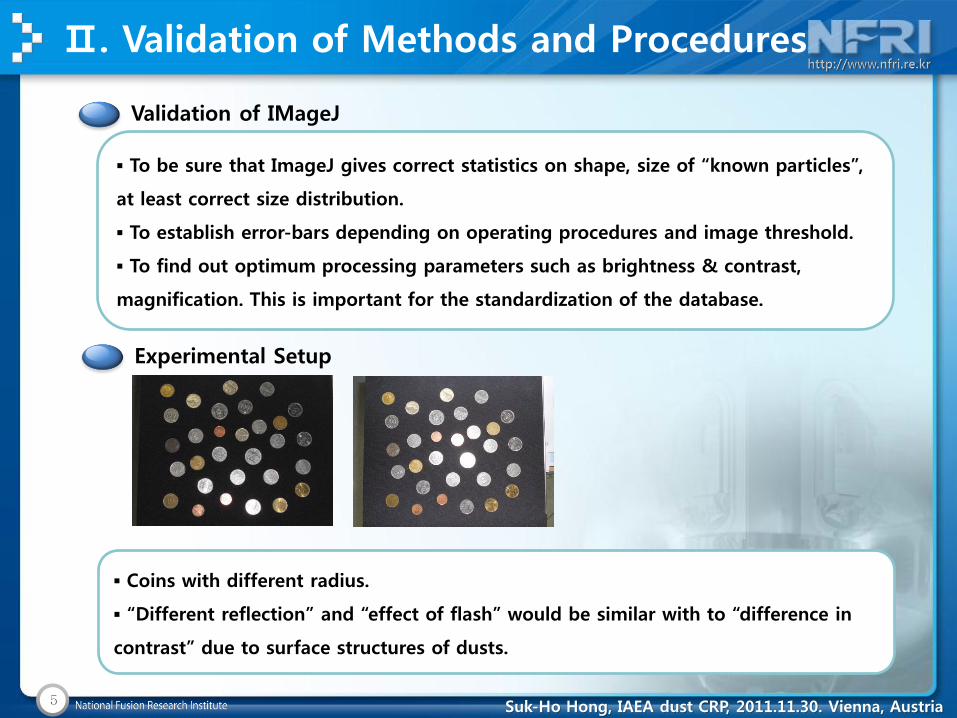
▪ To be sure that ImageJ gives correct statistics on shape, size of “known particles”,
at least correct size distribution.
▪ To establish error-bars depending on operating procedures and image threshold.
▪ To find out optimum processing parameters such as brightness & contrast,
magnification. This is important for the standardization of the database.
Validation of IMageJ
Experimental Setup
▪ Coins with different radius.
▪ “Different reflection” and “effect of flash” would be similar with to “difference in
contrast” due to surface structures of dusts.

6 Suk-Ho Hong, IAEA dust CRP, 2011.11.30. Vienna, Austria
Ⅱ. Validation of Methods and Procedures
IMageJ testing procedure
original Grayscale
Applying threshold Measurement
7 Suk-Ho Hong, IAEA dust CRP, 2011.11.30. Vienna, Austria
Ⅱ. Validation of Methods and Procedures
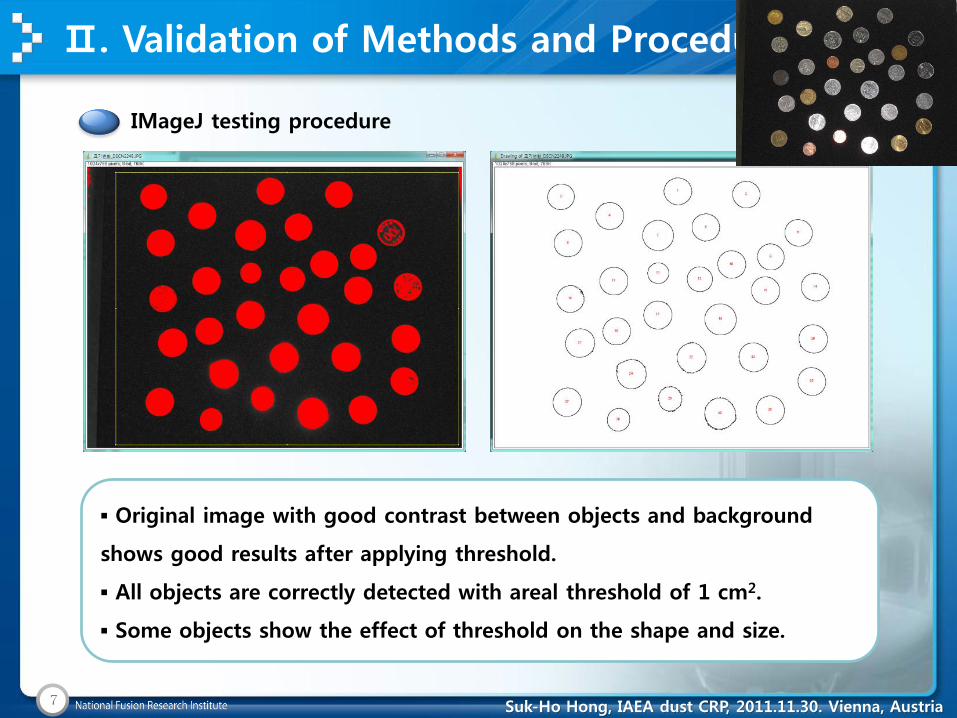
IMageJ testing procedure
▪ Original image with good contrast between objects and background
shows good results after applying threshold.
▪ All objects are correctly detected with areal threshold of 1 cm2.
▪ Some objects show the effect of threshold on the shape and size.

8 Suk-Ho Hong, IAEA dust CRP, 2011.11.30. Vienna, Austria
0 1 2 3 4 5 6 7 80
1
2
3
4
5
6
7
8
9
10
11
12
13
14
15
16
17
18
19
20
size (cm2)
Cou
nt
Ⅱ. Validation of Methods and Procedures
IMageJ testing procedure
▪ Similar results.
▪ Due to imperfection of edge structure of the objects, there is some
errors in measurements.
0 1 2 3 4 5 6 7 80
1
2
3
4
5
6
7
8
9
10
11
12
13
14
15
16
17
18
19
20
500
100
10
50
10
Co
un
t
size (cm2)
Exact histogram Measured histogram
9 Suk-Ho Hong, IAEA dust CRP, 2011.11.30. Vienna, Austria
Ⅱ. Validation of Methods and Procedures
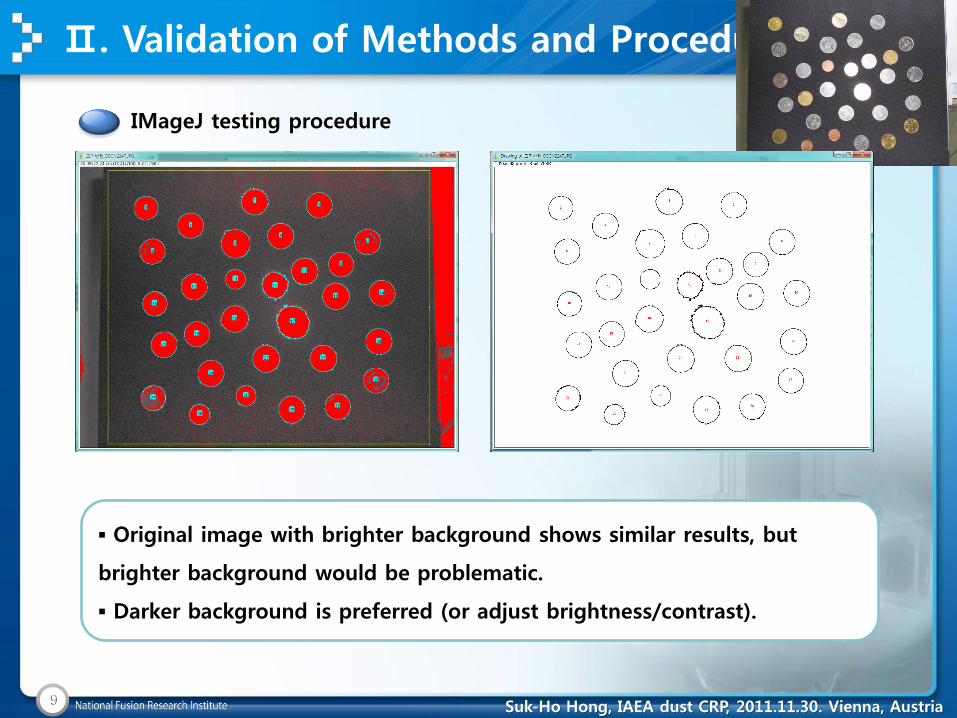
IMageJ testing procedure
▪ Original image with brighter background shows similar results, but
brighter background would be problematic.
▪ Darker background is preferred (or adjust brightness/contrast).

10 Suk-Ho Hong, IAEA dust CRP, 2011.11.30. Vienna, Austria
0 1 2 3 4 5 6 7 80
1
2
3
4
5
6
7
8
9
10
11
12
13
14
15
16
17
18
19
20
Cou
nt
size (cm2)
Ⅱ. Validation of Methods and Procedures
IMageJ testing procedure
▪ Similar results.
▪ Due to imperfection of edge structure of the objects, there is some
errors in measurements (shifted towards smaller size).
0 1 2 3 4 5 6 7 80
1
2
3
4
5
6
7
8
9
10
11
12
13
14
15
16
17
18
19
20
500
100
10
50
10
Co
un
t
size (cm2)
Exact histogram Measured histogram

11 Suk-Ho Hong, IAEA dust CRP, 2011.11.30. Vienna, Austria
Ⅲ. Dust sampling in KSTAR
▪ Daily samples on silicon wafer by deposition probe system.
▪ Campaign integrated samples on silicon wafer at vertical K port.
▪ Vacuumed dust samples from divertor region after the campaign.
▪ Samples detached by carbon tapes.
Dust sampling in KSTAR
40 cm
10 cm

12 Suk-Ho Hong, IAEA dust CRP, 2011.11.30. Vienna, Austria
Ⅱ. Validation of Methods and Procedures
Dust database from IMageJ
▪ ImageJ gives inputs for IAEA dust database.
▪ Size, number density, and shape descriptor(circularity, roundness, elongation)
were further analyzed.
▪ Temporal evolution of dust size, shape, number density are obtained.
▪ Chemical composition is analyzed by EDX.
▪ standard magnification: x1000 (0.293 um/pixel) or x5000 (0.075 um/pixel).
▪ Threshold for detection: 5 pixels - infinity
13 Suk-Ho Hong, IAEA dust CRP, 2011.11.30. Vienna, Austria
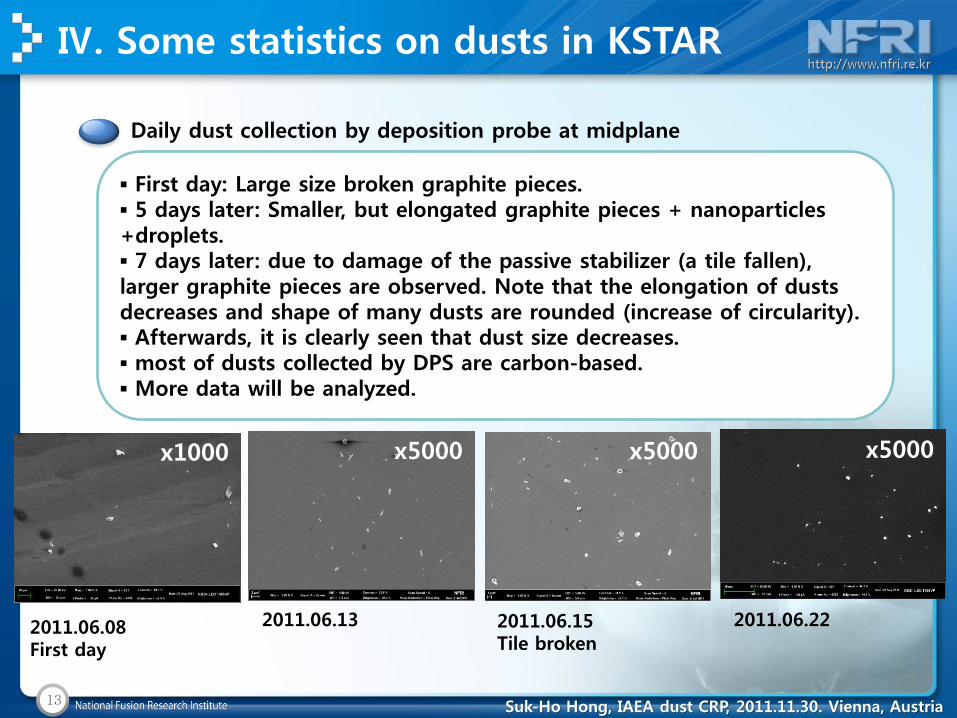
▪ First day: Large size broken graphite pieces. ▪ 5 days later: Smaller, but elongated graphite pieces + nanoparticles +droplets. ▪ 7 days later: due to damage of the passive stabilizer (a tile fallen), larger graphite pieces are observed. Note that the elongation of dusts decreases and shape of many dusts are rounded (increase of circularity). ▪ Afterwards, it is clearly seen that dust size decreases. ▪ most of dusts collected by DPS are carbon-based. ▪ More data will be analyzed.
Daily dust collection by deposition probe at midplane
Ⅳ. Some statistics on dusts in KSTAR
2011.06.08 First day
2011.06.13 2011.06.15 Tile broken
x1000 x5000 x5000 x5000
2011.06.22

14 Suk-Ho Hong, IAEA dust CRP, 2011.11.30. Vienna, Austria
▪ Mean occupied area decreases while the number density increases. ▪ Mean circularity and elongation increase as a function of time (definition of elongation in ImageJ!) more and more rounded. ▪ Mean roundness is about ~0.5.
Daily dust collection
Ⅳ. Some statistics on dusts in KSTAR
May 31 Jun 14 Jun 28 Jul 12 Jul 26 Aug 9 Aug 23 Sep 60
5
10
15
20
25
30
m
ea
n a
rea
(m
2)
date
May 31 Jun 14 Jun 28 Jul 12 Jul 26 Aug 9 Aug 23 Sep 60.0
5.0x10⁵
1.0x10⁶
1.5x10⁶
2.0x10⁶
2.5x10⁶
pa
rtic
le n
um
be
r /c
m2
date
May 31 Jun 14 Jun 28 Jul 12 Jul 26 Aug 9 Aug 230.0
0.1
0.2
0.3
0.4
0.5
0.6
0.7
0.8
0.9
1.0
mean circularity
mean roundness
mean elongation
me
an
va
lue
date

15 Suk-Ho Hong, IAEA dust CRP, 2011.11.30. Vienna, Austria
2011.06.15 9:44 camera - Tile OK.
2011.06.15 17:45 camera - A tile was fallen at upper passive plate.
2011.06. 15 17:42 last plasma of the day - camera stopped before the plasma termination. - Heavy disruption shot.
Ⅳ. Some statistics on dusts in KSTAR
16 Suk-Ho Hong, IAEA dust CRP, 2011.11.30. Vienna, Austria
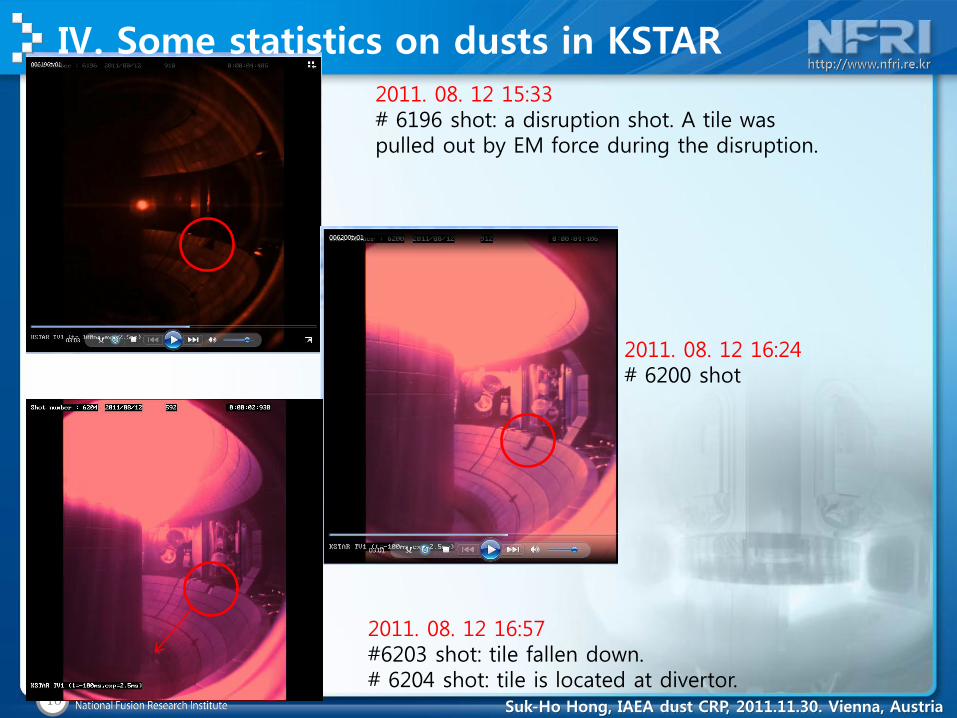
2011. 08. 12 15:33 # 6196 shot: a disruption shot. A tile was pulled out by EM force during the disruption.
2011. 08. 12 16:57 #6203 shot: tile fallen down. # 6204 shot: tile is located at divertor.
2011. 08. 12 16:24 # 6200 shot
Ⅳ. Some statistics on dusts in KSTAR

17 Suk-Ho Hong, IAEA dust CRP, 2011.11.30. Vienna, Austria
▪ Small size particles have more rounded shape, while larger particles have low circularity (not round+complex edge structures). ▪ Mean circularity and elongation decrease as a function of radius. ▪ Particle number density as a function of radius decreases exponentially.
Daily dust collection
Ⅳ. Some statistics on dusts in KSTAR
0.0 0.5 1.0 1.5 2.0 2.50.0
0.1
0.2
0.3
0.4
0.5
0.6
0.7
0.8
0.9
1.0
m
ea
n v
alu
e
mean effective radius (um)
mean circularity
mean roundness
mean elongation
0.0 0.5 1.0 1.5 2.0 2.5
0.0
5.0x10⁵
1.0x10⁶
1.5x10⁶
2.0x10⁶
pa
rtic
le n
um
be
r d
en
sity/c
m2
mean effective radius (um)

18 Suk-Ho Hong, IAEA dust CRP, 2011.11.30. Vienna, Austria
▪ large portion of dusts are rounded, so “effective radius” of dusts is calculated assuming surface area and volume have simple relation. ▪ Most of dusts have effective radius in the range between 0.075-3 um, peak @ 0.115 um. Total mass of dusts (extrapolated) during the analyzed period is ~122 mg (average ~7mg/day).
Daily dust collection
Ⅳ. Some statistics on dusts in KSTAR
0 1 2 3 4 5 6 7 8 9 100
50
100
150
200
250
co
un
t
effective radius (m)
0.0 0.2 0.4 0.6 0.8 1.00
100
200
co
un
t
mean circularity
0.0 0.1 0.2 0.3 0.4 0.5 0.6 0.7 0.8 0.9 1.00
50
100
150
200
250
300
350
400
co
un
t
mean elongarion
0.0 0.1 0.2 0.3 0.4 0.5 0.6 0.7 0.8 0.9 1.00
200
400
co
un
t
mean roundness
19 Suk-Ho Hong, IAEA dust CRP, 2011.11.30. Vienna, Austria
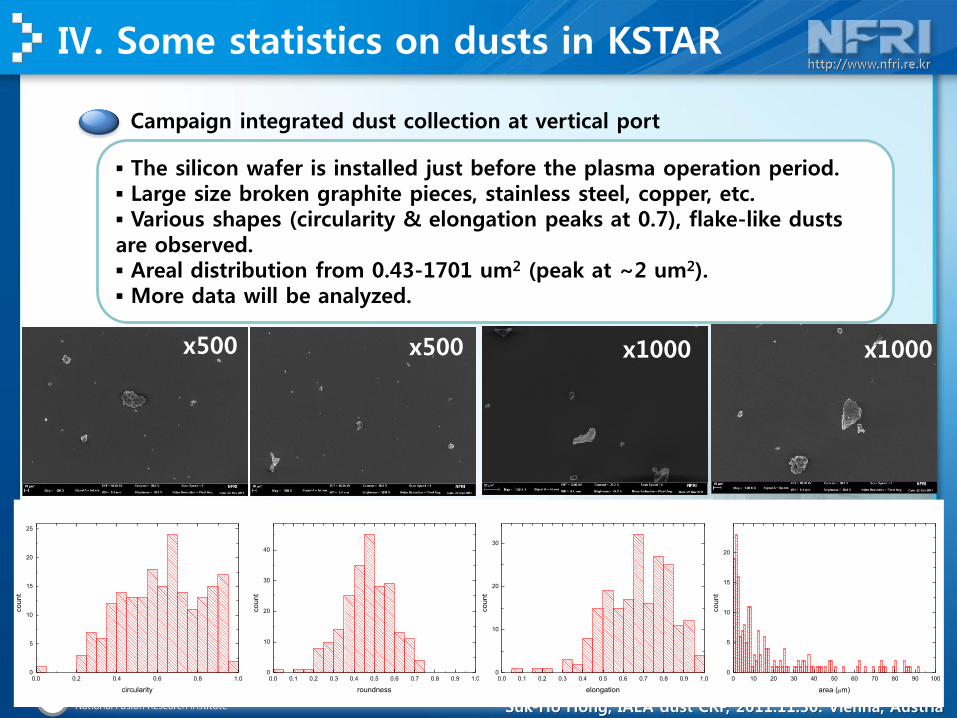
▪ The silicon wafer is installed just before the plasma operation period. ▪ Large size broken graphite pieces, stainless steel, copper, etc. ▪ Various shapes (circularity & elongation peaks at 0.7), flake-like dusts are observed. ▪ Areal distribution from 0.43-1701 um2 (peak at ~2 um2). ▪ More data will be analyzed.
Campaign integrated dust collection at vertical port
Ⅳ. Some statistics on dusts in KSTAR
x1000 x1000 x500 x500
0.0 0.1 0.2 0.3 0.4 0.5 0.6 0.7 0.8 0.9 1.00
10
20
30
40
co
un
t
roundness
0.0 0.2 0.4 0.6 0.8 1.00
5
10
15
20
25
co
un
t
circularity
0.0 0.1 0.2 0.3 0.4 0.5 0.6 0.7 0.8 0.9 1.00
10
20
30
co
un
t
elongation
0 10 20 30 40 50 60 70 80 90 1000
5
10
15
20
co
un
t
area (m)

20 Suk-Ho Hong, IAEA dust CRP, 2011.11.30. Vienna, Austria
▪ Standard magnification of x1000, x5000
▪ Standard brightness and contrast (cont ~30, brightness ~50).
▪ 2 TIF pictures (SEM original+outlined picture from ImageJ).
▪ ImageJ output file with ImageJ format+EDX included.
▪ Machine & campaign information.
▪ Numbering of dusts is underway because of identification of particles
by eyes, and match SEM and EDX.
▪ Other input files will be ready.
Input files for IAEA dust database
Ⅳ. Some statistics on dusts in KSTAR
▪ Painful measurement and analysis time (SEM, EDX, etc…).
▪ Matching SEM and ImageJ index.
▪ Inserting EDX data into ImageJ output.
Difficulties
21 Suk-Ho Hong, IAEA dust CRP, 2011.11.30. Vienna, Austria
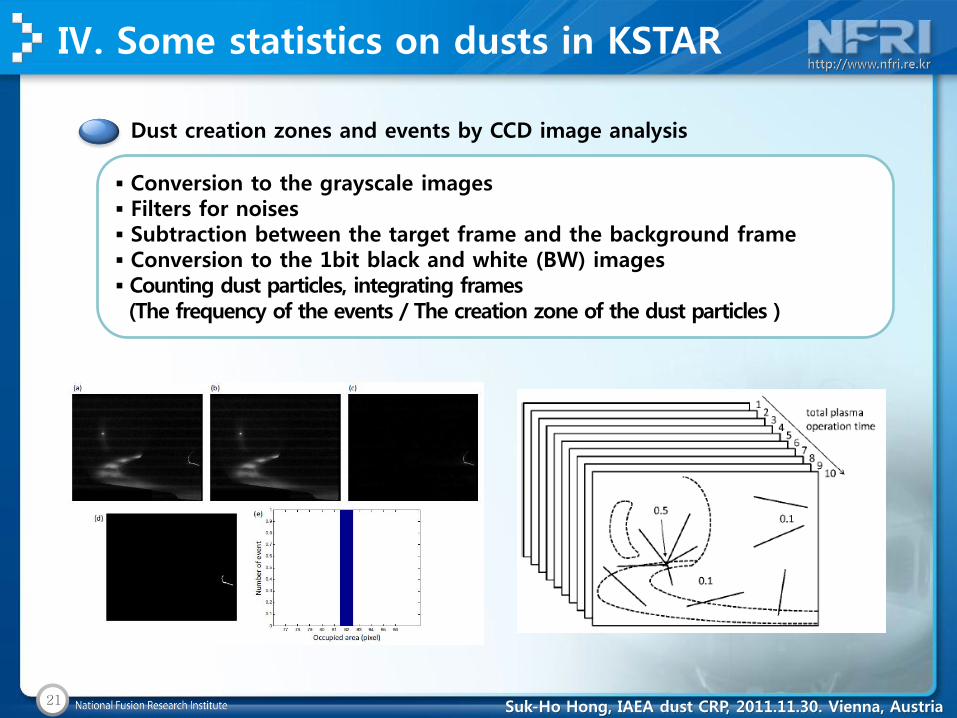
▪ Conversion to the grayscale images ▪ Filters for noises ▪ Subtraction between the target frame and the background frame ▪ Conversion to the 1bit black and white (BW) images ▪ Counting dust particles, integrating frames (The frequency of the events / The creation zone of the dust particles )
Dust creation zones and events by CCD image analysis
Ⅳ. Some statistics on dusts in KSTAR

22 Suk-Ho Hong, IAEA dust CRP, 2011.11.30. Vienna, Austria
Dust creation zones and events by CCD image analysis
Ⅳ. Some statistics on dusts in KSTAR
23 Suk-Ho Hong, IAEA dust CRP, 2011.11.30. Vienna, Austria
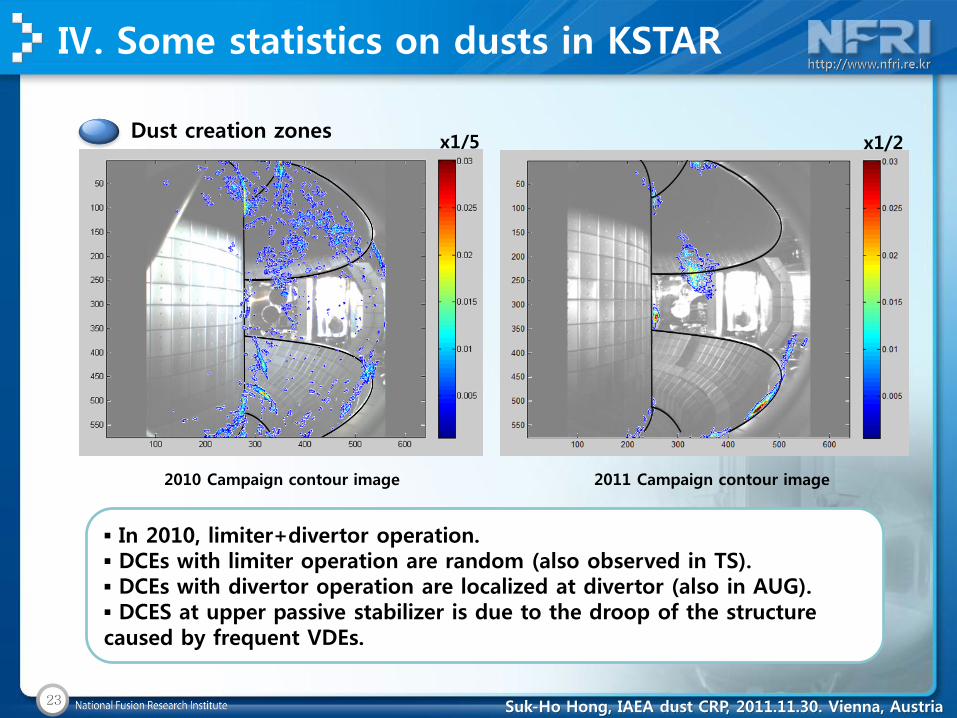
▪ In 2010, limiter+divertor operation. ▪ DCEs with limiter operation are random (also observed in TS). ▪ DCEs with divertor operation are localized at divertor (also in AUG). ▪ DCES at upper passive stabilizer is due to the droop of the structure caused by frequent VDEs.
Dust creation zones
Ⅳ. Some statistics on dusts in KSTAR
x1/5 x1/2
2010 Campaign contour image 2011 Campaign contour image
24 Suk-Ho Hong, IAEA dust CRP, 2011.11.30. Vienna, Austria
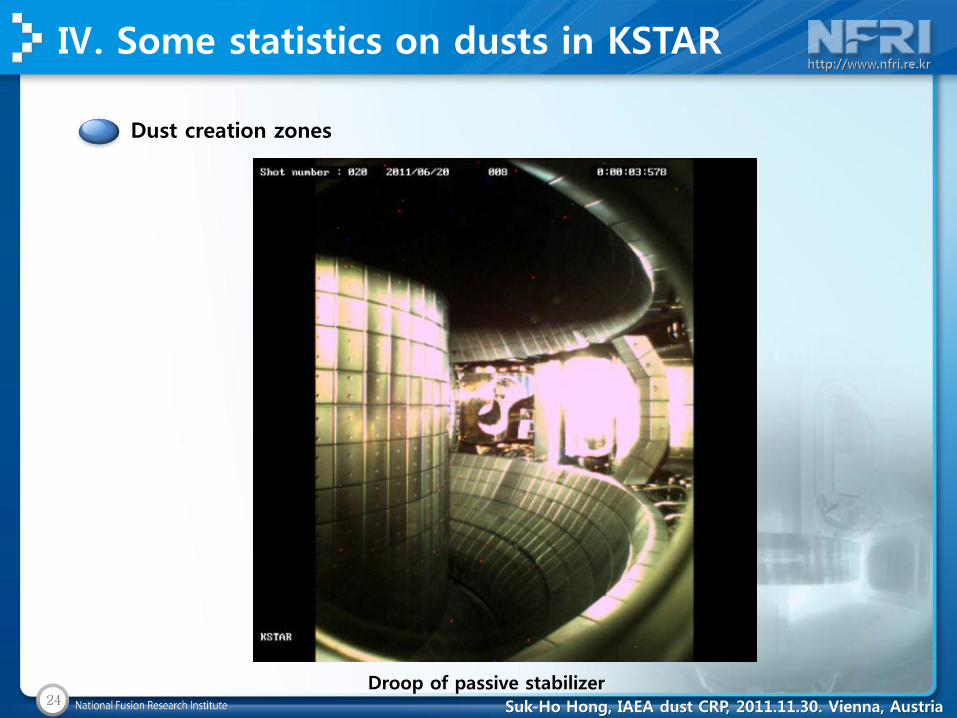
Dust creation zones
Ⅳ. Some statistics on dusts in KSTAR
Droop of passive stabilizer
25 Suk-Ho Hong, IAEA dust CRP, 2011.11.30. Vienna, Austria
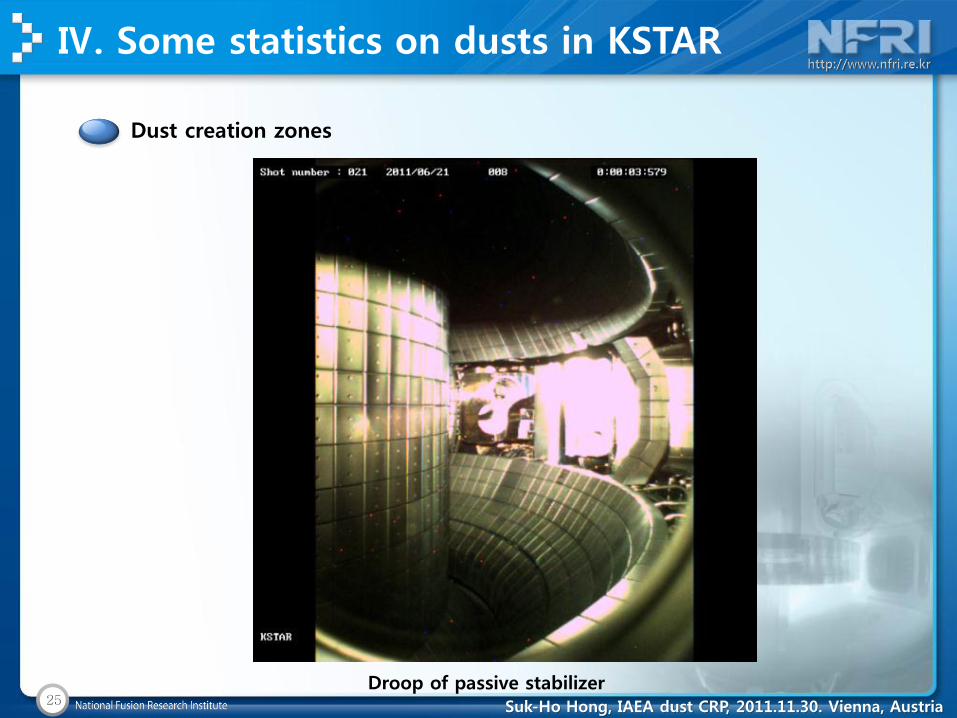
Dust creation zones
Ⅳ. Some statistics on dusts in KSTAR
Droop of passive stabilizer

26 Suk-Ho Hong, IAEA dust CRP, 2011.11.30. Vienna, Austria
Dust creation zones
Ⅳ. Some statistics on dusts in KSTAR
DCEs in Tore Supra CIMES campaign DCEs in AUG 2007 campaign
S. H. Hong et al, Nucl. Fusion 50 (2010) 035002

27 Suk-Ho Hong, IAEA dust CRP, 2011.11.30. Vienna, Austria
Dust creation events during the campaign
Ⅳ. Some statistics on dusts in KSTAR
#3398~3425 #4188~4209 D shaping
Plasma operation time : ~2487s (2010 Campaign)
#3398~3425 #4188~4209 D shaping
Plasma operation time : ~2514s (2010 Campaign)
Plasma operation time : ~6391s (2011 Campaign)
#5074~5099 #5144~5163
#5272~5297 #6172~6204
2010 2011
NEPS 1.8878 2.741
Duration (s) 2543.8s 4316.3s
Number of events per seconds
Range of NEPS in AUG: 0.5-4
28 Suk-Ho Hong, IAEA dust CRP, 2011.11.30. Vienna, Austria
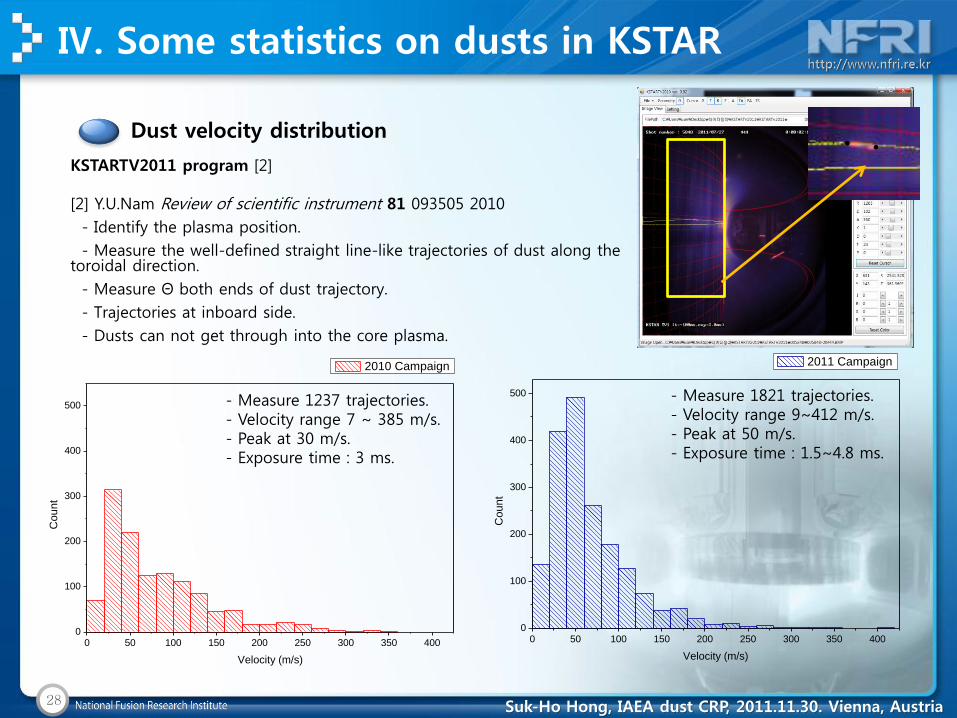
Dust velocity distribution
Ⅳ. Some statistics on dusts in KSTAR
0 50 100 150 200 250 300 350 4000
100
200
300
400
500
2010 Campaign
Cou
nt
Velocity (m/s)
0 50 100 150 200 250 300 350 4000
100
200
300
400
500
Co
un
t
Velocity (m/s)
2011 Campaign
- Measure 1821 trajectories. - Velocity range 9~412 m/s. - Peak at 50 m/s. - Exposure time : 1.5~4.8 ms.
- Measure 1237 trajectories. - Velocity range 7 ~ 385 m/s. - Peak at 30 m/s. - Exposure time : 3 ms.
KSTARTV2011 program [2] [2] Y.U.Nam Review of scientific instrument 81 093505 2010
- Identify the plasma position.
- Measure the well-defined straight line-like trajectories of dust along the toroidal direction.
- Measure Θ both ends of dust trajectory.
- Trajectories at inboard side.
- Dusts can not get through into the core plasma.

29 Suk-Ho Hong, IAEA dust CRP, 2011.11.30. Vienna, Austria
Ⅴ. CDG & TReD Experiments
Dust detection by CDG
▪ We have manufactured circuit suggested by Dr. G. Counsell et al. ▪ We have tested the CDG with suggested settings and parameters. ▪ however, we have best response from CDG with: - second amplifier gain=1. - square wave of 100 kHz (higher impedance of chipset).

30 Suk-Ho Hong, IAEA dust CRP, 2011.11.30. Vienna, Austria
Ⅴ. CDG & TReD Experiments
Dust detection by CDG
G. Counsell et al., EFDA task TW1-TVP/dust

31 Suk-Ho Hong, IAEA dust CRP, 2011.11.30. Vienna, Austria
Ⅴ. CDG & TReD Experiments
Dust detection by CDG
0 1 2 3 4 5 6 7 8 9 10 11 12
-20
-15
-10
-5
0
5
10
15
20
maximum
detectable
mass
2
unloading
(opened symbols)
vo
lta
ge
mass (g)
minimum
detectable
mass
linear response
loading
(closed symbols)
1
signal
saturation
center
▪ Loading/unloading test with deflection at center. ▪ Minimum detectable mass=1g (low detector sensitivity due to low amplification in the range of 0-3 g). ▪ Linear response between 3-5 g (sensitive enough to detect ~mg). ▪ From 5 g, signal is no more valid.

32 Suk-Ho Hong, IAEA dust CRP, 2011.11.30. Vienna, Austria
-2 0 2 4 6 8 10 12 14 16
-20
-15
-10
-5
0
5
10
15
20
vo
lta
ge
(V)
weight(g)
dome type 1
dome type 2
Ⅴ. CDG & TReD Experiments
Dust detection by CDG
Load weights randomly
CDG
Dome type
-2 0 2 4 6 8 10 12 14 16
-20
-15
-10
-5
0
5
10
15
20
vo
lta
ge
(V)
weight(g)
dome type 1
dome type 2
dome type 3
flat type 1
flat type 2
at center
randomly
CDG
Flat type
▪ To get dust weight only at center, “dishes” are tested. ▪ Dome-type shows more reliable measurements even with random deposition of weight. ▪ Care must be taken for the contact between dish and diaphragm. ▪ More test will be done and CDG will be installed at TReD and KSTAR

33 Suk-Ho Hong, IAEA dust CRP, 2011.11.30. Vienna, Austria
Ⅴ. CDG & TReD Experiments
Dust removal by TReD
Dust collector spot
Electrodes (Tri-polar grids)
9mm*450mm
1.2m

34 Suk-Ho Hong, IAEA dust CRP, 2011.11.30. Vienna, Austria
Ⅴ. CDG & TReD Experiments
Dust removal by TReD
▪ Measure CDG response to plasma-transported dusts with known mass. ▪ Measure removal efficiency of dusts.
•Powder : Al2O3, 5um •Base pressure : 2.5 * 10-3 Torr, Only rotary Pump •Operation pressure : 2.5 * 10-1 Torr, MFC 200 SCCM He •RF Power 34W : rf 7W
•Laser : 532nm 100mW
•Used boozer : Piezo Boozer, 1000Hz •Size : Outer diameter Φ29, inner diameter Φ6.5 : Φ27 diaphragm •3 Dispensers, each 100-300mg dusts loaded. •Dispenser operating V : 16~26
Dispenser
•Electrode : no bias potential •Al paper is placed on the electrodes, : 150mm * 150mm
Experimental Setup
35 Suk-Ho Hong, IAEA dust CRP, 2011.11.30. Vienna, Austria
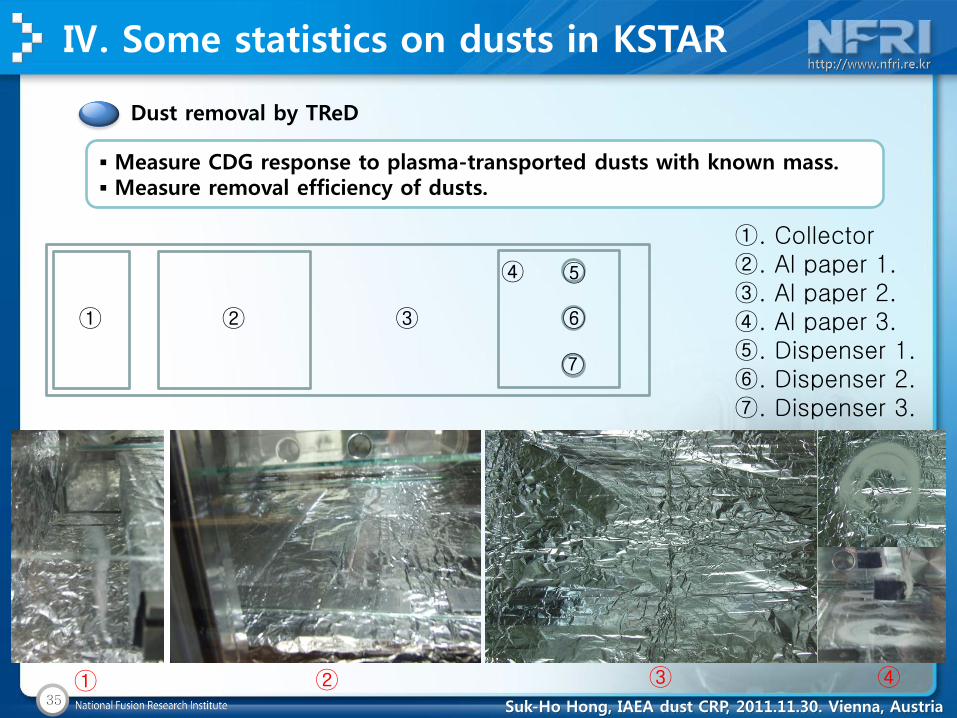
Ⅳ. Some statistics on dusts in KSTAR
Dust removal by TReD
▪ Measure CDG response to plasma-transported dusts with known mass. ▪ Measure removal efficiency of dusts.
•Laser : 532nm 100mW
① ② ③ ④
① ② ③
④ ⑤
⑥
①. Collector ②. Al paper 1. ③. Al paper 2. ④. Al paper 3. ⑤. Dispenser 1. ⑥. Dispenser 2. ⑦. Dispenser 3.
⑦

36 Suk-Ho Hong, IAEA dust CRP, 2011.11.30. Vienna, Austria
Ⅴ. CDG & TReD Experiments
Dust removal by TReD
▪ Measure CDG response to plasma-transported dusts with known mass. ▪ Measure removal efficiency of dusts.
•Laser : 532nm 100mW

37 Suk-Ho Hong, IAEA dust CRP, 2011.11.30. Vienna, Austria
Ⅴ. CDG & TReD Experiments
Dust removal by TReD
•Laser : 532nm 100mW
① ② ③
④ ⑤
⑥
①. Collector ②. Al paper 1. ③. Al paper 2. ④. Al paper 3. ⑤. Dispenser 1. ⑥. Dispenser 2. ⑦. Dispenser 3.
⑦
① ② ③ ④ ⑤ ⑥ ⑦
Before 14.10g 8.80g 8.24g 8.45g 0 0 0
After 14.19g 8.80g 8.25g 9.04g 0.03
remain 0.09g 0g 0.01g 0.59g 0.03
▪ About 10% of dusts (e.g., ~90 mg from 900 mg) reach the collector. ▪ Dust removal efficiency is about 5-10 mg per hour (unoptimized). ▪ Calibrated amount of dusts will be reached the CDG by plasma-transport. ▪ Detection efficiency of CDG will be determined.

38 Suk-Ho Hong, IAEA dust CRP, 2011.11.30. Vienna, Austria
▪ Dusts database for IAEA CRP is built in KSTAR.
▪ Using the information obtained from the database,
some statistics on dusts in KSTAR are obtained.
▪ CDG test and optimization of measurement are on
going, together with TReD experiments.
▪ Dust removal efficiency in TReD is about 5-10 mg per
hour with “unoptimized condition” (total amount of
dusts (extrapolated) collected during the analyzed
period in KSTAR 2011 campaign by DPS is ~122 mg,
average ~7 mg/day).
Ⅵ. Summary