progress report on the implementation of sustainable
TRANSCRIPT


December 2020

Publisher:
Milana Rakića 5, Belgrade Phone: +381 11 2412 922; Fax: +381 2411 260
For Publisher:
Miladin Kovačević, PhD, Director
Author:
Marija Babović, PhD
Editorial Board:
Snežana LakčevićDragana Đoković PapićPetar ĐorićSDG Monitoring Working Group
Proofreading (Serbian):
EVENT Group
Translation (English):
Jelena Marković
Proofreading (English):
Gordana Nedeljković
Design:
Rastko Тoholj
Print:
DMD, Belgrade
Circulation 120 copies
ISBN 978-86-6161-197-1
Printed in 2020
When using data from this publication, be sure to cite the source.
The production of this publication was supported by the Governments of Switzerland and Germany. The publication does not necessarily represent the official standpoints of the Swiss and German Governments.

Progress report on the implementation of Sustainable Development Goals by 2030 in the Republic of Serbia
TABLE OF CONTENTS
Foreword 145
Gratitude 146
Preface 147
SDG 1 151End poverty in all its forms everywhere
SDG 2 157End hunger, achieve food security and improved nutrition and promote sustainable agriculture
SDG 3 163Ensure healthy lives and promote well-being for all at all ages
SDG 4 173Ensure inclusive and equitable quality education and promote lifelong learning opportunities for all
SDG 5 179Achieve gender equality and empower all women and girls
SDG 6 187Ensure availability and sustainable management of water and sanitation for all
SDG 7 193Ensure access to affordable, reliable, sustainable and modern energy for all

Progress report on the implementation of Sustainable Development Goals by 2030 in the Republic of Serbia
SDG 8 197Promote sustained, inclusive and sustainable economic growth, full and productive employment and decent work for all
SDG 9 205Build resilient infrastructure, promote inclusive and sustainable industrialization and foster innovation
SDG 10 209Reduce inequality within and among countries
SDG 11 213Make cities and human settlements inclusive, safe, resilient and sustainable
SDG 12 215Ensure sustainable consumption and production patterns
SDG 15 217Protect, restore and promote sustainable use of terrestrial ecosystems, sustainably manage forests, combat desertification, and halt and reverse land degradation and halt biodiversity loss
SDG 16 221Promote peaceful and inclusive societies for sustainable development, provide access to justice for all and build effective, accountable and inclusive institutions at all levels
SDG 17 227Strengthen the means of implementation and revitalize the Global Partnership for Sustainable Development
Annex 1 The compound annual growth rate calculation methodology 231
Annex 2 Tables 232
Annex 3 Links to SDG Data 279
Annex 4 Progress dashboard towards the Sustainable Development Goals 280

145Progress report on the implementation of Sustainable Development Goals by 2030 in the Republic of Serbia
FOREWORD
I n September 2015, all United Nations member states adopted the 2030 Agenda, which represents a vision of sustainable development and a better, more stable and safer life for all.
The agenda contains short-term and long-term goals and targets in the economic, social and environmental dimensions.
In July 2019, at the United Nations Headquarters in New York, the Republic of Serbia present-ed the first Voluntary National Report on the implementation of the 2030 Agenda for sustain-able development in the Republic of Serbia. The Statistical Office of the Republic of Serbia, to-gether with other data producers, provided data for monitoring the indicators of Sustainable Development Goals and they were presented as a statistical annex to the Voluntary National Report.
The Statistical Office remains consistent in monitoring and providing reliable data necessary to achieve the Sustainable Development Goals for the Republic of Serbia.
Belgrade, December 2020 Director
Miladin Kovačević, PhD

146 Progress report on the implementation of Sustainable Development Goals by 2030 in the Republic of Serbia
GRATITUDE
W e would like to thank Dr. Marija Babovic for successful and fruitful cooperation during the preparation of the Progress report on the implementation of Sustainable Development
Goals by 2030 in the Republic of Serbia, Katja Grbic, who provided technical support on behalf of GIZ on the project, as well as all members SDG Monitoring Working Group.
The members of the Statistical Office SDG Monitoring Working Group are:
Snežana LakčevićVesna PantelićNataša MijakovacJelena PeraćGordana Bjelobrk, MScSunčica Stefanović ŠestićDragana Đoković PapićDušanka DostanićSanja RadonjićMilijana SmiljkovićMilutin RadenkovićMilivoje GrbovićDragana PogarčićPetar ĐorićVesna ZajcMarija VulovićJovanka StojanovićNada Đerić, MScVladica Janković

147Progress report on the implementation of Sustainable Development Goals by 2030 in the Republic of Serbia
PREFACE
T he 2030 Agenda for Sustainable Development and its 17 Sustainable Development Goals (SDGs) adopted by all United Nations member states in September 2015, represent a global
strategic framework for sustainable development all member states and relevant international stakeholders ought to strive to achieve. The 2030 Agenda provides a basis for the vision of de-velopment as sustainable prosperity based on social inclusion and equality, while preserving our planet at the same time. One of the fundamental principles this strategic framework rests upon is that no one will be left behind, namely excluded from development processes and development achievements. Monitoring progress in the implementation of Sustainable Development Goals (SDGs) is an important aspect of the 2030 Agenda for Sustainable Development implementation. The purpose of this report is to, based on the data available in the second half of 2020, illustrate the current status in implementing SDGs. In this way evidence-based foundation for monitoring and further improvement of policies leading to meeting these goals will further be strengthened.
Serbia’s commitment to the 2030 Agenda: mechanisms, policies, processes
The Republic of Serbia has played an active role and demonstrated commitment to the global 2030 Agenda for Sustainable Development back in the period when Sustainable Development Goals were defined, as a member of the Open Working Group on Sustainable Development Goals and Intergovernmental Committee of Experts on Sustainable Development Financing. During the process of national consultations on the Sustainable Development Goals, in the period 2012–2014 Serbian citizens have had an opportunity to state their development priorities and thus influence the global goal-setting process. In the first consultation cycle entitled “Serbia I Want” implemented in the period 2012–2013, apart from the goals outlined in the majority of other countries participating in the consultation process like poverty reduction, decent work opportunities, environmental protection, improved gender equality and other, country-specific goals emerged that belonged to the body of cultural aspects of development, including promoting tolerance, solidarity, establishing peaceful societies based on the rule of law. Due to the fact that the outcomes of consultations in Serbia had pointed out to these important aspects of development, in the second consultation cycle focus was on the relationship between culture and development, and its results have contributed to formulation of SDG 16 envisaging promotion of peaceful and inclusive societies for sustainable development.
Right after the adoption of the 2030 Agenda for Sustainable Development in September 2015, Republic of Serbia started establishing national mechanisms to implement the Agenda. By the end of 2015, Government of the Republic of Serbia had established the Inter-Ministerial Working Group for the Implementation of the United Nations 2030 Agenda for Sustainable Development, composed of high-ranking representatives of 27 line ministries and other institutions, chaired by the Minister in charge of Demography and Population Policy. The tasks of the Inter-Ministerial Working Group included coordination of activities of all relevant ministries in connection with the 2030 Agenda, monitoring its implementation, proposing adoption of the National Sustainable Development Strategy with the financial plan to integrate individual strategies and harmonise efforts to achieve Sustainable Development Goals, proposing statistical monitoring of goals,

148 Progress report on the implementation of Sustainable Development Goals by 2030 in the Republic of Serbia
proposing interim implementation reports and continuously informing the UN representative in Serbia and the UN system.
In addition to this crucial mechanism established under the executive branch at national level, in 2017 Focus Group of the Serbian National Assembly was established to develop oversight mechanisms and oversee the SDG implementation. This mechanism oversees and supports the Development Agenda implementation.
An important aspect of the 2030 Agenda implementation is “localisation” of the Sustainable Development Goals, namely their mainstreaming in local policies. The Standing Conference of Towns and Municipalities plays an important role in this process by coordinating activities of local governments in this direction. Besides the SCTM, other civil society organisations and different initiatives at national and local levels have joined the 2030 Agenda implementation.
A set of steps were undertaken to integrate all 17 SDGs in national policies, which is the decision1 of the Government of the Republic of Serbia. The Public Policy Secretariat of the Republic of Serbia implemented the harmonisation analysis of the umbrella and sector policies with the 2030 Agenda, and with the reforms in scope of the European Union integration process. On the basis of this analysis, additional assessment of harmonisation of national policies with the SDGs was undertaken, supported by the UN team in Serbia, during the preparation of the MAPS mission (Mainstreaming, Acceleration and Policy Support). These analyses have found the high level of harmonisation of the umbrella national policies with the 2030 Agenda, and that the key strategic documents defining directions of Serbia’s development on its path towards the EU, to a large extent correspond to the SDGs, including the National Programme for Adoption of the Acquis — NPAA, the National Priorities for Development Assistance — NAD, and the Employment and Social Reform Programme — ESRP. In addition to these umbrella policies, the analyses have identified significant correspondence of sector policies with the SDGs. In accordance with the Law on the Planning System, Serbia will develop the Integrated Development Strategy, to ensure a more coherent policy focus towards the SDGs and firmer links between the SDG implementation process and reforms in the EU integration process.
To assess the factors enabling accelerated implementation of the SDGs and identify the areas where implementation needs to be additionally strengthened, Government of the Republic of Serbia organised a MAPS mission visit in 2018 to compile the implementation status analysis. In July 2018, Government of the Republic of Serbia submitted its first Voluntary National Report — VNR at the High-level Political Forum meeting, describing all achievements in implementing SDGs, with the special focus on local communities and youth.
An important role in monitoring achievements regarding the SDGs is assigned to the Statistical Office of the Republic of Serbia, which has established a web-based platform now enabling tracking 83 out of 244 indicators monitoring the SDG implementation.
1 At national level, Republic of Serbia opted for equal relevance of all SDGs, while at the local level it was left to each town and municipality to set their own priorities.

149Progress report on the implementation of Sustainable Development Goals by 2030 in the Republic of Serbia
The purpose and objectives of the report
The purpose of this report is to present the 2020 progress in reaching SDGs, in line with the 2030 Agenda for Sustainable Development guidelines. Namely, in paragraph 79 of the 2030 Agenda, Member States are encouraged “to conduct regular and inclusive reviews of progress at the national and subnational levels which are country-led and country-driven”. The first Voluntary National Report submitted by Serbia contained a statistical annex with an overview of the status against all SDG indicators that could be tracked in line with data availability.
Monitoring and progress measuring methodology
The progress monitoring in this report is based on the official data of the Statistical Office of the Republic of Serbia and other data producers, now monitoring 17 SDGs through 83 indicators.
The progress measuring is implemented based on the methodology used by Eurostat in the European Union. Bearing in mind that country-specific targets have not been defined in Serbia, methodology with no quantitative indicators used by the Eurostat for SDGs has been applied in order to measure the progress achieved in this report. This implies that measurement is not performed against the quantitative targets, because there are none (for example, a precisely defined poverty rate to which poverty is to be reduced in 2030). Instead the progress is monitored against the baseline year in which data is available, by measuring the level to which the progress is moving in positive or negative direction (in the previous example, this would imply the extent to which poverty rate is reduced or increased in relation to the initial period observed, thus either making progress towards, or moving away from the SDG 1 — End poverty). The rate of change serving as a basis for assessing progress is calculated applying the compound annual growth rate, explained in Annex 1.
While the EU tracks progress in two time frames — long-term (last 15 years) and short-term (last 5 years), in this report progress is mainly monitored in the short-term time frame, with its duration depending on the data availability, while the long-term trends are presented also depending on the data availability. The progress is assessed applying the Eurostat methodology. Therefore, changes of 1% or more are assessed as significant progress towards the SDG, changes higher than or equaling 0 but less than 1% as moderate progress towards the SDG, lesser than 0 but higher than -1% as moderate movement away from the SDG, and below -1% as significant movement away from the SDG (Table 1). The benchmark of 1% has proven adequate during the 10-year experience of applying this rate in tracking various trends implemented by Eurostat, namely as sufficiently discriminatory to separate trends based on the level of change. In addition, it paints a good picture on the change trends, with the sufficient number of indicators broken down in four categories2.
2 Eurostat (2019) Sustainable Development in the European Union. Monitoring report on progress towards the SDGs in an EU context: 2019 edition. https://ec.europa.eu/eurostat/web/sdi/publications

150 Progress report on the implementation of Sustainable Development Goals by 2030 in the Republic of Serbia
Progress assessment categories and symbols
Symbol Progress assessment
Significant progress towards the SDG
Moderate progress towards the SDG
Moderate movement away from the SDG
Significant movement away from the SDG
Inconsistent trends — progress is registered against one (sub)indicator, while movement away from the goal is registered against another.
Trend tracking not possible (for example, due to too short time series)
Goal achieved
The report structure
The report is structured in 15 chapters dedicated to individual SDGs. Two SDGs were not covered due to the current unavailability of data in Serbia for their monitoring (SDG 13 and SDG 14). The annexes include methodological explanation of the progress measurement, the overview of detailed statistical data, links to the SDG profiles and the SDG progress dashboard.

Progress report on the implementation of Sustainable Development Goals by 2030 in the Republic of Serbia 151
SDG 1END POVERTY IN ALL ITS FORM
EVERYWHERE
Number of targets monitored: 4/7 (1.2, 1.3, 1.4, 1.a)
Number of indicators monitored: 5/14
SDG 1 envisages end of poverty in all its forms everywhere and covers seven targets monitored against 14 indicators. Currently, the progress in Serbia can be monitored in relation to four targets against five indicators. The report demonstrates the progress in achieving the following targets: 1.2 reduce the number of the poor, 1.3 implement nationally appropriate social protection systems, 1.4 ensure access to basic services for all, and especially to vulnerable population groups, and 1.a ensure significant mobilization of resources to implement programmes and policies to end poverty in all its dimensions.
KEY FINDINGS
� In long-term (2013–2018) Republic of Serbia achieved moderate progress, and significant progress in short-term (2015–2018) regarding the at-risk-of-poverty and social exclusion mitigation.
� Significant progress was achieved in relation to the target envisaging implementation of nationally appropriate social protection systems, due to the increased share of social protection beneficiaries in the total population.
� Due to the lack of comparable data, progress cannot be tracked against the target 1.4 registering proportion of population with access to water and sanitation services. According to the available 2019 data, coverage in the overall population is almost complete; however, the coverage rate is slightly lower in Roma settlements.
� Moderate movement away was registered in mobilization of resources to implement programmes and policies to end poverty, with positive increased allocations for education and health care, followed by the reduced allocations for social protection.

152 Progress report on the implementation of Sustainable Development Goals by 2030 in the Republic of Serbia
Target 1.2. By 2030, reduce at least by half the proportion of men, women and children of all ages living in poverty in all its dimensions according to national definitions
Indicator 1.2.1 Proportion of population living below the national poverty line, by sex and age (at-risk-of-poverty rate)
Indicator 1.2.2 Proportion of men, women and children of all ages living in poverty in all its dimensions according to national definitions (at-risk-of-poverty or social exclusion rate)
In 2018 at-risk-of-povertyrate was reduced by 0.2 percentage points (from 24.5% to 24.3%) compared with 2013 when the Survey on Income and Living Conditions, based on which relative poverty is being measured, was carried out for the first time,3 thereby showing moderate progress towards the target 1.2 that envisages reducing at least by half the proportion of men, women and children of all ages living in poverty in all its dimensions. Short-term (2015–2018) progress in mitigating at-risk-of-poverty rate was achieved at the compound annual growth rate of -3.09%, which shows a significant progress in the 2030 Agenda implementation period (Table 1, Annex 2). This trend is owing to the increased at-risk-of-poverty rates in 2014 and 2015, after which this rate declined to a slightly lower level than in 2013 (Chart 1).4
The poverty reduction trend can be monitored by sex and age. The sex-disaggregated data shows that both for women and men, moderate progress was registered in the long-term, and significant progress towards this goal in the short-term time frame. In terms of trends observed by age groups, the long-term trends indicate significant progress in poverty reduction in all age categories except the eldest population (65+) where moderate movement away from the target has been registered (Table 1, Annex 2). Observed in the long-term time interval (2013–2018), unfavourable trends of increased at-risk-of-poverty rate have been registered in youth (18–24) and the two eldest age groups (55–64 and 65+), with rates demonstrating significant move-ment away from the target (1.51%, 1.86% and 1.69% respectively) (Table 1, Annex 2).5
3 The at-risk-of-poverty rate is the share of people with an equivalised disposable income below the at-risk-of-poverty threshold (relative poverty line). These persons are not necessarily poor, they are just at-risk of being poor. The at-risk-of-poverty threshold (relative poverty line) is set at 60% of the national median equivalised disposable income after social transfers, expressed in RSD. The equivalised disposable income is the total income of a household, divided by the number of household members using the so-called modified OECD (Organisation for Economic cooperation and Development) equivalence scale. This scale gives a weight 1.0 to the first adult; 0.5 to the second and each subsequent person aged 14 and over; and 0.3 to each child aged under 14. The disposable income does not include in-kind income.
4 Source: Survey on Income and Living Conditions (SILC), SORS.5 Source: Survey on Income and Living Conditions (SILC), SORS.

153Progress report on the implementation of Sustainable Development Goals by 2030 in the Republic of Serbia
SDG
1
Chart 1: Indicator 1.2.1 At risk of poverty rate
Source: Survey on Income and Living Conditions, SORS
Concerning the at-risk-of-poverty and social exclusion covering, in addition to financial poverty monitored under the previous indicator, the risk of material deprivation or low work intensity6 significant progress was recorded long-term (the rate declined from 42.0% in 2013 to 34.3% in 2018) and short-term (the rate dropped from 41.7% in 2015 to 34.3% in 2018). This progress is identical for men and women (based on the compound annual growth rate of 3.97%) (Table 2, Annex 2).7
Target 1.3. Implement nationally appropriate social protection systems and measures for all, including floors, and by 2030 achieve substantial coverage of the poor and the vulnerable
1.3.1 Share of social protection beneficiaries in total population
Significant progress was achieved in relation to the target envisaging implementation of nationally appropriate social protection systems and substantial coverage of the poor and the vulnerable. In the period 2011–2019, a continuous rise by 2.6 percentage points was registered in the proportion of population covered by social protection in the total population, at the compound annual growth rate of 3.37% at the level of the entire period, and 2.04% in the period 2015–2019 (Table 3, Annex 2).8 The sex and age disaggregated data are not available.
6 The at-risk-of-poverty and social exclusion rate shows the percentage of people who are at-risk of poverty or severely materially deprived or living in the household with low work intensity.
7 Source: Survey on Income and Living Conditions (SILC), SORS.8 Source: Republic Institute for Social Protection and Vital Statistics, SORS.
24.5
26.7
24.3
24.1
26.0
24.0
24.9
27.5
24.6
21
22
23
24
25
26
27
28
29
30
2013 2014 2015 2016 2017 2018
Total Female Male

154 Progress report on the implementation of Sustainable Development Goals by 2030 in the Republic of Serbia
Chart 2: Indicator 1.3.1 Proportion of population covered by social protection floors/systems (%)
Source: Republic Institute for Social Protection, regular report of the Centers for Social Work
Target 1.4 By 2030, ensure that all men and women, in particular the poor and the vulnerable, have equal rights to economic resources, as well as access to basic services, ownership and control over land and other forms of property, inheritance, natural resources, appropriate new technology and financial services, including microfinance
Indicator 1.4.1a Percentage of people with access to basic water supply services
Indicator 1.4.1b Percentage of people with access to basic sanitation services
The progress against this target cannot be monitored due to the lack of time series. According to the data of multiple indicator cluster survey, in 2019 in Serbia 99.1% of people had access to basic water supply services, with a slight difference between those living in urban and other settlements (99.2% against 99.0%) and somewhat larger difference when concerning are Roma settlements (98.2%). In regard to access to sanitation services, 98.4% of people have access to these services (99.4% in urban and 97.0% in other settlements). The lowest share was registered in Roma population (86.4%) (Table 4, Annex 2).9
9 Source: Multiple Indicator Cluster Survey (MICS), SORS and UNICEF.
7.9 8.5
8.9 9.3 9.5
10.0 10.1 10.5 10.3
0
2
4
6
8
10
12
2011 2012 2013 2014 2015 2016 2017 2018 2019

155Progress report on the implementation of Sustainable Development Goals by 2030 in the Republic of Serbia
SDG
1
Target 1.a Ensure significant mobilization of resources from a variety of sources, including through enhanced development cooperation, in order to provide adequate and predictable means for developing countries, in particular least developed countries, to implement programmes and policies to end poverty in all its dimensions
Indicator 1.a.2 Proportion of total government spending on essential services (education, health and social protection)
Moderate movement away from the target was recorded under target 1.a.2 that calls for ensuring significant mobilisation of resources to implement programmes and policies to end poverty in all of its dimensions. The share of spending on education and health care was increased in the period 2015–2019; however, the share of (spending on) social protection in total government expenditures was reduced (Chart 3 and Table 5 in Annex 2).10
Chart 3: Indicator 1.a.2 Proportion of total government spending on essential services (education, health and social protection) (%)
Source: Ministry of Finance — Sector for Macroeconomic and Fiscal Analysis and Forecasts
10 Source: Ministry of Finance — Sector for Macroeconomic and Fiscal Analysis and Forecasts.
56.054.3
7.4
7.7
12.1 12.5
36.6 34.1
0
10
20
30
40
50
60
2015 2016 2017 2018 2019
Total Education Health care Social protection


Progress report on the implementation of Sustainable Development Goals by 2030 in the Republic of Serbia 157
SDG 2END HUNGER, ACHIEVE FOOD
SECURITY AND IMPROVED NUTRITION AND PROMOTE SUSTAINABLE
AGRICULTURE
Number of targets monitored: 3/8 (2.1, 2.2, 2.a)
Number of indicators monitored: 4/13
SDG 2 calls for the end of hunger and achieving food security and improved nutrition and promotion of sustainable agriculture which is of key importance for such nutrition. This goal includes eight targets monitored against 13 indicators. Currently, in Serbia progress can be monitored in relation to three targets against four indicators. The report presents the progress in achieving the following targets: 2.1 end hunger and ensure access by all people to safe, nutritious and sufficient food all year round, 2.2 end all forms of malnutrition, and 2.a increase investment, including through enhanced international cooperation, in rural infrastructure, agricultural research and extension services, technology development and plant and livestock gene banks.
KEY FINDINGS
� The progress made towards the SDG 2 registers inconsistent trends: while progress is recorded in reducing the number of different forms of child malnutrition and increased allocations for agriculture, the number of people facing moderate or severe food insecurity among adults is on the rise.
� Significant movement away from the target 2.1 calling for the end of hunger and ensuring access by all people to safe, nutritious and sufficient food all year round due to the increased share of people facing moderate or severe food insecurity. This trend is particularly gender-specific given that men have registered lower number of people in food insecurity situation, while women have registered increased share of such persons.
� In the 2030 Agenda implementation period, significant progress was registered in reduced prevalence of different forms of child malnutrition, like stunting, wasting and overweight.
� Significant progress was registered in regard to government spending on agriculture.

158 Progress report on the implementation of Sustainable Development Goals by 2030 in the Republic of Serbia
Target 2.1 By 2030, end hunger and ensure access by all people, in particular the poor and people in vulnerable situations, including infants, to safe, nutritious and sufficient food all year round
Indicator 2.1.2.a Prevalence of moderate or severe food insecurity in adult population11
Indicator 2.1.2.b Prevalence of severe food insecurity in adult population
Indicator 2.1.2c Total population in moderate or severe food insecurity
Indicator 2.1.2d Total population in severe food insecurity
Significant movement away from the target 2.1 is owed to the increase in the number of individuals facing food insecurity. The total number of individuals suffering from severe food insecurity was increased in the period between 2015 and 2017 from 118,856 to 138,429 persons (or from 1.3% to 1.6%). This trend was also characterised by pronounced gender inequality. Among men aged 15 and above the total number of persons suffering from severe food insecurity was reduced from 54,544 to 40,585 persons (or from 1.5% to 1.1%), whereas for female population of the same age the number of such persons increased from 48,087 to 67,517 (from 1.3% to 1.8%). The same trend is registered concerning the indicator measuring the total number of individuals facing moderate or severe food insecurity. The number of these persons aged 15 and above increased from 942,248 in 2015 to 1,030,590 in 2017 (or from 10.6% to 11.7%). In this case as well, the number of these individuals declined among men (from 355,388 to 329,895, or from 9.9% to 9.3%), while it went up among women (from 401,008 to 503,659, or from 10.5% to 13.3%).12
Target 2.2 By 2030, end all forms of malnutrition, including achieving, by 2025, the internationally agreed targets on stunting and wasting in children under 5 years of age, and address the nutritional needs of adolescent girls, pregnant and lactating women and older persons
Indicator 2.2.1 Prevalence of stunting (moderate and severe) among children under 5 years of age13
Indicator 2.2.2 a Prevalence of overweight among children under 5 years of age14
Indicator 2.2.2.b Prevalence of wasting (moderate and severe) among children under 5 years of age15
11 This indicator measures the percentage of individuals in population that have faced moderate or severe food insecurity in the reference period. Severe food insecurity, defined as unobservable trait, is measured on a global reference food insecurity scale, measuring standard set by FAO applying the Food Insecurity Experience Scale in more than 140 countries worldwide as of 2014.
12 Food and Agriculture Organization (FAO) — database. 13 Height for age <-2 standard deviation from the median of the World Health Organization — WHO (Child Growth Standards).14 Weight for height >+2 standard deviation from the median of the WHO Child Growth Standards.15 Weight for height <-2 standard deviation from the median of the WHO Child Growth Standards.

159Progress report on the implementation of Sustainable Development Goals by 2030 in the Republic of Serbia
SDG
2
Significant progress towards target 2.2 is registered against all indicators, namely against all forms of malnutrition among children under the age of five: stunting, overweight and wasting.16 The short-term and the long-term decline in the share of stunted children is present is the overall population of children under the age of five, same as in the sample of children living in Roma settlements (Chart 4). However, in this regard there are visible gender differences, given that among girls the proportion of children with this type of lagging behind in physical development is declining, while rising among boys (Table 10, Annex 2).
Chart 4: Indicator 2.2.1 Prevalence of stunting (moderate and severe) among children under 5 years of age, by sex, Serbia and Roma settlements, 2010–2019 (%)
Source: Multiple Indicator Cluster Survey (MICS), SORS and UNICEF
In terms of prevalence of overweight, significant progress was achieved both long-term (in the period 2010–2019), and short-term (2014–2019). Positive trend is present in boys and girls, but movement away from the target is registered among children living in Roma settlements (Chart 5). Observed through the prism of material status of household, significant progress was registered for children living in households of the poorest, second and medium quintile of the wellbeing index, while significant movement away from the goal was recorded for children living in well-off households, namely those in fourth and the richest quintile (Table 11, Annex 2).
16 Source: Multiple Indicator Cluster Survey (MICS), SORS and UNICEF.
6.6
6.0 5.4
23.6
18.5 16.9
0
5
10
15
20
25
2010 2014 2019
Total Roma settlements
7.2
5.1
3.1
5.9
6.8
7.4
0
2
4
6
8
10
2010 2014 2019
Female Мale

160 Progress report on the implementation of Sustainable Development Goals by 2030 in the Republic of Serbia
Chart 5: Indicator 2.2.2.a Prevalence of overweight (moderate and severe) among children under 5 years of age, by sex, Serbia and Roma settlements, 2010–2019 (%)
Source: Multiple Indicator Cluster Survey (MICS), SORS and UNICEF
Concerning the prevalence of wasting, significant progress was recorded in the total population of children among children under 5 years of age, both in female and male children, same as for children living in Roma settlements (Chart 6). Significant movement away from the target is present among children from the poorest households on short-term, however not on long-term basis (Table 12, Annex 2).
Chart 6: Indicator 2.2.2.b Prevalence of wasting (moderate and severe) among children under 5 years of age, by sex, Serbia and Roma settlements, 2010–2019 (%)
Source: Multiple Indicator Cluster Survey (MICS), SORS and UNICEF
15.6 13.9
10.9
12.8
5.1
6.9
0
4
8
12
16
20
2010 2014 2019
Total Roma settlements
14.7
12.0
8.9
16.6 15.6
12.7
0
4
8
12
16
20
2010 2014 2019
Female Мale
3.5 3.9
2.6
5.2 4.8
2.8
0
2
4
6
8
10
2010 2014 2019
Total Roma settlements
4.2
3.6
1.9 2.7
4.2 3.2
0
2
4
6
8
10
2010 2014 2019
Female Мale

161Progress report on the implementation of Sustainable Development Goals by 2030 in the Republic of Serbia
SDG
2
Target 2.a Increase investment, including through enhanced international cooperation, in rural infrastructure, agricultural research and extension services, technology development and plant and livestock gene banks in order to enhance agricultural productive capacity in developing countries, in particular least developed countries
Indicator 2.a.1 The agriculture orientation index for government expenditures
Significant progress was registered in terms of government spending on agriculture in the period 2015–2019 (Chart 7) at the compound annual growth rate of 7.19%.17
Chart 7: The agriculture orientation index for government expenditures, 2015–2019
Source: Ministry of Finance, Sector for Macroeconomic and Fiscal Analysis and Forecasts and National Accounts, SORS
17 Source: Ministry of Finance, Sector for Macroeconomic and Fiscal Analysis and Forecasts and National Accounts, SORS.
0.25 0.24
0.32 0.33 0.33
0
0.05
0.1
0.15
0.2
0.25
0.3
0.35
2015 2016 2017 2018 2019


Progress report on the implementation of Sustainable Development Goals by 2030 in the Republic of Serbia 163
SDG 3ENSURE HEALTHY LIVES AND
PROMOTE WELL-BEING FOR ALL AT ALL AGES
Number of targets monitored: 9/13 (3.1, 3.2, 3.3, 3.4, 3.7, 3.8, 3.9, 3.b, 3.c)
Number of indicators monitored: 13/27
SDG 3 envisages ensuring healthy lives and promotion of well-being for the entire population. This goal includes 13 targets monitored against 27 indicators. For the time being, the progress in Serbia can be monitored in relation to nine targets against 13 out of 27 indicators. Owing to the relatively good coverage of this SDG by data, the report shows the progress in achieving the following targets: 3.1 reduce the global maternal mortality ratio, 3.2 end preventable deaths of newborns and children under the age of five, 3.3 end the epidemics of AIDS, tuberculosis, and other communicable diseases, 3.4 reduce premature mortality from non-communicable diseases, 3.7 ensure universal access to sexual and reproductive health-care services, including for family planning, 3.8 achieve universal health coverage including financial risk protection, access to quality essential health-care services and access to safe, effective, quality and affordable essential medicines and vaccines for all, 3.9 substantially reduce the number of deaths and illnesses from different forms of pollution and contamination, 3.b support the research and development of vaccines and medicines for the communicable and non-communicable diseases, same as 3.c increase health financing and the recruitment, development, training and retention of the health workforce.
KEY FINDINGS
� Progress has been achieved against the majority of indicators measuring progress towards SDG 3, certain targets are achieved compared to the globally defined values, however in the areas of certain targets movement away from the target was registered.
� The target relating to reduced maternal mortality ratio (3.1) may be considered achieved against the threshold set globally, envisaging reduction in the maternal mortality ratio to less than 70 per 100,000 live births. This target was defined globally in line with the unfavourable situation in underdeveloped countries. Despite the global target being achieved, the short-term and the long-term trends in Serbia still show insufficient progress against this indicator.

164 Progress report on the implementation of Sustainable Development Goals by 2030 in the Republic of Serbia
� Second indicator relevant for maternal mortality — proportion of births attended by skilled health personnel in the total number of births, indicates continuously vey high values with additional moderate progress.
� Indicators relating to mortality rate of children aged under five years and neonatal mortality rate (target 3.2) indicate that global target has been achieved in Serbia, but it should be kept in mind that global standards were defined bearing in mind the extremely unfavourable situation in underdeveloped countries. The trends in Serbia show a drop in the mortality rate of children aged under five years and neonatal mortality rate both in the overall population, and in population living in Roma settlements.
� Significant progress was registered in reduced tuberculosis incidence per 100,000 population, which is one of the indicators for target 3.3 calling for end of communicable diseases.
� In the area of non-communicable diseases moderate progress is registered, which is indicated by the trends recorded in terms of mortality rate attributed to cardiovascular disease, cancer, diabetes or chronic respiratory disease. At the same time, significant progress is indicated concerning suicide mortality rate monitoring mental health and well-being.
� Significant progress was achieved in relation to sexual and reproductive health (3.7), both due to the increased proportion of women of reproductive age who have their need for family planning satisfied with modern methods and to reduced adolescent birth rate.
� Against target 3.8 progress cannot be monitored due to the lack of time series available only for one indicator measuring access to improved sanitary facilities. The data shows that prevalence is high both in the overall population and in Roma settlements.
� Positive trend and significant progress were recorded in regard to the reduced mortality rate attributed to unintentional poisoning.
� Progress cannot be monitored concerning the target 3.b given that the available 2019 data is not comparable with previous data. This data shows that coverage of children is not complete, especially in Roma settlements.
� Inconsistent trend was registered against target 3.c calling for increased health financing and the recruitment, development, training and retention of the health workforce. Based on the indicator of health workers density and distribution, moderate movement away from the target is notable when doctors, dentists and pharmacists are concerned, and significant progress towards the target concerning nurses and midwives.

165Progress report on the implementation of Sustainable Development Goals by 2030 in the Republic of Serbia
SDG
3
Target 3.1 By 2030, reduce the global maternal mortality ratio to less than 70 per 100,000 live births
Indicator 3.1.1 Maternal mortality ratio18
Indicator 3.1.2 Proportion of births attended by skilled health personnel
One of the most important targets under SDG 3 is related to reduced maternal mortality ratio, with the global standard being less than 70 deaths per 100,000 live births. Maternal deaths include female deaths during pregnancy and childbirth or within 42 days of termination of pregnancy, irrespective of the duration and site of pregnancy, from any cause related to or aggravated by pregnancy or its management. In Serbia this objective was achieved despite annual variations, it is significantly under 70 (Chart 8); however, one should bear in mind that such threshold was set globally primarily due to the high maternal mortality in developing countries.19
Chart 8: Indicator 3.1.1 Maternal mortality ratio, 1990–201920
Source: Vital Statistics, SORS
18 Maternal mortality ratio — the number of maternal deaths per 100,000 live births in the year concerned. Maternal death — female deaths during pregnancy and childbirth or within 42 days of termination of pregnancy, irrespective of the duration and site of the pregnancy, from any cause related to or aggravated by pregnancy or its management, excluding accidental or incidental causes. Since 2007 onwards, the data was gathered applying the triangulation method, using death certificates, birth registration and hospitalisation reports as data sources. The 2019 data was obtained using death certificates.
19 Source: Vital Statistics, SORS. 20 Maternal mortality ratio — the number of maternal deaths per 100,000 live births in the year concerned. Maternal death — female
deaths during pregnancy and childbirth or within 42 days of termination of pregnancy, irrespective of the duration and site of the pregnancy, from any cause related to or aggravated by pregnancy or its management, excluding accidental or incidental causes.
11.1
21.319.9
1.3
6.2
0
5
10
15
20
25
1990
1991
1992
1993
1994
1995
1996
1997
1998
1999
2000
2001
2002
2003
2004
2005
2006
2007
2008
2009
2010
2011
2012
2013
2014
2015
2016
2017
2018
2019

166 Progress report on the implementation of Sustainable Development Goals by 2030 in the Republic of Serbia
Proportion of births attended by skilled health personnel21 represents an additional indicator measuring progress against target 3.1. This indicator (3.1.2) shows continuously high values for Serbia, with envisaged continuous progress (Table 13 in Annex 2).22
Target 3.2 By 2030, end preventable deaths of newborns and children under 5 years of age, with all countries aiming to reduce neonatal mortality to at least as low as 12 per 1,000 live births and under-5 mortality to at least as low as 25 per 1,000 live births.
Indicator 3.2.1 Under-five mortality rate
Indicator 3.2.2 Neonatal mortality rate
Target 3.2 defines as development priorities reduced neonatal and under-five mortality. This target also defines global standards implying that the number of neonatal deaths per 1,000 live births should be below 12, and the under-five mortality rate per 1,000 live births below 25. In relation to these standards set and having in mind the unfavourable situation in underdeveloped countries, Serbia has achieved the global target. Moreover, when it comes to trends, continuous decline was registered in mortality rate for children in the overall population and for children living in Roma settlements, where this rate dropped from 28 in 2005 to 9 in 2019. Positive trends are registered both for girls and boys (Chart 9).23
Chart 9: Indicator 3.2.1 Under-five mortality rate, 1990–201924
Source: Vital Statistics, SORS
21 The indicator measures the percentage of women (15–49) who gave birth in the period of two years before the survey, attended by skilled health personnel (doctors, nurses or midwives). The period observed includes two years prior to the survey.
22 Source: Multiple Indicator Cluster Survey (MICS), SORS and UNICEF.23 Source: Vital Statistics, SORS, for the Roma settlement population, Multiple Indicator Cluster Survey (MICS), SORS and UNICEF.24 Deaths per 1,000 live births.
18.3
6.2 5.7
16.4
5.9 5.1
20.1
6.4 6.2
0
5
10
15
20
25
1990
1991
1992
1993
1994
1995
1996
1997
1998
1999
2000
2001
2002
2003
2004
2005
2006
2007
2008
2009
2010
2011
2012
2013
2014
2015
2016
2017
2018
2019
Total Female Мale

167Progress report on the implementation of Sustainable Development Goals by 2030 in the Republic of Serbia
SDG
3
Target 3.3 By 2030, end the epidemics of AIDS, tuberculosis, malaria and neglected tropical diseases and combat hepatitis, water-borne diseases and other communicable diseases
Indicator 3.3.2 Tuberculosis incidence per 100,000 population
Significant progress is registered against target 3.3 calling for the reduction in communicable diseases. For the time being, only the indicator monitoring tuberculosis incidence is available, and based on this indicator continuous both long-term and short-term progress was observed (Table 18, Annex 2).25 While in 2001 there were 38.7 reported tuberculosis cases per 100,000 inhabitants, in 2015, the initial year of the 2030 Agenda for Sustainable Development implementation, there were 13.6 cases, and in 2018, the last year the data are available for, ten cases per 100,000 inhabitants.26
Target 3.4 By 2030, reduce by one third premature mortality from non-communicable diseases through prevention and treatment and promote mental health and well-being
Indicator 3.4.1 Mortality rate attributed to cardiovascular disease, cancer, diabetes or chronic respiratory disease
Indicator 3.4.2 Suicide mortality rate
Moderate progress was registered regarding non-communicable diseases defined as a priority under target 3.4. Mortality rate attributed to cardiovascular disease, cancer, diabetes or chronic respiratory disease27 slightly declined in the period between 2015 and 2019 (from 21.2% to 20.7%). Gender differences are pronounced and despite the reduced rates, they have remained considerably higher for male than for female population (Chart 10).28
Mental health indicator monitoring suicide mortality rate29 shows significant progress in the period 2015–2019. This rate declined both for female and male population (Chart 11 and Table 20, Annex 2).30
25 Source: Public Health Institute of Serbia and Vital Statistics, SORS.26 Source: Public Health Institute of Serbia and Vital Statistics, SORS.27 Probability of dying between the ages of 30 and 70 years from cardiovascular diseases, cancer, diabetes or chronic respiratory diseases.
Mortality due to these four causes will be based on the following ICD-10 (International Classification of Diseases) codes: I00-I99, C00-C97, E10-E14, and J30-J98.
28 Source: Vital Statistics, SORS.29 The number of suicide deaths per 100,000 inhabitants in the year concerned.30 Source: Vital Statistics, SORS.

168 Progress report on the implementation of Sustainable Development Goals by 2030 in the Republic of Serbia
Chart 10: Indicator 3.4.1 Mortality rate attributed to cardiovascular disease, cancer, diabetes or chronic respiratory disease, 2015–2019 (%)
Source: Vital Statistics, SORS
Chart 11: Indicator 3.4.2 Suicide mortality rate, by sex, 2000–2019 (%)
Source: Vital Statistics, SORS
21.2 20.7 20.7 20.6 20.7
15.4 15.3 15.5 15.2 15.0
27.2 26.5 26.3 26.2 26.6
0
5
10
15
20
25
30
2015 2016 2017 2018 2019
Total Female Мale
20.2
15.0 13.5
12.1
7.4 6.8
28.7
23.0
20.6
0
5
10
15
20
25
30
35
Total Female Мale
2000
2001
2002
2003
2004
2005
2006
2007
2008
2009
2010
2011
2012
2013
2014
2015
2016
2017
2018
2019

169Progress report on the implementation of Sustainable Development Goals by 2030 in the Republic of Serbia
SDG
3
Target 3.7 By 2030, ensure universal access to sexual and reproductive health-care services, including for family planning, information and education, and the integration of reproductive health into national strategies and programmes
Indicator 3.7.1 Proportion of women of reproductive age (aged 15–49 years) who have their need for family planning satisfied with modern methods
Indicator 3.7.2 Adolescent birth rate (aged 15–19 years) per 1,000 women in that age group
The achievement of target 3.7 referring to sexual and reproductive health registered significant progress both in relation to women of reproductive age who have their need for family planning satisfied with modern methods,31 and adolescent birth rate.32 Chart 12 illustrates the trend for the overall population of women aged 15–49, for which latest data comparable with data from the previous two cycles of Multiple Indicator Cluster Survey are available. According to these data, significant short-term progress was achieved at the compound annual growth rate of 3.63%, but moderate movement away from the target at the rate of -0.68% long-term, with an increased share of women using modern contraceptive methods in the period observed (Chart 12).33
Chart 12: Indicator 3.7.1 Ratio of contraceptive methods use — modern methods, female population, aged 15–49 (%)
Source: Multiple Indicator Cluster Survey (MICS), SORS and UNICEF
31 Percentage of women aged 15–49 who are married or have a steady partner who are using, or whose partner is currently using, at least one modern contraceptive method. Modern methods of contraception include some of the following methods: sterilization, the intra-uterine device (IUD), the implant, injectables, oral contraceptive pills, male and female condoms, vaginal barrier methods (including the diaphragm).
32 It represents a ratio between the number of live births by mothers aged 15–19 and estimated female population of that age.33 Source: Multiple Indicator Cluster Survey (MICS), SORS and UNICEF.
31.9
25.1
30.0
0
5
10
15
20
25
30
35
2010 2014 2019

170 Progress report on the implementation of Sustainable Development Goals by 2030 in the Republic of Serbia
The reduced adolescent birth rate shows significant progress towards the target, both long-term (at the compound annual growth rate of -4.01%), and short-term (at the compound annual growth rate of -4.43%) (Chart 13 and Table 22 in Annex 2).
Chart 13: Indicator 3.7.2 Adolescent birth rate (aged 15–19 years) per 1,000 women in that age group34, 1990–2019
Source: Vital Statistics, SORS
Target 3.8 Achieve universal health coverage, including financial risk protection, access to quality essential health-care services and access to safe, effective, quality and affordable essential medicines and vaccines for all
Indicator 3.8.1 Percentage of people using improved sanitary facilities
The progress cannot be monitored against this target due to the lack of time series. According to the data from the last 2019 Multiple Indicator Cluster Survey, 98.6% of people in the overall population and 93.0% of people living in Roma settlements use improved sanitary facilities. The differences are present between the people living in urban and other settlements, same as between persons living in different quintiles of the well-being index (Table 23, Annex 2).35
34 Indicator represents a ratio between the number of live births by mothers aged 15–19 and estimated female population of that age.35 Source: Multiple Indicator Cluster Survey (MICS), SORS and UNICEF.
44.5
13.6
0
5
10
15
20
25
30
35
40
45
50
1990
1991
1992
1993
1994
1995
1996
1997
1998
1999
2000
2001
2002
2003
2004
2005
2006
2007
2008
2009
2010
2011
2012
2013
2014
2015
2016
2017
2018
2019

171Progress report on the implementation of Sustainable Development Goals by 2030 in the Republic of Serbia
SDG
3
Target 3.9 By 2030, substantially reduce the number of deaths and illnesses from hazardous chemicals and air, water and soil pollution and contamination
Indicator 3.9.3 Mortality rate attributed to unintentional poisoning
Significant progress is present in the area of target 3.9 envisaging reduced deaths from different forms of pollution and contamination36. In 2010 in Serbia 0.6 people per 100,000 inhabitants died of unintentional poisoning, whereas in 2019 this number amounted to -0.3%, thus producing the compound annual growth rate of -7.41% (Table 24, Annex 2).
Target 3.b Support the research and development of vaccines and medicines for the communicable and non-communicable diseases that primarily affect developing countries, provide access to affordable essential medicines and vaccines, in accordance with the Doha Declaration on the TRIPS Agreement and Public Health, which affirms the right of developing countries to use to the full the provisions in the Agreement on Trade-Related Aspects of Intellectual Property Rights regarding flexibilities to protect public health, and, in particular, provide access to medicines for all
Indicator 3.b.1 Proportion of the target population covered by all vaccines included in their national programme
The progress cannot be monitored concerning the target 3.b.1 given that the available 2019 data are not comparable with the previous data. According to the MICS 6 data, children between 12 and 23 months of age are covered by immunization against diphtheria, tetanus and pertussis in 91.8% in the overall population, and 73.3% in Roma settlements. Immunization against pneumococcus covers 65.4% of school age children in overall population, and 47.0% in Roma settlements. Immunization coverage against measles in the overall population of children aged 24 to 35 months equals 87.2%, and in Roma settlements equals 76.5% of children.37
Target 3.c Substantially increase health financing and the recruitment, development, training and retention of the health workforce in developing countries, especially in least developed countries and small island developing States
Indicator 3.c.1 Health worker density and distribution
In terms of target 3.c envisaging increased health financing and the recruitment, development, training and retention of the health workforce, predominantly negative short-term trends (2015–2017) have been observed making Serbia moderately moving away from the target. Namely, the number of doctors per 10,000 inhabitants was reduced from 30.8 in 2015 to 30.5 in 2017, the number of dentists in the same period was reduced from 3.1 to 2.8, and
36 The number of deaths attributed to unintentional poisoning (MKB-10 codes: X40, X43-X44, X46-X49) per 100,000 inhabitants in the observed year.
37 Source: Multiple Indicator Cluster Survey (MICS), SORS and UNICEF.

172 Progress report on the implementation of Sustainable Development Goals by 2030 in the Republic of Serbia
the number of pharmacists from 3.3 to 2.9. In the same period, the number of nurses and midwives was increased from 63.6 to 64.9 (compound annual growth rates are shown in Table 26 in Annex 2).38
38 Source: Public Health Institute of Serbia and Vital Statistics, SORS.

Progress report on the implementation of Sustainable Development Goals by 2030 in the Republic of Serbia 173
SDG 4ENSURE INCLUSIVE AND EQUITABLE
QUALITY EDUCATION AND PROMOTE LIFELONG LEARNING
OPPORTUNITIES FOR ALL
Number of targets monitored: 5/10 (4.1, 4.2, 4.3, 4.5, 4.6)
Number of indicators monitored: 6/11
SDG 4 envisages ensuring improved education of the population via ten targets monitored against 11 indicators. For the time being, in Serbia progress can be monitored in relation to five targets against six indicators. The report presents the progress in achieving the following targets: 4.1 ensure that all girls and boys complete free, equitable and quality primary and secondary education, 4.2 ensure that all girls and boys have access to quality early childhood development, care and pre-primary education so that they are ready for primary education, 4.3 ensure equal access for all women and men to affordable and quality technical, vocational and tertiary education, including university, 4.5 eliminate gender disparities in education, and 4.6 ensure that all youth and a substantial proportion of adults, both men and women, achieve literacy and numeracy.
KEY FINDINGS
� The progress in achieving target 4.1 calling for ensuring that all girls and boys complete free, equitable and quality primary and secondary education cannot be monitored since the data on graduation from primary and secondary school is available only for 2019. According to this data, the rate of completion of first and second cycles of primary school is high, somewhat lower for secondary school, and significantly lower in population of children living in Roma settlements.
� Moderate progress is registered in terms of early child development and proportion of children in preparatory preschool programme (target 4.2).
� Inconsistent trend was registered in relation to target 4.3 calling for ensuring equal access for all women and men to affordable and quality technical, vocational and tertiary education, including university, given that moderate progress was identified in youth (15–24) and moderate movement away from target in adult population (25–64).

174 Progress report on the implementation of Sustainable Development Goals by 2030 in the Republic of Serbia
� The progress in achieving target 4.5 cannot be measured given that compound annual growth rates cannot be applied to parity indices, whereas comparable data for 2015 and 2019 shows inconsistent trends at different education levels.39
� Moderate progress was achieved regarding raising the level of literacy in children in reading, science and mathematics (target 4.6).
Target 4.1 By 2030, ensure that all girls and boys complete free, equitable and quality primary and secondary education leading to relevant and effective learning outcomes
Indicator 4.1.2a Rate of completion of the first cycle of primary education
Indicator 4.1.2b Rate of completion of the second cycle of primary education
Indicator 4.1.2s Rate of secondary school completion
Due to the lack of time series, it is not possible to monitor progress under target 4.1 envisaging that all girls and boys should complete free, equitable and quality primary and secondary education. According to the 2019 data, the rate of completion of the first cycle of primary education is high in the overall population (99.9%), but it is lower for children living in Roma settlements (88.9%). The rate of completion of the second cycle of primary education is also high for the overall population (99.5%), but lower for the population of children from Roma settlements (63.7%). At the secondary school level it slightly declines in the overall population compared to primary education (97.7%), same as in population of children from Roma settlements (61.0%), and it is lowest for girls from Roma settlements (49.5%)40 (Tables 27, 28 and 29, Annex 2).
Target 4.2 By 2030, ensure that all girls and boys have access to quality early childhood development, care and pre-primary education so that they are ready for primary education
Indicator 4.2.1 Proportion of children under 5 years of age who are developmentally on track in health, learning and psychosocial well-being, by sex
Indicator 4.2.2 Participation rate in organized learning (one year before the official primary entry age), by sex
Moderate progress was registered in terms of early child development (under 5 years of age)41 at the compound annual growth rate of 0.44% (Table 30, Annex 2). The progress is notable both for male and female children. Significant progress was registered for children from the poorest households (Table 30, Annex 2).
39 Indicator defines education levels based on the ISCED classification.40 Source: Multiple Indicator Cluster Survey (MICS), SORS and UNICEF.41 The early development index represents the percentage of children aged 36–59 months in meeting age-appropriate developmental
expectations in the following four domains: literacy and numeracy, physical development, social and emotional development and learning. The data is gathered under the Multiple Indicator Cluster Survey — MICS periodically implemented by UNICEF and SORS.

175Progress report on the implementation of Sustainable Development Goals by 2030 in the Republic of Serbia
SDG
4
In terms of children covered by the preparatory pre-school educational programme moderate progress is registered in short-term (at the compound annual growth rate of 0.61%), and significant progress in long-term (at the compound annual growth rate of 1.04%) (Table 31, Annex 2), without any considerable differences by sex (Chart 14).42
Chart 14: Indicator 4.2.2 Participation rate in organized learning (one year before the official primary entry age), by sex, 2009–2019 (%)43
Source: Education statistics, SORS
Target 4.3 By 2030, ensure equal access for all women and men to affordable and quality technical, vocational and tertiary education, including university
Indicator 4.3.1 Participation rate of youth and adults in formal and non-formal education and training in the previous 12 months, by sex
In relation to target 4.3 inconsistent trend has been registered: moderate progress in regard to participation of youth in formal and non-formal education and training, and significant movement away from the target in adult population (25–64) (Table 32, Annex 2). In youth positive trend was registered both in short-term (2015–2019) and in long-term (2010–2019). Although progress was registered for both women and men, there was a continuous disparity in education rates in favour of women (Chart 15).44
42 Source: Education statistics, SORS.43 Coverage of children by pre-school programme is the proportion of the number of children attending pre-school programme and
age group of the children required to attend pre-school.44 Source: Labour Force Survey, SORS.
Total Female Мale
87.8
95.1
97.4
87.9
94.7
97.5
87.7
95.4
97.3
86
88
90
92
94
96
98
100
2009 2010 2011 2012 2013 2014 2015 2016 2017 2018 2019

176 Progress report on the implementation of Sustainable Development Goals by 2030 in the Republic of Serbia
Chart 15: Indicator 4.3.1 Participation rate of youth and adults in formal and non-formal education and training in the previous 12 months, by sex, young population 15–24 years of age (%)
Source: Labour Force Survey, SORS
When it comes to adult population (aged 25–64), the long-term trend shows moderate progress, but in the short-term it indicates significant movement away from the SG objective, both in men and women (Chart 16). In this case as well, the participation rate of women is continuously higher than the participation rate of men, however the difference is far lower than in young population.45
Chart 16: Indicator 4.3.1 Participation rate of youth and adults in formal and non-formal education and training in the previous 12 months, by sex, adult population 25–64 years of age (%)
Source: Labour Force Survey, SORS
45 Source: Labour Force Survey, SORS.
65.8
66.4
66.9
71.0 71.6 71.7
60.9 61.5
62.4
54
56
58
60
62
64
66
68
70
72
74
2010 2011 2012 2013 2014 2015 2016 2017 2018 2019
Total 15–24 Female 15–24 Male 15–24
4.2
5.1 4.8
4.0
4.8 4.3
3.9 4.4
3.8
0
1
2
3
4
5
6
2010 2011 2012 2013 2014 2015 2016 2017 2018 2019
Female 25–64 Total 25–64 Мale 25–64

177Progress report on the implementation of Sustainable Development Goals by 2030 in the Republic of Serbia
SDG
4
Target 4.5 By 2030, eliminate gender disparities in education and ensure equal access to all levels of education and vocational training for the vulnerable, including persons with disabilities, indigenous peoples and children in vulnerable situations
Indicator 4.5.1 Parity indices in different education levels
The progress cannot be measured by the compound annual growth rate for the parity indices. At the primary school level in the period 2014–2019 there was an increase in disparity in favour of boys, while at the secondary school level disparity declined, with the unchanged situation at the lower secondary level (Table 33, Annex 2). Concerning the disparity between children from the poorest and wealthiest households, at the level of primary education there was a shift in favour of children from the poorest quintiles, whereas at the lower and upper secondary education level disparity remained the same in favour of the children from the wealthiest households (Table 33, Annex 2).46
Target 4.6 By 2030, ensure that all youth and a substantial proportion of adults, both men and women, achieve literacy and numeracy
Indicator 4.6.1 Proportion of students aged 15 years not achieving the minimum fixed level on the PISA scale for three elementary school subjects
The data on the literacy and numeracy is not available for the period when the 2030 Agenda came into force, but only for the period 2006–2012. According to these data, significant progress was registered in regard to literacy and numeracy (Table 34, Annex 2). In relation to the first year of testing (2006), the proportion of children failing to reach the lowest fixed level of attainments in all three areas: reading, mathematics and science declined. However, between 2009 and 2012, the proportion of children failing to reach this minimum attainment level slightly increased in the area of reading and science (Chart 17).47
46 Source: Multiple Indicator Cluster Survey (MICS), SORS and UNICEF.47 Source: Organization for Security and Co-operation in Europe (OSCE) — database.

178 Progress report on the implementation of Sustainable Development Goals by 2030 in the Republic of Serbia
Chart 17: Indicator 4.6.1: Proportion of students aged 15 years not achieving the minimum fixed level on the PISA scale for three elementary school subjects
Source: Organization for Security and Co-operation in Europe (OSCE) — database
51.7
32.8 33.1
38.5 34.4
35.0
42.7 40.6
38.9
0
10
20
30
40
50
60
2006 2009 2012
Reading Science Mathematics

Progress report on the implementation of Sustainable Development Goals by 2030 in the Republic of Serbia 179
SDG 5ACHIEVE GENDER EQUALITY AND
EMPOWER ALL WOMEN AND GIRLS
Number of targets monitored: 8/9 (5.1, 5.2, 5.3, 5.4, 5.5, 5.6, 5.a, 5.b)
Number of indicators monitored: 10/14
SDG 5 envisages ensuring improved gender equality and empowering women and girls via nine targets monitored against 14 indicators. In Serbia, progress can be monitored under almost all targets (eight out of nine) based on ten indicators. The report presents the progress in achieving the following targets: 5.1 end all forms of discrimination against all women and girls everywhere, 5.2 eliminate all forms of violence against all women and girls, 5.3 eliminate all harmful practices, such as child, early and forced marriage and female genital mutilation, 5.4 recognize and value unpaid care and domestic work, 5.5 ensure women’s full and effective participation and equal opportunities for leadership at all levels of decision-making, 5.6 ensure universal access to sexual and reproductive health, 5.a undertake reforms to give women equal rights to economic resources, and 5.b enhance the use of enabling technology, in particular information and communications technology.
KEY FINDINGS
� Although it is not possible to monitor progress against the indicator measuring achievement of target 5.1 referring to establishing legal framework to end all forms of discrimination against all women and girls, the data against the existing indicators shows that this framework has been established to a large extent.
� The progress against indicators measuring achievement of target 5.2 relating to elimination of all forms of violence against all women and girls, also cannot be monitored due to the absence of time series.
� In regard to elimination of all harmful practices, such as child, early and forced marriage (target 5.3), the data shows significant movement away from the target concerning marriage before age 15, but that significant progress was achieved in terms of the number of women who were first married/in union before age 18.
� Significant progress was achieved under target 5.4 calling for recognising and valuing unpaid care and domestic work, due to the reduced proportion of time spent on unpaid domestic and care work.

180 Progress report on the implementation of Sustainable Development Goals by 2030 in the Republic of Serbia
� Significant progress was achieved in the area of women’s participation in decision-making (target 5.5). Progress was registered in respect of higher participation of women in the national parliament, and in connection with their increased share in leadership positions.
� Progress towards the target 5.6 calling for ensuring universal access to sexual and reproductive health services cannot be measured due to the lack of time series, however the 2019 data shows that there is still a number of women unable to independently make decisions regarding sexual relations, contraceptive use and reproductive health care.
� Progress in reforms focused on equal rights to economic resources cannot be monitored due to the lack of longitudinal data, but based on the data available, the level of protection of rights is relatively high.
� Significant progress was achieved in increasing the proportion of individuals who own a mobile telephone (target 5.b.1).
Target 5.1 End all forms of discrimination against all women and girls everywhere
Indicator 5.1.1 Whether or not legal frameworks are in place to promote, enforce and monitor gender equality (percentage of achievement 0–100)
The progress in ending all forms of discrimination against women and girls is monitored based on the indicator assessing the level of achievement (1–100)48 in developing legal framework to promote, enforce and monitor gender equality. According to the UN Women data, in Serbia the highest level of achievement was reached in the area of employment and economic benefit (100), followed by legal framework referring to marriage and family (72.7), while lowest achievement was identified in the area of violence against women (58.3).49
Target 5.2 Eliminate all forms of violence against all women and girls in the public and private spheres, including trafficking and sexual and other types of exploitation
Indicator 5.2.1 Proportion of ever-partnered women and girls aged 18 to 74 subjected to physical, sexual or psychological violence by a current or former intimate partner in the previous 12 months, by form of violence and by age
Indicator 5.2.2 Proportion of ever-partnered women and girls aged 18 to 74 subjected to sexual violence by persons other than an intimate partner in the previous 12 months, by age
48 The data was obtained from the questionnaires on the assessment of legal frameworks completed by the national Statistical Offices and/or National Women’s Machinery and lawyers/researchers in the area of gender equality. The questionnaire contains 45 “yes/no” questions in four legislative domains: (i) comprehensive legal frameworks and public life, (ii) violence against women, (iii) employment and economic benefits; and (iv) marriage and family.
49 Source: UN Women — UN database.

181Progress report on the implementation of Sustainable Development Goals by 2030 in the Republic of Serbia
SDG
5
The progress also cannot be monitored against the indicators 5.2.1 and 5.2.2 since the necessary monitoring data are available only for 2018, thus not allowing to track the change. The OSCE survey data on the wellbeing and safety of women shows that in the year prior to the study 9.2% of women were subjected to physical, sexual or psychological violence by a current or former intimate partner. Observed by age, the largest proportion of women subjected to violence by a partner in the previous 12 months was registered among women of 50 to 59 years of age, same among those aged 40–49. The survey data indicates that women from minorities and vulnerable groups are more at risk of violence: refugees or internally displaced women, women with disabilities, women from ethnic minorities, same as materially deprived women (Table 35, Annex 2).50
Chart 18: Indicator 5.2.1 Proportion of ever-partnered women and girls aged 18 to 74 subjected to physical, sexual or psychological violence by a current or former intimate partner in the previous 12 months, by age, 2018 (%)
Source: OSCE — Survey on the Wellbeing and Safety of Women, 2018
In the period of 12 months preceding the survey on the wellbeing and safety of women, 0.5% of women experienced some form of sexual violence by persons other than their intimate partner. Women in the population of refugees or displaced persons, materially deprived women, same as young women, were represented in a higher percentage than other groups of women exposed to this form of violence (Table 36, Annex 2).
50 Source: OSCE — Survey on the Wellbeing and Safety of Women, 2018.
9.2
7.4
9.0
10.9 11.8
7.6
0
2
4
6
8
10
12
14
Total 18–29 30–39 40–49 50–59 60–74

182 Progress report on the implementation of Sustainable Development Goals by 2030 in the Republic of Serbia
Target 5.3 Eliminate all harmful practices, such as child, early and forced marriage and female genital mutilation
Indicator 5.3.1a Proportion of women aged 20–24 years who were married or in a union before age 15
Indicator 5.3.1b Proportion of women aged 20–24 years who were married or in a union before age 18
Target 5.3 envisaging elimination of all harmful practices, such as child, early and forced marriage, is monitored in Serbia against two indicators: proportion of women aged 20–24 years who were married or in a union before the age of 15 and indicator measuring the proportion of women aged 20–24 years who were married or in a union before the age of 18. Based on this indicator, moderate movement away from the target is registered both in short-term and long-term. Namely, in 2005, 2010 and 2014, there were 0.8% of women in this age group who were married or in a union before the age of 15, while in 2019 the proportion equaled 1.2% (Chart 19). This means that the value of the long-term compound annual growth rate was 8.45%, thus indicating significant movement away from the target (Table 37, Annex 2).51
Against the second indicator, significant progress towards the target was recorded, given the compound annual growth rate of -2.98% long-term, and of -4.16% short-term, due to the declining number of women who were married or in a union before the age of 18 (Chart 19, Table 28 in Annex 2).
Chart 19: Indicator 5.3.1 Proportion of women aged 20–24 years who were married or in a union before age 18 (%)
Source: Multiple Indicator Cluster Survey (MICS), SORS and UNICEF
51 Source: Multiple Indicator Cluster Survey (MICS), SORS and UNICEF.
0.8 0.8 0.8 1.2
8.4 7.7
6.8
5.5
0
1
2
3
4
5
6
7
8
9
2005 2010 2014 2019
Before age 15 Before age 18

183Progress report on the implementation of Sustainable Development Goals by 2030 in the Republic of Serbia
SDG
5
Significant progress against both indicators was registered among women living in urban settlements, same as in women from the wealthiest households, whereas moderate progress was recorded among women living in Roma settlements. At the same time, significant movement away from the target was noted among women living in settlements marked as “other”, in the poorest households, as well as among women who have completed primary school only or have no education at all (Tables 37 and 39, Annex 2).
Target 5.4 Recognize and value unpaid care and domestic work through the provision of public services, infrastructure and social protection policies and the promotion of shared responsibility within the household and the family as nationally appropriate
Indicator 5.4.1 Proportion of time spent on unpaid domestic and care work, by sex, age and location
The proportion of time spent on unpaid domestic and care work registers a significant decline both for women and men age 15 years and older. However, it is important to bear in mind that women spend in this type of work on average considerably more time than men (Chart 20). The increased time spent in this type of work was noted for young women and slightly more for young men, while the decline was recorded for women and men in older generations (Table 39, Annex 2).52
Chart 20: Indicator 5.4.1 Proportion of time spent on unpaid domestic and care work, by sex, 2010–2015 (%)
Source: Time Use Survey (TUS), SORS
52 Source: Time Use Survey (TUS), SORS.
15.2 14.1
20.2 19.2
9.5 8.7
0
5
10
15
20
25
2010 2015
Total Female Male

184 Progress report on the implementation of Sustainable Development Goals by 2030 in the Republic of Serbia
Target 5.5 Ensure women’s full and effective participation and equal opportunities for leadership at all levels of decision-making in political, economic and public life
Indicator 5.5.1 Proportion of seats held by women in national parliament
Indicator 5.5.2 Proportion of women in managerial positions
Significant progress was made towards the target defining as development priority increased participation of women in decision-making in political, business and public life. According to the indicator measuring the proportion of women in the National Assembly of the Republic of Serbia, significant progress was achieved at the compound annual growth rate of 7.82 (Chart 21).53
Chart 21: Indicator 5.5.1 Proportion of seats held by women in national parliament (%)
Source: Elections for the Members of Parliament, SORS
Significant progress in this area was reached against the indicator 5.2.2 measuring proportion of women in managerial positions54, at the compound annual growth rate of 4.62% (Table 40, Annex 2).
53 Source: Elections for the Members of Parliament, SORS.54 The indicator measures the share of female board members in the largest publicly listed companies traded on the stock exchange.
Major companies cover market capitalisation and/or market trade. Only companies which are registered in the country concerned are counted. Board members cover all members of the highest decision-making body in each company. The highest decision-making body is usually termed the supervisory board (in case of a two-tier governance system) or the board of directors (in a unitary system). Executives refer to senior executives in the two highest decision-making bodies of the largest (max. 50) nationally registered companies listed on the national stock exchange.
0
5
10
15
20
25
30
35
40
12.4 10.8 11.6
20.4 21.2
33.2 34.0 35.6
2002 2004 2005 2007 2008 2012 2014 2016

185Progress report on the implementation of Sustainable Development Goals by 2030 in the Republic of Serbia
SDG
5
Target 5.6 Ensure universal access to sexual and reproductive health and reproductive rights as agreed in accordance with the Programme of Action of the International Conference on Population and Development and the Beijing Platform for Action and the outcome documents of their review conferences
Indicator 5.6.1 Proportion of women aged 15–49 years who make their own informed decisions regarding sexual relations, contraceptive use and reproductive health care
The progress towards target 5.6 cannot be monitored due to the lack of time series. The data compiled under 2019 Multiple Indicator Cluster Survey (MICS) shows that 84.2% of women in the overall population and 67.7% of women in Roma settlements make their own informed decisions regarding sexual relations, contraceptive use and reproductive health care. Disparity is present depending on the education and marital status of women (Table 41, Annex 2).55
Target 5.a Undertake reforms to give women equal rights to economic resources, as well as access to ownership and control over land and other forms of property, financial services, inheritance and natural resources, in accordance with national laws
Indicator 5.a.2 Proportion of countries where the legal framework (including customary law) guarantees women’s equal rights to land ownership and/or control
The indicator 5.a.2 measures the extent to which a country’s legal (including customary law) guarantees women’s equal rights to land ownership and/or control. Measuring is conducted through six indicators of international law and internationally accepted good practices, notably the Convention on the Elimination of Discrimination against Women (CEDAW). The indicator measures the achievement by scores 1–6, where 1 implies no evidence of guarantees of gender equality in land ownership and/or control in the legal framework; and score 6 denotes highest levels of guarantees of gender equality in land ownership and/or control in the legal framework. Based on this measurement, Serbia scored 5 in 2019.56
55 Source: Multiple Indicator Cluster Survey (MICS), SORS and UNICEF.56 Source: Republic Geodetic Authority — Real property cadastre.
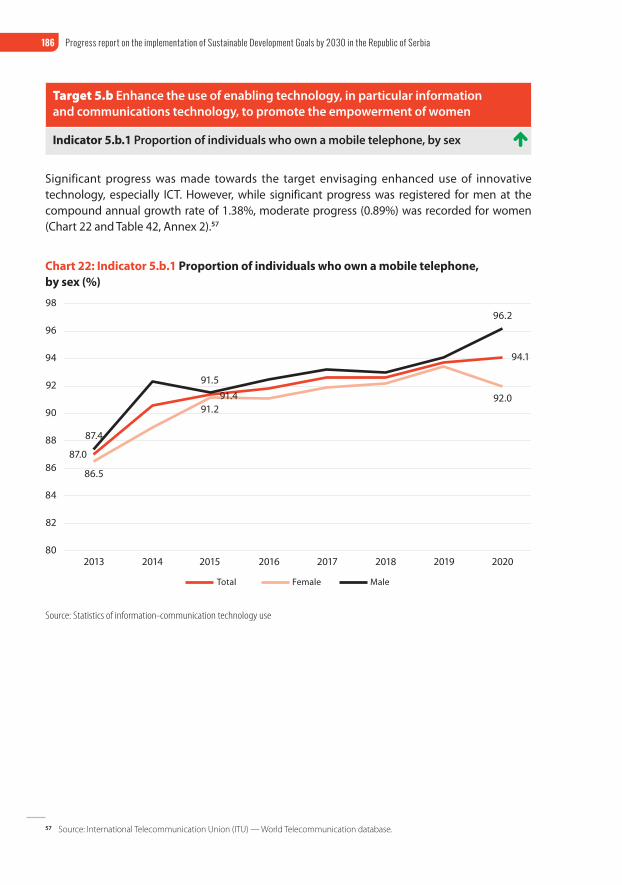
186 Progress report on the implementation of Sustainable Development Goals by 2030 in the Republic of Serbia
Target 5.b Enhance the use of enabling technology, in particular information and communications technology, to promote the empowerment of women
Indicator 5.b.1 Proportion of individuals who own a mobile telephone, by sex
Significant progress was made towards the target envisaging enhanced use of innovative technology, especially ICT. However, while significant progress was registered for men at the compound annual growth rate of 1.38%, moderate progress (0.89%) was recorded for women (Chart 22 and Table 42, Annex 2).57
Chart 22: Indicator 5.b.1 Proportion of individuals who own a mobile telephone, by sex (%)
Source: Statistics of information-communication technology use
57 Source: International Telecommunication Union (ITU) — World Telecommunication database.
87.0
91.4
94.1
87.4
91.5
96.2
86.5
91.2 92.0
80
82
84
86
88
90
92
94
96
98
2013 2014 2015 2016 2017 2018 2019 2020
Total Male Female

Progress report on the implementation of Sustainable Development Goals by 2030 in the Republic of Serbia 187
SDG 6ENSURE AVAILABILITY AND SUSTAINABLE
MANAGEMENT OF WATER AND SANITATION FOR ALL
Number of targets monitored: 4/8 (6.3, 6.4, 6.a, 6.b)
Number of indicators monitored: 6/11
SDG 6 calls for ensuring availability and sustainable management of water and sanitation for all. This goal includes eight targets monitored against 11 indicators. For the time being, in Serbia progress can be monitored in relation to four targets against six indicators. The report presents the progress in achieving the following targets: 6.3 improve water quality by reducing pollution, 6.4 substantially increase water-use efficiency, 6.a expand international cooperation and capacity-building support in water- and sanitation-related activities and programmes, and 6.b support and strengthen the participation of local communities in improving water and sanitation management.
KEY FINDINGS
� Significant progress was made in relation to target 6.3 envisaging improved water quality by reducing pollution and reducing the proportion of untreated wastewater, measured by population connected to urban wastewater treatment with at least secondary treatment.
� Moderate movement away from the target was achieved under target 6.4 in terms of change in water-use efficiency over time, and significant movement away from target based on ensuring sustainable withdrawals and supply of freshwater to address water scarcity and substantially reduce the number of people suffering from water scarcity.
� In connection with target 6.a stipulating expanding international cooperation and capacity-building support in water- and sanitation-related activities and programmes, significant progress was registered due to the increased amount of water- and sanitation-related official development assistance that is part of a government-coordinated spending plan.
� Regarding target 6.b defining support to local communities in improving water and sanitation management, major achievement has been registered. This target was reached against all four indicators.

188 Progress report on the implementation of Sustainable Development Goals by 2030 in the Republic of Serbia
Target 6.2 By 2030, achieve access to adequate and equitable sanitation and hygiene for all and end open defecation, paying special attention to the needs of women and girls and those in vulnerable situations
Indicator 6.2.1 Proportion of population using safely managed sanitation services, including a hand-washing facility with soap and water
Progress towards target 6.2 cannot be monitored since only the 2019 data are available based on the MICS survey. According to these data, 15.2% of households in Serbia have access to sanitation enabling removal of hazardous substances outside the household for treatment.
Target 6.3 By 2030, improve water quality by reducing pollution, eliminating dumping and minimizing release of hazardous chemicals and materials, halving the proportion of untreated wastewater and substantially increasing recycling and safe reuse globally
Indicator 6.3.1 Population connected to urban wastewater treatment with at least secondary treatment
The percentage of population connected to urban wastewater treatment is on the slow increase in the past eight years, with the tendency of further growth. The data shows that the percentage of population connected to urban wastewater treatment increased in long-term (2010–2018) from 8.6% to 12.9%, but also in short-term. In fact, major progress was achieved in the period between 2015 and 2016 (Chart 23).58
Chart 23: Indicator 6.3.1 Population connected to urban wastewater treatment with at least secondary treatment (%)
Source: Environmental statistics and accounts, SORS
58 Source: Environmental statistics and accounts, SORS.
8.6 8.8 9.0 9.4 10.0
10.8
12.5 12.6 12.9
0
2
4
6
8
10
12
14
2010 2011 2012 2013 2014 2015 2016 2017 2018

189Progress report on the implementation of Sustainable Development Goals by 2030 in the Republic of Serbia
SDG
6
Target 6.4 By 2030, substantially increase water-use efficiency across all sectors and ensure sustainable withdrawals and supply of freshwater to address water scarcity and substantially reduce the number of people suffering from water scarcity
Indicator 6.4.1 Change in water-use efficiency (WUE) over time
Indicator 6.4.2 Water exploitation index (WEI) by type of water source
The indicator 6.4.1 provides information on the water-use efficiency from economic and social perspectives. Bearing in mind that in the period 2015–2018 negative compound annual growth rate of -0.35% was registered, it may be concluded that moderate movement away from the target occurred. Namely, in 2015, WUE amounted to 705.31 RSD/m3, whereas in 2018 its value slightly dropped to 697.98 RSD/ m3 (Chart 24).59
Chart 24: Indicator 6.4.1 Change in water-use efficiency (WUE) over time, 2015–2018 (RSD/m3)
Source: Environmental statistics and accounts, SORS
Water stress affects countries in all continents and hinders sustainability of natural resources, as well as economic and social development. Republic of Serbia is wealthy in water resources and uses their relatively small share, which is demonstrated in moderate movement away from the target measured by the water exploitation index (WEI)60. This is indicated by the long-term (1990–2018) compound annual growth rates of 0.32% (the value increased from 2.96% to 3.24%). Significant movement away from the target is registered short-term (2015–2018) with compound annual growth rate of 6.01% (the value increased from 2.72% to 3.24%).61
59 Source: Environmental statistics and accounts, SORS.60 Water exploitation index (WEI) is the ratio between total freshwater withdrawn by all major sectors and total renewable freshwater
resources. This is the indicator of stress of freshwater withdrawal as a proportion of available freshwater resources at national level.61 Source: Environmental statistics and accounts, SORS.
705.31
731.47
680.95
697.98
650
660
670
680
690
700
710
720
730
740
2015 2016 2017 2018

190 Progress report on the implementation of Sustainable Development Goals by 2030 in the Republic of Serbia
Chart 25: Indicator 6.4.2 Water exploitation index (WEI), (%)
Source: Environmental statistics and accounts, SORS
Target 6.a By 2030, expand international cooperation and capacity-building support to developing countries in water- and sanitation-related activities and programmes, including water harvesting, desalination, water efficiency, wastewater treatment, recycling and reuse technologies
Indicator 6.a.1 Amount of water- and sanitation-related official development assistance that is part of a government-coordinated spending plan
Adequate financial resources are crucial for the achievement of SDG 6 by 2030, either by attracting new sources or by better utilization of the existing resources. The proportion of total expenditures for official development assistance (ODA) for the water sector includes assistance for drinking water supply, sanitation and hygiene, same as assistance in other areas like agricultural water resources, flood protection and hydro power. The level of official development assistance62 targeting water supply and sanitation as a part of the government-coordinated spending plan was increased from USD 55,7899 (in 2000) to 58,3087 million at 2016 constant prices (in 2016), thus producing the compound annual growth rate of 0.28%. In this case, progress was more intensive in the period following the 2030 Agenda adoption (2015–2016), with the compound
62 Amount of water- and sanitation-related official development assistance that is part of a government-coordinated spending plan is defined as the proportion of total water and sanitation-related Official Development Assistance (ODA) disbursements that are included in the government budget. The indicator is calculated as the proportion of total water and sanitation-related Official Development Assistance (ODA) disbursements that are included in the government budget, i.e. the amount of water- and sanitation-related official development assistance that is part of a government-coordinated spending plan is divided by the total water and sanitation-related ODA.
2.96
3.24
0
0.5
1
1.5
2
2.5
3
3.5
1990
1995
1996
1997
1998
1999
2000
2001
2002
2003
2004
2005
2006
2007
2008
2009
2010
2011
2012
2013
2014
2015
2016
2017
2018

191Progress report on the implementation of Sustainable Development Goals by 2030 in the Republic of Serbia
SDG
6
annual growth rate of 57.97%, due to the considerable increase between these two years from USD 36,9122 to 58,9122 million in 2016 constant prices.63
Target 6.b Support and strengthen the participation of local communities in improving water and sanitation management
Indicator 6.b.1a Level of participation of service users/communities in urban/rural drinking water planning programmes (3 = High; 2 = Medium; 1 = Low; 0 = N/A)
Indicator 6.b.1b Level of definition in procedures for participation of service users/communities in the urban/rural drinking water planning programme (10 = Clearly defined; 5 = Not clearly defined; 0 = N/A)
Indicator 6.b.1c Level of participation of users/communities in water resource planning and management programmes (3 = High; 2 = Medium; 1 = Low; 0 = N/A)
Indicator 6.b.1d Level of definition in legal or policy procedures for the involvement of service users/communities in water resource planning and management (10 = Clearly defined; 5 = Not clearly defined; 0 = N/A)
Target 6.b is aimed at the participation of local communities in water and sanitation management. This is essential to ensure and meet the needs of local users and make local communities fully understand the effect of development decisions. This target was achieved, measured through four indicators: level of participation of service users/communities in urban/rural drinking water planning programmes, level of definition in procedures for participation of service users/communities in the urban/rural drinking water planning programmes, level of participation of users/communities in water resource planning and management programmes and level of definition in legal or policy procedures for the involvement of service users/communities in water resource planning and management (Table 47 in Annex 2).64
63 Source: GLAAS — UN-Water Global Analysis and Assessment of Sanitation and Drinking-Water.64 Source: GLAAS — UN-Water Global Analysis and Assessment of Sanitation and Drinking-Water.


Progress report on the implementation of Sustainable Development Goals by 2030 in the Republic of Serbia 193
SDG 7ENSURE ACCESS TO AFFORDABLE,
RELIABLE, SUSTAINABLE AND MODERN ENERGY FOR ALL
Number of targets monitored: 2/5 (7.1, 7.3)
Number of indicators monitored: 3/6
SDG 7 envisages ensuring access to affordable, reliable, sustainable and modern energy for all via five targets monitored against six indicators. Currently, in Serbia progress can be monitored in relation to two targets against three indicators. The report presents the progress in achieving the following targets: 7.1 ensure universal access to affordable, reliable and modern energy services and 7.3 by 2030, double the global rate of improvement in energy efficiency.
KEY FINDINGS
� Moderate progress in achieving the first target is registered owing to the significant increase in the proportion of population with access to electricity.
� Significant movement away from the target is registered in connection with target 7.3 envisaging doubling the global rate of improvement in energy efficiency by 2030.
Target 7.1 By 2030, ensure universal access to affordable, reliable and modern energy services
Indicator 7.1.1 Proportion of population with access to electricity
Indicator 7.1.2 Proportion of population with primary reliance on clean fuels and technology
Moderate progress is owed to the significant increase in the proportion of population with access to electricity65 in total, in urban and other settlements, same as in Roma settlements66 (Chart 26).
65 The ratio of the number of inhabitants who have electricity in their household (answer to the question HC8.A, Household Questionnaire) and the total number of inhabitants, expressed in percentages.
66 Source: Multiple Indicator Cluster Survey (MICS), SORS and UNICEF.

194 Progress report on the implementation of Sustainable Development Goals by 2030 in the Republic of Serbia
Chart 26: Indicator 7.1.1 Proportion of population with access to electricity, Serbia total, urban, other and Roma settlements, 2010–2019 (%)
Source: Multiple Indicator Cluster Survey (MICS), SORS and UNICEF
Significant movement away from the target is recorded against the indicator (7.1.2) measuring proportion of population with primary reliance on clean fuels and technology67. The data shows a constant drop in the proportion in urban and other settlements, but also in Roma settlements68 (Chart 27 and Table 49, Annex 2).
Chart 27: Indicator 7.1.2 Proportion of population with primary reliance on clean fuels and technology
Source: Multiple Indicator Cluster Survey (MICS), SORS and UNICEF
67 The indicator represents population with primary reliance to clean fuels and technology (electricity, liquefied petroleum gas (LPG) and natural gas) for cooking, in relation to the overall population, expressed as percentage.
68 Source: Multiple Indicator Cluster Survey (MICS), SORS and UNICEF.
99.8 99.7 99.8
96.9
89.3
98.3
84
86
88
90
92
94
96
98
100
102
2010 2014 2019
Total Roma settlements
85.6 82.3
69.4
24.3 17.7
12.4
0
20
40
60
80
100
2010 2014 2019
Total Roma settlements
68.3
65.7
52.4 47.2
41.5
28.5
0
20
40
60
80
100
2010 2014 2019
Urban Other

195Progress report on the implementation of Sustainable Development Goals by 2030 in the Republic of Serbia
SDG
7
Target 7.3 By 2030, double the global rate of improvement in energy efficiency
Indicator 7.3.1 Energy intensity measured in terms of primary energy and GDP
Significant movement away from the target is registered in respect to energy intensity measured by primary energy and GDP69, where this value declined from 6.71 MJ/USD70 in 2010 to 6.09 MJ/USD in 2017.71
69 Energy intensity is defined as the total energy supplied to the economy per unit value of economic output. It is measured in Megajoules per United States Dollar. Energy intensity is an indication of how much energy is used to produce one unit of economic output.
70 Megajoules per United States Dollar is calculated applying the average annual US Dollar exchange rate.71 Source: Energy statistics, SORS, National accounts, SORS and United Nations.


Progress report on the implementation of Sustainable Development Goals by 2030 in the Republic of Serbia 197
SDG 8PROMOTE SUSTAINED, INCLUSIVE AND
SUSTAINABLE ECONOMIC GROWTH, FULL AND PRODUCTIVE EMPLOYMENT AND
DECENT WORK FOR ALL
Number of targets monitored: 7/12 (8.1, 8.3, 8.4, 8.5, 8.6, 8.7, 8.10)
Number of indicators monitored: 8/17
SDG 8 promotes sustained, inclusive and sustainable economic growth, full and productive employment and decent work for all. This goal includes 12 targets monitored against 17 indicators. Currently in Serbia progress can be monitored in relation to seven targets against eight indicators. The report presents the progress in achieving the following targets: 8.1 sustain economic growth, 8.3 promote development-oriented policies that support productive activities, decent job creation, entrepreneurship, creativity and innovation, 8.4 improve global efficiency of resources, 8.5 achieve full and productive employment, 8.6 by 2020, substantially reduce the proportion of youth not in employment, education or training, 8.7 take immediate and effective measures to eradicate forced labour and child labour, and 8.10 strengthen the capacity of domestic financial institutions to encourage and expand access to banking, insurance and financial services.
KEY FINDINGS
� Significant short-term progress was achieved under target 8.1 envisaging sustaining per capita economic growth.
� Reduced informal employment in non-agricultural activities has contributed to a significant progress in achieving target 8.3 calling for promotion of development-oriented policies and decent job creation.
� Inconsistent trends are registered in the use of resources (target 8.4). While significant movement away from the target is recorded in regard to domestic material consumption, moderate progress is registered in resource productivity.
� Achievement of productive employment and decent work can be measured only via unemployment rates, indicating also significant progress towards the target.
� Reduced proportion of youth not in education, employment or training was registered, demonstrating significant progress in achieving target 8.6.

198 Progress report on the implementation of Sustainable Development Goals by 2030 in the Republic of Serbia
� Due to the slight increase in child labour prevalence, moderate movement away from the target 8.7 has been recorded.
� When it comes to capacity-building of domestic financial institutions (target 8.10), opposing tendencies are registered — significant movement away from the target in terms of the number of commercial bank branches per 100,000 adults, and significant progress towards the target regarding the number of automated teller machines (ATMs) per 100,000 adults.
Target 8.1 Sustain per capita economic growth in accordance with national circumstances and, in particular, at least 7 per cent gross domestic product growth per annum in the least developed countries
Indicator 8.1.1 Annual growth rate of real GDP per capita
Significant progress was registered in regard to target 8.1 given that in the period 2015–2018 positive annual real GDP growth rates were reached at the compound annual growth rate of 18.27% (Table 51, Annex 2).72 However, in this period growth rate increase was not continuous, since in 2017 growth rate was lower compared to 2016, same as in 2019 in comparison with 201873 (Chart 28).
Chart 28: Indicator 8.1.1 Annual growth rate of real GDP per capita, 2010–2019
Source: National accounts, SORS
72 Annual growth rate of real Gross Domestic Product (GDP) per capita is calculated as the percentage change in the real GDP per capita between two consecutive years.
73 Source: National accounts, SORS.
1.1
2.3
4.5
-2
-1
0
1
2
3
4
5
6
2010 2011 2012 2013 2014 2015 2016 2017 2018 2019

199Progress report on the implementation of Sustainable Development Goals by 2030 in the Republic of Serbia
SDG
8
Target 8.3 Promote development-oriented policies that support productive activities, decent job creation, entrepreneurship, creativity and innovation, and encourage the formalization and growth of micro-, small- and medium-sized enterprises, including through access to financial services
Indicator 8.3.1 Proportion of informal employment in non-agriculture employment, by sex
This target can currently be monitored only against the indicator measuring proportion of informal employment in non-agriculture employment. The data shows that in the period 2015–2019, significant progress was made in achieving this target, thus making a positive change compared to the long-term informal employment growth trend (Chart 29). Positive changes are registered both for female and for male labour force74 (Table 52, Annex 2).
Chart 29: Indicator 8.3.1 Proportion of informal employment in non-agriculture employment, by sex (%)
Source: Labour Force Survey, SORS
74 Source: Labour Force Survey, SORS.
8.1
8.2
6.2
5.8
9.6
10.2
0
2
4
6
8
10
12
14
2014 2015 2016 2017 2018 2019
Total Female Мale

200 Progress report on the implementation of Sustainable Development Goals by 2030 in the Republic of Serbia
Target 8.4 Improve progressively, by 2030, global resource efficiency in consumption and production and endeavour to decouple economic growth from environmental degradation, in accordance with the 10-Year Framework of Programmes on Sustainable Consumption and Production, with developed countries taking the lead
Indicator 8.4.2a Domestic material consumption (DMC)
Indicator 8.4.2b Resource productivity
Quite opposite trends are recorded in regard to target 8.4. While significant movement away from the target was achieved in respect to domestic material consumption in the period 2015–2018, moderate positive trend was registered in productivity75 (Tables 53 and 54, Annex 2).
Target 8.5 By 2030, achieve full and productive employment and decent work for all women and men, including for young people and persons with disabilities, and equal pay for work of equal value
Indicator 8.5.1a Average hourly earnings of female and male employees, by age
Indicator 8.5.1b Average hourly earnings of female and male employees, by occupation
Indicator 8.5.2a Unemployment rate (15–24 years of age)
Indicator 8.5.2b Unemployment rate (15–64 years of age)
This target is monitored against indicators measuring average hourly earnings of female and male employees of different age and occupation. The data for this indicator are gathered based on the Structure of Earnings Survey conducted every four years. For now, the data are available only for 2014, therefore it is not possible to monitor the trend. However, based on the average earnings for women and men of different age and occupation presented in Tables 55 and 56 in Annex 2, it may be concluded that gender disparities are consistent in all categories, in favour of men.
In addition to earnings, the progress in achieving this target is monitored via the unemployment rates. Both the long-term and short-term trends demonstrate significant progress due to the drop in unemployment rates in young population (aged 15–24), same as in working population (aged 15–64) (Table 57, Annex 2). Positive trends are recorded for both women and men76 (Chart 30a and 30b).
75 Source: Environmental statistics and accounts, SORS.76 Source: Labour Force Survey, SORS.

201Progress report on the implementation of Sustainable Development Goals by 2030 in the Republic of Serbia
SDG
8
Chart 30a: Indicator 8.5.2a Unemployment rate (aged 15–24)
Source: Labour Force Survey, SORS
Chart 30b: Indicator 8.5.2b Unemployment rate (aged 15–64)
Source: Labour Force Survey, SORS
47.5
27.5
50
29.9
46.1
26.1
0
10
20
30
40
50
60
2014 2015 2016 2017 2018 2019
Total Female Мale
19.9
10.9
21.0
11.5
19.1
10.4
0
5
10
15
20
25
2014 2015 2016 2017 2018 2019
Total Female Male

202 Progress report on the implementation of Sustainable Development Goals by 2030 in the Republic of Serbia
Target 8.6 By 2020, substantially reduce the proportion of youth not in employment, education or training
Indicator 8.6.1 Proportion of youth (aged 15–24) not in education, employment or training
Significant progress towards its achievement of the target was registered by reduced proportion of youth not in education, employment or training both in female and male population (Chart 31).
Chart 31: Indicator 8.6.1 Proportion of youth (aged 15–24) not in education, employment or training* (%)
Source: Labour Force Survey, SORS* NEET indicator
Target 8.7 Take immediate and effective measures to eradicate forced labour, end modern slavery and human trafficking and secure the prohibition and elimination of the worst forms of child labour, including recruitment and use of child soldiers, and by 2025 end child labour in all its forms
Indicator 8.7.1 Proportion and number of children aged 5–17 years engaged in child labour, by sex and age
Due to the slight increase in child labour prevalence, moderate movement away from this target was recorded. Increased prevalence was registered in girls, in urban population and in Roma settlements, in the age 5–11, for children who are in education and live in households that are not poor (Table 60, Annex 2). At the same time, reduced child labour is registered for the groups of children where the prevalence was highest, like for boys living in rural settlements.
20.4
15.3
19.9
15.8
21
14.8
10
12
14
16
18
20
22
2014 2015 2016 2017 2018 2019
Total Female Мale

203Progress report on the implementation of Sustainable Development Goals by 2030 in the Republic of Serbia
SDG
8
Target 8.10 Strengthen the capacity of domestic financial institutions to encourage and expand access to banking, insurance and financial services for all
Indicator 8.10.1a Number of commercial bank branches per 100,000 adults
Indicator 8.10.1b Number of automated teller machines (ATMs) per 100,000 adults
Regarding the target 8.10 monitoring progress in capacity building and availability of domestic financial institutions, inconsistent trends were registered. Namely, significant movement away from the target is registered in the number of commercial bank branches per 100,000 adults (indicator 8.10.a), while significant progress is notable in regard to the number of automated teller machines (ATMs) per 100,000 adults (indicator 8.10.b) (Tables 61 and 62, Annex 2).


Progress report on the implementation of Sustainable Development Goals by 2030 in the Republic of Serbia 205
SDG 9BUILD RESILIENT INFRASTRUCTURE,
PROMOTE INCLUSIVE AND SUSTAINABLE
INDUSTRIALIZATION AND FOSTER INNOVATION
Number of targets monitored: 3/8 (9.2, 9.5, 9.с)
Number of indicators monitored: 5/12
SDG 9 calls for building resilient infrastructure and promoting inclusive and sustainable industrialization and fostering innovation. This goal includes eight targets monitored against 12 indicators. Based on the data, three targets against five indicators can be monitored in Serbia. The report presents the progress in achieving the following targets: 9.2 promote inclusive and sustainable industrialization and, by 2030, significantly raise industry’s share of employment and gross domestic product, 9.5 enhance scientific research, upgrade the technological capabilities of industrial sectors, and 9.csignificantly increase access to information and communications technology.
KEY FINDINGS
� Promoting inclusive and sustainable industrialization and significantly raising industry’s share of employment and gross domestic product (target 9.2) shows moderate progress against the indicator measuring manufacturing value added as a proportion of GDP per capita, and significant progress against the indicator measuring manufacturing employment as a proportion of total employment.
� Enhancing scientific research and upgrading the technological capabilities of industrial sectors (target 9.5) is visible due to the significant increase in the total research and development expenditure as a proportion of GDP, same as due to the moderate increase in the number of researchers.
� Significant progress was achieved in relation to the proportion of population covered by 3G and 4G mobile networks.

206 Progress report on the implementation of Sustainable Development Goals by 2030 in the Republic of Serbia
Target 9.2 Promote inclusive and sustainable industrialization and, by 2030, significantly raise industry’s share of employment and gross domestic product, in line with national circumstances, and double its share in least developed countries
Indicator 9.2.1 Manufacturing value added as a proportion of GDP per capita
Indicator 9.2.2 Manufacturing employment as a proportion of total employment
While the long-term trend (1995–2018) shows decline in industrial sector in Serbia (Chart 32), the short-term trend (2015–2018), linked to the implementation of the 2030 Agenda, shows positive tendencies. Namely, manufacturing value added (MVA) as a proportion of gross domestic product (GDP) per capita77 indicates a slight growth from 15.6% to 15.8%, however still remaining under the 1995 level when it equalled 17%.78
Chart 32: Indicator 9.2.1 Manufacturing value added as a proportion of GDP per capita, 1996–2018 (%)
Source: National accounts, SORS
Manufacturing employment (indicator 9.2.2) as a proportion of total employment also registers upward trend, from 16.1% in 2015 to 18.7% in 2018, thus producing a positive compound annual growth rate of 3.81% (Table 64, Annex 2).
77 Manufacturing value added (MVA) as a proportion of gross domestic product (GDP) per capita is a ratio between MVA and GDP, both reported in constant 2010 USD per capita.
78 Source: National accounts, SORS.
17.015.8
0
5
10
15
20
25
1995
1996
1997
1998
1999
2000
2001
2002
2003
2004
2005
2006
2007
2008
2009
2010
2011
2012
2013
2014
2015
2016
2017
2018

207Progress report on the implementation of Sustainable Development Goals by 2030 in the Republic of Serbia
SDG
9
Target 9.5 Enhance scientific research, upgrade the technological capabilities of industrial sectors in all countries, in particular developing countries, including, by 2030, encouraging innovation and substantially increasing the number of research and development workers per 1 million people and public and private research and development spending
Indicator 9.5.1 Research and development expenditure as a proportion of GDP, by sectors
Indicator 9.5.2 Researchers (in full-time equivalent) per million inhabitants
Significant progress is registered in increased investments in scientific research creating the basis for technological development of industrial sector79. The total research and development expenditure record both the long-term (at the compound annual growth rate of 4.28%) and the short-term (4.34%) increase (Table 65, Annex 2). However, the data show that the increase in research and development expenditure is registered in non-financial (business) and government sectors, but not in the sector of higher education where slightly declining expenditures were recorded80 (Chart 33).
Chart 33: Indicator 9.5.1 Research and development expenditure as a proportion of GDP by sectors (%)
Source: Science, technology and innovation statistics, SORS
79 This indicator shows how much of GDP is used for research and development in general: government sector, higher education sector, business sector and non-profit sector, expressed as their percentage share in GDP.
80 Source: Science, technology and innovation statistics, SORS.
0.58
0.92
0.01
0.36
0.330.30
0.24 0.26
0
0.1
0.2
0.3
0.4
0.5
0.6
0.7
0.8
0.9
1
2007 2008 2009 2010 2011 2012 2013 2014 2015 2016 2017 2018
Total Non-financial (business) sector
Higher education sector Government sector

208 Progress report on the implementation of Sustainable Development Goals by 2030 in the Republic of Serbia
Moderate progress towards target 9.5 is visible in the increased number of researchers in the population81. The number of researchers in long-term (2007–2018) grew at the rate of 4.49%, and in short-term (2015–2018) at the rate of 0.27%. While in 2007 there were 1,433 employed researchers (in full-time equivalent) per one million inhabitants, in 2015 there were 2,303, and in 2018 2,322 of them.
Target 9.c Significantly increase access to information and communications technology and strive to provide universal and affordable access to the Internet in least developed countries by 2020
Indicator 9.c.1 Proportion of population covered by a mobile network, by technology
Significant progress was achieved in relation to improved access of population to information and communication technology82 (Table 67, Annex 2). In 2019, 2G mobile network covered 99.16%, 3G 98.88%, whereas 4G covered 96.86% of the population.83
81 The researchers (in full-time equivalent) per million inhabitants is a direct measure of the number of research and development workers per 1 million people.
82 The Regulatory Agency for Electronic Communications and Postal Services (RATEL) collects and processes data from operators of electronic communications networks and services, submitted within the annual reports. Based on the submitted reports, data on the coverage of the population by mobile network signal according to technologies (2G, 3G and 4G) is presented as a percentage of inhabitants living in the territory covered by the signal of the specific mobile network, regardless of whether they are subscribers or not of any of these networks.
83 Source: Regulatory Agency for Electronic Communications and Postal Services (RATEL).

Progress report on the implementation of Sustainable Development Goals by 2030 in the Republic of Serbia 209
SDG 10REDUCE INEQUALITY WITHIN AND AMONG
COUNTRIES
Number of targets monitored: 3/10 (10.1, 10.3, 10.4)
Number of indicators monitored: 3/11
SDG 10 calls for reduced inequality within and among countries through ten targets monitored against 11 indicators. Currently in Serbia progress can be monitored based on the available data in relation to three targets against three indicators. The report presents the progress in achieving the following targets: 10.1 progressively achieve and sustain income growth of the bottom 40 per cent of the population at a rate higher than the national average, 10.3 ensure equal opportunity and reduce inequalities of outcome, including by eliminating discriminatory laws, policies and practices, and 10.4 adopt policies, especially fiscal, wage and social protection policies, and progressively achieve greater equality.
KEY FINDINGS
� Out of the three targets under SDG 10 data is available for, it is possible to measure the compound annual growth rate for one target only (10.4), whereas for the remaining two (10.1 and 10.3) data is available for one year only therefore making it impossible to calculate the change trend.
� Significant progress is registered in target 10.4 calling for adoption of policies, especially fiscal, wage and social protection policies, and progressive achievement of greater equality.
Target 10.1 By 2030, progressively achieve and sustain income growth of the bottom 40 per cent of the population at a rate higher than the national average
Indicator 10.1.1 Growth rates of household expenditure or income per capita among the bottom 40 per cent of the population and the total population
The data used to measure progress against indicator 10.1.1 are available only for the period 2012–2014, meaning they do not indicate progress during the 2030 Agenda implementation period. In addition, the target itself is defined as a rate, therefore not enabling calculation of
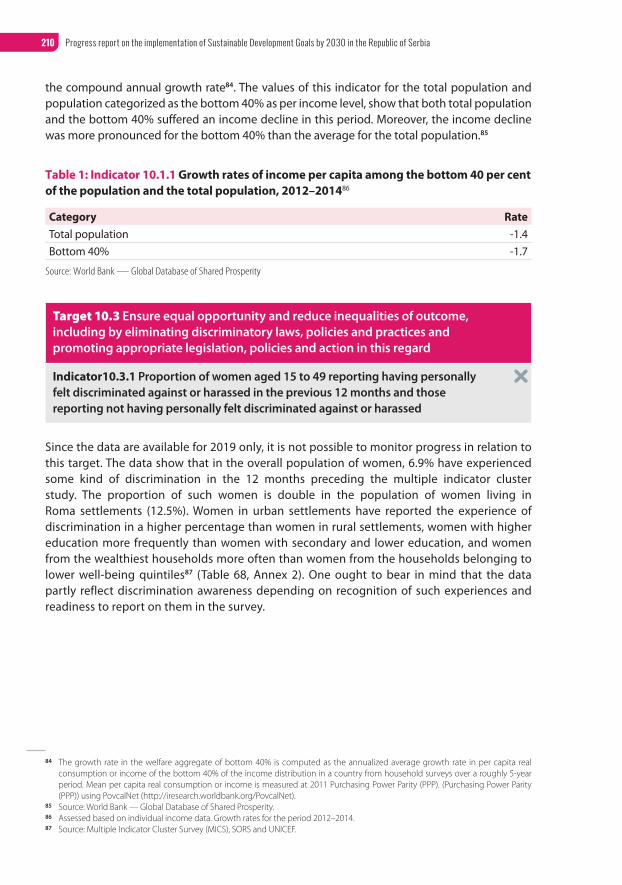
210 Progress report on the implementation of Sustainable Development Goals by 2030 in the Republic of Serbia
the compound annual growth rate84. The values of this indicator for the total population and population categorized as the bottom 40% as per income level, show that both total population and the bottom 40% suffered an income decline in this period. Moreover, the income decline was more pronounced for the bottom 40% than the average for the total population.85
Table 1: Indicator 10.1.1 Growth rates of income per capita among the bottom 40 per cent of the population and the total population, 2012–201486
Category Rate
Total population -1.4
Bottom 40% -1.7
Source: World Bank — Global Database of Shared Prosperity
Target 10.3 Ensure equal opportunity and reduce inequalities of outcome, including by eliminating discriminatory laws, policies and practices and promoting appropriate legislation, policies and action in this regard
Indicator10.3.1 Proportion of women aged 15 to 49 reporting having personally felt discriminated against or harassed in the previous 12 months and those reporting not having personally felt discriminated against or harassed
Since the data are available for 2019 only, it is not possible to monitor progress in relation to this target. The data show that in the overall population of women, 6.9% have experienced some kind of discrimination in the 12 months preceding the multiple indicator cluster study. The proportion of such women is double in the population of women living in Roma settlements (12.5%). Women in urban settlements have reported the experience of discrimination in a higher percentage than women in rural settlements, women with higher education more frequently than women with secondary and lower education, and women from the wealthiest households more often than women from the households belonging to lower well-being quintiles87 (Table 68, Annex 2). One ought to bear in mind that the data partly reflect discrimination awareness depending on recognition of such experiences and readiness to report on them in the survey.
84 The growth rate in the welfare aggregate of bottom 40% is computed as the annualized average growth rate in per capita real consumption or income of the bottom 40% of the income distribution in a country from household surveys over a roughly 5-year period. Mean per capita real consumption or income is measured at 2011 Purchasing Power Parity (PPP). (Purchasing Power Parity (PPP)) using PovcalNet (http://iresearch.worldbank.org/PovcalNet).
85 Source: World Bank — Global Database of Shared Prosperity.86 Assessed based on individual income data. Growth rates for the period 2012–2014.87 Source: Multiple Indicator Cluster Survey (MICS), SORS and UNICEF.

211Progress report on the implementation of Sustainable Development Goals by 2030 in the Republic of Serbia
SDG
10
Target 10.4 Adopt policies, especially fiscal, wage and social protection policies, and progressively achieve greater equality
Indicator 10.4.1 Labour share of GDP, comprising wages and social protection transfers
Significant progress is registered concerning target 10.4 based on the indicator measuring labour share in GDP88. In the period 2015–2018, the compound annual growth rate amounted to 1.29% since the labour share in GDP was increased from 38.45% to 39.9%.89
88 Labour share of Gross Domestic Product (GDP) is the total compensation of employees given as a percent of GDP, which is a measure of total output. The indicator provides information about the relative share of output which is paid as compensation to employees as compared with the share paid to capital in the production process for a given reference period.
89 Source: National accounts, SORS.


Progress report on the implementation of Sustainable Development Goals by 2030 in the Republic of Serbia 213
SDG 11MAKE CITIES AND HUMAN SETTLEMENTS INCLUSIVE,
SAFE, RESILIENT AND SUSTAINABLE
Number of targets monitored: 1/10 (11.6)
Number of indicators monitored: 1/15
SDG 11 defines necessary steps to make cities and human settlements inclusive, safe, resilient and sustainable. This goal includes ten targets monitored against 15 indicators. Currently in Serbia one target can be monitored against one indicator. This is target 11.6 Reduce the adverse per capita environmental impact of cities.
KEY FINDINGS
� Concerning the target 11.6 significant movement away from the target was registered, both due to the reduced rate of municipal waste recycling, and due to increased waste generation.
Target 11.6 By 2030, reduce the adverse per capita environmental impact of cities, including by paying special attention to air quality and municipal and other waste management
Indicator 11.6.1a Recycling rate of municipal waste
Indicator 11.6.1b Generation of waste excluding major mineral waste

214 Progress report on the implementation of Sustainable Development Goals by 2030 in the Republic of Serbia
Significant movement away from the target was registered due to the long-term and short-term increase in waste generated (Indicator 11.6.1b90), and at the same time, declining rate of municipal waste recycling (Indicator 11.6.1a91).92
In the period 2010–2018 waste generated per capita (Indicator 11.6.1b) increased from 1,307 kg to 1,707 kg, thus generating the compound annual growth rate of 3.39%. If the short-term trend (2015–2018) is concerned, this rate is even higher and equals 9.48%.
The data used to calculate the municipal waste recycling rate (Indicator 11.6.1a) are available for the period 2013–2016. According to these data, the rate declined from 1% of the total recycled municipal waste in 2013 to 0.3% in 2016, thus producing the compound annual growth rate of -33.06%93 (Table 70, Annex 2).
Chart 34: Indicator 11.6.1b Generation of waste excluding major mineral waste, by hazards, 2010–2018, in kg per capita
Source: Environmental statistics and accounts, SORS
90 The indicator presents the amount of waste, excluding major mineral wastes, generated in the country, expressed in kg per inhabitant and year. The indicator covers hazardous (hz) and non-hazardous (nh) waste from all economic sectors and from households, including waste from waste treatment (secondary waste) but excluding most mineral waste. The indicator is calculated by dividing the annual quantity of non-mineral waste generated in tons by average population number. The waste categories are listed in Annex I to the Waste Statistics Regulation (Regulation 2150/2002/EC).
91 Municipal waste means household waste, as well as other waste which is similar to household waste due to its nature or composition.92 Source: Environmental Protection Agency — Survey on Municipal Waste.93 Source: Environmental statistics and accounts, SORS.
1307 1372
1250 1293
1048
1301 1378
1673 1707
0
200
400
600
800
1000
1200
1400
1600
1800
2010 2011 2012 2013 2014 2015 2016 2017 2018

Progress report on the implementation of Sustainable Development Goals by 2030 in the Republic of Serbia 215
SDG 12ENSURE SUSTAINABLE CONSUMPTION
AND PRODUCTION PATTERNS
Number of targets monitored: 1/11 (12.2)
Number of indicators monitored: 1/13
SDG 12 envisages ensuring sustainable consumption and production patterns, through 11 targets monitored against 13 indicators. Currently in Serbia one target can be monitored against one indicator: 12.2 achieve the sustainable management and efficient use of natural resources
KEY FINDINGS
� Significant movement away from the target is registered in domestic material consumption, however moderate progress was recorded in resource productivity.
Target 12.2 By 2030, achieve the sustainable management and efficient use of natural resources
Indicator 12.2.2a Domestic material consumption (DMC)
Indicator 12.2.2b Resource productivity
SDG 12 is focused on separating economic growth from adverse environmental effects. Currently progress can be monitored only under target 12.2 that envisages achieving the sustainable management and efficient use of natural resources. This target is monitored against two indicators. First measures domestic material consumption94 and indicates continuous increase in natural resource exploitation, with the long-term compound annual growth rate of 0.88%, and the short-term equaling 2.71%. Expressed in nominal units, in 2010 domestic material consumption amounted to 110,776 thousand tonnes, in 2015 in was slightly reduced to 109,695 thousand tonnes, whereas in 2018 it was increased to 118,850 thousand tonnes.95
94 Domestic material consumption (DMC) measures annual amount of resources extracted and used in national economy, increased by the ratio of physical import and physical export.
95 Source: Environmental statistics and accounts, SORS.

216 Progress report on the implementation of Sustainable Development Goals by 2030 in the Republic of Serbia
The resource productivity indicator measures the quantity of products in terms of GDP produced in a given economy per unit of resources used96. The long-term compound annual growth rate shows significant progress towards this target with a compound annual growth rate of 1.59%, while the short-term progress indicates more moderate tendencies at the rate of 0.53%. Expressed in RSD, in the period observed an increase in the produced output value was identified compared to the resources extracted, from 28 RSD/kg in 2010, to 31 RSD/kg in 201897 (Chart 35).
Chart 35: Indicator 12.2.2b Resource productivity, RSD/kg
Source: Environmental statistics and accounts, SORS
96 Resource productivity is defined as proportion between gross domestic product (GDP) and domestic material consumption (DMC). Domestic material consumption (DMC) measures annual amount of resources extracted and used in national economy, increased by the ratio of physical import and physical export. In assessing resource productivity over time, GDP is expressed in RSD in constant prices (chained volume measures, reference year 2010).
97 Source: Environmental statistics and accounts, SORS.
27.7 27.9
30.5
28.9
30.0
30.9
29.3
31.4
31.4
25
26
27
28
29
30
31
32
2010 2011 2012 2013 2014 2015 2016 2017 2018

Progress report on the implementation of Sustainable Development Goals by 2030 in the Republic of Serbia 217
SDG 15PROTECT, RESTORE AND PROMOTE
SUSTAINABLE USE OF TERRESTRIAL ECOSYSTEMS, SUSTAINABLY MANAGE FORESTS, COMBAT DESERTIFICATION,
AND HALT AND REVERSE LAND DEGRADATION AND HALT
BIODIVERSITY LOSS
Number of targets monitored: 3/12 (15.1, 15.а, 15.b)
Number of indicators monitored: 3/14
SDG 15 calls for protection of terrestrial ecosystems through 12 targets monitored against 14 indicators. Currently in Serbia progress can be monitored towards three targets against three indicators. The report presents the progress in achieving the following targets: 15.1 ensure the conservation, restoration and sustainable use of terrestrial and inland freshwater ecosystems and their services, in particular forests, 5.a significantly increase financial resources from all sources to conserve and sustainably use biodiversity and ecosystems, and 15.b mobilize significant resources from all sources and at all levels to finance sustainable forest management.
KEY FINDINGS
� Moderate long-term and short-term progress was achieved in ensuring the conservation, restoration and sustainable use of terrestrial and inland freshwater ecosystems and their services, in particular forests, wetlands, mountains and drylands, in line with obligations under international agreements.
� Significant progress was achieved in mobilizing and significantly increasing financial resources from all sources to conserve and sustainably use biodiversity and ecosystems.

218 Progress report on the implementation of Sustainable Development Goals by 2030 in the Republic of Serbia
Target 15.1 By 2020, ensure the conservation, restoration and sustainable use of terrestrial and inland freshwater ecosystems and their services, in particular forests, wetlands, mountains and drylands, in line with obligations under international agreements
Indicator 15.1.1 Forest area as a proportion of total land area
The target calling for ensuring the conservation, restoration and sustainable use of terrestrial and inland freshwater ecosystems and their services should be achieved by 2020 in line with the 2030 Agenda. However, having in mind that precise targets have not been defined, it is not possible to assess if the target has been fully met. What can be determined in monitoring this target is the progress in the domain of forest protection and increased forest area.98 The data show moderate progress in the long-term period (2000–2020), at the compound annual growth rate of 0.51%, and in the short-term period (2015–2020), at the compound annual growth rate of 0.02%99 (Table 74, Annex 2).
Chart 36: Indicator 15.1.1 Forest area as a proportion of total land area, 2000–2015 (%)
Source: Food and Agriculture Organization (FAO) — database
98 The indicator is defined as the proportion of forest area of the total land area of a country. Forest is defined as land spanning more than 0.5 hectares with trees higher than 5 meters and a canopy cover of more than 10 percent, or trees able to reach these thresholds in situ. It does not include land that is predominantly under agricultural or urban land use. Additional detailed criteria are listed in FAO’s Forest Resource Assessment (FRA) 2020 Terms and Definitions Document available at: http://www.fao.org/3/I8661EN/i8661en.pdf. Total land area refers to the total surface area of a country excluding the area covered by inland waters, such as major rivers and lakes. Total land area of the reference year 2015 is used.
99 Source: Food and Agriculture Organization (FAO) — database.
28.1 28.3
31.0 31.1 31.1
26
27
28
29
30
31
32
2000 2005 2010 2015 2020

219Progress report on the implementation of Sustainable Development Goals by 2030 in the Republic of Serbia
SDG
15
Target 15.a Mobilize and significantly increase financial resources from all sources to conserve and sustainably use biodiversity and ecosystems
Target 15.b Mobilize significant resources from all sources and at all levels to finance sustainable forest management and provide adequate incentives to developing countries to advance such management, including for conservation and reforestation
Indicator 15.a.1, 15.b1 Official development assistance on conservation and sustainable use of biodiversity and ecosystems.
The progress towards the targets 15.a and 15.b is measured by the same indicator registering ODA investments in conservation and sustainable use of biodiversity and ecosystem.100 Significant progress was achieved towards both targets based on the short-term (2015–2018) compound annual growth rate of 350.70%, which is a considerable progress compared to the long-term trend (2002–2018) registering the compound annual growth rate of 28.71%.101
Chart 37: 15.a.1, 15.b1 Official development assistance on conservation and sustainable use of biodiversity and ecosystems (mil. USD)
Source: Organization for Security and Co-operation in Europe (OSCE) — database
100 The indicator is defined as gross disbursements of total Official Development Assistance (ODA) from all donors for biodiversity. The Development Assistance Committee (DAC) defines official development assistance. All donors refers to DAC donors, other bilateral providers of development cooperation and multilateral organizations. Biodiversity funding is allocated based on the Creditor Reporting System (CRS) of the Organization for Economic Co-operation and Development (OECD) i.e. based on the Rio marker for biodiversity.
101 Source: Organization for Security and Co-operation in Europe (OSCE) — database.
0.3
19.3
0
5
10
15
20
25
30
35
40
45
50
2002 2003 2004 2005 2006 2007 2008 2009 2010 2011 2012 2013 2014 2015 2016 2017 2018


Progress report on the implementation of Sustainable Development Goals by 2030 in the Republic of Serbia 221
SDG 16PROMOTE PEACEFUL AND INCLUSIVE
SOCIETIES FOR SUSTAINABLE DEVELOPMENT, PROVIDE ACCESS TO JUSTICE FOR ALL
AND BUILD EFFECTIVE, ACCOUNTABLE AND INCLUSIVE INSTITUTIONS AT ALL LEVELS
Number of targets monitored: 7/12 (16.1, 16.2, 16.3, 16.5, 16.6, 16.9, 16.b)
Number of indicators monitored: 10/23
SDG 16 promotes peaceful and inclusive societies for sustainable development, providing access to justice for all and building effective, accountable and inclusive institutions at all levels. This goal includes 12 targets monitored against 23 indicators. Currently in Serbia progress can be monitored towards seven targets against ten indicators. The report presents the progress in achieving the following targets: 16.1 significantly reduce all forms of violence and related death rates everywhere, 16.2 end abuse, exploitation, trafficking and all forms of violence against and torture of children, 16.3 promote the rule of law and ensure equal access to justice for all, 16.5 substantially reduce corruption and bribery in all their forms, 16.6 develop effective, accountable and transparent institutions at all levels, 16.9 by 2030, provide legal identity for all, including birth registration, and 16.b, which provides for the promotion and implementation of non-discriminatory laws and policies to achieve sustainable development.
KEY FINDINGS
� Progress achieved in regard to target 16.1 calling for significant reduction in all forms of violence and related death rates everywhere, monitored against the indicator measuring the proportion of women aged 18 to 74 subjected to physical, psychological or sexual violence in the previous 12 months, cannot be assessed since the data is available for 2018 only.
� Inconsistent trends are registered in relation to target 16.2 envisaging ending abuse, exploitation, trafficking and all forms of violence against and torture of children, given that the share of children subjected to physical punishment was slightly increased, while at the same time the number of juvenile victims of human trafficking was reduced.

222 Progress report on the implementation of Sustainable Development Goals by 2030 in the Republic of Serbia
� Moderate movement away from the target was registered in the domain of target 16.3 foreseeing promotion of the rule of law at and ensuring equal access to justice for all, primarily due to the increased proportion of unsentenced detainees as a proportion of the overall prison population.
� Progress cannot be monitored in the area of target 16.5 envisioning substantial reduction of corruption and bribery in all their forms, because of availability of the 2010 data only.
� Significant progress was achieved towards developing effective, accountable and transparent institutions at all levels (target 16.6), measured by the increase in primary government expenditures as proportion in originally approved budget.
� In terms of ensuring legal identity for all, including birth registration (target 16.9), data from 2019 indicate almost complete coverage of children from the general population by registration in the registry books and slightly lower coverage of children from the Roma population.
� Progress cannot be monitored towards target 16.b.1 either, and the 2019 Multiple Indicator Cluster Survey data shows that women living in Roma settlements felt discriminated more frequently than women in the overall population.
Target 16.1 Significantly reduce all forms of violence and related death rates everywhere
Indicator 16.1.3 Proportion of women aged 18 to 74 subjected to physical, psychological or sexual violence in the previous 12 months
Indicator 16.1.4 Proportion of population that feel safe walking alone around the area they live after dark or when home alone after dark, Serbia and Roma settlements
Progress cannot be monitored towards this target, since it is being monitored against the indicator measuring prevalence of violence against women102 and the data for this indicator are available only based on the OSCE Survey on the Wellbeing and Safety of Women. The data show that in this year 10.4% of women were subjected to some form of violence (physical, psychological or sexual) in the period of 12 months preceding the survey. Prevalence of violence is higher than average in certain groups of women, like refugees and internally displaced persons (23.2%), women with disabilities (23.4%), women from ethnic minorities (18.3%), women living in households that find it difficult to get by with the current income level (22.5%)103 (Table 76, Annex 2).
102 Proportion of women aged 18–74 years subjected to physical violence (by current or former intimate partner or non-partner), psychological violence (by current or former intimate partner) or sexual (by current or former intimate partner or non-partner) violence in the previous 12 months.
103 Source: OSCE — Survey on the Wellbeing and Safety of Women.

223Progress report on the implementation of Sustainable Development Goals by 2030 in the Republic of Serbia
SDG
16
The progress cannot be monitored against the second indicator either under this target, due to the lack of time series. According to the data gathered in the 2019 Multiple Indicator Cluster Survey, 87.5% of women in the overall population and 71% of women living in Roma settlements stated they felt safe walking alone around the area they live after dark. Certain disparities are present depending on the age and education of women, however elder women, better educated women felt safe in a higher percentage (Table 77, Annex 2).
Target 16.2 End abuse, exploitation, trafficking and all forms of violence against and torture of children
Indicator 16.2.1 Proportion of children aged 1–14 years who experienced any physical punishment and/or psychological aggression by caregivers in the past month
Indicator 16.2.2 Number of victims of human trafficking, by sex, age and form of exploitation
Inconsistent trends are registered in regard to protection of children against violence.104 The proportion of children aged 1–14 years who experienced any physical punishment in the month preceding the MICS slightly increased: from 43.1% in 2014 to 44.5% in 2019 in the overall population of children, and from 65.9% to 67.3% in population of children living in Roma settlements105 (Chart 38).
Chart 38: Indicator 16.2.1 Proportion of children aged 1–14 years who experienced any physical punishment and/or psychological aggression by caregivers in the past month, 2014–2019 (%)
Source: Multiple Indicator Cluster Survey (MICS), SORS and UNICEF
104 Percentage of children 1–14 years of age who (at least one): experience only non-violent aggression; or experience psychological aggression as punishment; experience minor physical punishment; experience severe physical punishment is divided by the total number of surveyed children aged 1–14. Observation unit includes children aged 1–14.
105 Source: Multiple Indicator Cluster Survey (MICS), SORS and UNICEF.
43.1 44.5
65.9 67.3
0
10
20
30
40
50
60
70
80
2014 2019
Serbia Roma settlements

224 Progress report on the implementation of Sustainable Development Goals by 2030 in the Republic of Serbia
Significant progress was achieved in the period 2014–2018 in regard to the reduced total number of victims of human trafficking106 (Chart 38). However, this change is neither gender nor age balanced. While the number of male victims of human trafficking declined in the period concerned (at the compound annual growth rate of -34.14%), the number of female victims increased (at the rate of 24.24%). The number of adult victims declined (at the compound annual growth rate of -19.73%), but the number of juvenile victims went up (at the rate of 13.92%)107 (Chart 39 and Table 79, Annex 2).
Chart 39: Indicator 16.2.2 Number of victims of human trafficking, by sex, age and form of exploitation
Source: Center for Human Trafficking Victims Protection — annual reports
Target 16.3 Promote the rule of law at the national and international levels and ensure equal access to justice for all
Indicator 16.3.1 Proportion of victims of violence in the previous 12 months who reported their victimization to competent authorities or other officially recognized conflict resolution mechanisms
Indicator 16.3.2 Unsentenced detainees as a proportion of the overall prison population
The progress towards target 16.3 envisaging promotion of the rule of law and ensuring equal access to justice for all, is measured against two indicators, one of which cannot be monitored applying the compound annual growth rate methodology due to the lack of time series. This
106 The total number of identified victims of human trafficking; Identified victims were male and female, juvenile and adult, victims of sexual exploitation, labour exploitation, forced marriage, forced begging, forced criminal activity, children trafficking for the purpose of adoption, pornographic abuse, multiple exploitation.
107 Source: Center for Human Trafficking Victims Protection — annual reports.
125
40
55
43
76
24
32
39
57
101
8 8 4
19
19
24 21
21
32
106
16
34
22
44
0
20
40
60
80
100
120
140
2014 2015 2016 2017 2018
Total Female Мale Underaged Adults
47

225Progress report on the implementation of Sustainable Development Goals by 2030 in the Republic of Serbia
SDG
16
indicator measures the proportion of victims of violence who self-reported their victimization to the competent authorities in the past 12 months, however only the 2019 data are available. According to these data, 40% in the overall population and 67% of women living in Roma settlements who were victims of violence, reported this incident to competent authorities108 (Table 80, Annex 2).
Moderate movement away from the target is registered against the second indicator monitoring progress under this target, due to the increased number of unsentenced detainees in total prison population.109 The number of unsentenced detainees was rising in the period 2015–2018, at the compound annual growth rate of 0.65%, but while the proportion of unsentenced male detainees was declining (-0.22%), the share of women in such position was growing (18.08%)110 (Table 81, Annex 2).
Target 16.5 Substantially reduce corruption and bribery in all their forms
Indicator 16.5.1 Proportion of persons who had at least one contact with a public official and who paid a bribe to a public official, or were asked for a bribe by those public officials, during the previous 12 months
The progress cannot be monitored in connection with corruption reduction because the data are available for 2010 only. According to these data, in the period of 12 months preceding the survey, 9.3% of respondents reported paying a bribe to a public official or were asked for a bribe by those public officials. The proportion of such persons is somewhat higher in men than in women (10.0% against 8.5%).
Target 16.6 Develop effective, accountable and transparent institutions at all levels
Indicator 16.6.1 Primary government expenditures as a proportion of original approved budget, by sector (or by budget codes or similar)
Significant progress was achieved towards developing effective, accountable and transparent institutions measured by the increase in primary government expenditures as proportion in originally approved budget.111 The progress was achieved at the compound annual growth rate
108 Source: Multiple Indicator Cluster Survey (MICS), SORS and UNICEF.109 Unsentenced detainees as a proportion of the overall prison population. The prison population in correctional facilities in the Republic
of Serbia includes: convicts; detainees; misdemeanor — sentenced persons; persons detained under security measures (mandatory psychiatric treatment and detention in health care institutions); compulsory treatment of drug addicts; mandatory treatment of alcoholics; persons serving sentences in juvenile correctional facilities and persons under corrective measures sent into juvenile correctional facilities (minors).
110 Source: Ministry of Justice — Administration for Enforcement of Penal Sanctions.111 Percentage of primary government expenditures in originally approved budget is obtained by dividing the current budget amount
at the end of the year by executed expenditures of budget beneficiaries, multiplied by 100. This is actually the ratio of total planned expenditures with all amendments throughout the year and actual budget execution at the end of the year. Data on expenditures of budget users as a share in the budget of the Republic of Serbia can be seen in the Budget Execution Information System (ISIB). ISIB covers the processes and procedures implemented by electronic communication with the Treasury Department within the Ministry of Finance, and is part of the public finance management system. The system includes: Direct beneficiaries of public funds, Indirect beneficiaries of the Ministry of Culture and Information, Administration for Enforcement of Penal Sanctions, Judicial Authorities and Social Welfare Institutions. See the Treasury Administration website at: https://www.trezor.gov.rs/src/services/isib/. Legislation governing budget execution are the Budget System Law and Law on the Budget of the Republic of Serbia. When calculating indicators, total expenditures included in the calculation of results, i.e. surplus and deficit, were taken into account. Sector classification showing budget execution in percentages can be seen in the Guidelines on the Programme Budget Preparation published on the website of the Ministry of Finance: https://www.mfin.gov.rs/dokumenti/uputstvo-za-izradu-programskog-budzeta-oktobar-2017/.

226 Progress report on the implementation of Sustainable Development Goals by 2030 in the Republic of Serbia
of 1.05%, with the negative trend being registered in the culture, communication and media, public safety, agriculture and rural development, transport and transport infrastructure sectors, while positive trends were recorded in all other sectors112 (Table 83, Annex 2).
Target 16.9 By 2030, provide legal identity for all, including birth registration
Indicator 16.9.1 Proportion of children under 5 years of age whose births have been registered with a civil authority, by age
Regarding the provision of legal identity for the entire population, including registration at birth, based on data from a the Multiple Indicator Cluster Survey from 2019, it can be concluded that in the general population of children coverage is almost complete (99.9%), while in the population of children living in Roma settlements it is somewhat lower (98.5%) (Table 84, Annex 2).113
Target 16.b Promote and enforce non-discriminatory laws and policies for sustainable development
Indicator 16.b.1 Proportion of women aged 15 to 49 reporting having personally felt discriminated against or harassed in the previous 12 months
Progress cannot be monitored against this target, and the 2019 Multiple Indicator Cluster Survey data show that in the previous 12 months 6.9% of women in the overall population and 12.5% of women in Roma settlements had personally felt discriminated against or harassed. The proportion of women reporting having personally felt discriminated against or harassed is higher in urban than in other settlements114 (Table 85, Annex 2).
112 Source: Ministry of Finance — Budget Execution Information System (ISIB).113 Percentage of children less than five years of age that were registered at the moment of the survey. The numerator of this indicator
includes children whose birth certificate was seen by the interviewer or whose mother or caretaker says the birth has been registered. MICS data refers to the children alive at the time of the survey.
114 Source: Multiple Indicator Cluster Survey (MICS), SORS and UNICEF.

Progress report on the implementation of Sustainable Development Goals by 2030 in the Republic of Serbia 227
SDG 17STRENGTHEN THE MEANS
OF IMPLEMENTATION AND REVITALIZE THE GLOBAL PARTNERSHIP FOR
SUSTAINABLE DEVELOPMENT
Number of targets monitored: 5/19 (17.1, 17.3, 17.4, 17.6, 17.8)
Number of indicators monitored: 5/25
SDG 17 calls for strengthening partnerships for sustainable development through 19 targets monitored against 25 indicators. Based on the SORS data, currently in Serbia progress can be monitored in relation to five targets against five indicators. The report presents the progress in achieving the following targets: 17.1 strengthen domestic resource mobilization to improve domestic capacity for tax and other revenue collection, 17.3 mobilize additional financial resources for developing countries from multiple sources, 17.4 attaining long-term debt sustainability, 17.6 enhance international cooperation on and access to science, technology and innovation, and 17.8 fully operationalize the technology bank and science, technology and innovation capacity-building mechanism for least developed countries by 2017.
KEY FINDINGS
� Significant progress was achieved towards target 17.1 calling for strengthening domestic resource mobilization to improve domestic capacity for tax and other revenue collection.
� Moderate movement away from the target was registered in relation to target 17.3 envisaging mobilizing additional financial resources for developing countries from multiple sources, primarily due to the decline in remittances in total GDP.
� Significant movement away from the target is recorded concerning the target 17.4 related to debt sustainability.
� Significant progress was made in the domain of target 17.6 envisaging enhanced international cooperation on and access to science, technology and innovation.
� In the domain of target 17.8 significant progress was recorded primarily owing to rising Internet use.

228 Progress report on the implementation of Sustainable Development Goals by 2030 in the Republic of Serbia
Target 17.1 Strengthen domestic resource mobilization, including through international support to developing countries, to improve domestic capacity for tax and other revenue collection
Indicator 17.1.1 Total government revenue as a proportion of GDP, by source
Significant progress was achieved at the compound annual growth rate of 2.05% in the period 2015–2018, and in long-term (2013–2018) at the rate of 1.76% in improving domestic capacities for collection of taxes and other revenues115. The total government revenue as a proportion of GDP were increased from 37.3% in 2013 to 40.7% in 2018.116 (Chart 40).
Chart 40: Indicator 17.1.1 Total government revenue as a proportion of GDP, 2013–2018, in%
Source: National accounts, SORS
Target 17.3Mobilize additional financial resources for developing countries from multiple sources
Indicator 17.3.2 Volume of remittances (in United States dollars) as a proportion of total GDP
Moderate movement away from the target was recorded in regard to mobilisation of development financing from multiple sources, primarily due to the reduced volume of remittances in total
115 Total government revenue is fiscal indicator and consists of taxes, social contributions, grants and other revenue. Gross domestic product (GDP) is most important and most often used aggregate of the system of National Accounts and represents the indicator of total economic activities at country level. The indicator 17.1.1 represents a percentage of total government revenues in GDP.
116 Source: National accounts, SORS.
37.3
38.4 38.3
39.8
40.5 40.7
35
36
37
38
39
40
41
2013 2014 2015 2016 2017 2018
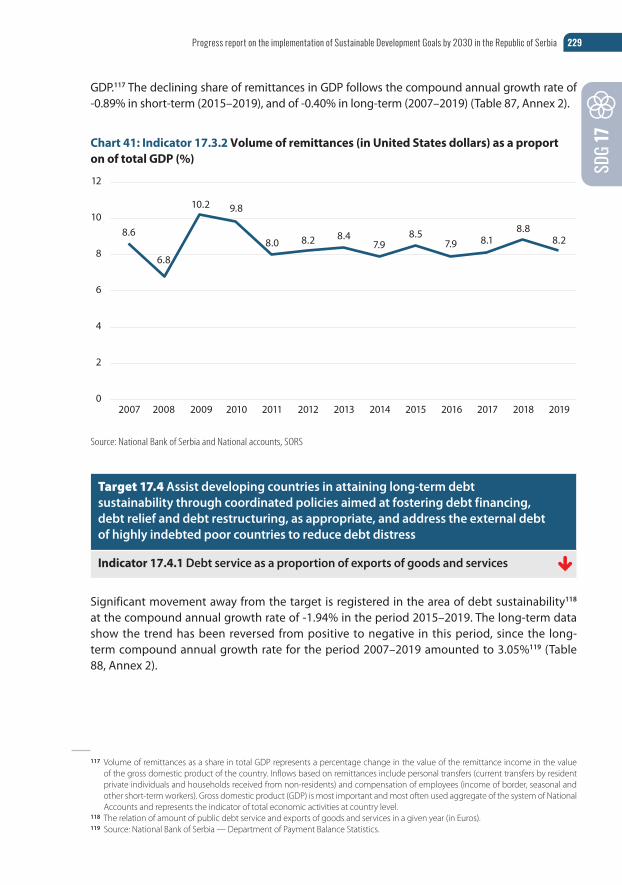
229Progress report on the implementation of Sustainable Development Goals by 2030 in the Republic of Serbia
SDG
17
GDP.117 The declining share of remittances in GDP follows the compound annual growth rate of -0.89% in short-term (2015–2019), and of -0.40% in long-term (2007–2019) (Table 87, Annex 2).
Chart 41: Indicator 17.3.2 Volume of remittances (in United States dollars) as a proport on of total GDP (%)
Source: National Bank of Serbia and National accounts, SORS
Target 17.4 Assist developing countries in attaining long-term debt sustainability through coordinated policies aimed at fostering debt financing, debt relief and debt restructuring, as appropriate, and address the external debt of highly indebted poor countries to reduce debt distress
Indicator 17.4.1 Debt service as a proportion of exports of goods and services
Significant movement away from the target is registered in the area of debt sustainability118 at the compound annual growth rate of -1.94% in the period 2015–2019. The long-term data show the trend has been reversed from positive to negative in this period, since the long-term compound annual growth rate for the period 2007–2019 amounted to 3.05%119 (Table 88, Annex 2).
117 Volume of remittances as a share in total GDP represents a percentage change in the value of the remittance income in the value of the gross domestic product of the country. Inflows based on remittances include personal transfers (current transfers by resident private individuals and households received from non-residents) and compensation of employees (income of border, seasonal and other short-term workers). Gross domestic product (GDP) is most important and most often used aggregate of the system of National Accounts and represents the indicator of total economic activities at country level.
118 The relation of amount of public debt service and exports of goods and services in a given year (in Euros). 119 Source: National Bank of Serbia — Department of Payment Balance Statistics.
8.6
6.8
10.2
9.8
8.0 8.2
8.4
7.9
8.5
7.9
8.1
8.8
8.2
0
2
4
6
8
10
12
2007 2008 2009 2010 2011 2012 2013 2014 2015 2016 2017 2018 2019

230 Progress report on the implementation of Sustainable Development Goals by 2030 in the Republic of Serbia
Target 17.6 Enhance North-South, South-South and triangular regional and international cooperation on and access to science, technology and innovation and enhance knowledge-sharing on mutually agreed terms, including through improved coordination among existing mechanisms, in particular at the United Nations level, and through a global technology facilitation mechanism
Indicator 17.6.2 Number of subscribers (subscriptions) of fixed broadband Internet access per 100 inhabitants, according to speeds
Significant progress was made towards target 17.6 envisaging improved regional and international cooperation in science, technology and innovation, and it is documented by the positive compound annual growth rate against the indicator measuring the number of subscribers of fixed broadband Internet per 100 inhabitants.120 The progress is registered in the number of subscribers having access to the fastest connection (above or equal to 10 Mbit/s), coupled with simultaneous decline in the number of subscribers with slow connections121 (Table 89, Annex 2).
Target 17.8 Fully operationalize the technology bank and science, technology and innovation capacity-building mechanism for least developed countries by 2017 and enhance the use of enabling technology, in particular information and communications technology
Indicator 17.8.1 Proportion of individuals using the Internet
In regard to this target planned to be achieved by 2017, the achievement cannot be assessed since precise target values have not been defined. The data on the proportion of individuals using the Internet,122 used to monitor achievement of this target, demonstrate significant progress based on the compound annual growth rate of 4.34% for the period 2015–2019. The progress is slightly more pronounced in female than in male population when measured by the compound annual growth rate (5.14% against 3.59%)123 (Table 90, Annex 2).
120 The number of subscribers (subscriptions) of fixed broadband Internet access refers to subscribers who pay for access to the public Internet and are allocated according to data download speeds per 100 inhabitants of the Republic of Serbia. Population estimates for the Republic of Serbia (excluding the data for AP Kosovo and Metohija) compiled by the Vital Statistics of the Statistical Office of the Republic of Serbia, refer to year end — namely 31 December of the year observed.
121 Source: Regulatory Agency for Electronic Communications and Postal Services (RATEL) and Vital Statistics, SORS.122 Individuals — Internet users (in the last 3 months), aged between 16 and 74.123 Source: Information and Communication Technology statistics, SORS.

231Progress report on the implementation of Sustainable Development Goals by 2030 in the Republic of Serbia
ANNEX 1THE COMPOUND ANNUAL GROWTH RATE
CALCULATION METHODOLOGY
T he assessment of progress for indicators without quantitative targets is based on longitu-dinal data. In the EU, progress is monitored against the long-term time frame (last 15 years)
and short-term time frame (last 5 years). Compound annual growth rate is calculated applying the following formula:
Where:
t0 is baseline year,
t is last year,
Yt0 baseline year indicator value,
Yt last year indicator value.
CAGR = 1y
t
yt0
1
t–t0

232 Progress report on the implementation of Sustainable Development Goals by 2030 in the Republic of Serbia
ANNEX 2TABLES
SDG 1 END POVERTY IN ALL ITS FORMS EVERYWHERE
Target 1.2. By 2030, reduce at least by half the proportion of men, women and children of all ages living in poverty in all its dimensions according to national definitions
Table 1: Indicator 1.2.1 At risk of poverty rate, by sex and by age
Compound annual growth rate (%)
Progress towards the SDG
2015–2018
Total -3.09
GenderFemale -2.63
Male -3.65
Age
0–17 -2.53
18–24 -2.40
25–54 -4.20
55–64 -2.39
65+ 0.48
2013–2018
Total -0.16
GenderFemale -0.08
Male -0.24
Age
0–17 -0.61
18–24 1.51
25–54 -1.41
55–64 1.86
65+ 1.69
Source: Survey on Income and Living Conditions, SORS

233Progress report on the implementation of Sustainable Development Goals by 2030 in the Republic of Serbia
Table 2: Indicator 1.2.2 At risk of poverty and social exclusion rate, by sex and by age
Compound annual growth rate (%)
Progress towards the SDG
2015–2018
Total -6.30
GenderFemale -5.93
Male -6.68
Age
0–15 -4.86
16–24 -5.84
25–49 -6.66
50–64 -6.66
65+ -5.90
2013–2018
Total -3,97
GenderFemale -3,97
Male -3,97
Age
0–15 -3,50
16–24 -3,46
25–49 -4,15
50–64 -4,18
65+ -3,42
Source: Survey on Income and Living Conditions, SORS
Target 1.3. Implement nationally appropriate social protection systems and measures for all, including floors, and by 2030 achieve substantial coverage of the poor and the vulnerable
Table 3: Indicator 1.3.1 Share of social protection beneficiaries in total population
Compound annual growth rate (%)
Progress towards the SDG
2015–2018
2015–2019 2.04
2011–2019 3.37
Source: Republic Institute for Social Protection, regular report of the Center for Social Work

234 Progress report on the implementation of Sustainable Development Goals by 2030 in the Republic of Serbia
Target 1.4 By 2030, ensure that all men and women, in particular the poor and the vulnerable, have equal rights to economic resources, as well as access to basic services, ownership and control over land and other forms of property, inheritance, natural resources, appropriate new technology and financial services, including microfinance
Table 4: Indicator 1.4.1а Percentage of people with access to basic water supply services and .4.1b Percentage of people with access to basic sanitation services
Percentage of people having access to
basic water supply services
Percentage of people having access to basic sanitation
services
Total 99.1 98.4
Settlement type
Roma settlements 98.2 86.4
Urban 99.2 99.4
Other 99.0 97.0
Source: Multiple Indicator Cluster Survey (MICS), SORS and UNICEF
Target 1.a Ensure significant mobilization of resources from a variety of sources, including through enhanced development cooperation, in order to provide adequate and predictable means for developing countries, in particular least developed countries, to implement programmes and policies to end poverty in all its dimensions
Table 5: Indicator 1.a.2 Proportion of total government spending on essential services (education, health and social protection), 2015–2019 (%)
Total government spending on essential services (education, health and social protection) (%)
Compound annual growth rate (%)
Progress towards the SDG
2015–2019
Total -0.77
Education 1.00
Health care 0.82
Social protection -1.75
Source: Ministry of Finance — Sector for Macroeconomic and Fiscal Analysis and Forecasts

235Progress report on the implementation of Sustainable Development Goals by 2030 in the Republic of Serbia
SDG 2 END HUNGER, ACHIEVE FOOD SECURITY AND IMPROVED NUTRITION AND PROMOTE SUSTAINABLE AGRICULTURE
Target 2.1 By 2030, end hunger and ensure access by all people, in particular the poor and people in vulnerable situations, including infants, to safe, nutritious and sufficient food all year round
Table 6: Indicator 2.1.2.a Prevalence of moderate or severe food insecurity in adult population, by sex, 2015–2017
Compound annual growth rate (%)
Progress towards the SDG
Total 4.95
GenderFemale 12.31
Male -3.46
Source: Food and Agriculture Organisation (FAO) — database
Table 7: Indicator 2.1.2. Prevalence of severe food insecurity in adult population, by sex, 2015–2017
Compound annual growth rate (%)
Progress towards the SDG
Total 8,29
GenderFemale 1,88
Male -13,56
Source: Food and Agriculture Organisation (FAO) — database
Table 8: Indicator 2.1.2c Total population in moderate or severe food insecurity, by sex, 2015–2017
Compound annual growth rate (%)
Progress towards the SDG
Total 4.58
GenderFemale 12.07
Male -3.65
Source: Food and Agriculture Organisation (FAO) — database

236 Progress report on the implementation of Sustainable Development Goals by 2030 in the Republic of Serbia
Table 9: Indicator 2.1.2c Total population in severe food insecurity, by sex, 2015–2017
Compound annual growth rate (%)
Progress towards the SDG
Total 7.92
GenderFemale 18.49
Male -13.74
Target 2.2. By 2030, end all forms of malnutrition, including achieving, by 2025, the internationally agreed targets on stunting and wasting in children under 5 years of age, and address the nutritional needs of adolescent girls, pregnant and lactating women and older persons
Table 10: Indicator 2.2.1 Prevalence of stunting (moderate and severe), by sex, by age, by type of settlements and by wealth, 2010–2019
Compound annual growth rate (%)
Progress towards the SDG
Long-term (2010–2019)
Short-term (2014–2019)
Long-term (2010–2019)
Short-term (2014–2019)
Total < 5 years -2.21 -2.09
GenderFemale -8.94 -9.48
Male 2.55 1.71
Age
<6 months 3.39 4.18
6–11 months -8.02 -11.25
12–23 months -9.68 -13.40
24–35 months -0.52 -8.37
36–47 months -0.41 14.46
48–59 months 2.83 16.47
By mother's (care-giver) education level
Primary 0.98 -9.14
Secondary -5.20 1.79
Higher 4.72 1.58
Settlement type
Urban 0.78 -1.92
Other -5.17 -1.18
Roma settlements
-3.64 -1.79
Wealth index quintiles
Poorest 0.35 -6.73
Second -8.23 3.13
Middle -2.11 -6.30
Fourth -2.23 8.23
Richest -1.38 -6.06
Source: Multiple Indicator Cluster Survey (MICS), SORS and UNICEF

237Progress report on the implementation of Sustainable Development Goals by 2030 in the Republic of Serbia
Table 11: Indicator 2.2.2.a Prevalence of overweight (moderate and severe), by sex, by age, by type of settlements and by wealth, 2010–2019
Compound annual growth rate (%)
Progress towards the SDG
Long-term (2010–2019)
Short-term (2014–2019)
Long-term (2010–2019)
Short-term (2014–2019)
Total < 5 years -3.91 -4.75
GenderFemale -5.42 -5.80
Male -2.93 -4.03
Age
<6 months -14.28 -18.24
6–11 months -6.87 -4.48
12–23 months -10.26 -17.14
24–35 months -2.09 -4.85
36–47 months 0.55 6.71
48–59 months -1.99 -4.24
By mother‘s (care-giver) education level
Primary -6.86 -7.50
Secondary -4.77 -4.70
Higher 0.30 -4.12
Settlement type
Urban -0.76 -3.02
Other -7.41 -7.17
Roma settlements
-6.64 6.23
Wealth index quintiles
Poorest -5.98 -11.51
Second -8.85 -15.75
Middle -4.79 -3.34
Fourth -3.49 2.13
Richest 1.47 1.52
Source: Multiple Indicator Cluster Survey (MICS), SORS and UNICEF

238 Progress report on the implementation of Sustainable Development Goals by 2030 in the Republic of Serbia
Table 12: Indicator 2.2.2. b Prevalence of wasting (moderate and severe), by sex, by age, by type of settlements and by wealth, 2010–2019
Compound annual growth rate (%)
Progress towards the SDG
Long-term (2010–2019)
Short-term (2014–2019)
Long-term (2010–2019)
Short-term (2014–2019)
Total < 5 years -3.25 -7.79
GenderFemale -8.44 -12.00
Male 1.91 -5.29
Age
<6 months -6.95 -3.91
6–11 months 4.17 -8.26
12–23 months -14.28 -13.88
24–35 months -3.02 0
36–47 months -5.39 -18.75
48–59 months 8.74 3.23
By mother‘s (care-giver) education level
Primary 2.18 -2.20
Secondary -6.38 -9.71
Higher -1.38 -7.80
Settlement type
Urban 1.38 -0.91
Other -13.97 -22.71
Roma settlements
-6.65 -10.22
Wealth index quintiles
Poorest -7.41 14.91
Second 1.73 -10.22
Middle -2.08 -11.42
Fourth 3.86 -2.09
Richest -11.28 -21.00
Source: Multiple Indicator Cluster Survey (MICS), SORS and UNICEF
Table 13: Indicators 2.a.1 The agriculture orientation index for government expenditures, 2015–2019
Compound annual growth rate (%)
Progress towards the SDG
Total 7.19
Source: Ministry of Finance — Sector for Macroeconomic and Fiscal Analysis and Forecasts and National Accounts, SORS

239Progress report on the implementation of Sustainable Development Goals by 2030 in the Republic of Serbia
SDG 3 ENSURE HEALTHY LIVES AND PROMOTE WELL-BEING FOR ALL AT ALL AGES
Target 3.1: By 2030, reduce the global maternal mortality ratio to less than 70 per 100,000 live births
Table 14: Indicator 3.1.1 Maternal mortality ratio
Compound annual growth rate (%)
Progress towards the SDG
1990–2019 -1.98
2015–2019 -15.53
Source: Vital Statistics, SORS
Table 15: Indicator 3.1.2 Proportion of births attended by skilled health personnel, 2005–2019
Compound annual growth rate (%)
Progress towards the SDG
2014–2019
Total 0.30
Education
Primary 0.33
Secondary 0.04
Higher 0.65
Settlement type
Urban 0.43
Other 0.12
Roma settlements 0.12
Wealth index quintilesPoorest 0.51
Richest 0.95
2005–2019
Total 0.10
Education
Primary 0.11
Secondary 0.06
Higher 0
Settlement type
Urban 0.08
Other 0.05
Roma settlements 0.47
Wealth index quintilesPoorest 0.16
Richest 0
Source: Multiple Indicator Cluster Survey (MICS), SORS and UNICEF

240 Progress report on the implementation of Sustainable Development Goals by 2030 in the Republic of Serbia
Target 3.2: By 2030, end preventable deaths of newborns and children under 5 years of age, with all countries aiming to reduce neonatal mortality to at least as low as 12 per 1,000 live births and under-5 mortality to at least as low as 25 per 1,000 live births
Table 16: Indicator 3.2.1a Under-five mortality rate
Compound annual growth rate (%)
Progress towards the SDG
Total 2015–2019 -2.15
GenderFemale -3.64
Male -0.60
Roma settlements total 2015–2019 -8.97
Total 1990–2019 -3.95
GenderFemale -3.96
Male -3.95
Roma settlements total 2005–2019 -7.79
Source: Vital Statistics, SORS, for the Roma settlement population, Multiple Indicator Cluster Survey (MICS), SORS and UNICEF
Table 17: Indicator 3.2.2 Neonatal mortality rate
Compound annual growth rate (%)
Progress towards the SDG
Total 2015–2019 -1.21
GenderFemale -1.09
Male -1.26
Total 1990–2019 -3.04
GenderFemale -2.21
Male -3.55
Source: Vital Statistics, SORS

241Progress report on the implementation of Sustainable Development Goals by 2030 in the Republic of Serbia
Target 3.3: By 2030, end the epidemics of AIDS, tuberculosis, malaria and neglected tropical diseases and combat hepatitis, water-borne diseases and other communicable diseases
Table 18: Indicator 3.3.2 Tuberculosis incidence per 100,000 population
Compound annual growth rate
Progress towards the SDG
2015–2018 -9.74
2001–2018 -7.65
Source: Public Health Institute of Serbia and Vital Statistics, SORS
Target 3.4: By 2030, reduce by one third premature mortality from non-communicable diseases through prevention and treatment and promote mental health and well-being
Table 19: Indicator 3.4.1 Mortality rate attributed to cardiovascular disease, cancer, diabetes or chronic respiratory disease, 2015–2019
Compound annual growth rate (%)
Progress towards the SDG
Total -0.54
GenderFemale -0.75
Male -0.51
Source: Vital Statistics, SORS
Table 20: Indicator 3.4.2 Suicide mortality rate
Compound annual growth rate (%)
Progress towards the SDG
Total 2015–2019 -2.60
GenderFemale -2.02
Male -2.68
Total 2000–2019 -2.10
GenderFemale -2.97
Male -1.72
Source: Vital Statistics, SORS

242 Progress report on the implementation of Sustainable Development Goals by 2030 in the Republic of Serbia
Target 3.7 By 2030, ensure universal access to sexual and reproductive health-care services, including for family planning, information and education, and the integration of reproductive health into national strategies and programmes
Table 21: Indicator 3.7.1 Proportion of women of reproductive age (aged 15–49 years) who have their need for family planning satisfied with modern methods
Compound annual growth rate (%)
Progress towards the SDG
Total 2014–2019 3.63
Total 2010–2019 -0.68
Source: Multiple Indicator Cluster Survey (MICS), SORS and UNICEF
Table 22: Indicator 3.7.2 Adolescent birth rate (aged 15–19 years) per 1,000 women in that age group
Compound annual growth rate (%)
Progress towards the SDG
2015–2019 -4.43
1990–2019 -4.01
Source: Vital Statistics, SORS

243Progress report on the implementation of Sustainable Development Goals by 2030 in the Republic of Serbia
Target 3.8 Achieve universal health coverage, including financial risk protection, access to quality essential health-care services and access to safe, effective, quality and affordable essential medicines and vaccines for all
Table 23: Indicator 3.8.1 Percentage of people using improved sanitary facilities, 2019 (%)
Serbia Roma settlements
Total 98.6 93.0
Settlement typeUrban 99.6 94.1
Other 97.2 90.9
Education of household holder
Primary or none 96.8 87.8
Secondary 99.0 92.6
Higher 99.4 97.7
Location of sanitary facilities
In a dwelling/house 98.8 95.2
On the lot/in the backyard
95.9 93.2
Elsewhere 100.0 80.6
No facilities/shrubs/ field
(*) 0
Wealth index quintile
Poorest 95.4 84.3
Second 98.2 90.6
Middle 99.7 94.7
Fourth 99.8 97.3
Richest 100.0 98.0
Source: Multiple Indicator Cluster Survey (MICS), SORS and UNICEF
Target 3.9: By 2030, substantially reduce the number of deaths and illnesses from hazardous chemicals and air, water and soil pollution and contamination
Table 24: Indicator 3.9.3 Mortality rate attributed to unintentional poisoning
Compound annual growth rate (%)
Progress towards the SDG
2015–2019 -6.94
2010–2019 -7.41
Source: Vital Statistics, SORS

244 Progress report on the implementation of Sustainable Development Goals by 2030 in the Republic of Serbia
Target 3.b 3.b Support the research and development of vaccines and medicines for the communicable and non-communicable diseases that primarily affect developing countries, provide access to affordable essential medicines and vaccines, in accordance with the Doha Declaration on the TRIPS Agreement and Public Health, which affirms the right of developing countries to use to the full the provisions in the Agreement on Trade-Related Aspects of Intellectual Property Rights regarding flexibilities to protect public health, and, in particular, provide access to medicines for all
Table 25: Indicator 3.b.1 Proportion of the target population covered by all vaccines included in their national programme, 2019 (%)
SerbiaRoma
settlements
Coverage of children between 12–23 months of age by immunization against diphtheria, tetanus and pertussis
91.8 73.3
Coverage of children between 12–23 months of age by immunization against prenumococcus (conjugate vaccine)
65.4 47.0
Coverage of children between 24–35 months of age by immunization against measles
87.2 76.5
Source: Multiple Indicator Cluster Survey (MICS), SORS and UNICEF
Target 3.c Substantially increase health financing and the recruitment, development, training and retention of the health workforce in developing countries, especially in least developed countries and small island developing states
Table 26: Indicator 3.c.1 Health worker density and distribution
Compound annual growth rate (%)
Progress towards the SDG
2015–2017
Doctors -0.49
Nurses and midwives 1.02
Dentists -4.96
Pharmacists -6.26
2003–2017
Doctors 0.74
Nurses and midwives 0.66
Dentists -3.63
Pharmacists 1.07
Source: Public Health Institute of Serbia and Vital Statistics, SORS

245Progress report on the implementation of Sustainable Development Goals by 2030 in the Republic of Serbia
SDG 4 ENSURE INCLUSIVE AND EQUITABLE QUALITY EDUCATION AND PROMOTE LIFELONG LEARNING OPPORTUNITIES FOR ALL
Target 4.1: By 2030, ensure that all girls and boys complete free, equitable and quality primary and secondary education leading to relevant and effective learning outcomes
Table 27: Indicator 4.1.2.a Gross rate of completion of the first cycle of primary education, 2019, Serbia and Roma settlements (%)
%
Serbia Roma settlements
Total 99.9 88.9
GenderFemale 99.7 87.9
Male 100 89.9
Settlement typeUrban 99.7 87.0
Other 100 92.9
By mother‘s (care-giver) education level
Primary or none 99.0 75.7
Secondary 100.0 91.9
Higher 100.0 94.9
Wealth index quintiles
Poorest 99.2 77.7
Second 100.0 87.2
Middle 100.0 97.3
Fourth 100.0 88.0
Richest 100.0 98.2
Source: Multiple Indicator Cluster Survey (MICS), SORS and UNICEF

246 Progress report on the implementation of Sustainable Development Goals by 2030 in the Republic of Serbia
Table 28: Indicator 4.1.2.b Rate of completion of the second cycle of primary education, 2019 (%)
%
Serbia Roma settlements
Total 99.5 63.7
GenderFemale 99.5 63.8
Male 99.6 63.5
Settlement typeUrban 99.9 65.4
Other 98.9 60.3
By mother‘s (care-giver) education level
Primary or none 99.2 49.7
Secondary 100.0 70.5
Higher 100.0 *
Wealth index quintiles
Poorest 97.1 41.7
Second 100.0 54.0
Middle 100.0 67.1
Fourth 100.0 69.9
Richest 100.0 89.2
Source: Multiple Indicator Cluster Survey (MICS), SORS and UNICEF
Table 29: Indicator 4.1.2.c Rate of completion of the secondary school, 2019 (%)
%
Serbia Roma settlements
Total 97.7 61.0
GenderFemale 97.0 49.5
Male 98.4 69.1
Settlement typeUrban 98.7 60.3
Other 96.0 62.3
By mother‘s (care-giver) education level
Primary or none - -
Secondary - -
Higher - -
Wealth index quintile
Poorest 93.0 *
Second 96.7 *
Middle 97.1 *
Fourth 98.9 68.7
Richest 99.5 83.2
Source: Multiple Indicator Cluster Survey (MICS), SORS and UNICEF

247Progress report on the implementation of Sustainable Development Goals by 2030 in the Republic of Serbia
Target 4.2: By 2030, ensure that all girls and boys have access to quality early childhood development, care and pre-primary education so that they are ready for primary education
Table 30: Indicator 4.2.1 Proportion of children under 5 years of age who are developmentally on track in health, learning and psychosocial well-being, by sex, 2014–2019
Compound annual growth rate (%)
Progress towards the SDG
Total 0.44
GenderFemale 0.71
Male 0.17
Age36–47 months 0.97
48–59 months -0.02
In educationIn education -0.33
Not in education 1.29
By mother‘s (care-giver) education level
Primary 1.76
Secondary 0.50
Higher -0.14
Settlement type
Urban 0.33
Other 0.73
Roma settlements 1.38
Wealth index quintiles
Poorest 1.85
Second 0.38
Middle 0.85
Fourth 0.02
Richest -0.10
Source: Multiple Indicator Cluster Survey (MICS), SORS and UNICEF
Table 31: Indicator 4.2.2 Participation rate in organized learning (one year before the official primary entry age), by sex
Compound annual growth rate (%)
Progress towards the SDG
Total 2015–2019 0.61
GenderFemale 0.73
Male 0.49
Total 2009–2019 1.04
GenderFemale 1.04
Male 1.04
Source: Education statistics, SORS

248 Progress report on the implementation of Sustainable Development Goals by 2030 in the Republic of Serbia
Target 4.3: By 2030, ensure equal access for all women and men to affordable and quality technical, vocational and tertiary education, including university
Table 32: Indicator 4.3.1 Participation rate of youth and adults in formal and non-formal education and training in the previous 12 months, by sex
Compound annual growth rate (%)
Progress towards the SDG
2015–2019
Youth 15–24 0.19
GenderFemale 0.03
Male 0.36
Adults 25–64 -2.71
GenderFemale -1.50
Male -3.56
2010–2019
Youth 15–24 0.18
GenderFemale 0.11
Male 0.27
Adults 25–64 0.81
GenderFemale 1.49
Male -0.29
Source: Labour Force Survey, SORS
Target 4.5: By 2030, eliminate gender disparities in education and ensure equal access to all levels of education and vocational training for the vulnerable, including persons with disabilities, indigenous peoples and children in vulnerable situations
Table 33: Indicator 4.5.1 Parity indices in different education levels
Education level 2014 2019
Female/Male
Primary school 1.0 0.96
Lower secondary 0.99 0.99
Upper secondary 1.08 0.99
Poorest/Richest
Primary school 0.97 1.04
Lower secondary 0.99 0.97
Upper secondary 0.76 0.80
Source: Multiple Indicator Cluster Survey (MICS), SORS and UNICEF

249Progress report on the implementation of Sustainable Development Goals by 2030 in the Republic of Serbia
Target 4.6: By 2030, ensure that all youth and a substantial proportion of adults, both men and women, achieve literacy and numeracy
Table 34: Indicator 4.6.1 Proportion of students aged 15 years not achieving the minimum fixed level on the PISA scale for three elementary school subjects, 2006–2012
Compound annual growth rate (%)
Progress towards the SDG
Reading -7.16
Science -1.58
Mathematics -1.54
Source: Organization for Security and Co-operation in Europe (OSCE) — database

250 Progress report on the implementation of Sustainable Development Goals by 2030 in the Republic of Serbia
SDG 5 ACHIEVE GENDER EQUALITY AND EMPOWER ALL WOMEN AND GIRLS
Target 5.2: Eliminate all forms of violence against all women and girls in the public and private spheres, including trafficking and sexual and other types of exploitation
Table 35: Indicator 5.2.1 Proportion of ever-partnered women and girls aged 18 to 74 subjected to physical, sexual or psychological violence by a current or former intimate partner in the previous 12 months, by age, 2018 (%)
%
Total 9.2
Women refugees/ Internally displaced persons 20.8
Women with disabilities 18.7
Women from national minorities 14.8
Material deprivation level
Very difficult to get by with current income 19.1
Difficult to get by with current income 15.8
Getting by with current income 9.0
Lives well with current income 3.9
Source: OSCE — Survey on the Wellbeing and Safety of Women

251Progress report on the implementation of Sustainable Development Goals by 2030 in the Republic of Serbia
Table 36: Indicator 5.2.2 Proportion of ever-partnered women and girls aged 18 to 74 subjected to sexual violence by persons other than an intimate partner in the previous 12 months, by age, 2018 (%)
%
Total 0.5
Women refugees/ Internally displaced persons 1.7
Women with disabilities 0
Women from national minorities 0
Material deprivation level
Very difficult to get-by with current income 0.9
Difficult to get-by with current income 0.7
Getting by with current income 0.6
Lives well with current income 0.1
Age
18–29 1.4
30–39 0.3
40–49 0
50–59 0.8
60–74 0.3
Source: OSCE — Survey on the Wellbeing and Safety of Women
Target 5.3: Eliminate all harmful practices, such as child, early and forced marriage and female genital mutilation
Table 37: Indicator 5.3.1a Proportion of women aged 20–24 years who were married or in a union before age 15
Compound annual growth rate (%)
Progress towards the SDG
Total 2014–2019 8.45
Settlement type
Urban -24.21
Other 20.48
Roma settlements -1.21
Wealth index quintilesPoorest 14.14
Richest -100.00
Education Primary 33.53
Source: Multiple Indicator Cluster Survey (MICS), SORS and UNICEF

252 Progress report on the implementation of Sustainable Development Goals by 2030 in the Republic of Serbia
Table 38: Indicator 5.3.1b Proportion of women aged 20–24 years who were married or in a union before age 18
Compound annual growth rate (%)
Progress towards the SDG
Total 2014–2019 -4.16
Settlement typeUrban -10.49Other 1.72Roma settlements -0.43
Wealth index quintilesPoorest 3.53
Richest -27.52
Education Primary 8.39
Source: Multiple Indicator Cluster Survey (MICS), SORS and UNICEF
Target 5.4: Recognize and value unpaid care and domestic work through the provision of public services, infrastructure and social protection policies and the promotion of shared responsibility within the household and the family as nationally appropriate
Table 39: Indicator 5.4.1 Proportion of time spent on unpaid domestic and care work, by age and by type of settlement 2010–2015 (%)
Compound annual growth rate (%)
Progress towards the SDG
Total -1.49
GenderFemale -1.01Male -1.74
Settlement typeUrban -1.14Other -1.66
Female by age
15–24 6.8625–44 -0.8145–54 -2.0455–64 0.1765+ -2.23
Male by age
15–24 25.4525–44 2.3245–54 -5.0655–64 0.1865+ -3.93
Source: Time Use Survey (TUS), SORS

253Progress report on the implementation of Sustainable Development Goals by 2030 in the Republic of Serbia
Target 5.5 Ensure women’s full and effective participation and equal opportunities for leadership at all levels of decision-making in political, economic and public life
Table 40: Indicators 5.5.1 Proportion of seats held by women in national parliament, 2002–2016 and 5.5.2 Proportion of women in managerial positions, 2010–2018
Compound annual growth rate (%)
Progress towards the SDG
Proportion of seats held by women in national parliament*
7.82
Proportion of women in managerial positions**
4.62
*Source: Elections for the Members of Parliament, SORS**Source: European Institute for Gender Equality (EIGE) — database
Target 5.6: Ensure universal access to sexual and reproductive health and reproductive rights as agreed in accordance with the Programme of Action of the International Conference on Population and Development and the Beijing Platform for Action and the outcome documents of their review conferences
Table 41: Indicator 5.6.1 Proportion of women aged 15–49 years who make their own informed decisions regarding sexual relations, contraceptive use and reproductive health care, 2019 (%)
Serbia Roma settlements
Total 84.2 67.7
Settlement typeUrban 89.9 67.2
Other 81.8 68.8
Age
15–19 (*) 57.8
20–24 83.2 70.3
25–29 84.2 74.8
30–34 89.7 73.3
35–39 90.7 70.4
40–44 85.1 68.9
45–49 73.6 51.7
Education
Primary or none 76.8 59.8
Secondary 82.8 68.4
Higher 88.5 71.7
Wealth index quintile
Poorest 77.2 61.9
Second 83.0 70.5
Middle 83.3 65.3
Fourth 87.7 69.5
Richest 86.2 70.3
Source: Multiple Indicator Cluster Survey (MICS), SORS and UNICEF

254 Progress report on the implementation of Sustainable Development Goals by 2030 in the Republic of Serbia
5.b Enhance the use of enabling technology, in particular information and communications technology, to promote the empowerment of women
Table 42: Indicator 5.b.1 Proportion of individuals who own a mobile telephone, by sex, 2013–2020
Compound annual growth rate (%)
Progress towards the SDG
Total 1.13
GenderFemale 0.89
Male 1.38
Source: Statistics of information-communication technology use

255Progress report on the implementation of Sustainable Development Goals by 2030 in the Republic of Serbia
SDG 6 ENSURE AVAILABILITY AND SUSTAINABLE MANAGEMENT OF WATER AND SANITATION FOR ALL
Target 6.3: By 2030, improve water quality by reducing pollution, eliminating dumping and minimizing release of hazardous chemicals and materials, halving the proportion of untreated wastewater and substantially increasing recycling and safe reuse globally
Table 43: Indicator 6.3.1 Population connected to urban wastewater treatment with at least secondary treatment
Compound annual growth rate (%)
Progress towards the SDG
2015–2018 6.10
2010–2018 5.20
Source: Environmental statistics and accounts, SORS
Target 6.4: By 2030, substantially increase water-use efficiency across all sectors and ensure sustainable withdrawals and supply of freshwater to address water scarcity and substantially reduce the number of people suffering from water scarcity
Table 44: Indicator 6.4.1 Change in water-use efficiency (WUE) over time 2015–2018
Compound annual growth rate (%)
Progress towards the SDG
Total -0.35
Source: Environmental statistics and accounts, SORS
Table 45: Indicator 6.4.2 Water exploitation index (WEI) (%)
Compound annual growth rate
Progress towards the SDG
2015–2018 6.01
1990–2018 0.32
Source: Environmental statistics and accounts, SORS

256 Progress report on the implementation of Sustainable Development Goals by 2030 in the Republic of Serbia
Target 6.a By 2030, expand international cooperation and capacity-building support to developing countries in water- and sanitation-related activities and programmes, including water harvesting, desalination, water efficiency, wastewater treatment, recycling and reuse technologies
Table 46: Indicator 6.a.1 Amount of water- and sanitation-related official development assistance that is part of a government-coordinated spending plan
Compound annual growth rate (%)
Progress towards the SDG
2015–2016 57.97
2000–2016 0.28
Source: GLAAS — UN-Water Global Analysis and Assessment of Sanitation and Drinking-Water
Target 6.b Support and strengthen the participation of local communities in improving water and sanitation management
Table 47: Indicator 6.b.1 Proportion of local administrative units with established and operational policies and procedures for participation of local communities in water and sanitation management
Indicators 6.b.1Scores Progress
towards the SDG2014 2017 2019
6.b.1a Level of participation of service users/communities in urban/rural drinking water planning programmes (3 = High; 2 = Medium; 1 = Low; 0 = N/A)
1 3 3
6.b.1b Level of definition in procedures for participation of service users/communities in the urban/rural drinking water planning programme (10 = Clearly defined; 5 = Not clearly defined; 0 = N/A)
10 10 10
6.b.1c Level of participation of users/communities in water resource planning and management programmes (3 = High; 2 = Medium; 1 = Low; 0 = N/A)
- 3 3
6.b.1d Level of definition in legal or policy procedures for the involvement of service users/communities in water resource planning and management (10 = Clearly defined; 5 = Not clearly defined; 0 = N/A)
- 10 10
Source: GLAAS — UN-Water Global Analysis and Assessment of Sanitation and Drinking-Water

257Progress report on the implementation of Sustainable Development Goals by 2030 in the Republic of Serbia
SDG 7 ENSURE ACCESS TO AFFORDABLE, RELIABLE, SUSTAINABLE AND MODERN ENERGY FOR ALL
Target 7.1 By 2030, ensure universal access to affordable, reliable and modern energy services
Table 48: Indicator 7.1.1 Proportion of population with access to electricity, 2010–2019
Compound annual growth rate (%)
Progress towards the SDG
Total 0
Roma settlements 0.16
Urban 0
Other 0.01
Source: Multiple Indicator Cluster Survey (MICS), SORS and UNICEF
Table 49: Indicator 7.1.2 Proportion of population with primary reliance on clean fuels and technology, 2010–2019
Compound annual growth rate (%)
Progress towards the SDG
Total -2.90
Roma settlements -7.20
Urban -2.30
Other -5.45
Source: Multiple Indicator Cluster Survey (MICS), SORS and UNICEF
Target 7.3 By 2030, double the global rate of improvement in energy efficiency
Table 50: Indicator 7.3.1 Energy intensity measured in terms of primary energy and GDP
Compound annual growth rate (%)
Progress towards the SDG
Total -1.38
Source: Energy statistics, SORS, National accounts, SORS and United Nations

258 Progress report on the implementation of Sustainable Development Goals by 2030 in the Republic of Serbia
SDG 8 PROMOTE SUSTAINED, INCLUSIVE AND SUSTAINABLE ECONOMIC GROWTH, FULL AND PRODUCTIVE EMPLOYMENT AND DECENT WORK FOR ALL
Target 8.1 Sustain per capita economic growth in accordance with national circumstances and, in particular, at least 7 per cent gross domestic product growth per annum in the least developed countries
Table 51: Indicator 8.1.1 Annual growth rate of real GDP per capita
Compound annual growth rate (%)
Progress towards the SDG
2015–2019 18.27
1996–2019 -1.24
Source: National accounts, SORS
Target 8.3 Promote development-oriented policies that support productive activities, decent job creation, entrepreneurship, creativity and innovation, and encourage the formalization and growth of micro-, small- and medium-sized enterprises, including through access to financial services
Table 52: Indicator 8.3.1 Proportion of informal employment in non-agriculture employment, by sex
Compound annual growth rate (%)
Progress towards the SDG
2015–2019
Total -3.10
Female -5.59
Male -1.42
2014–2019
Total 0.25
Female -1.33
Male 1.22
Source: Labour Force Survey, SORS

259Progress report on the implementation of Sustainable Development Goals by 2030 in the Republic of Serbia
Target 8.4 Improve progressively, by 2030, global resource efficiency in consumption and production and endeavour to decouple economic growth from environmental degradation, in accordance with the 10-Year Framework of Programmes on Sustainable Consumption and Production, with developed countries taking the lead
Table 53: Indicator 8.4.2a Domestic material consumption (DMC)
Compound annual growth rate (%)
Progress towards the SDG
2015–2018 2.71
2010–2018 0.88
Source: Environmental statistics and accounts, SORS
Table 54: Indicator 8.4.2b Resource productivity
Compound annual growth rate (%)
Progress towards the SDG
2015–2018 0.53
2010–2018 1.59
Source: Environmental statistics and accounts, SORS
Target 8.5 By 2030, achieve full and productive employment and decent work for all women and men, including for young people and persons with disabilities, and equal pay for work of equal value
Table 55: Indicator 8.5.1a Average hourly earnings of female and male employees, by age, 2014
RSD
Total Female Male
Total 364.42 346.81 379.96
15–29 293.31 287.65 297.61
30–39 364.05 345.55 381.08
40–49 371.67 351.93 391.54
50–59 385.6 365.4 403.85
60+ 444.46 441.97 445.37
Source: Employment and earnings statistics, SORS

260 Progress report on the implementation of Sustainable Development Goals by 2030 in the Republic of Serbia
Table 56: Indicator 8.5.1b Average hourly earnings of female and male employees, by occupation, 2014
RSD
Total Female Male
Engineers, technicians and associate professionals
401.4 371.14 442.48
Experts and artists 507.26 476.61 560.7
Clerical support workers
346.44 342.33 352.93
Craft and related trades workers
294.82 223.36 321.94
Service and sales workers
247.44 230.6 266.15
Plant and machine operators and assemblers
316.09 262.01 323.39
Skilled agricultural, forestry and fishery workers
381.9 262.02 437.08
Elementary occupations
243.35 210.04 277.33
Source: Employment and earnings statistics, SORS
Table 57: Indicator 8.5.2a Unemployment rate (15–24 years of age)
Compound annual growth rate (%)
Progress towards the SDG
2015–2019
Total -10.68
Female -11.25
Male -10.18
2014–2019
Total -10.36
Female -9.77
Male -10.75
Source: Labour Force Survey, SORS

261Progress report on the implementation of Sustainable Development Goals by 2030 in the Republic of Serbia
Table 58: Indicator 8.5.2b Unemployment rate (15–64 years of age)
Compound annual growth rate (%)
Progress towards the SDG
2015–2019
Total -12.03
Female -12.14
Male -12.07
2014–2019
Total -11.34
Female -11.35
Male -11.45
Source: Labour Force Survey, SORS
Target 8.6 By 2020, substantially reduce the proportion of youth not in employment, education or training
Table 59: Indicator 8.6.1 Proportion of youth (aged 15–24 years) not in education, employment or training
Compound annual growth rate (%)
Progress towards the SDG
2015–2019
Total -6.36
Female -5.25
Male -7.48
2014–2019
Total -5.59
Female -4.51
Male -6.76
Source: Labour Force Survey, SORS

262 Progress report on the implementation of Sustainable Development Goals by 2030 in the Republic of Serbia
Target 8.7 Take immediate and effective measures to eradicate forced labour, end modern slavery and human trafficking and secure the prohibition and elimination of the worst forms of child labour, including recruitment and use of child soldiers, and by 2025 end child labour in all its forms
Table 60: Indicator 8.7.1 Proportion and number of children aged 5–17 years engaged in child labour, by sex and age, 2014–2019
Compound annual growth rate (%)
Progress towards the SDG
Total 0
GenderFemale 2.59
Male -1.70
Settlement type
Urban 3.86
Other -1.66
Roma settlements 2.82
Age
5–11 years 5.79
12–14 years -5.81
15–17 years -0.13
In educationNot in education -2.11
In education 0
Wealth index quintiles
Poorest -3.53
Second 8.59
Middle -7.34
Fourth -5.41
Richest 12.42
Source: Multiple Indicator Cluster Survey (MICS), SORS and UNICEF

263Progress report on the implementation of Sustainable Development Goals by 2030 in the Republic of Serbia
Target 8.10 Strengthen the capacity of domestic financial institutions to encourage and expand access to banking, insurance and financial services for all
Table 61: Indicator 8.10.1a Number of commercial bank branches per 100,000 adults
Compound annual growth rate (%)
Progress towards the SDG
2015–201915+ -1.52
18+ -1.46
2004–201915+ 1.71
18+ 1.66
Source: National Bank of Serbia and National accounts, SORS
Table 62: Indicator 8.10.1b Number of automated teller machines (ATMs) per 100,000 adults
Compound annual growth rate (%)
Progress towards the SDG
2015–201915+ 2.72
18+ 2.79
2005–201915+ 9.84
18+ 9.75
Source: National Bank of Serbia and National accounts, SORS

264 Progress report on the implementation of Sustainable Development Goals by 2030 in the Republic of Serbia
SDG 9 BUILD RESILIENT INFRASTRUCTURE, PROMOTE INCLUSIVE AND SUSTAINABLE INDUSTRIALIZATION AND FOSTER INNOVATION
Target 9.2 Promote inclusive and sustainable industrialization and, by 2030, significantly raise industry’s share of employment and gross domestic product, in line with national circumstances, and double its share in least developed countries
Table 63: Indicator 9.2.1 Manufacturing value added as a proportion of GDP per capita
Compound annual growth rate (%)
Progress towards the SDG
2015–2018 0.43
1995–2018 -0.32
Source: National accounts, SORS
Table 64: Indicator 9.2.2 Manufacturing employment as a proportion of total employment
Compound annual growth rate
Progress towards the SDG
2015–2019 3.81
2014–2019 3.30
Source: Labour Force Survey, SORS

265Progress report on the implementation of Sustainable Development Goals by 2030 in the Republic of Serbia
Target 9.5 Enhance scientific research, upgrade the technological capabilities of industrial sectors in all countries, in particular developing countries, including, by 2030, encouraging innovation and substantially increasing the number of research and development workers per 1 million people and public and private research and development spending
Table 65: Indicator 9.5.1 Research and development expenditure as a proportion of GDP, by sectors
Compound annual growth rate (%)
Progress towards the SDG
2015–2018
Total 4.34
Non-financial business sector 11.46
Higher education sector -3.13
State sector 5.73
2007–2018
Total 4.28
Non-financial business sector 38.51
Higher education sector -0.86
State sector 0.73
Source: Science, technology and innovation statistics, SORS
Table 66: Indicator 9.5.2 Researchers (in full-time equivalent) per million inhabitants
Compound annual growth rate (%)
Progress towards the SDG
2015–2018 0.27
2007–2018 4.49
Source: Science, technology and innovation statistics, SORS

266 Progress report on the implementation of Sustainable Development Goals by 2030 in the Republic of Serbia
Target 9.c Significantly increase access to information and communications technology and strive to provide universal and affordable access to the Internet in least developed countries by 2020
Table 67: Indicator 9.c.1 Proportion of population covered by a mobile network, by technology
Compound annual growth rate (%)
Progress towards the SDG
4G 2015–2019 14.30
3G 2008–2019 5.33
2G 2005–2019 0.31
Source: Regulatory Agency for Electronic Communications and Postal Services (RATEL)

267Progress report on the implementation of Sustainable Development Goals by 2030 in the Republic of Serbia
SDG 10 REDUCE INEQUALITY WITHIN AND AMONG COUNTRIES
Target 10.4 Adopt policies, especially fiscal, wage and social protection policies, and progressively achieve greater equality
Table 68: Indicator 10.3.1 Proportion of women aged 15 to 49 reporting having personally felt discriminated against or harassed in the previous 12 months and those reporting not having personally felt discriminated against or harassed, Serbia and Roma settlements, 2019 (%)
Serbia Roma settlements
Total 6.9 12.5
Settlement typeUrban 8.1 14.1
Other 4.8 9.2
Age
15–19 4.4 10.6
15–17 5.7 11.2
18–19 2.9 9.6
20–24 4.4 11.5
25–29 7.3 15.1
30–34 6.6 9.9
35–39 8.0 17.8
40–44 9.5 14.1
45–49 6.7 8.9
Education
Primary or none 7.6 10.9
Secondary 5.0 12.2
Higher 9.1 14.5
Wealth index quintile
Poorest 7.1 13.8
Second 6.0 12.0
Middle 6.5 13.7
Fourth 5.2 13.6
Richest 9.4 9.5
Source: Multiple Indicator Cluster Survey (MICS), SORS and UNICEF
Table 69: Indicator 10.4.1 Labour share of GDP, comprising wages and social protection transfers
Compound annual growth rate (%)
Progress towards the SDG
2015–2018 1.29
Source: National accounts, SORS

268 Progress report on the implementation of Sustainable Development Goals by 2030 in the Republic of Serbia
SDG 11 MAKE CITIES AND HUMAN SETTLEMENTS INCLUSIVE, SAFE, RESILIENT AND SUSTAINABLE
Target 11.6 By 2030, reduce the adverse per capita environmental impact of cities, including by paying special attention to air quality and municipal and other waste management
Table 70: Indicator 11.6.1a Recycling rate of municipal waste
Compound annual growth rate (%)
Progress towards the SDG
2013–2016 -33.06
Source: Environmental Protection Agency — Survey on Municipal Waste
Table 71: Indicator 11.6.1b Generation of waste excluding major mineral waste
Compound annual growth rate (%)
Progress towards the SDG
2015–2018 9.48
2010–2018 3.39
Source: Environmental statistics and accounts, SORS

269Progress report on the implementation of Sustainable Development Goals by 2030 in the Republic of Serbia
SDG 12 ENSURE SUSTAINABLE CONSUMPTION AND PRODUCTION PATTERNS
Target 12.2 By 2030, achieve the sustainable management and efficient use of natural resources
Table 72: 12.2.2a Domestic material consumption (DMC)
Compound annual growth rate (%)
Progress towards the SDG
2015–2018 2.71
2010–2018 0.88
Source: Environmental statistics and accounts, SORS
Table 73: 12.2.2b Resource productivity
Compound annual growth rate (%)
Progress towards the SDG
2015–2018 0.53
2010–2018 1.59
Source: Environmental statistics and accounts, SORS
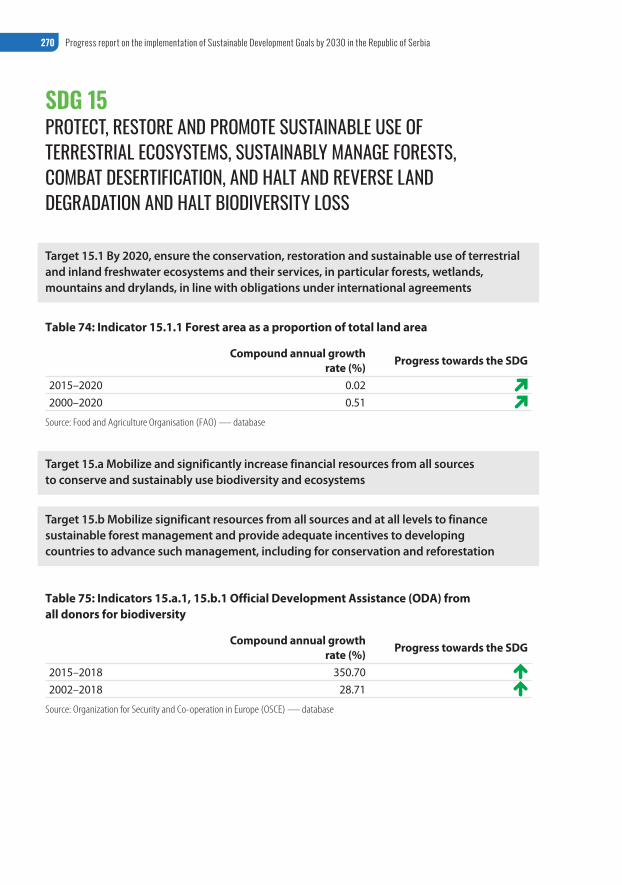
270 Progress report on the implementation of Sustainable Development Goals by 2030 in the Republic of Serbia
SDG 15 PROTECT, RESTORE AND PROMOTE SUSTAINABLE USE OF TERRESTRIAL ECOSYSTEMS, SUSTAINABLY MANAGE FORESTS, COMBAT DESERTIFICATION, AND HALT AND REVERSE LAND DEGRADATION AND HALT BIODIVERSITY LOSS
Target 15.1 By 2020, ensure the conservation, restoration and sustainable use of terrestrial and inland freshwater ecosystems and their services, in particular forests, wetlands, mountains and drylands, in line with obligations under international agreements
Table 74: Indicator 15.1.1 Forest area as a proportion of total land area
Compound annual growth rate (%)
Progress towards the SDG
2015–2020 0.02
2000–2020 0.51
Source: Food and Agriculture Organisation (FAO) — database
Target 15.a Mobilize and significantly increase financial resources from all sources to conserve and sustainably use biodiversity and ecosystems
Target 15.b Mobilize significant resources from all sources and at all levels to finance sustainable forest management and provide adequate incentives to developing countries to advance such management, including for conservation and reforestation
Table 75: Indicators 15.a.1, 15.b.1 Official Development Assistance (ODA) from all donors for biodiversity
Compound annual growth rate (%)
Progress towards the SDG
2015–2018 350.70
2002–2018 28.71
Source: Organization for Security and Co-operation in Europe (OSCE) — database

271Progress report on the implementation of Sustainable Development Goals by 2030 in the Republic of Serbia
SDG 16 PROMOTE PEACEFUL AND INCLUSIVE SOCIETIES FOR SUSTAINABLE DEVELOPMENT, PROVIDE ACCESS TO JUSTICE FOR ALL AND BUILD EFFECTIVE, ACCOUNTABLE AND INCLUSIVE INSTITUTIONS AT ALL LEVELS
Target 16.1 Significantly reduce all forms of violence and related death rates everywhere
Table 76: Indicator 16.1.3 Proportion of women aged 18 to 74 subjected to physical, psychological or sexual violence in the previous 12 months, 2018
%
Total 10.4
Age
18–29 10.2
30–39 9.6
40–49 11.9
50–59 13.2
60–74 8.2
Women refugees/ Internally displaced persons 23.2
Women with disabilities 23.4
Women from national minorities 18.3
Material deprivation level
Very difficult to get by on current income
22.5
Difficult to get by on current income
18.2
Getting by on current income 9.4
Lives well on current income 6.3
Source: OSCE — Survey on the Wellbeing and Safety of Women

272 Progress report on the implementation of Sustainable Development Goals by 2030 in the Republic of Serbia
Table 77: Indicator 16.1.4 Proportion of population that feel safe walking alone around the area they live after dark or when home alone after dark, Serbia and Roma settlements, 2019 (%)
Serbia Roma settlements
Total 87.5 71.0
Settlement typeUrban 86.8 67.1
Other 88.6 78.9
Age
15–19 82.5 68.3
15–17 80.6 71.8
18–19 84.7 63.3
20–24 89.5 65.7
25–29 85.4 70.5
30–34 88.6 76.9
35–39 88.9 72.6
40–44 85.9 72.5
45–49 89.5 74.7
Education
Primary or none 79.8 70.4
Secondary 87.1 70.6
Higher 89.5 72.4
Wealth index quintile
Poorest 84.0 68.3
Second 89.0 74.1
Middle 86.1 74.0
Fourth 90.2 67.5
Richest 86.9 70.9
Source: Multiple Indicator Cluster Survey (MICS), SORS and UNICEF

273Progress report on the implementation of Sustainable Development Goals by 2030 in the Republic of Serbia
Target 16.2 End abuse, exploitation, trafficking and all forms of violence against and torture of children
Table 78: Indicator 16.2.1 Proportion of children aged 1–14 years who experienced any physical punishment and/or psychological aggression by caregivers in the past month, 2014–2019
Compound annual growth rate
Progress towards the SDG
Total 0.64
Roma settlements 0.42
Wealth index quintiles
Poorest -3.76
Second -3.55
Middle -0.85
Fourth 3.76
Richest 4.54
Source: Multiple Indicator Cluster Survey (MICS), SORS and UNICEF
Table 79: Indicator 16.2.2 Number of victims of human trafficking, by sex, age and form of exploitation, 20014–2018
Compound annual growth rate
Progress towards the SDG
Total -11.70
GenderFemale 24.14
Male -34.14
AgeMinors 13.92
Adults -19.73
Source: Center for Human Trafficking Victims Protection — annual reports

274 Progress report on the implementation of Sustainable Development Goals by 2030 in the Republic of Serbia
Target 16.3 Promote the rule of law at the national and international levels and ensure equal access to justice for all
Table 80: Indicator 16.3.1 Proportion of victims of violence in the previous 12 months who reported their victimization to competent authorities or other officially recognized conflict resolution mechanisms, 2019
Serbia Roma settlements
Total 40.0 67.0
Settlement typeUrban 47.6 56.9
Other (*) 85.1
Source: Multiple Indicator Cluster Survey (MICS), SORS and UNICEF
Table 81: Indicator 16.3.2 Unsentenced detainees as a proportion of overall prison population, 2015–2018
Compound annual growth rate
Progress towards the SDG
Total 0.65
GenderFemale 18.08
Male -0.22
Source: Ministry of Justice — Administration for Enforcement of Penal Sanctions
Target 16.5 Substantially reduce corruption and bribery in all their forms
Table 82: Indicator 16.5.1 Proportion of persons who had at least one contact with a public official and who paid a bribe to a public official, or were asked for a bribe by those public officials, during the previous 12 months, 2010
%
Total 8.5
GenderFemale 10.0
Male 9.3
Source: Survey on use of public services and public integrity, UNODC and SORS

275Progress report on the implementation of Sustainable Development Goals by 2030 in the Republic of Serbia
Target 16.6 Develop effective, accountable and transparent institutions at all levels
Table 83: Indicator 16.6.1 Primary government expenditures as a proportion of original approved budget, by sector (or by budget codes or similar), 2015–2019
Compound annual growth rate (%)
Progress towards the SDG
Total 1.05
Sector
Religion and diaspora 0.69
Economic and development policy 3.71
Energy, mineral resources and mining
1.57
Environmental protection 7.33
Health care 12.88
Emergency programmes and provisioning
3.77
Public safety -0.21
Culture, communication and media -0.30
Human rights and civil society 7.02
Science, technological development and innovation
0.18
Education 0.18
Defense 0.50
General public administration services 2.52
Political system 1.24
Agriculture and rural development -2.05
Transport and transport infrastructure -0.23
Public debt servicing 0.41
Social protection 0.62
Foreign affairs 0.68
Youth and sports 0.28
Courts and legal system 0.37
Labour market 5.43
Urban and spatial planning 0.63
Financial and fiscal system 2.70
Source: Ministry of Finance — Budget Sector

276 Progress report on the implementation of Sustainable Development Goals by 2030 in the Republic of Serbia
Target 16.9 By 2030, provide legal identity for all, including birth registration
Table 84: Indicator 16.9.1 Proportion of children under 5 years of age whose births have been registered with a civil authority, by age, 2019 (%)
Serbia Roma settlements
Total 99.9 98.5
GenderFemale 99.8 98.6
Male 100.0 98.3
Settlement typeUrban 99.9 97.9
Other 99.9 99.7
Source: Multiple Indicator Cluster Survey (MICS), SORS and UNICEF
Target 16.b.1 Promote and enforce non-discriminatory laws and policies for sustainable development
Table 85: Indicator 16.1 Proportion of women aged 15 to 49 reporting having personally felt discriminated against or harassed in the previous 12 months, 2019 (%)
Serbia Roma settlements
Total 6.9 12.5
Settlement typeUrban 8.1 14.1
Other 4.8 9.2
Age
15–19 4.4 10.6
20–24 4.4 11.5
25–29 7.3 15.1
30–34 6.6 9.9
35–39 8.0 17.8
40–44 9.5 14.1
45–49 6.7 8.9
Education
Primary or none 7.6 10.9
Secondary 5.0 12.2
Higher 9.1 14.5
Wealth index quintile
Poorest 7.1 13.8
Second 6.0 12.0
Middle 6.5 13.7
Fourth 5.2 13.6
Richest 9.4 9.5
Source: Multiple Indicator Cluster Survey (MICS), SORS and UNICEF

277Progress report on the implementation of Sustainable Development Goals by 2030 in the Republic of Serbia
SDG 17 STRENGTHEN THE MEANS OF IMPLEMENTATION AND REVITALIZE THE GLOBAL PARTNERSHIP FOR SUSTAINABLE DEVELOPMENT
Target 17.1 Strengthen domestic resource mobilization, including through international support to developing countries, to improve domestic capacity for tax and other revenue collection
Table 86: Indicator 17.1.1 Total government revenue as a proportion of GDP, by source
Compound annual growth rate (%)
Progress towards the SDG
2015–2018 2.05
2013–2018 1.76
Source: National accounts, SORS
Target 17.3Mobilize additional financial resources for developing countries from multiple sources
Table 87: Indicator 17.3.2 Volume of remittances (in United States dollars) as a proportion of total GDP
Compound annual growth rate (%)
Progress towards the SDG
2015–2019 -0.89
2007–2019 -0.40
Source: National Bank of Serbia and National accounts, SORS
Target 17.4 Assist developing countries in attaining long-term debt sustainability through coordinated policies aimed at fostering debt financing, debt relief and debt restructuring, as appropriate, and address the external debt of highly indebted poor countries to reduce debt distress
Table 88: Indicator 17.4.1 Debt service as a proportion of exports of goods and services
Compound annual growth rate (%)
Progress towards the SDG
2015–2019 -1.94
2007–2019 3.05
Source: National Bank of Serbia — Department of Payment Balance Statistics

278 Progress report on the implementation of Sustainable Development Goals by 2030 in the Republic of Serbia
Target 17.6 Enhance North-South, South-South and triangular regional and international cooperation on and access to science, technology and innovation and enhance knowledge-sharing on mutually agreed terms, including through improved coordination among existing mechanisms, in particular at the United Nations level, and through a global technology facilitation mechanism
Table 89: Indicator 17.6.2 Number of subscribers (subscriptions) of fixed broadband Internet access per 100 inhabitants, according to speeds
Compound annual growth rate (%)
Progress towards the SDG
2015–2019
Total 5.87
Higher or equal to 10 Mbit/s
9.92
Higher or equal from 2 Mbit/s to 10 Mbit/s
-22.64
Higher or equal from 256 kbit/s to 2 Mbit/s
-36.78
2010–2019
Total 10.62
Higher or equal to 10 Mbit/s
92.02
Higher or equal from 2 Mbit/s to 10 Mbit/s
-6.90
Higher or equal from 256 kbit/s to 2 Mbit/s
-43.12
Source: Regulatory Agency for Electronic Communications and Postal Services (RATEL) and Vital Statistics, SORS
Target 17.8 Fully operationalize the technology bank and science, technology and innovation capacity-building mechanism for least developed countries by 2017 and enhance the use of enabling technology, in particular information and communications technology
Table 90: Indicator 17.8.1 Proportion of individuals using the Internet
Compound annual growth rate (%)
Progress towards the SDG
2015–2019
Total 4.34
Female 5.14
Male 3.59
2007–2018
Total 9.46
Female 10.81
Male 7.96
Source: Information and Communication Technology statistics, SORS

279Progress report on the implementation of Sustainable Development Goals by 2030 in the Republic of Serbia
ANNEX 3LINKS TO SDG DATA
http://sdg.indikatori.rs
http://devinfo.stat.gov.rs/diFiles/diProfili/SDG_Srbija_cir.pdf
http://devinfo.stat.gov.rs/diFiles/diProfili/SDG_Srbija_lat.pdf
http://devinfo.stat.gov.rs/diFiles/diProfili/SDG_Serbia.pdf

280 Progress report on the implementation of Sustainable Development Goals by 2030 in the Republic of Serbia
ANNEX 4PROGRESS DASHBOARD TOWARDS THE SUSTAINABLE DEVELOPMENT GOALS
SDG INDICATORS
SDG 11.2.1 1.2.2 1.3.1 1.4.1a, b 1.a.2
SDG 22.1.2.a 2.1.2.b 2.1.2.c 2.1.2.d 2.2.1 2.2.2a 2.2.2b 2.a.1
SDG 33.1.1 3.1.2 3.2.1 3.2.2 3.3.2 3.4.1 3.4.2 3.7.1 3.7.2 3.8.1 3.9.3 3.b.1 3.c.1
SDG 44.1.2a 4.1.2b 4.1.2c 4.2.1 4.2.2 4.3.1 4.5.1 4.6.1
SDG 55.1.1 5.2.1 5.2.2 5.3.1a 5.3.1b 5.4.1 5.5.1 5.5.2 5.6.1 5.a.2 5.b.1
SDG 66.2.1 6.3.1 6.4.1 6.4.2 6.a.1 6.b.1a 6.b.1b 6.b.1c 6.b.1d
SDG 77.1.1 7.1.2 7.3.1
SDG 88.1.1 8.3.1 8.4.2a 8.4.2b 8.5.1a 8.5.1b 8.5.2a 8.5.2b 8.6.1 8.7.1 8.10.1a 8.10.1b
SDG 9 9.2.1 9.2.2 9.5.1 9.5.2 9.c.1
SDG 1010.1.1 10.3.1 10.4.1
SDG 1111.6.1a 11.6.1b
SDG 1212.2.2a 12.2.2b
SDG 1515.1.1 15.a.1 15.b1
SDG 1616.1.3 16.1.4 16.2.1 16.2.2 16.3.1 16.3.2 16.5.1 16.6.1 16.9.1 16.b.1
SDG 1717.1.1 17.3.2 17.4.1 17.6.2 17.8.1
