progresses on velocity dispersion and wave attenuation ... · progresses on velocity dispersion and...
TRANSCRIPT

Progresses on velocity dispersion and wave attenuation measurements at seismic frequency Qiuliang Yao*, De-Hua Han, Rock Physics Lab, University of Houston
Summary
A low frequency measurement system has been designed and built at UH rock physics lab. From measured Young’s modulus, Poisson ratio, and phase difference, the velocities and attenuation in rock samples can be obtained. Tests with the system demonstrate it can successfully detect the fluid flow related velocity dispersion and wave attenuation. The random error and system error are evaluated to be within reasonable level. Limited by the strain gage techniques, the absolute values on modulus or velocity obtained from the current system may not be very accurate, in soft rock samples like heavy oil sand. But the attenuation and relative dispersion trend are still trustable.
Introduction
A low frequency measurement system is essential for the study of velocity dispersion and attenuation in three aspects: First, the velocities measured at seismic frequencies can enhance the seismic applications, like seismic-well tie and low frequency trend building in inversion. Second, it can be used to justify and calibrate the theoretical models on velocity dispersion and attenuation. Finally, the dispersion and attenuation in reservoir rock is closely related to the interaction between pore fluid and rock frame. Measured dispersion and attenuation data contain important information about both the rock and fluid, and has potential to become new fluid indicators.
The practice of low frequency measurements expanded from resonance-bar techniques (e.g., Winkler and Nur, 1982; Murphy, 1982, 1984, Yin et al., 1992) into force-deformation (stress-strain) method, which covers the real seismic frequency range (e.g., Spencer, 1981; Liu and Peselnick 1983; Batzle et al., 2006). The principals of this method have been well described in Gautam (2003), Hofmann (2006), Adam et al., (2009). Recent exploration activities in high heterogeneous rocks like carbonate and organic shale have stimulated more efforts on building low frequency measurement capabilities (e.g., Madonna et al., 2010; Mikhaltsevitch et al., 2011; Madonna and Tisato, 2013). However, the availability of such measurements are still rare, due to the high complexity of system design, fabrication, and very demanding sample preparation and measurement operation procedures. Furthermore, the results from the currently available systems are still experiencing problems like low repeatability, high random errors, and lack of calibrations.
The low frequency measurement system developed in UH rock physics lab follows the same dynamic stress-strain hysteresis measurement principles used by Spencer (1981),
Liu and Peselnick (1983) and Batzle et al. (2006), therefore encountered the same troubles and issues they have experienced. In this abstract, we will discuss four major challenges and our strategies to mitigate their effects on measurement results.
Small signal-noise ratio and high random errors
To simulate the subsurface seismic conditions, strain level in the experiment has to be controlled below <10-6. As a consequence, the strain gage outputs are in micro volt range and be easily buried in much large EMF noise. This is one of the major root causes for large random errors in measurement results (e.g., Adam et al., 2009).
To retrieve a small signal with known frequency from an extremely noisy environment, a lock-in amplifier is typically used. Figure 1 shows the principals of the lock-in amplifier. It can be viewed as a very narrow band Fourier transform, which only keeps the amplitude and phase at one particular frequency.
Figure 1. Principles of lock-in amplifier
The early lock-in amplifiers were implemented with analog electronic circuits with very high complexity and low stability. We believe the major task of the lock-in amplifier can be accomplished completely with software. Based on a National Instrument’s simple virtual lock-in algorithm, we developed such a virtual lock-in amplifier. Compared with the standalone hardware lock-in amplifier, there are several notable advantages:
1. By separating the lock-in process from the data acquisition, we have the ability to select the best acquisition instruments for our application: a NI4498 acquisition system with 24 bit vertical resolution, which means a resolution to 37nV.
2. Developed in National Instrument Labview platform, this lock-in amplifier has the highest integrity with the NI acquisition hardware. It is also
DOI http://dx.doi.org/10.1190/segam2013-1217.1© 2013 SEGSEG Houston 2013 Annual Meeting Page 2883
Dow
nloa
ded
10/1
8/13
to 1
29.7
.247
.234
. Red
istr
ibut
ion
subj
ect t
o SE
G li
cens
e or
cop
yrig
ht; s
ee T
erm
s of
Use
at h
ttp://
libra
ry.s
eg.o
rg/

Low frequency measurements
highly integrated with the post acquisition operations, like data recording, processing, and real time display.
3. It provides users with high flexibility to configure the system according to different measurement setups. For example, one can also easily add calibration coefficients to correct the system errors.
Besides the superior performance of the virtual lock-in amplifier, many special cares has been taken into the hardware protection on small signal, including grounding, shielding, shield-drive-amplifier, pseudo differential input configuration etc. As a result, the random errors in our measurements results are well suppressed. Figure 2 displays a raw data on measured Young’s modulus and Poisson ratio (left), compared with published data (right) from Adam et al., (2009). It demonstrates that the current system has a much lower random errors thus serves better to interpret measured data.
Figure 2. Comparison on random errors between our measured data (left) and published data (right, Adam et al., 2009).
Non-uniform stress distribution: system errors
In current measurement configurations, a standard material is used to relatively compare with the strain on measured samples. The assumption is that the stresses on standard and sample are equal to each other. In reality, the physical boundary conditions on the sample and standard make this assumption rarely a truth, especially when two pieces are not perfectly touching to each other. In Figure 3, we used FEM to numerically simulate when there is a gap at the center (top case) or along the edge (bottom case) between sample and standard, the strain value at the strain gage location on sample (black rectangular) may well deviate from its expected true value. Liu and Peselnick (1983) suggested an optically shining machined flat surface to avoid such gaps but it’s costly unrealistic in our applications. Our tests show by applying a vertical stress above 6MPa can reasonably remedy such problem. But the concern is that such a stress may alter the sample properties resulting in other type of errors. At this moment, the only practical solution is to glue all interfaces together with epoxy, even it means the sacrifice on sample preparation efficiency and cost.
Figure 3. Non-uniform stress distribution due to the bad contact between sample and standard material.
Furthermore, the location of the strain gage can also affect the relative strain ratio between sample and standard. Such errors are sample specific thus cannot be calibrated at the system level. However, those effects are believed to be independent to the frequency and fluid saturation. Additionally, for most well consolidated rocks, dry samples are believed to be non dispersive. Based on this, we can measure the dry velocities at ultrasonic frequency separately, and use these values to carry out a sample level calibration.
Pressure relaxation through surface & fluid line: fake dispersion/attenuation
Experimental and theoretical studies (Hofmann, 2006; Yao, 2013) indicate that a non closed boundary condition can cause fluid relaxation and generate erroneous results in low frequency measurement. A rubber sleeve typically used in ultrasonic measurement doesn’t serve as a good seal at low frequency due to its resiliency. Instead, a thin layer of stiff epoxy has to be applied on sample surface to block all communication between pore fluid and confining pressure.
More challenges come from the pore fluid line which is always necessary for saturation and pore pressure control. Numerical simulations (Figure 4) show that the induced pore pressure increment at strain gage location can be relaxed to about ¼ of its original value in less than 1 second, in a sample with permeability of 1 mDarcy, if connected with a large fluid tank, like pump.
Figure 4. Pore pressure evolutions at strain gage location with opened (left) and closed (right) pore fluid line.
0
5000
10000
15000
20000
25000
0 0.2 0.4 0.6 0.8 1
Time (s)
Pres
sure
(Pa)
.
1000mD 0.2mm100 mD 0.2mm10mD 0.2mm1mD 0.2mm
P ossion Ra tio
0.150
0.155
0.160
0.165
0.170
0.175
0.180
1 10 100 1000 10000Freq. Hz
Poss
ion
Rat
io
14.00
15.00
16.00
17.00
18.00
19.00
20.00
1 10 100 1000 10000Freq. Hz
Youn
g's
Mod
ulus
GPa
Expectation value: 1.0E-6
At strain gage location: 0.78E-6
At strain gage location: 0.93E-6
DOI http://dx.doi.org/10.1190/segam2013-1217.1© 2013 SEGSEG Houston 2013 Annual Meeting Page 2884
Dow
nloa
ded
10/1
8/13
to 1
29.7
.247
.234
. Red
istr
ibut
ion
subj
ect t
o SE
G li
cens
e or
cop
yrig
ht; s
ee T
erm
s of
Use
at h
ttp://
libra
ry.s
eg.o
rg/
Low frequency measurements
Our remedy to this issue is to install a valve very close to the entry point of sample. Simulation results show when the valve is closed, the pore pressure at strain gage location remains un-dropped even at the lowest frequency in our measurements. The physical test results with water saturated sandstone (Figure 8 & 9) also verified that this valve successfully prevent the drainage effect through pore fluid line.
Phase shift by electronics: fake attenuation
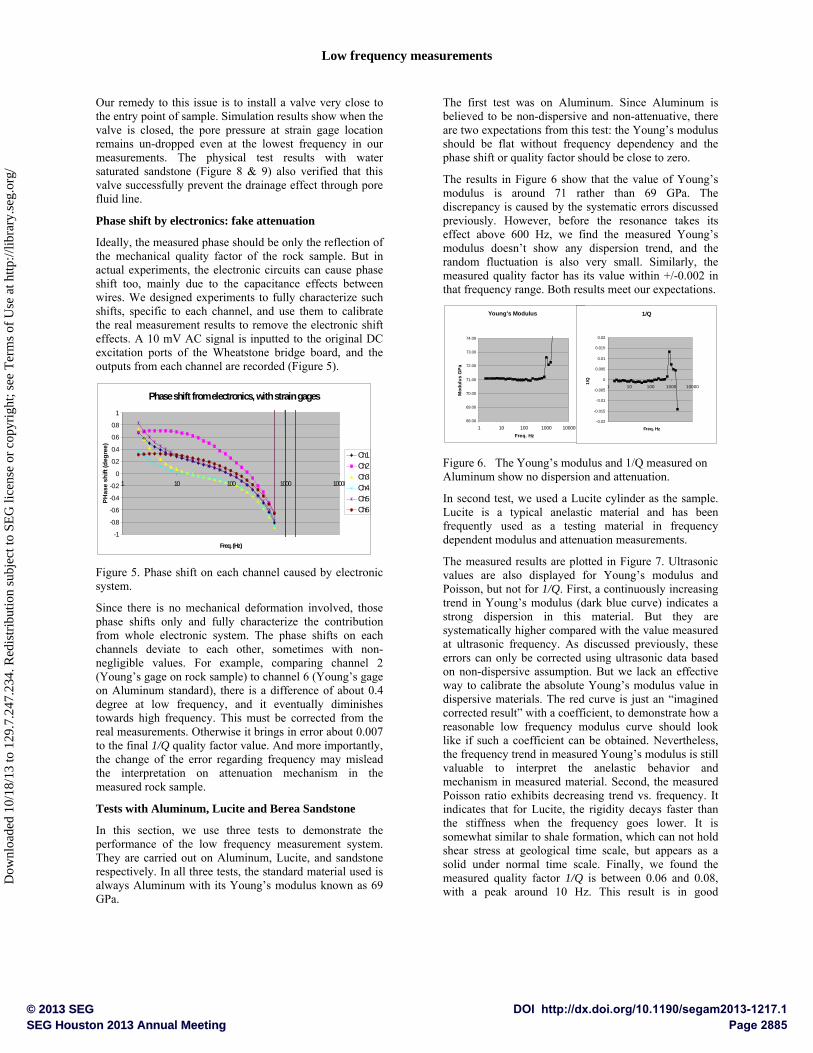
Ideally, the measured phase should be only the reflection of the mechanical quality factor of the rock sample. But in actual experiments, the electronic circuits can cause phase shift too, mainly due to the capacitance effects between wires. We designed experiments to fully characterize such shifts, specific to each channel, and use them to calibrate the real measurement results to remove the electronic shift effects. A 10 mV AC signal is inputted to the original DC excitation ports of the Wheatstone bridge board, and the outputs from each channel are recorded (Figure 5).
Phase shift from electronics, with strain gages
-1
-0.8
-0.6
-0.4
-0.2
0
0.2
0.4
0.6
0.8
1
1 10 100 1000 10000
Freq. (Hz)
PHas
e sh
ift (d
egre
e)
Ch1Ch2Ch3Ch4Ch5Ch6
Figure 5. Phase shift on each channel caused by electronic system.
Since there is no mechanical deformation involved, those phase shifts only and fully characterize the contribution from whole electronic system. The phase shifts on each channels deviate to each other, sometimes with non-negligible values. For example, comparing channel 2 (Young’s gage on rock sample) to channel 6 (Young’s gage on Aluminum standard), there is a difference of about 0.4 degree at low frequency, and it eventually diminishes towards high frequency. This must be corrected from the real measurements. Otherwise it brings in error about 0.007 to the final 1/Q quality factor value. And more importantly, the change of the error regarding frequency may mislead the interpretation on attenuation mechanism in the measured rock sample.
Tests with Aluminum, Lucite and Berea Sandstone
In this section, we use three tests to demonstrate the performance of the low frequency measurement system. They are carried out on Aluminum, Lucite, and sandstone respectively. In all three tests, the standard material used is always Aluminum with its Young’s modulus known as 69 GPa.
The first test was on Aluminum. Since Aluminum is believed to be non-dispersive and non-attenuative, there are two expectations from this test: the Young’s modulus should be flat without frequency dependency and the phase shift or quality factor should be close to zero.
The results in Figure 6 show that the value of Young’s modulus is around 71 rather than 69 GPa. The discrepancy is caused by the systematic errors discussed previously. However, before the resonance takes its effect above 600 Hz, we find the measured Young’s modulus doesn’t show any dispersion trend, and the random fluctuation is also very small. Similarly, the measured quality factor has its value within +/-0.002 in that frequency range. Both results meet our expectations.
Figure 6. The Young’s modulus and 1/Q measured on Aluminum show no dispersion and attenuation.
In second test, we used a Lucite cylinder as the sample. Lucite is a typical anelastic material and has been frequently used as a testing material in frequency dependent modulus and attenuation measurements.
The measured results are plotted in Figure 7. Ultrasonic values are also displayed for Young’s modulus and Poisson, but not for 1/Q. First, a continuously increasing trend in Young’s modulus (dark blue curve) indicates a strong dispersion in this material. But they are systematically higher compared with the value measured at ultrasonic frequency. As discussed previously, these errors can only be corrected using ultrasonic data based on non-dispersive assumption. But we lack an effective way to calibrate the absolute Young’s modulus value in dispersive materials. The red curve is just an “imagined corrected result” with a coefficient, to demonstrate how a reasonable low frequency modulus curve should look like if such a coefficient can be obtained. Nevertheless, the frequency trend in measured Young’s modulus is still valuable to interpret the anelastic behavior and mechanism in measured material. Second, the measured Poisson ratio exhibits decreasing trend vs. frequency. It indicates that for Lucite, the rigidity decays faster than the stiffness when the frequency goes lower. It is somewhat similar to shale formation, which can not hold shear stress at geological time scale, but appears as a solid under normal time scale. Finally, we found the measured quality factor 1/Q is between 0.06 and 0.08, with a peak around 10 Hz. This result is in good
Young's Modulus
68.00
69.00
70.00
71.00
72.00
73.00
74.00
1 10 100 1000 10000Freq. Hz
Mod
ulus
GPa
1/Q
-0.02
-0.015
-0.01
-0.005
0
0.005
0.01
0.015
0.02
1 10 100 1000 10000
Freq. Hz
1/Q
DOI http://dx.doi.org/10.1190/segam2013-1217.1© 2013 SEGSEG Houston 2013 Annual Meeting Page 2885
Dow
nloa
ded
10/1
8/13
to 1
29.7
.247
.234
. Red
istr
ibut
ion
subj
ect t
o SE
G li
cens
e or
cop
yrig
ht; s
ee T
erm
s of
Use
at h
ttp://
libra
ry.s
eg.o
rg/

Low frequency measurements
agreement with published literatures (Spenser, 1981; Lakes, 2009; Tisato et al., 2011).
Figure 7. Measured Young’s modulus, Poisson ratio and 1/Q on a Lucite sample.
In third test, we used a Berea sandstone sample, measured and compared the properties under dry and water saturated conditions, to check whether our system can detect any fluid flow related dispersion and attenuation.
Before low frequency measurement, the dry Vp and Vs of this sample were measured under ultrasonic frequency. Then a Gassmann substitution was done to predict the low frequency properties. For low frequency measurements, we first measured the dry properties under 750 psi confining pressure. Then the sample was saturated with water. Pore pressure was maintained at 300 psi, and confining pressure at 1050 psi. To evaluate the pore fluid line drainage effect, we ran two different tests, with the above mentioned valve closed and opened respectively.
Modulus
8
10
12
14
16
18
20
1.E+00 1.E+01 1.E+02 1.E+03 1.E+04 1.E+05 1.E+06
Frequency (Hz)
Mod
ulus
(GPa
)
K (dry)K (w ater undrained)G (dry)G (w ater undrained)K (w ater drained)G (w ater drained)
Figure 8. Measured bulk and shear moduli in a sandstone sample, at three saturation and boundary conditions.
The measured bulk and shear moduli under all three saturation conditions are plotted in Figure 8. All values are calibrated with dry ultrasonic data. The most prominent feature in the figure is that for drained condition, the bulk modulus exhibits a strong dispersion below 10 Hz. It also well matches the very high attenuation peak plotted in Figure 9. This is a clear indicator of fluid related dispersion and attenuation. More specifically, it is caused by the
external flow partial drainage effect at the pore fluid line opening. Then we noticed at dry condition the bulk and shear modulus curves almost overlap to each other. This confirms K/G≈1 in dry sandstone, which is widely recognized by many investigators (e.g., Smith et al., 2003). Next, the shear modulus is rarely altered by the water saturation, no matter whether it’s drained or undrained condition. Finally, for bulk modulus, although both saturated conditions show clear fluid effects, one can see distinct behaviors in two cases. For closed value measurement (undrained condition), bulk moduli in whole frequency range have values larger than Gassmann predicted zero frequency value, suggesting certain fluid pressure gradient not relaxed even in seismic frequency. Without the strong dispersion ramp as observed in open valve measurement (drained condition), we can still see a weak dispersion ramp between 10 Hz to 100 Hz. The attenuation data in Figure 9 also shows a weak peak for undrained measurement at the same frequency range. At high frequency end, the drained and undrained moduli are quite close to each other, but at low frequency end, the drained bulk moduli drop to values much lower than Gassmann predicted value, and showing a trend approaching towards the dry bulk modulus, if the measurements can be further extended to lower frequencies.
Figure 9. Measured attenuation (1/Q) value in a sandstone sample, at three saturation and boundary conditions.
Conclusion
Laboratory measurements on velocities and attenuation at seismic frequencies have made prominent progresses but are still not mature at UH rock physics lab. The random errors are well controlled so that the measured results are interpretable for relative trends on dispersion and attenuation within seismic band. The absolute values on velocities or modulus must be calibrated with separately measured dry velocities at ultrasonic frequency. This makes the current apparatus can make trustable wide band velocity measurements only on relatively stiffer, well consolidated rocks.
Attenuation in low freq. measurement
-0.02
-0.01
0
0.01
0.02
0.03
0.04
0.05
0.06
0.07
0.08
1.E+00 1.E+01 1.E+02 1.E+03 1.E+04
Frequency (Hz)
1/Q
dry
w ater undrained
w ater drained
Young's Modulus
4
5
6
7
8
9
10
1 10 100 1000 10000
1E+05
1E+06
Frequency (Hz)
Youn
g's
Mod
ulus
(GPa
)
Poisson Ratio
0.3
0.32
0.34
0.36
0.38
0.4
0.42
0.44
1 10 100 1000 10000
1E+05
1E+06
Frequency (Hz)
Pois
son
Rat
io
1/Q
0
0.01
0.02
0.03
0.04
0.05
0.06
0.07
0.08
0.09
1 10 100 1000 10000
Frequency (Hz)
1/Q
DOI http://dx.doi.org/10.1190/segam2013-1217.1© 2013 SEGSEG Houston 2013 Annual Meeting Page 2886
Dow
nloa
ded
10/1
8/13
to 1
29.7
.247
.234
. Red
istr
ibut
ion
subj
ect t
o SE
G li
cens
e or
cop
yrig
ht; s
ee T
erm
s of
Use
at h
ttp://
libra
ry.s
eg.o
rg/

http://dx.doi.org/10.1190/segam2013-1217.1 EDITED REFERENCES Note: This reference list is a copy-edited version of the reference list submitted by the author. Reference lists for the 2013 SEG Technical Program Expanded Abstracts have been copy edited so that references provided with the online metadata for each paper will achieve a high degree of linking to cited sources that appear on the Web. REFERENCES
Adam, L., M. L. Batzle, K. T. Lewallen, and K. van Wijk, 2009, Seismic wave attenuation in carbonates: Journal of Geophysical Research, 114, B6, B06208, http://dx.doi.org/10.1029/2008JB005890.
Batzle, M. L., D. H. Han, and R. Hofmann, 2006, Fluid mobility and frequency-dependent seismic velocity — Direct measurements: Geophysics, 71, no. 1, N9.
Gautam, K., 2003, Fluid effects on attenuation and dispersion of elastic waves: M.Sc. thesis, Colorado School of Mines.
Hofmann, R., 2006, Frequency dependent elastic and anelastic properties of clastic rocks: Ph.D. dissertation, Colorado School of Mines.
Lakes, R., 2009, Viscoelastic materials: Cambridge University Press.
Liu, H., and L. Peselnick, 1983, Investigation of internal friction in fused quartz, steel, plexiglass, and Westerly Granite from 0.01 to 1.00 Hertz: Journal of Geophysical Research, 88, B3, 2367–2379, http://dx.doi.org/10.1029/JB088iB03p02367.
Madonna, C., and N. Tisato, 2013, A new seismic wave attenuation module to experimentally measure low-frequency attenuation in extensional mode: Geophysical Prospecting, 61, no. 2, 302–314, http://dx.doi.org/10.1111/1365-2478.12015.
Madonna, C., N. Tisato, S. Boutareaud, and D. Mainprice, 2010, A new laboratory system for the measurement of low frequency seismic attenuation: 80th Annual International Meeting, SEG, Expanded Abstract, 2675–2680.
Mikhaltsevitch, V., M. Lebedev, and B. Gurevich, 2011, A low-frequency laboratory apparatus for measuring elastic and anelastic properties of rocks: 81st Annual International Meeting, SEG, Expanded Abstracts, 2256–2260.
Murphy, W. F., 1982, Effects of partial water saturation on attenuation in Massilon sandstone and Vycor porous glass: Journal of the Acoustical Society of America, 71, 1458–1468.
Murphy, W. F. III, 1984, Acoustic measures of partial gas saturation in tight sandstones: Journal of Geophysical Research, 89, no. B13, no. B13, 11549–11559, http://dx.doi.org/10.1029/JB089iB13p11549.
Spencer, J. W. Jr., 1981, Stress relaxations at low frequencies in fluid-saturated rocks: Attenuation and modulus dispersion: Journal of Geophysical Research, 86, B3, 1803–1812, http://dx.doi.org/10.1029/JB086iB03p01803.
Smith, T. M., C. H. Sondergeldz, and C. S. Rai, 2003, Gassmann fluid substitutions: A tutorial: Geophysics, 68, 430–440, http://dx.doi.org/10.1190/1.1567211.
Tisato, N., C. Madonna, B. Artman, and E. Saenger, 2011, Low-frequency measurements of seismic wave attenuation in Berea sandstone: 81st Annual International Meeting, SEG, Expanded Abstracts, 2277–2280.
DOI http://dx.doi.org/10.1190/segam2013-1217.1© 2013 SEGSEG Houston 2013 Annual Meeting Page 2887
Dow
nloa
ded
10/1
8/13
to 1
29.7
.247
.234
. Red
istr
ibut
ion
subj
ect t
o SE
G li
cens
e or
cop
yrig
ht; s
ee T
erm
s of
Use
at h
ttp://
libra
ry.s
eg.o
rg/

Winkler, K., and A. Nur, 1982, Seismic attenuation — Effects of pore fluids and frictional sliding: Geophysics, 47, 1–15, http://dx.doi.org/10.1190/1.1441276.
Yao, Q., 2013, Velocity dispersion and wave attenuation in reservoir rocks: Ph.D. dissertation, University of Houston.
Yin, C. S., M. L. Batzle , and B. J. Smith, 1992, Effects of partial liquid gas saturation on extensional wave attenuation in Berea sandstone: Geophysical Research Letters, 19, no. 13, 1399–1402, http://dx.doi.org/10.1029/92GL01159.
DOI http://dx.doi.org/10.1190/segam2013-1217.1© 2013 SEGSEG Houston 2013 Annual Meeting Page 2888
Dow
nloa
ded
10/1
8/13
to 1
29.7
.247
.234
. Red
istr
ibut
ion
subj
ect t
o SE
G li
cens
e or
cop
yrig
ht; s
ee T
erm
s of
Use
at h
ttp://
libra
ry.s
eg.o
rg/