progressions for the common core state standards in...
TRANSCRIPT

Progressions for the Common Core StateStandards in Mathematics (draft)
c�The Common Core Standards Writing Team
3 December 2012
Draft, 12/03/2012, comment at commoncoretools.wordpress.com .

Grade 8, High School,Functions*
Overview
Functions describe situations in which one quantity is determinedby another. The area of a circle, for example, is a function of its ra-dius. When describing relationships between quantities, the defin-ing characteristic of a function is that the input value determines theoutput value or, equivalently, that the output value depends upon theinput value.
The mathematical meaning of function is quite different fromsome common uses of the word, as in, “One function of the liveris to remove toxins from the body,” or “The party will be held in thefunction room at the community center.” The mathematical meaningof function is close, however, to some uses in everyday language.For example, a teacher might say, “Your grade in this class is afunction of the effort you put into it.” A doctor might say, “Some ill-nesses are a function of stress.” Or a meteorologist might say, “Aftera volcano eruption, the path of the ash plume is a function of windand weather.” In these examples, the meaning of “function” is closeto its mathematical meaning.
In some situations where two quantities are related, each canbe viewed as a function of the other. For example, in the context ofrectangles of fixed perimeter, the length can be viewed as dependingupon the width or vice versa. In some of these cases, a problemcontext may suggest which one quantity to choose as the inputvariable.
Undergraduate mathematics may involve functions of more thanone variable. The area of a rectangle, for example, can be viewed asa function of two variables: its width and length. But in high schoolmathematics the study of functions focuses primarily on real-valuedfunctions of a single real variable, which is to say that both theinput and output values are real numbers. One exception is in highschool geometry, where geometric transformations are considered tobe functions.• For example, a translation T, which moves the plane • G-CO.2 . . . [D]escribe transformations as functions that take
points in the plane as inputs and give other points as outputs. . . .
*Advanced material, corresponding to (+) standards, is indicated by plus signsin the left margin.
Draft, 12/03/2012, comment at commoncoretools.wordpress.com .

3
3 units to the right and 2 units up might be represented by T :
�� � � 3� � 2 .A trickle of pattern standards in Grades 4 and 5 begins the prepa-
ration for functions.4.OA.5, 5.OA.3 Note that in both these standards a4.OA.5Generate a number or shape pattern that follows a givenrule. Identify apparent features of the pattern that were not ex-plicit in the rule itself.
5.OA.3Generate two numerical patterns using two given rules.Identify apparent relationships between corresponding terms.Form ordered pairs consisting of corresponding terms from thetwo patterns, and graph the ordered pairs on a coordinate plane.
rule is explicitly given. Traditional pattern activities, where stu-dents are asked to continue a pattern through observation, are nota mathematical topic, and do not appear in the Standards in theirown right.1
The problem with patterns
Students are asked to continue the pattern 2, 4, 6, 8, . . . . Hereare some legitimate responses:
• Cody: I am thinking of a “plus 2 pattern,” so it continues10, 12, 14, 16, . . . .
• Ali: I am thinking of a repeating pattern, so it continues 2,4, 6, 8, 2, 4, 6, 8, . . . .
• Suri: I am thinking of the units digit in the multiples of 2,so it continues 0, 2, 4, 6, 8, 0, 2, . . . .
• Erica: If � � is any polynomial, then� � 2� � 1 � 2 � 3 � 4 � �describes a continuation of this sequence.
• Zach: I am thinking of that high school cheer, “Who dowe appreciate?”
Because the task provides no structure, all of these answersmust be considered correct. Without any structure, continuingthe pattern is simply speculation—a guessing game. Becausethere are infinitely many ways to continue a sequence,patterning problems should provide enough structure so that thesequence is well defined.
The Grade 4–5 pattern standards expand to a full progressionon Ratios and Proportional Relationships in Grades 6–7, and then
Experiences with functions before Grade 8
� � 5 � (pattern from Kindergarten, p. ??)
1 9 9
2 9 2 10 1 2 10 2 1 20 2 18
3 9 3 10 1 3 10 3 1 30 3 27�� � 9 � 10 � � (pattern from grade 3, p. ??)
feet inches0 01 122 243
� � 12� (foot and inch equivalences from grade 4, p. ??)
� meters 3 6 9 12 15 32 1 2 4
� seconds 2 4 6 8 10 1 23
43
83
� � 32 � (proportional relationship from Grade 6, p. ??)
the notion of a function is introduced in Grade 8.Before they learn the term “function,” students begin to gain
experience with functions in elementary grades. In Kindergarten,they use patterns with numbers such as the 5 � pattern to learnparticular additions and subtractions.
Sequences and functions Patterns are sequences, and sequencesare functions with a domain consisting of whole numbers. However,in many elementary patterning activities, the input values are notgiven explicitly. In high school, students learn to use an index toindicate which term is being discussed. Erica handles this issuein the example in the margin by deciding that the term 2 wouldcorrespond to an index value of 1. Then the terms 4, 6, and 8 wouldcorrespond to input values of 2, 3, and 4, respectively. Erica couldhave decided that the term 2 would correspond to a different indexvalue, such as 0. The resulting formula would have been different,but the (unindexed) sequence would have been the same.
Functions and modeling In modeling situations, knowledge of thecontext and statistics are sometimes used together to find algebraicexpressions that best fit an observed relationship between quanti-ties. Then the algebraic expressions can be used to interpolate (i.e.,approximate or predict function values between and among the col-lected data values) and to extrapolate (i.e., to approximate or predictfunction values beyond the collected data values). One must alwaysask whether such approximations are reasonable in the context.
In school mathematics, functional relationships are often givenby algebraic expressions. For example, � � �2 for � 1 givesthe �th square number. But in many modeling situations, such asthe temperature at Boston’s Logan Airport as a function of time,algebraic expressions are generally not suitable.
Functions and Algebra See the Algebra Progression for a discus-sion of the connection and distinctions between functions, on the onehand, and algebra and equation solving, on the other. Perhaps the
1This does not exclude activities where patterns are used to support other stan-dards, as long as the case can be made that they do so.
Draft, 12/03/2012, comment at commoncoretools.wordpress.com .
4
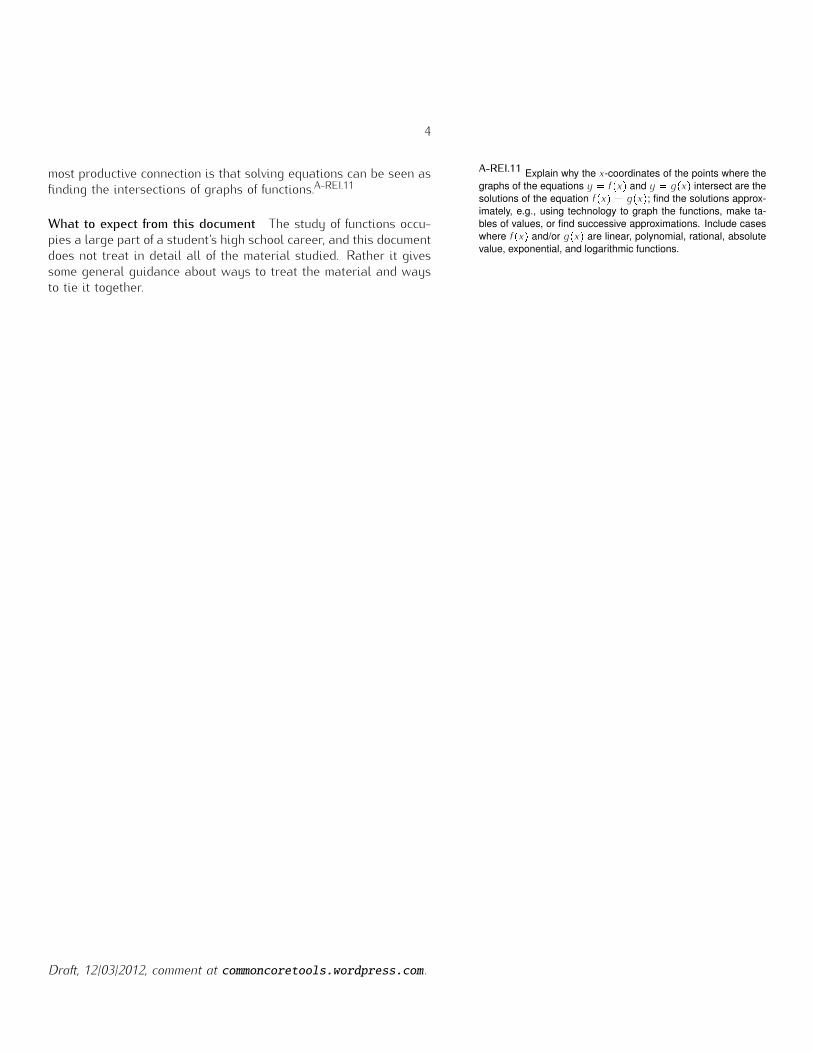
most productive connection is that solving equations can be seen asfinding the intersections of graphs of functions.A-REI.11
A-REI.11 Explain why the �-coordinates of the points where thegraphs of the equations � � � and � � � intersect are thesolutions of the equation � � � � ; find the solutions approx-imately, e.g., using technology to graph the functions, make ta-bles of values, or find successive approximations. Include caseswhere � � and/or � � are linear, polynomial, rational, absolutevalue, exponential, and logarithmic functions.
What to expect from this document The study of functions occu-pies a large part of a student’s high school career, and this documentdoes not treat in detail all of the material studied. Rather it givessome general guidance about ways to treat the material and waysto tie it together.
Draft, 12/03/2012, comment at commoncoretools.wordpress.com .

5
Grade 8
Define, evaluate, and compare functions Since the elementarygrades, students have been describing patterns and expressing re-
8.F.1Understand that a function is a rule that assigns to eachinput exactly one output. The graph of a function is the set ofordered pairs consisting of an input and the corresponding out-put.Function notation is not required in Grade 8.
8.F.2Compare properties of two functions each represented in adifferent way (algebraically, graphically, numerically in tables, orby verbal descriptions).
MP1 “Mathematically proficient students can explain correspon-dences between equations, verbal descriptions, tables, andgraphs or draw diagrams of important features and relationships,graph data, and search for regularity or trends”
lationships between quantities. These ideas become semi-formal inGrade 8 with the introduction of the concept of function: a rule thatassigns to each input exactly one output.8.F.1 Formal language, suchas domain and range, and function notation may be postponed untilhigh school.
Building on experience with graphs and tables in Grades 6 and7, students establish a routine of exploring functional relationshipsalgebraically, graphically, numerically in tables, and through verbaldescriptions.8.F.2, MP1 And to develop flexibility in interpreting andtranslating among these various representations, students comparetwo functions represented in different ways, as illustrated by thetask in the margin.
Battery charging
Sam wants to take his MP3 player and his video game player ona car trip. An hour before they plan to leave, he realized that heforgot to charge the batteries last night. At that point, he pluggedin both devices so they can charge as long as possible beforethey leave.Sam knows that his MP3 player has 40% of its battery life leftand that the battery charges by an additional 12 percentagepoints every 15 minutes.His video game player is new, so Sam doesn’t know how fast it ischarging but he recorded the battery charge for the first 30minutes after he plugged it in.
time charging 0 10 20 30video game player batter charge 20 32 44 56
1. If Sam’s family leaves as planned, what percent of thebattery will be charged for each of the two devices whenthey leave?
2. How much time would Sam need to charge the battery100% on both devices?
For solutions and more discussion of this task, go to IllustrativeMathematics at illustrativemathematics.org/illustrations/641
The main focus in Grade 8 is linear functions, those of the form� �� �, where � and � are constants.8.F.3 The proof that �
8.F.3Interpret the equation � �� � as defining a linear func-tion, whose graph is a straight line; give examples of functionsthat are not linear.
�� � is also the equation of a line, and hence that the graphof a linear function is a line, is an important pieces of reasoningconnecting algebra with geometry in Grade 8.8.EE.6
8.EE.6Use similar triangles to explain why the slope � is thesame between any two distinct points on a non-vertical line in thecoordinate plane; derive the equation � �� for a line throughthe origin and the equation � �� � for a line intercepting thevertical axis at �.
�
1� � �
�� � ��
1
�
�
��
In the figure above, the red triangle is the “slope triangle” formedby the vertical intercept and the point on the line with �-coordinateequal to 1. The green triangle is formed from the intercept anda point with arbitrary �-coordinate. A dilation with center at thevertical intercept and scale factor � takes the red triangle to thegreen triangle, because it takes lines to parallel lines. Thus thegreen triangle is similar to the red triangle, and so the height of thegreen triangle is �� , and the coordinates of the general point onthe triangle are �� � �� . Which is to say that the point satisfiesthe equation � � �� .
Students learn to recognize linearity in a table: when constantdifferences between input values produce constant differences be-tween output values. And they can use the constant rate of changeappropriately in a verbal description of a context.
Draft, 12/03/2012, comment at commoncoretools.wordpress.com .

6
Use functions to model relationships between quantities Whenusing functions to model a linear relationships between quantities,students learn to determine the rate of change of the function, whichis the slope of its graph. They can read (or compute or approximate)the rate of change from a table or a graph, and they can interpretthe rate of change in context.8.F.4
8.F.4Construct a function to model a linear relationship betweentwo quantities. Determine the rate of change and initial value ofthe function from a description of a relationship or from two �� �values, including reading these from a table or from a graph. In-terpret the rate of change and initial value of a linear function interms of the situation it models, and in terms of its graph or atable of values.
Graphs are ubiquitous in the study of functions, but it is importantto distinguish a function from its graph. For example, a function doesnot have a slope but its graph can have a slope.•
• The slope of a vertical line is undefined and the slope of ahorizontal line is 0. Either of these cases might be considered “noslope.” Thus, the phrase “no slope” should be avoided because itis imprecise and unclear.
Within the class of linear functions, students learn that some areproportional relationships and some are not. Functions of the form� �� � are proportional relationships exactly when � 0,so that � is proportional to � . Graphically, a linear function is aproportional relationship if its graph goes through the origin.
To understand relationships between quantities, it is often help-ful to describe the relationships qualitatively, paying attention tothe general shape of the graph without concern for specific numer-ical values.8.F.5 The standard approach proceeds from left to right,
8.F.5Describe qualitatively the functional relationship betweentwo quantities by analyzing a graph (e.g., where the function isincreasing or decreasing, linear or nonlinear). Sketch a graphthat exhibits the qualitative features of a function that has beendescribed verbally.
describing what happens to the output as the input value increases.For example, pianist Chris Donnelly describes the relationship be-tween creativity and structure via a graph.•
•
The qualitative description might be as follows: “As the inputvalue (structure) increases, the output (creativity) increases quicklyat first and gradually slowing down. As input (structure) continues toincrease, the output (creativity) reaches a maximum and then startsdecreasing, slowly at first, and gradually faster.” Thus, from thegraph alone, one can infer Donnelly’s point that there is an optimalamount of structure that produces maximum creativity. With littlestructure or with too much structure, in contrast, creativity is low.
Draft, 12/03/2012, comment at commoncoretools.wordpress.com .

7
High School
The high school standards on functions are organized into four groups:Interpreting Functions (F-IF); Building Functions (F-BF); Linear, Qua-dratic and Exponential Models (F-LE); and Trigonometric Functions(F-TF). The organization of the first two groups under mathemati-cal practices rather than types of function is an important aspectof the Standards: students should develop ways of thinking thatare general and allow them to approach any type of function, workwith it, and understand how it behaves, rather than see each func-tion as a completely different animal in the bestiary. For example,they should see linear and exponential functions as arising out ofstructurally similar growth principles; they should see quadratic,polynomial, and rational functions as belonging to the same sys-tem (helped along by the unified study in the Algebra category ofArithmetic with Polynomials and Rationl Expressions).
Interpreting FunctionsUnderstand the concept of a function and use function notationBuilding on semi-formal notions of functions from Grade 8, studentsin high school begin to use formal notation and language for func-tions. Now the input/output relationship is a correspondence be-tween two sets: the domain and the range.F-IF.1 The domain is the
F-IF.1 Understand that a function from one set (called the do-main) to another set (called the range) assigns to each elementof the domain exactly one element of the range. If � is a functionand � is an element of its domain, then � � denotes the outputof � corresponding to the input �. The graph of � is the graph ofthe equation � � � .
set of input values, and the range is the set of output values. A keyadvantage of function notation is that the correspondence is builtinto the notation. For example, � 5 is shorthand for “the outputvalue of � when the input value is 5.”
Students sometimes interpret the parentheses in function no-tation as indicating multiplication. Because they might have seen
Interpreting the graph
Use the graph (for example, by marking specific points) toillustrate the statements in (a)–(d). If possible, label thecoordinates of any points you draw.
(a) � 0 2
(b) � 3 � 3 � 9 0
(c) � 2 � 2
(d) � � � � for � 2
For solutions and more discussion of this task, go to IllustrativeMathematics at illustrativemathematics.org/illustrations/636.
numerical expressions like 3 4 , meaning 3 times 4, students can in-terpret � � as � times � . This can lead to false generalizations of thedistributive property, such replacing � � 3 with � � � 3 . Workwith interpreting function notation in terms of the graph of � canhelp students avoid this confusion with the symbols (see example inmargin).
Although it is common to say “the function � � ,” the notation� � refers to a single output value when the input value is � . Totalk about the function as a whole, write � , or perhaps “the function � ,where � � 3� 4.” The � is merely a placeholder, so � � 3� 4
describes exactly the same function.Later, students can make interpretations like those in the follow-
ing table:Expression Interpretation� � 2 The output when the input is 2 greater than �� � 3 3 more than the output when the input is �2� � 5 5 more than twice the output of � when the input is �
� � � � The change in output when the input changes from � to �
Notice that a common preoccupation of high school mathematics,
The square root function
Since the equation �29 has two solutions, � 3, students
might think incorrectly that 9 3. However, if we want �to be a function of �, we need to choose one of these squareroots. The square root function, � � �, is defined to be thepositive square root of � for any positive �.
Draft, 12/03/2012, comment at commoncoretools.wordpress.com .

8
distinguishing function from relations, is not in the Standards. Timenormally spent on exercises involving the vertical line test, or search-ing lists of ordered pairs to find two with the same �-coordinateand different �-coordinate, can be reallocated elsewhere. Indeed,the vertical line test is problematical, since it makes it difficult todiscuss questions such as “is � a function of �” when presented witha graph of � against � (an important question for students thinkingabout inverse functions). The core question when investigating func-tions is: “Does each element of the domain corresponds to exactlyone element in the range?” The margin shows a discussion of thesquare root function oriented around this question.
To promote fluency with function notation, students interpretfunction notation in contexts.F-IF.2 For example, if � is a function
F-IF.2 Use function notation, evaluate functions for inputs in theirdomains, and interpret statements that use function notation interms of a context.
Cell Phones
Let � � be the number of people, in millions, who own cellphones � years after 1990. Explain the meaning of the followingstatements.
(a) � 10 100�3(b) � � 20
(c) � 20 �(d) � � �
For solutions and more discussion of this task, go toillustrativemathematics.org/illustrations/634.
that relates Kristin’s height in inches to her age in years, then thestatement � 7 49 means, “When Kristin was 7 years old, she was49 inches tall.” The value of � 12 is the answer to “How tall wasKristin when she was 12 years old.” And the solution of � � 60 isthe answer to “How old was Kristen when she was 60 inches tall?”See also the example in the margin.
Sometimes, especially in real-world contexts, there is no expres-sion (or closed formula) for a function. In those cases, it is common touse a graph or a table of values to (partially) represent the function.
A sequence is a function whose domain is a subset of the integers.F-IF.3
Sequences as functions
� � �1 42 73 104 135 16
�
16
14
12
10
8
6
4
2
2 4
f(n)
n
F-IF.3 Recognize that sequences are functions, sometimes de-fined recursively, whose domain is a subset of the integers.
In fact, many patterns explored in grades K-8 can be considered se-quences. For example, the sequence 4, 7, 10, 13, 16, . . . might bedescribed as a “plus 3 pattern” because terms are computed byadding 3 to the previous term. To show how the sequence can beconsidered a function, we need an index that indicates which termof the sequence we are talking about, and which serves as an in-put value to the function. Deciding that the 4 corresponds to anindex value of 1, we make a table showing the correspondence, asin the margin. The sequence can be describe recursively by the rule� 1 4, � � 1 � � 3 for � 2. Notice that the recursivedefinition requires both a starting value and a rule for computingsubsequent terms. The sequence can also be described with theclosed formula � � 3� 1, for integers � 1. Notice that thedomain is included as part of the description. A graph of the se-quence consists of discrete dots, because the specification does notindicate what happens “between the dots.”
In advanced courses, students may use subscript notation for+
sequences.+
Interpret functions that arise in applications in terms of the con-text Functions are often described and understood in terms of theirbehavior :F-IF.4 Over what input values is it increasing, decreasing,
F-IF.4 For a function that models a relationship between twoquantities, interpret key features of graphs and tables in termsof the quantities, and sketch graphs showing key features givena verbal description of the relationship.or constant? For what input values is the output value positive,
negative, or 0? What happens to the output when the input valuegets very large positively or negatively? Graphs become very useful
Draft, 12/03/2012, comment at commoncoretools.wordpress.com .

9
representations for understanding and comparing functions becausethese “behaviors” are often easy to see in the graphs of functions(see illustration in margin). Graphs and contexts are opportunities F-IF.5 Relate the domain of a function to its graph and, where
applicable, to the quantitative relationship it describes.
Warming and Cooling
The figure shows the graph of T , the temperature (in degreesFahrenheit) over one particular 20-hour period in Santa Elena asa function of time �.
(a) Estimate T 14 .
(b) If � 0 corresponds to midnight, interpret what we mean byT 14 in words.
(c) Estimate the highest temperature during this period from thegraph.
(d) When was the temperature decreasing?
(e) If Anya wants to go for a two-hour hike and return before thetemperature gets over 80 degrees, when should she leave?
For solutions and more discussion of this task, go to IllustrativeMathematics at illustrativemathematics.org/illustrations/639.
to talk about domain (for an illustration, go to illustrativemathemat-ics.org/illustrations/631).F-IF.5
Graphs help us reason about rates of change of function. Stu-dents learned in Grade 8 that the rate of change of a linear functionis equal to the slope of its graph. And because the slope of a lineis constant, the phrase “rate of change” is clear for linear functions.For nonlinear functions, however, rates of change are not constant,and so we talk about average rates of change over an interval.F-IF.6
F-IF.6 Calculate and interpret the average rate of change of afunction (presented symbolically or as a table) over a specifiedinterval. Estimate the rate of change from a graph.
For example, for the function � � �2, the average rate of changefrom � 2 to � 5 is
� 5 � 2
5 2
25 4
5 2
21
3
7�
This is the slope of the line from 2� 4 to 5� 25 on the graph of �.And if � is interpreted as returning the area of a square of side � ,then this calculation means that over this interval the area changes,on average, 7 square units for each unit increase in the side lengthof the square.
F-IF.7 Graph functions expressed symbolically and show key fea-tures of the graph, by hand in simple cases and using technologyfor more complicated cases.
a Graph linear and quadratic functions and show intercepts,maxima, and minima.
b Graph square root, cube root, and piecewise-definedfunctions, including step functions and absolute valuefunctions.
c Graph polynomial functions, identifying zeros when suit-able factorizations are available, and showing end behav-ior.
d (+) Graph rational functions, identifying zeros and asymp-totes when suitable factorizations are available, andshowing end behavior.
e Graph exponential and logarithmic functions, showing in-tercepts and end behavior, and trigonometric functions,showing period, midline, and amplitude.
Analyze functions using different representations Functions areoften studied and understood as families, and students should spendtime studying functions within a family, varying parameters to de-velop an understanding of how the parameters affect the graph offunction and its key features.F-IF.7
Within a family, the functions often have commonalities in thequalitative shapes of their graphs and in the kinds of features thatare important for identifying functions more precisely within a fam-ily. This standard indicates which function families should be instudents’ repertoires, detailing which features are required for sev-eral key families. It is an overarching standard that covers the entirerange of a student’s high school experience; in this part of the pro-gression we merely indicate some guidelines for how it should betreated.
First, linear and exponential functions (and to a lesser extentquadratic functions) receive extensive treatment and comparison ina dedicated group of standards, Linear and Exponential Models.Thus, those function families should receive the bulk of the atten-tion related to this standard. Second, all students are expected todevelop fluency with linear, quadratic, and exponential functions,including the ability to graph them by hand. Finally, in most ofthe other function families, students are expected to simple caseswithout technology, and more complex ones with technology.
Draft, 12/03/2012, comment at commoncoretools.wordpress.com .

10
Consistent with the practice of looking for and making use ofstructure (MP1), students should also develop the practice of writingexpressions for functions in ways that reveal the key features of thefunction.F-IF.8
F-IF.8 Write a function defined by an expression in different butequivalent forms to reveal and explain different properties of thefunction.
a Use the process of factoring and completing the square ina quadratic function to show zeros, extreme values, andsymmetry of the graph, and interpret these in terms of acontext.
b Use the properties of exponents to interpret expressionsfor exponential functions.
Quadratic functions provide a rich playground for developing thisability, since the three principle forms for a quadratic expression(expanded, factored, and completed square) each give insight intodifferent aspects of the function. However, there is a danger that
Which Equation?
Which of the following could be an expression for the functionwhose graph is shown below? Explain.
(a) � 12
24 (b) � 2
21
(c) � 18
240 (d) � 10
215
(e) 4 � 2 � 3 (f) � 4 � 6
(g) � 12 � 18 (h) 20 � 30 �
For solutions and more discussion of this task, go to IllustrativeMathematics at illustrativemathematics.org/illustrations/640.
working with these different forms becomes an exercise in pickingnumbers out of an expression. For example, students often arriveat college talking about “minus � over 2� method” for finding thevertex of the graph of a quadratic function. To avoid this problem itis useful to give students translation tasks such as the one in themargin, where they must read both the graphs and the expressionand choose for themselves which parts of each correspond.F-IF.9
F-IF.9 Compare properties of two functions each represented ina different way (algebraically, graphically, numerically in tables, orby verbal descriptions).
Draft, 12/03/2012, comment at commoncoretools.wordpress.com .

11
Building FunctionsThe previous group of standards focuses on interpreting functionsgiven by expressions, graphs, or tables. The Building Functionsgroup focuses on building functions to model relationships, andbuilding new functions from existing functions.
A-CED.2 Create equations in two or more variables to representrelationships between quantities; graph equations on coordinateaxes with labels and scales.Note: Composition and composition of a function and its inverse
are among the plus standards. The following discussion describesin detail what is required for students to grasp these ideas securely.Because of the depth of this development, and because of the sub-tleties and pitfalls, it is strongly recommended that this content beincluded only in optional courses. F-BF.1a Write a function that describes a relationship between
two quantities.a Determine an explicit expression, a recursive process, or
steps for calculation from a context.Build a function that models a relationship between two quanti-ties This cluster of standards is very closely related to the algebrastandard on writing equations in two variables.A-CED.2 Indeed, thatalgebra standard might well be met by a curriculum in the sameunit as this cluster. Although students will eventually study vari-ous families of functions, it is useful for them to have experiences ofbuilding functions from scratch, without the aid of a host of specialrecipes, by grappling with a concrete context for clues.F-BF.1a For
Lake Algae
On June 1, a fast growing species of algae is accidentallyintroduced into a lake in a city park. It starts to grow and coverthe surface of the lake in such a way that the area covered bythe algae doubles every day. If it continues to grow unabated,the lake will be totally covered and the fish in the lake willsuffocate. At the rate it is growing, this will happen on June 30.
(a) When will the lake be covered half-way?
(b) On June 26, a pedestrian who walks by the lake every daywarns that the lake will be completely covered soon. Herfriend just laughs. Why might her friend be skeptical of thewarning?
(c) On June 29, a clean-up crew arrives at the lake andremoves almost all of the algae. When they are done, only1% of the surface is covered with algae. How well does thissolve the problem of the algae in the lake?
(d) Write an equation that represents the percentage of thesurface area of the lake that is covered in algae as a functionof time (in days) that passes since the algae was introducedinto the lake if the cleanup crew does not come on June 29.
For solutions and more discussion of this task, go to IllustrativeMathematics at illustrativemathematics.org/illustrations/533.
example, in the Lake Algae task in the margin, parts (a)–(c) leadstudents through reasoning that allows them construct the functionin part (d) directly. Students who try a more conventional approachin part (d) of fitting the general function � � ��� to the situationmight well get confused or replicate work already done.
The Algebra Progression discusses the difference between afunction and an expression. Not all functions are given by expres-
Drug Dosage
A student strained her knee in an intramural volleyball game,and her doctor has prescribed an anti-inflammatory drug toreduce the swelling. She is to take two 220-milligram tabletsevery 8 hours for 10 days. Her kidneys filter 60% of this drugfrom her body every 8 hours. How much of the drug is in hersystem after 24 hours?
Task from High School Mathematics at Work: Essays andExamples for the Education of All Students (1998), NationalAcademies Press. Seehttp://www.nap.edu/openbook/0309063531/html/80.html for adiscussion of the task.
sions, and in many situations it is natural to use a function definedrecursively. Calculating mortgage payment and drug dosages aretypical cases where recursively defined functions are useful (seeexample in the margin).
Modeling contexts also provide a natural place for students tostart building functions with simpler functions as components.F-BF.1bc
F-BF.1 Write a function that describes a relationship betweentwo quantities.
b Combine standard function types using arithmetic opera-tions.
c (+) Compose functions.
Situations of cooling or heating involve functions which approach alimiting value according to a decaying exponential function. Thus,if the ambient room temperature is 70 and a cup of tea made withboiling water at a temperature of 212 , a student can express thefunction describing the temperature as a function of time using theconstant function � � 70 to represent the ambient room temper-ature and the exponentially decaying function � � 142� �� torepresent the decaying difference between the temperature of thetea and the temperature of the room, leading to a function of theform
T � 70 142� ���
Students might determine the constant � experimentally.In contexts where change occurs at discrete intervals (such as
payments of interest on a bank balance) or where the input vari-
Draft, 12/03/2012, comment at commoncoretools.wordpress.com .

12
able is a whole number (for example the number of a pattern in asequence of patterns), the functions chosen will be sequences. Inpreparation for the deeper study of linear and exponential functions,students can study arithmetic sequences (which are linear functions)and geometric sequences (which are exponential functions).F-BF.2
F-BF.2 Write arithmetic and geometric sequences both recur-sively and with an explicit formula, use them to model situations,and translate between the two forms.This is a good point at which to start making the distinction be-
tween additive and multiplicative changes.
Build new functions from existing functions With a basis of ex-periences in building specific functions from scratch, students start
Transforming Functions
The figure shows the graph of a function � whose domain is theinterval 2 � 2.
(a) In (i)–(iii), sketch the graph of the given function andcompare with the graph of � . Explain what you see.
(i) � � � � 2
(ii) � � � �(iii) � � � � 2
(b) The points labelled Q� O�P on the graph of � havecoordinates
Q 2 0�509 � O 0� 0�4 � P 2� 1�309 �
What are the coordinates of the points corresponding toP� O�Q on the graphs of �� �� and �?
For solutions and more discussion of this task, go to theIllustrative Mathematics website atillustrativemathematics.org/illustrations/742
to develop a notion of naturally occurring families of functions thatdeserve particular attention. It is possible to harden the curriculumtoo soon around these families, before students have enough experi-ence to get a feel for the effects of different parameters. Students canstart getting that feel by playing around with the effect on the graphof simple transformations of the input and output variables.F-BF.3
F-BF.3 Identify the effect on the graph of replacing � � by � �� , �� � , � �� , and � � � for specific values of � (both positiveand negative); find the value of � given the graphs. Experimentwith cases and illustrate an explanation of the effects on the graphusing technology.
Quadratic and absolute value functions are good contexts for get-ting a sense of the effects of many of these transformations, buteventually students need to understand these ideas abstractly andbe able to talk about them for any function � .
Students can get confused about the effect of transformations onthe input variable, because the effect on the graph appears to bethe opposite to the transformation on the variable. In part (b) of thetask in the margin, asking students to talk through the positions ofthe points in terms of function values can help clear this confusionup.
The concepts of even and odd functions are useful for noticingsymmetry. A function � is called an even function if � � � �and an odd function if � � � � . To understand the names ofthese concepts, consider that polynomial functions are even exactlywhen all terms are of even degree and odd exactly when all termsare of odd degree. With some grounding in polynomial functions,students can reason that lots of functions are neither even nor odd.
Students can show from the definitions that the sum of two evenfunctions is even and the sum of two odd functions is odd, and theycan interpret these results graphically.
An Interesting FactSuppose � is a function with a domain of all real numbers.Define � and � as follows:
� � � � � �2
and � � � � � �2
Then � � � � � � , � is even, and � is odd. (Studentsmay use the definitions to verify these claims.) Thus, anyfunction over the real numbers can be expressed as the sum ofan even and an odd function.
When it comes to inverse functions,F-BF.4a the expectations are
F-BF.4a Find inverse functions.a Solve an equation of the form � � � for a simple func-
tion � that has an inverse and write an expression for theinverse.
modest, requiring only that students solve equations of the form� � �. The point is to provide an informal sense of determiningthe input when the output is known. Much of this work can be donewith specific values of �. Eventually, some generality is warranted.For example, if � � 2�3, then solving � � � leads to �� 2
1 3, which is the general formula for finding an input from aspecific output, �, for this function, � .
At this point, students need neither the notation nor the formallanguage of inverse functions, but only the idea of “going backwards”from output to input. This can be interpreted for a table and graphof the function under examination. Correspondences between equa-
Draft, 12/03/2012, comment at commoncoretools.wordpress.com .

13
tions giving specific values of the functions, table entries, and pointon the graph can be noted (MP1). And although not required in thestandard, it is reasonable to include, for comparison, a few exampleswhere the input cannot be uniquely determined from the output. Forexample, if � � �2, then � � 5 has two solutions, � 5.
For advanced mathematics, some students will need a formal+
sense of inverse functions, which requires careful development. For+
example, as students begin formal study, they can easily believe that+
“inverse functions” are a new family of functions, similar to linear+
functions and exponential functions. To help students develop theA Joke
Teacher: Are these two functions inverses?Student: Um, the first one is and the second one isn’t.
What does this student misunderstand about inverse functions?
+
instinct that “inverse” is a relationship between two functions, the+
recurring questions should be “What is the inverse of this function?”+
and “Does this function have an inverse?” The focus should be on+
“inverses of functions” rather than a new type of function.+
Discussions of the language and notation for inverse functions+
can help to provide students a sense of what the adjective “inverse”+
means and mention that a function which has an inverse is known+
as an “invertible function.”+
The function � � � is sometimes called the identity function+
because it assigns each number to itself. It behaves with respect+
to composition of functions the way the multiplicative identity, 1,+
behaves with multiplication of real numbers and the way that the+
identity matrix behaves with matrix multiplication. If � is any function+
(over the real numbers), this analogy can be expressed symbolically+
as � � � � � , and it can be verified as follows:+
� � � � � � � � and � � � � � � � �
Suppose � denotes a function with an inverse whose domain is+
the real numbers and � is nonzero real number (which thus has a+
multiplicative inverse), and B is an invertible matrix. The following+
table compares the concept of inverse function with the concepts of+
multiplicative inverse and inverse matrix:+
Sentence Interpretation� 1 � � � � 1 The composition of � 1 with � is the identity function� 1 � 1 � � 1 The product of � 1 and � is the multiplicative identityB 1 B � B B 1 The product of B 1 and B is the identity matrix
+
+
In other words, where � 1 means the inverse of � with respect+
to multiplication, � 1 means the inverse of � with respect to func-+
tion composition. Thus, when students interpret the notation � 1 �+
incorrectly to mean 1 � � , the guidance they need is that the mean-+
ing of the “exponent” in � 1 is about function composition, not about+
multiplication.
Notation InconsistencyIn the expression sin
2 �, the exponent is about multiplication, butin sin
1 � the exponent is about function composition. Despitethe similar look, these notations use superscripts in differentways. The 2 acts as an exponent but the 1 does not. Bothnotations, however, allow the expression to be written withoutthe parentheses that would be needed otherwise.
+
Students do not need to develop the abstract sense of identity+
and inverse detailed in the above table. Nonetheless, these perspec-+
tives can inform the language and conversation in the classroom as+
students verify by composition (in both directions) that given func-+
tions are inverses.F-BF.4b. Furthermore, students can continue to F-BF.4b(+) Verify by composition that one function is the inverseof another.
+
refine their informal “going backwards” notions, as they consider+
Draft, 12/03/2012, comment at commoncoretools.wordpress.com .

14
inverses of functions given by graphs or tables.F-BF.4c In this work, F-BF.4c(+) Read values of an inverse function from a graph or atable, given that the function has an inverse.
+
students can gain a sense that “going backwards” interchanges the+
input and output and therefore the stereotypical roles of the letters+
� and �. And they can reason why the graph of � � 1 � will be+
the reflection across the line � � of the graph of � � � .+
Suppose � � � 3
2. From the graph, it is easy to see that+
� � � will have two solutions for any � 0. Thus, to create an+
invertible function,F-BF.4d we must restrict the domain of � so thatF-BF.4d(+) Produce an invertible function from a non-invertiblefunction by restricting the domain.
+
every range value corresponds to exactly one domain value. One+
possibility is to restrict the domain of � to � 3, as illustrated by+
the solid purple curve in the graph on the left.•
•
���� �
10
8
6
4
2
5
g x( ) = x 3( )2 10
8
6
4
2
5
h x( ) = 3 + xg x( ) = x 3( )2
+
When solving � 3
2 �, we get � 3 �, illustrating that+
positive values of � will yield two solutions � for the unrestricted+
function. With the restriction, 3 � is not in the domain. Thus, �+
3 �, which corresponds to choosing the solid curve and ignoring+
the dotted portion. The inverse function, then, is � � 3 �, for+
� 0.+
We check that � is the inverse of (restricted) � as follows:
� � � � 3 � 3 � 3
2 � 2 �� � 0
� � � � � 3
2
3 � 3
2
3 � 3 �� � 3�
The first verification requires that � 0 so that � is in the domain+
of �. The second verification requires that � 3 so that � is in the+
domain of (restricted) �. And this is precisely what is required for+
� 3
2 to simplify to � 3 .• The rightmost graph shows that • In general, � 3
2 � 3 . If we had chosen the dottedportion of the graph, it would have simplified to � 3 .
+
the graph of � can be seen as the reflection of the graph of � across+
the line � � .+
As detailed in the next section, logarithms for most students+
are merely shorthand for the solutions to exponential equations.+
Students in advanced classes, however, need to understand loga-+
rithms as functions—and as inverses of exponential functions.F-BF.5F-BF.5(+) Understand the inverse relationship between expo-nents and logarithms and use this relationship to solve problemsinvolving logarithms and exponents.
+
They should be able to explain identities such as log� �� � and+
�log� � � as well as the laws of logarithms, such as log ��+
log � log �. In doing so, students can think of the logarithms as+
unknown exponents in expressions with base 10 (e.g. log � answers+
the question “Ten to the what equals �?”) and use the properties+
of exponents,N-RN.1 building on the understanding of exponents thatN-RN.1 Explain how the definition of the meaning of rational ex-ponents follows from extending the properties of integer expo-nents to those values, allowing for a notation for radicals in termsof rational exponents.
+
began in Grade 8.8.EE.1
8.EE.1Know and apply the properties of integer exponents togenerate equivalent numerical expressions.
+
Draft, 12/03/2012, comment at commoncoretools.wordpress.com .

15
Linear and Exponential ModelsConstruct and compare linear and exponential models and solveproblems Distinguishing between situations that can be modeledwith linear functions and with exponential functionsF-LE.1a turns on
F-LE.1a Prove that linear functions grow by equal differencesover equal intervals, and that exponential functions grow by equalfactors over equal intervals.understanding their rates of growth and looking for indications of
these types of growth rates (MP7). One indicator of these growthrates is differences over equal intervals, given, for example, in atable of values drawn from the situation—with the understandingthat such a table may only approximate the situation (MP4).
To prove that a linear function grows by equal differences overequal intervals,F-LE.1b students draw on the understanding devel- F-LE.1b Recognize situations in which one quantity changes at
a constant rate per unit interval relative to another.oped in Grade 8 that the ratio of the rise and run for any two dis-tinct points on a line is the same (see the Expressions and EquationsProgression). An interval can be seen as determining two points onthe line whose �-coordinates occur at the boundaries of the inter-vals. The equal intervals can be seen as the runs for two pairs ofpoints. Because these runs have equal length and ratio betweenrise and run is the same for any pair of points, the consequence thatthe corresponding rises are the same. These rises are the growth ofthe function over each interval.
Students note the correspondence between rise and run on agraph and differences of inputs and outputs in a symbolic form of theproof (MP1). A symbolic proof has the advantage that the analogousproof showing that exponential functions grow by equal factors overequal intervals begins in an analogous way.
The process of going from linear or exponential functions to ta-bles can go in the opposite direction. Given sufficient information,e.g., a table of values together with information about the type ofrelationship represented,F-LE.4, students construct the appropriate
F-LE.4 For exponential models, express as a logarithm the solu-tion to ���� � where �, �, and � are numbers and the base �is 2, 10, or �; evaluate the logarithm using technology.function. For example, students might be given the information that
the table below shows inputs and outputs of an exponential function,and asked to write an expression for the function.
Input Output0 5
8 33
Interpret expressions for functions in terms of the situation theymodel Students may build a function to model a situation, usingparameters from that situation. In these cases, interpreting expres-sions for a linear or exponential function in terms of the situationit modelsF-LE.5 is often just a matter of remembering how the func- F-LE.5 Interpret the parameters in a linear or exponential func-
tion in terms of a context.tion was constructed. However, interpreting expressions may beless straightforward for students when they are given an algebraicexpression for a function and a description of what the function isintended to model.
Draft, 12/03/2012, comment at commoncoretools.wordpress.com .

16
For example, in doing the task Illegal Fish in the margin, studentsmay need to rely on their understanding of a function as determiningan output for a given input to answer the question “Find � if youknow the lake contains 33 fish after eight weeks.”
Illegal Fish
A fisherman illegally introduces some ïnAsh into a lake, and theyquickly propagate. The growth of the population of this newspecies (within a period of a few years) is modeled byP � 5�� , where � is the time in weeks following theintroduction and � is a positive unknown base.
(a) Exactly how many fish did the fisherman release into thelake?
(b) Find � if you know the lake contains 33 fish after eightweeks. Show step-by-step work.
(c) Instead, now suppose that P � 5�� and � 2. What isthe weekly percent growth rate in this case? What does thismean in every-day language?
For solutions and more discussion of this task, go to IllustrativeMathematics at illustrativemathematics.org/illustrations/579
See the linear and exponential model section of the ModelingProgression for an example of an interpretation of the intersectionof a linear and an exponential function in terms of the situation theymodel.
Draft, 12/03/2012, comment at commoncoretools.wordpress.com .

17
Trigonometric FunctionsRight triangle trigonometry is concerned with ratios of sides of righttriangles, allowing functions of angle measures to be defined interms of these ratios.• This limits the angles considered to those
• Traditionally, trigonometry concerns “ratios.” Note, however,that according to the usage of the Ratio and Proportional Rea-soning Progression, that these would be called the “value of theratio.” In high school, students’ understanding of ratio may nowbe sophisticated enough to allow “ratio” to be used for “value ofthe ratio” in the traditional manner. Likewise, angles are carefullydistinguished from their measurements when students are learn-ing about measuring angles in Grades 4 and 5. In high school,students’ understanding of angle measure may now allow anglesto be referred to by their measures.
between 0 and 90 . Circular trigonometry extends the domains ofthe trigonometric functions within the real numbers.
Traditionally, trigonometry includes six functions (sine, cosine,tangent, cotangent, secant, cosecant). Because the second threemay be expressed as reciprocals of the first three, this progressiondiscusses only the first three.
Extend the domain of trigonometric functions using the unit cir-cle In circular trigonometry, angles are usually measured in ra-dians rather than degrees. Radian measure is defined so that inthe unit circle the measure of an angle is equal to the length ofthe intercepted arc.F-TF.1 An angle of measure 1 radian turns out to
F-TF.1 Understand radian measure of an angle as the length ofthe arc on the unit circle subtended by the angle.be approximately 57�3 .• A full revolution, which corresponds to an
•
�
1 radian
1
1
angle of 360 , has measure equal to the circumference of the unitcircle, or 2π . A quarter turn, or 90 , measures π 2 radians.
In geometry, students learn, by similarity, that the radian mea-sure of an angle can be defined as the quotient of arc length toradius.G-C.5 As a quotient of two lengths, therefore, radian measure
G-C.5 Derive using similarity the fact that the length of the arcintercepted by an angle is proportional to the radius, and definethe radian measure of the angle as the constant of proportionality;derive the formula for the area of a sector.
is “dimensionless.” That is why the “unit” is often omitted whenmeasuring angles in radians.
In calculus, the benefits of radian measure become plentiful, lead-ing, for example, to simple formulas for derivatives and integrals oftrigonometric functions. Before calculus, there are two key benefitsof using radians rather than degrees:
• arclength is simply �θ, and
• sin θ θ for small θ.
In right triangle trigonometry, angles must be between 0 and90 . Circular trigonometry allows angles that describe any amountof rotation, including rotation greater than 360 .F-TF.2 Consistent
F-TF.2 Explain how the unit circle in the coordinate plane enablesthe extension of trigonometric functions to all real numbers, inter-preted as radian measures of angles traversed counterclockwisearound the unit circle.with conventions for measuring angles, counterclockwise rotation
is associated with angles of positive measure and clockwise rota-tion is associated with angles of negative measure. The topic iscalled circular trigonometry because all rotations take place aboutthe origin on the circle of radius 1 centered at the origin (called theunit circle), in the the coordinate plane.
With the help of a picture,• students mark the intended angle, θ,•
�
1
0.5
0.5
1
1 1
1y
x
ș
(x, y)
in radians, measured counterclockwise from the positive ray of the �-axis; identify the coordinates � and �; draw a reference triangle; andthen use right triangle trigonometry. In particular, sin θ � 1 �,cos θ � 1 � , and tan θ � � . (Note the simplicity affordedby using a circle of radius 1.) This way, students can computevalues of any of the trigonometric functions, except that in circular
Draft, 12/03/2012, comment at commoncoretools.wordpress.com .

18
trigonometry being careful to note the signs of � and �. In the figureas drawn in the second quadrant, for example, � is negative and �is positive, which implies that sin θ is positive and cos θ and tan θare both negative.
The next step is sometimes called “unwrapping the unit circle.”On a fresh set of axes, the angle θ is plotted along the horizontal axisand one of the trigonometric functions is plotted along the verticalaxis. Dynamic presentations with shadows can help considerably,and the point should be that students notice the periodicity of thefunctions, caused by the repeated rotation about the origin, regularlyreflecting on the grounding in right triangle trigonometry.
With the help of the special right triangles, 30 -60 -90 and+
45 -45 -90 , for which the quotients of sides are easily computed,+
the values of the trigonometric functions are easily computed for+
the angles π 3, π 4, and π 6 as well as their multiples.F-TF.3 For
F-TF.3(+) Use special triangles to determine geometrically thevalues of sine, cosine, tangent for π 3, π 4 and π 6, and use theunit circle to express the values of sine, cosines, and tangent forπ �, π �, and 2π � in terms of their values for �, where �is any real number.
+
advanced mathematics, students need to develop fluency with the+
trigonometric functions of these special angles to support fluency+
with the “unwrapping of the unit circle” to create and graph the+
trigonometric functions.+
Using symmetry,• students can see that, compared to the refer-
•
�
1
0.5
0.5
1
1 1
1y
x
-y
șș
(x, -y)
(x, y)+
ence triangle with angle θ, an angle of θ will produce a congru-+
ent reference triangle that is its reflection across the �-axis. They+
can then reason that sin θ � sin θ , so sine is an odd+
function. Similarly, cos θ � cos θ , so cosine is an even+
function.F-TF.4 Some additional work is required to verify that these
F-TF.4(+) Use the unit circle to explain symmetry (odd and even)and periodicity of trigonometric functions.
+
relationships hold for values of θ outside the first quadrant.+
The same sorts of pictures can be used to argue that the trigono-+
metric functions are periodic. For example, for any integer �, sin θ+
2�π sin θ because angles that differ by a multiple of 2π have+
the same terminal side and thus the same coordinates � and �.+
Model periodic phenomena with trigonometric functions Now thatstudents are armed with trigonometric functions, they can modelsome periodic phenomena that occur in the real world. For stu-dents who do not continue into advanced mathematics, this is theculmination of their study of trigonometric functions.
The tangent and function is not often useful for modeling periodicphenomena because tan � is undefined for � π
2
�π , where � is aninteger. Because the sine and cosine functions have the same shape,either suffices to model simple periodic phenomena.F-TF.5 Functions F-TF.5 Choose trigonometric functions to model periodic phe-
nomena with specified amplitude, frequency, and midline.are called sinusoidal if they have the same shape as the sine graph.Many real-world phenomena can be approximated by sinusoids, in-cluding sound waves, oscillation on a spring, the motion of a pen-dulum, tides, and phases of the moon. Some students will learn incollege that sinusoids are used as building blocks to approximateany periodic waveform.
The general sinusoid is given by � � A B sin C � D . Stu-dents can reason that because sin θ oscillates between 1 and 1,
Draft, 12/03/2012, comment at commoncoretools.wordpress.com .

19
A B sin C � D will oscillate between A B and A B. Thus, � Ais the midline, and B is the amplitude of the sinusoid. Students canobtain the frequency from this equation by noting the period of ����of 2π and knowing the frequency is the reciprocal of the period,so the period of ���C � is 2π C . When modeling, students need tohave the sense that C affects the frequency and that C and D to-gether produce a phase shift, but getting these correct might involvetechnological support, except in simple cases.
Frequency vs. PeriodFor a sinusoid, the frequency is often measured in cycles persecond, thus the period is often measured in seconds per cycle.For reasoning about a context, it is common to choosewhichever is greater numerically.
For example, students might be asked to model the length ofthe day in Columbus, Ohio. Day length as a function of date isapproximately sinusoidal, varying from about 9 hours, 20 minuteson December 21 to about 15 hours on June 21. The average ofthe maximum and minimum gives the value for the midline, and theamplitude is half the difference. So A 12�17, and B 2�83. Withsome support, students can determine that for the period to be 365days (per cycle),• C 2π 365, and if day 0 corresponds to March • or for the frequency to be 1
365 cycles/day
21, no phase shift is needed, so D 0. Thus,
� � 12�17 2�83 sin
2π�365
From the graph,• students can see that the period is indeed 365 •
15
Length�of�Day�(hrs),�Columbus,�OH
14
15
12
13
10
11
9
10
21 Mar 20 Jun 20 Sep 20 Dec 21 Mar21ͲMar 20ͲJun 20ͲSep 20ͲDec 21ͲMar
days, as desired, as it takes one year to complete the cycle. Theycan also see that two days are approximately 14 hours long, whichis to say that � � 14 has two solutions over a domain of oneyear, and they might use graphing or spreadsheet technology todetermine that May 1 and August 10 are the closest such days.Students can also see that � � 9 has no solutions, which makessense because 9 hours, 20 minutes is the minimum length of day.
Students who take advanced mathematics will need additional+
fluency with transformations of trigonometric functions, including+
changes in frequency and phase shifts.+
Based on plenty of experience solving equations of the form+
� � � graphically, students of advanced mathematics should be+
able to see that such equations will have an infinite number of solu-+
tions when � is a trigonometric function. Furthermore, they should+
have had experience of restricting the domain of a function so that it+
has an inverse. For trigonometric functions, a common approach to+
restricting the domain is to choose an interval on which the function+
is always increasing or always decreasing.F-TF.6 The obvious choiceF-TF.6(+) Understand that restricting a trigonometric function toa domain on which it is always increasing or always decreasingallows its inverse to be constructed.
+
for sin � is the interval π2
� π2
, shown as the solid part of the+
graph.• This yields a function θ sin
1 � with domain 1 � 1
•
�
1
1
ʌ ʌ
2
ʌ
2
ʌ 3ʌ
2
2ʌ
f x( ) = sin x( )+
and range π2
θ π2
.+
Inverses of trigonometric functions can be used in solving equa-tions in modeling contexts.F-TF.7 For example, in the length of day
F-TF.7(+) Use inverse functions to solve trigonometric equationsthat arise in modeling contexts; evaluate the solutions using tech-nology, and interpret them in terms of the context.
context, students can use inverse trig functions to determine dayswith particular lengths. This amounts to solving � � � for � , whichyields
� 365
2π sin
1
� 12�17
2�83
Draft, 12/03/2012, comment at commoncoretools.wordpress.com .

20
Using � 14 and a calculator (in radian mode), they can compute+
that � 40�85, which is closest to May 1. Finding the other solution+
is a bit of a challenge, but the graph indicates that it should occur+
just as many days before midyear (day 182.5) as May 1 occurs after+
day 0. So the other solution is � 182�5 40�85 141�65, which is+
closest to August 10.+
Prove and apply trigonometric identities For the cases illustratedby the diagram•(in which the terminal side of angle θ does not lie on •
�
1
0.5
0.5
1
1 1
1y
x
ș
(x, y)
an axis) and the definitions of sin θ and cos θ, students can reasonthat, in any quadrant, the lengths of the legs of the reference triangleare � and � . It then follows from the Pythagorean Theorem that� 2 � 2
1. Because � 2 �2 for any real number �, thisequation can be written �2 �2
1. Because � cos θ and� sin θ, the equation can be written as sin
2 θ cos
2 θ 1.When the terminal side of angle θ does lie on an axis, then one of �or � is 0 and the other is 1 or 1 and the equation still holds. Thisargument proves what is known as the Pythagorean identityF-TF.8
F-TF.8 Prove the Pythagorean identity sin
2 θ cos
2 θ 1
and use it to find sin θ , cos θ , or tan θ given sin θ , cos θ ,or tan θ and the quadrant of the angle.because it is essentially a restatement of the Pythagorean Theorem
for a right triangle of hypotenuse 1.With this identity and the value of one of the trigonometric
functions for a given angle, students can find the values of theother functions for that angle, as long as they know the quad-rant in which the angle lies. For example, if sin θ 0�6 and θlies in the second quadrant, then cos
2 θ 1 0�62
0�64, socos θ 0�64 0�8. Because cosine is negative in the sec-ond quadrant, it follows that cos θ 0�8, and therefore tan θsin θ cos θ 0�6 0�8 0�75.
Students in advanced mathematics courses can prove and use+
other trigonometric identities, including the addition and subtrac-+
tion formulas.F-TF.9 If students have already represented complexF-TF.9(+) Prove the addition and subtraction formulas for sine,cosine, and tangent and use them to solve problems.
+
numbers on the complex planeN-CN.4 and developed the geomet-N-CN.4(+) Represent complex numbers on the complex planein rectangular and polar form (including real and imaginary num-bers), and explain why the rectangular and polar forms of a givencomplex number represent the same number.
+
ric interpretation of their multiplication,N-CN.5 then the the product
N-CN.5(+) Represent addition, subtraction, multiplication, andconjugation of complex numbers geometrically on the complexplane; use properties of this representation for computation.
+
cos α � sin α cos β � sin β can be used in deriving the addition+
formulas for cosine and sine. Subtraction and double angle formulas+
can follow from these.+
Draft, 12/03/2012, comment at commoncoretools.wordpress.com .