progressive collapse vulnerability of a cable stayed …
TRANSCRIPT

International Journal of Bridge Engineering (IJBE), Vol. 4, No. 2, (2016), pp. 73-91
PROGRESSIVE COLLAPSE VULNERABILITY
OF A CABLE STAYED BRIDGE
Rajarshi Das1, A. D. Pandey
2, Soumya
3, M. J. Mahesh
4 and S. Anvesh
5
1, 3, 4, 5Department of Earthquake Engineering, Indian Institute of Technology Roorkee, India 2Assistant Professor, Department of Earthquake Engineering, Indian Institute of Technology
Roorkee, Uttarakhand, India, 247667
e-mail: [email protected], [email protected]
ABSTRACT: Since the structural system of bridges is different from buildings,
only a few of many modern codes offer adequate methods of improving
resistance against progressive collapse for bridges. Although great efforts have
been contributed to the progressive collapse of building structures, comparably
small attention has been paid to the bridge structures, specially the cable-stayed
bridges. This study demonstrates numerical modelling and analysis of a
representative cable stayed bridge through the four analytical procedures, i.e.,
linear static, nonlinear static, linear dynamic and nonlinear dynamic to
understand the collapse pattern. Furthermore, the response of the structural
model is discussed for multiple types of cable loss cases. The Dynamic
Amplification Factor of 2 has been approved by the results. The results also
indicated a relation between the possibilities of failure progression with the
location of the failed cables with respect to the pylons. Different progressive
collapse patterns were also identified for nonlinear static and dynamic
procedures.
KEYWORDS: Cable Stayed Bridge, Dynamic analysis, Linear analysis,
Nonlinear analysis, Progressive collapse.
1 INTRODUCTION A structural failure initiated by a localized structural injury and eventual
development of a chain reaction, resulting into a breakdown of a major portion
of the entire system is characterized as Progressive collapse. It is a dynamic
event initiated by a release of internal energy due to the instantaneous loss of a
structural affiliate disturbing the initial load equilibrium and thus, the structure
vibrates until either a new equilibrium position is found or it collapses. Events
like the collapse of Haeng-Ju Grand Bridge in Seoul in 1992 ensured the need
to incorporate progressive collapse resisting procedures into the design of major
bridges. Bridges being primarily horizontally aligned structures with a single
main axis of extension; their possible mechanisms of collapse are different
74 Progressive collapse vulnerability of a cable stayed bridge
compared to buildings. For example, the loss of cables should be measured as a
possible local failure for cable stayed bridges due to their small cross sections
which lead to low resistances against accidental lateral loads stemming from
vehicle impact or accidental actions. The loss of cables can lead to overloading
and rupture of adjacent cables.
2 A LITERATURE REVIEW As mentioned earlier, the structural system of a bridge is relatively simple, with
low redundancy, and high sensitivity to dynamic excitation. So, Liu et al (2011)
[1] proposed a different classification than the one given by Starossek (2007)
[2]. According to the authors, the reasons behind bridge progressive collapse
can be divided into three aspects, (i) unexpected events, such as collision with
overweigh vehicles, exploration, and earthquake, (ii) degradation of structure
performance, including corrosion and creep effect, and (iii) improper design or
wrong construction methods.
Two types of failure progression were stated. First was the Bearing-failure
type; where the direct consequences of failure of the main bearing component
included; (a) Reduction of statically indeterminacy degree, and (b) Internal
force distribution. The Guangdong Jiujiang Bridge collapsed due to sailing fault
as a sand filled ship collided with one of the piers, damaging the adjacent four
continuous spans. Secondly, partial-failure type, where “partial” means some
load-bearing components of bridge structures. Due to the failure of these
members, the structural stiffness and internal forces would change, resulting in
progressive collapse. In 2001, the Xiaonanmen Bridge collapsed because of
stress corrosion of some ruptured hangers after being struck by an overweight
truck.
Cai et al (2012) [3] studied a 2D cable-stayed bridge structural model using
four modified analytical procedures, i.e., linear static, nonlinear static, linear
dynamic, and nonlinear dynamic. According to the Authors’ investigations, a
single cable loss did not start a collapse progression, as the cable tensions
remained relatively small. Although, for the simultaneous failure of two
adjacent cables, cables began to yield, plastic hinges were found in the girder,
and deformations increased rapidly, the bridge still remained intact. A complete
collapse progression was observed when the live load was increased by two
factors or more. After comparing the four improved methods the Authors’
concluded that the static analysis procedure is highly conservative in
comparison with the nonlinear dynamic analysis method and couldn’t provide
comprehensive information on structural response. Furthermore they
recommended the nonlinear dynamic analysis starting with the initial state given
by a nonlinear static procedure as the best solution to trace the collapse
progression. The results of their research evaluation of cable loss showed that
the cables near the vicinity of the ruptured cable would not reach the yield

Das et al. 75
tension and the maximum nodal vertical displacement would not increase much,
when the lost cables were near the pylon.
Wolff and Starossek (2012) [4] examined the dynamic response of a 3D
cable-stayed bridge to the loss of one and multiple cables. The Authors’
conducted a quasi-static analysis using dynamic amplification factors to study
the dynamic effects. The DAF were determined and the limits of the quasi-static
approach for cable-stayed bridges were highlighted. Then the collapse
behaviour of a cable-stayed bridge was analysed in the time domain considering
geometric and material nonlinearities. From the results the authors concluded
that a unique dynamic amplification factor could not be specified as it depended
on the location of the ruptured cable and on the type and location of the state
variable. A DAF of 2.0 was suggested for the safe design of cables. Dynamic
time history analyses were recommended for the cable loss cases which would
yield the highest responses. They also stated that the robustness of the bridge
could be increased by increasing the stiffness of the bridge girder or by reducing
the unsupported length, i.e. closer cable spacing. The Authors’ recommended
the former after analysing a greater chance of failure in the later case.
3 MODELLING OF A CABLE STAYED BRIDGE
3.1 Bridge details The bridge considered in this present piece of work, is 822.96m long, with four
122.3m high pylons supporting the deck. These pylons rest on two 13m high
piers. Fig. 1(a) and Fig. 1(b) show the 2D and the 3D geometrical configuration
of the model respectively. Two portals are present between each pair of pylons
to offer stability. The left and right ends of the deck are respectively hinge and
roller supported on the end piers.
Figure 1(a). 2D Geometry of the bridge model
The deck is supported by 136 stay cables with 68 on each half of the bridge.
Diameter of the cables rises linearly from 0.14m to 0.2m as either end or the
centre of the bridge is approached from the pylons. These cables are prestressed
1-1
1-2 1-33
1-34 2-1
2-2
2-34
2-33
30.317
m 10 m
104.98
m
1 Water
Level 182.88
m
182.88
m
457.2 m
m
Cable
Stays

76 Progressive collapse vulnerability of a cable stayed bridge
accordingly with a convergence study under gravity load. Piers are modelled as
concrete cellular box type structures. The numerical investigation is done using
the finite analysis software package SAP 2000. The material properties and
sectional details used for the different components of the bridge model have
been taken as per the corresponding Author’s M.Tech. Thesis [5].
Figure 1(b). 3D Geometry of the bridge model
3.2 Nonlinearity Practical structural response to accidental loading is always nonlinear in nature.
Therefore, material and geometrical nonlinearity should be considered to obtain
the genuine behaviour of the cable stayed bridges under different cable loss
cases. Method of plastic hinges was used in SAP 2000 program to consider
material nonlinearity for different elements. For each cable loss case two
prominent failures were observed from a literature survey,
(i) Overloading of adjacent cables due to local redistribution, and
(ii) Flexural failure of the steel girders and the deck.
Therefore the material nonlinearity was considered for the cables, girders and
the deck. As the cables can only be in tension, a compression limit of zero was
assigned to them and an axial plastic hinge was introduced in the middle of each
cable element. The yield stress was obtained from the material properties of a
cable as 0.6 GPa. The strain at onset of strain hardening was taken to be 2%;
then the strain at rupture was taken to be 5%. The girders are subjected to both
axial forces and bending moment. Thus P-M2-M3 hinges were introduced into
these elements. Hinge properties were adopted according to ASCE-365
guidelines. Instead of plastic hinges, nonlinearity was defined in its sectional
properties window. Due to large deflections after the loss of different cables, the
effect of geometrical nonlinearity was considered in the nonlinear static and
dynamic analysis. All materials were assumed to be isotropic and homogeneous
in nature.
Das et al. 77
4 PROGRESSIVE COLLAPSE ANALYTICAL TECHNIQUES A cable stayed bridge is the only type of bridge structure routinely designed for
cable loss. The loss of one or multiple number of cables can lead to overloading
and rupture of adjacent cables. Furthermore, the stiffening girder could be in
compression and a cable loss might reduce its bracing against flexure. One or
multiple cables are assumed to get damaged primarily to trigger the collapse
progression and then the following analyses are performed.
4.1 Linear gravity load analysis The gravity load analysis is a linear static analysis of the bridge model under its
own self weight and live load. This analysis procedure does not include any
type of nonlinearity or dynamic effect. It only provides a basic understanding of
local redistribution of stresses in the elements nearby to a failed one.
4.2 Nonlinear gravity load analysis In this nonlinear static procedure, nonlinear behaviour of the structural
components is taken into account. The axial force carried by a cable is observed
to get redistributed to the supporting elements after its elimination from the
structure. Stresses increased in those components and when they exceeded the
yield limit, that corresponding element also failed. Hence a collapse progression
is observed. Failure of different elements is indicated by hinges. Once the
analysis has been performed for different cable loss cases, plastic hinges are
found in the remaining cables and girders following an unique pattern. This
procedure provides an important step by step scenario to understand which
element is going to collapse first and which one is going to follow.
4.3 Linear dynamic analysis For the design of cable stayed bridges, the PTI (2001) also prescribes the use of
dynamic analysis in the extreme event of cable loss in terms of load
applications. Once a singular or multiple numbers of cables snap, an impact
load is generated on the pylon and the deck in an opposite direction, where they
were previously connected. The large push generated by this sudden dynamic
impact loading is identified to cause a different path of collapse progression
compared to the static analysis. The damping of the structural system is taken as
2%. The instantaneously unloading method is used in this study to analyse the
model for subsequent cable losses. The procedure adopted is as follows.
i. A nonlinear gravity load analysis is carried out on the undamaged
model to determine the deflected and stressed condition of the structure.
ii. The initial stressed structure is considered from the nonlinear gravity
load case to start the dynamic analysis.
iii. Initial axial forces (P) in cables are noted down from the nonlinear
gravity load case.

78 Progressive collapse vulnerability of a cable stayed bridge
iv. These equivalent and opposite axial forces (P) are assigned to the cables
(which were primarily assumed to fail) in both the anchorage locations
as shown in Fig. 2(a).
Figure 2. (a) Load direction and (b) Unload time history for the equivalent force due to cable loss
v. An instantaneous unloading function is used as shown in Fig 2(b).
When this function is applied on the model, the assigned axial forces
are automatically doubled. The first P cancels out the load carrying
capacity of the cable that was assumed to fail and the second P
introduces the impact force to the pylon and the deck on the anchorage
points. So, the corresponding cable collapses and subsequently
generates an impact force on the anchorage points with the unloading
function.
4.4 Nonlinear dynamic analysis The nonlinear dynamic analysis is done as a simple combination of the linear
dynamic and nonlinear gravity load analysis. In this procedure a dynamic
analysis was performed considering the geometrical and material nonlinearity of
the structural components. So, after the last step discussed in the previous linear
dynamic procedure, hinges are found in relevant cables and girders after their
corresponding yield points are reached. Stresses increase in the decks and
cracks are expected to occur subsequently according to the results.
5 PROGRESSIVE COLLAPSE ANALYSIS RESULTS A meticulous investigation is done on the cable stayed bridge model to study
the path of failure progression in a precise manner. P-Delta effects were
assigned to the frame elements to incorporate the cable stiffening behaviour due
to geometric nonlinearity. The linear and nonlinear static analysis of the
undamaged model provided the variation of the vertical deflection of the centre
of the bridge deck. The maximum vertical displacements of the centre in linear
and nonlinear static case are found to be -1.282303m and -1.268193m
respectively. Then the main structural model and models with different cable
(a) (b)
P
P
Time
Load
2
0.01 10 0

Das et al. 79
loss are analysed to visualize the load distribution, variation of different
response parameters and to determine the path of collapse progression
throughout the structure.
Two types of cable loss scenarios are considered.
(i) If an end cable fails first, a huge amount of stress gets redistributed to the
remaining structure resulting in a significant amount of increase in the axial
forces in the remaining cables and stresses in the girders and the deck. Now
this redistribution ratio also depends upon the position of the elements. The
remaining end cables attract more axial force than the middle cables. These
end cables were already carrying high axial tensions initially, so they are
more vulnerable to damage as a slight increase in the axial force can trigger
their failure. Therefore, their chance of failure is much greater than the
others due to the load redistribution.
(ii) Alternatively, if a middle cable fails first, again the axial loads increase in
the end cables rather than the near ones, making them vulnerable to collapse.
When these end cables rupture, the collapse progression occurs right through
the structure as it has lost its main load carrying members.
5.1 Loss of cable 1-1 (Case-1) The structural response of a cable stayed bridge to the sudden loss of cable 1-1
is studied in this section. The vertical deflection of the centre (1) and the quarter
points (2 & 3) of the deck and the longitudinal displacement of the pylon tops
(5, 6, 7 & 8) are plotted in Fig. 3 and Fig. 4. The deflection values of the
undamaged (main) structure are also given for a better understanding.
Figure 3. Variation of vertical displacements in Case-1
-6
-4
-2
0
2
4
6
0 1 2 3 4
Ver
tica
l D
isp
lace
men
t
in m
Node no.
Main
Linear Static
NonLinear Static
Linear Dynamic
NonLinear Dynamic

80 Progressive collapse vulnerability of a cable stayed bridge
Figure 4. Variation of longitudinal displacements in Case-1
In both of these above graphs it can easily be observed that there is a significant
variation in the vertical and longitudinal displacements obtained from the
nonlinear dynamic analysis. In Fig. 3, vertical displacement of the centre of the
deck resulted to be more than 4.5 meters, which defines that the bridge deck has
collapsed. Fig. 4 shows that the top of the first pylon has undergone a
longitudinal displacement of 7 meters due to increased flexure and vertical
deflection of the longitudinal girders and the concrete deck. This reflects upon
the failure of pylon 1. No such significant variation is observed for the static
case. Hence, according to Fig. 3 and Fig. 4, the bridge remains intact during the
static procedure but collapses in the dynamic one.
Fig. 5 shows the cable forces in four most vulnerable cables after the
mentioned cable failure, using the nonlinear static procedure. Cable 1-1 is the
leftmost end cable. As discussed earlier, it can be seen that, considerable
increase in demand occurs in one of the end cables (Cable 2-1) at the opposite
end of the bridge. However, in this case, as an important load carrying member
fails, forces also increase significantly in the cables near the vicinity of the
ruptured cable. In the nonlinear static case for this particular cable loss as shown
in Fig. 5, the increase in the axial force is observed to stay within the limit, thus
failure haven’t occurred.
Figure 5. Variation of axial forces in nonlinear static analysis of Case-1
-4
-2
0
2
4
6
8
4 5 6 7 8 9
Lo
ngit
ud
inal
Dis
pla
cem
ent
in m
Node No.
Main
Linear Static
NonLinear Static
Linear Dynamic
NonLinear Dynamic
0
5000
10000
15000
20000
0 20 40 60 80 100
Axia
l fo
rce
in k
N
No. of Steps
Frame 1-2
Frame 1-3
Frame 1-4
Frame 2-1

Das et al. 81
Figure 6. Variation of axial forces in nonlinear dynamic analysis of Case-1
Fig. 6 shows the cable forces in four most vulnerable cables after the mentioned
cable failure, using the nonlinear dynamic procedure. From this figure, the
dynamic behavior of cables can easily be explained with increasing time steps
for the nonlinear dynamic analysis. As Cable 1-1 fails, it generates an
instantaneous push on the anchorage points on the pylon and the deck. These
components get deflected in the opposite direction, increasing a significant
amount of axial tension in the neighboring cables of the ruptured one. The axial
tension in the corresponding cables is noticed to reach its maximum value after
a certain time interval and as it exceeds the yield limit the relevant cable fails.
Failure of an element means its zero contribution to the structure. So, a cable
carrying zero axial tension is considered as a ruptured cable. In Fig. 6, it is seen
that Cable 1-2 fails after 1.9 secs and Cable 1-3 fails after 2.1 secs. Then Cable
1-4 and Cable 2-1 follows.
The final stressed state before the collapse of the entire structure, determined
in the nonlinear static and dynamic case are shown in Fig. 7 and Fig. 8
correspondingly.
Figure 7. Final state of nonlinear static analysis in Case-1
-4000
0
4000
8000
12000
16000
20000
0 1 2 3 4 5
Axia
l fo
rce
in k
N
Time in secs
Frame 1-4
Frame 2-1
Frame 1-3
Frame 1-2
82 Progressive collapse vulnerability of a cable stayed bridge
Figure 8. Final state of nonlinear dynamic analysis in Case-1
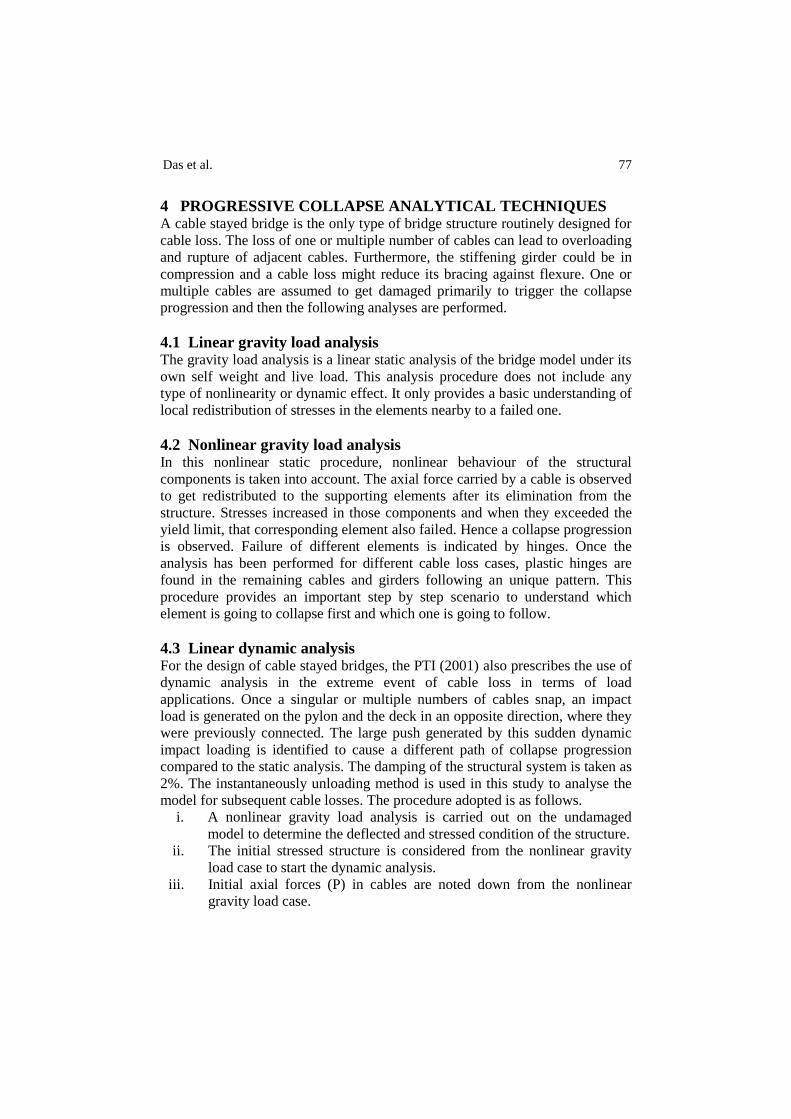
5.2 Loss of cable 1-1 and cable 1-2 (Case-2) The investigation of the cable stayed bridge due to sudden loss of cable 1-1 and
1-2 is described in this sector. Fig. 9 and Fig. 10 describe the variation in the
vertical deflection of the centre (1) and quarter points (2 &3) of the bridge deck
and the longitudinal displacement of the pylon tops (5, 6, 7 & 8). The
deflections of the undamaged structure are also shown for comparison study.
Figure 9. Variation of vertical displacements in Case-2
Figure 10. Variation of longitudinal displacements in Case-2
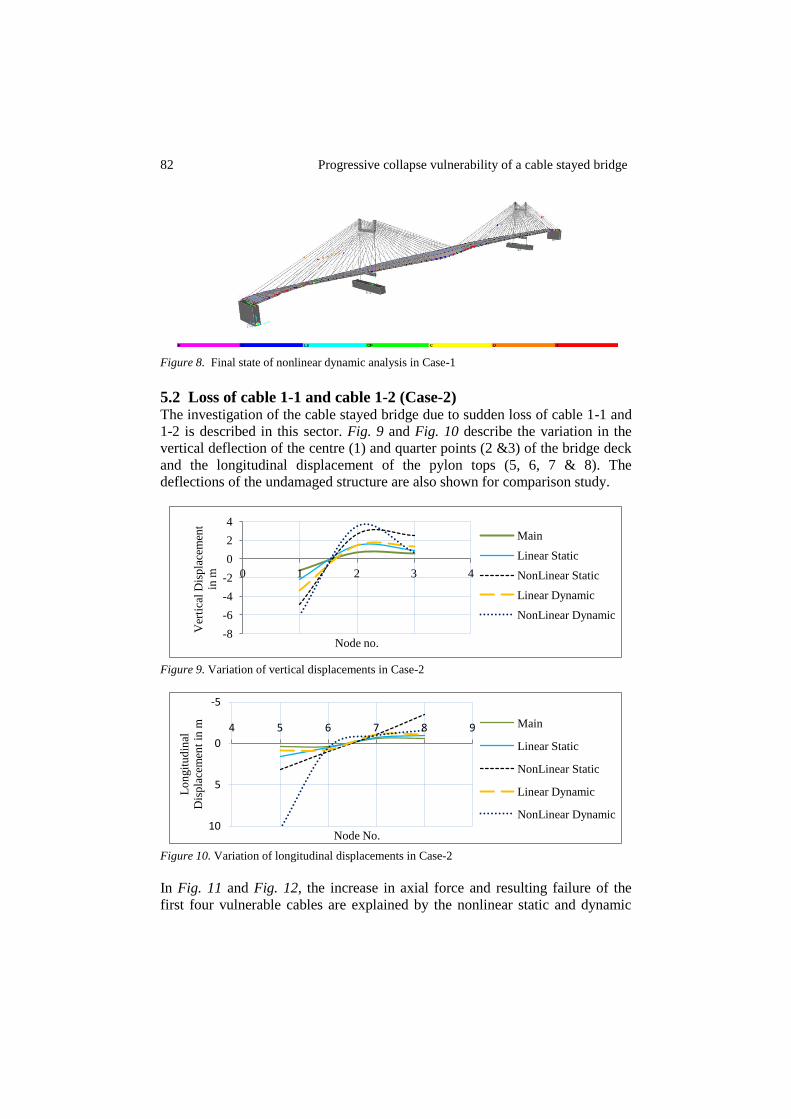
In Fig. 11 and Fig. 12, the increase in axial force and resulting failure of the
first four vulnerable cables are explained by the nonlinear static and dynamic
-8
-6
-4
-2
0
2
4
0 1 2 3 4
Ver
tica
l D
isp
lace
men
t
in m
Node no.
Main
Linear Static
NonLinear Static
Linear Dynamic
NonLinear Dynamic
-5
0
5
10
4 5 6 7 8 9
Lo
ngit
ud
inal
Dis
pla
cem
ent
in m
Node No.
Main
Linear Static
NonLinear Static
Linear Dynamic
NonLinear Dynamic
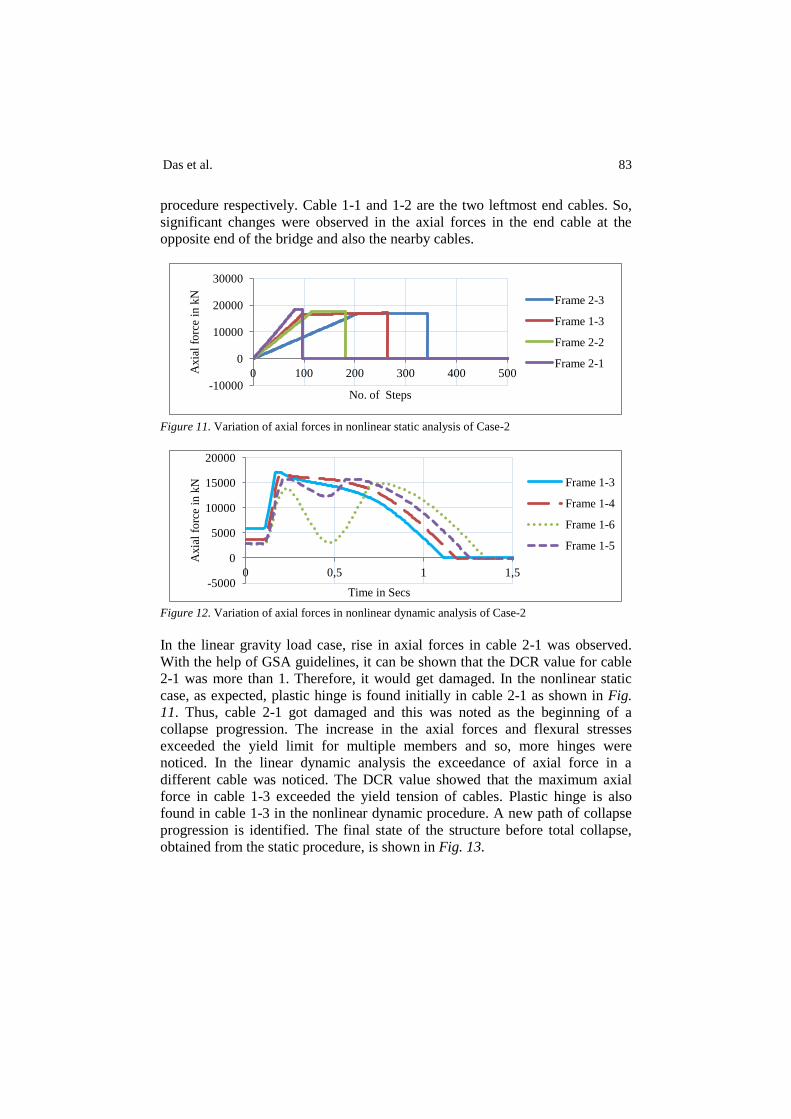
Das et al. 83
procedure respectively. Cable 1-1 and 1-2 are the two leftmost end cables. So,
significant changes were observed in the axial forces in the end cable at the
opposite end of the bridge and also the nearby cables.
Figure 11. Variation of axial forces in nonlinear static analysis of Case-2
Figure 12. Variation of axial forces in nonlinear dynamic analysis of Case-2
In the linear gravity load case, rise in axial forces in cable 2-1 was observed.
With the help of GSA guidelines, it can be shown that the DCR value for cable
2-1 was more than 1. Therefore, it would get damaged. In the nonlinear static
case, as expected, plastic hinge is found initially in cable 2-1 as shown in Fig.
11. Thus, cable 2-1 got damaged and this was noted as the beginning of a
collapse progression. The increase in the axial forces and flexural stresses
exceeded the yield limit for multiple members and so, more hinges were
noticed. In the linear dynamic analysis the exceedance of axial force in a
different cable was noticed. The DCR value showed that the maximum axial
force in cable 1-3 exceeded the yield tension of cables. Plastic hinge is also
found in cable 1-3 in the nonlinear dynamic procedure. A new path of collapse
progression is identified. The final state of the structure before total collapse,
obtained from the static procedure, is shown in Fig. 13.
-10000
0
10000
20000
30000
0 100 200 300 400 500 Axia
l fo
rce
in k
N
No. of Steps
Frame 2-3
Frame 1-3
Frame 2-2
Frame 2-1
-5000
0
5000
10000
15000
20000
0 0,5 1 1,5
Axia
l fo
rce
in k
N
Time in Secs
Frame 1-3
Frame 1-4
Frame 1-6
Frame 1-5
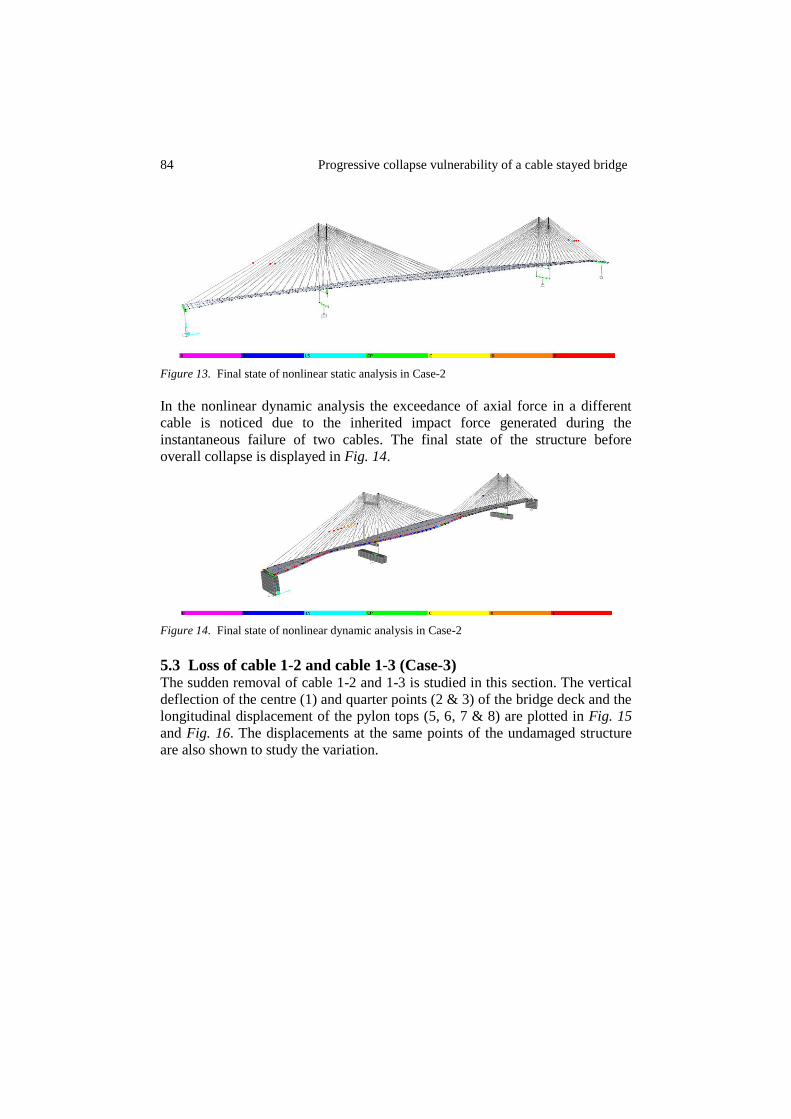
84 Progressive collapse vulnerability of a cable stayed bridge
Figure 13. Final state of nonlinear static analysis in Case-2
In the nonlinear dynamic analysis the exceedance of axial force in a different
cable is noticed due to the inherited impact force generated during the
instantaneous failure of two cables. The final state of the structure before
overall collapse is displayed in Fig. 14.
Figure 14. Final state of nonlinear dynamic analysis in Case-2
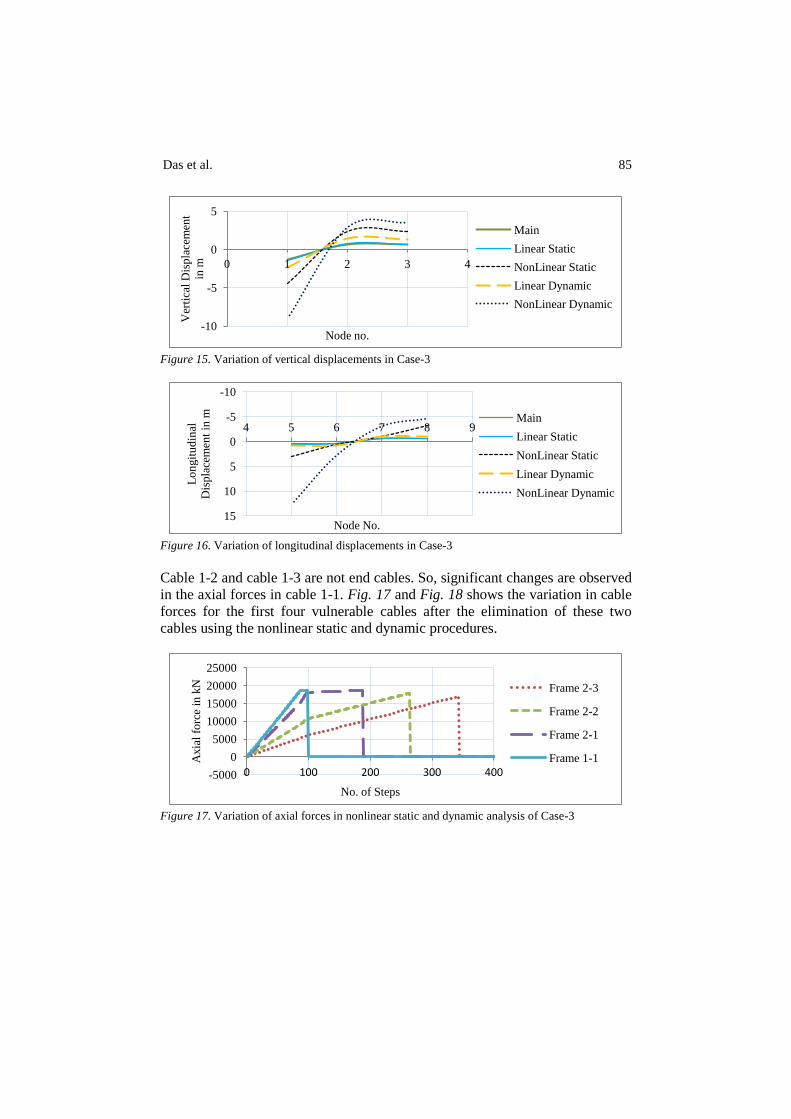
5.3 Loss of cable 1-2 and cable 1-3 (Case-3) The sudden removal of cable 1-2 and 1-3 is studied in this section. The vertical
deflection of the centre (1) and quarter points (2 & 3) of the bridge deck and the
longitudinal displacement of the pylon tops (5, 6, 7 & 8) are plotted in Fig. 15
and Fig. 16. The displacements at the same points of the undamaged structure
are also shown to study the variation.
Das et al. 85
Figure 15. Variation of vertical displacements in Case-3
Figure 16. Variation of longitudinal displacements in Case-3
Cable 1-2 and cable 1-3 are not end cables. So, significant changes are observed
in the axial forces in cable 1-1. Fig. 17 and Fig. 18 shows the variation in cable
forces for the first four vulnerable cables after the elimination of these two
cables using the nonlinear static and dynamic procedures.
Figure 17. Variation of axial forces in nonlinear static and dynamic analysis of Case-3
-10
-5
0
5
0 1 2 3 4
Ver
tica
l D
isp
lace
men
t
in m
Node no.
Main
Linear Static
NonLinear Static
Linear Dynamic
NonLinear Dynamic
-10
-5
0
5
10
15
4 5 6 7 8 9
Lo
ngit
ud
inal
Dis
pla
cem
ent
in m
Node No.
Main
Linear Static
NonLinear Static
Linear Dynamic
NonLinear Dynamic
-5000
0
5000
10000
15000
20000
25000
0 100 200 300 400
Axia
l fo
rce
in k
N
No. of Steps
Frame 2-3
Frame 2-2
Frame 2-1
Frame 1-1

86 Progressive collapse vulnerability of a cable stayed bridge
Figure 18. Variation of axial forces in nonlinear static and dynamic analysis of Case-3
The linear gravity load case has shown the rise in axial forces in cable 1-1. As
per the GSA guidelines, it could have been easily concluded that cable 1-1 got
damaged as the DCR value for cable 1-1 was more than 1. In the nonlinear
static case, plastic hinges are found in cable 1-1. After the failure of cable 1-1,
an important load carrying end cable, failure progression is found to occur.
More hinges are found in different members.
In the linear dynamic analysis exceedance of the axial force in the same
cable is noticed. The DCR value showed the maximum axial force in cable 1-1
exceeding the yield tension of cables. Although, the primary plastic hinge is
found in cable 1-1 in the nonlinear dynamic procedure, a new progression path
was noticed as shown in Fig. 18.
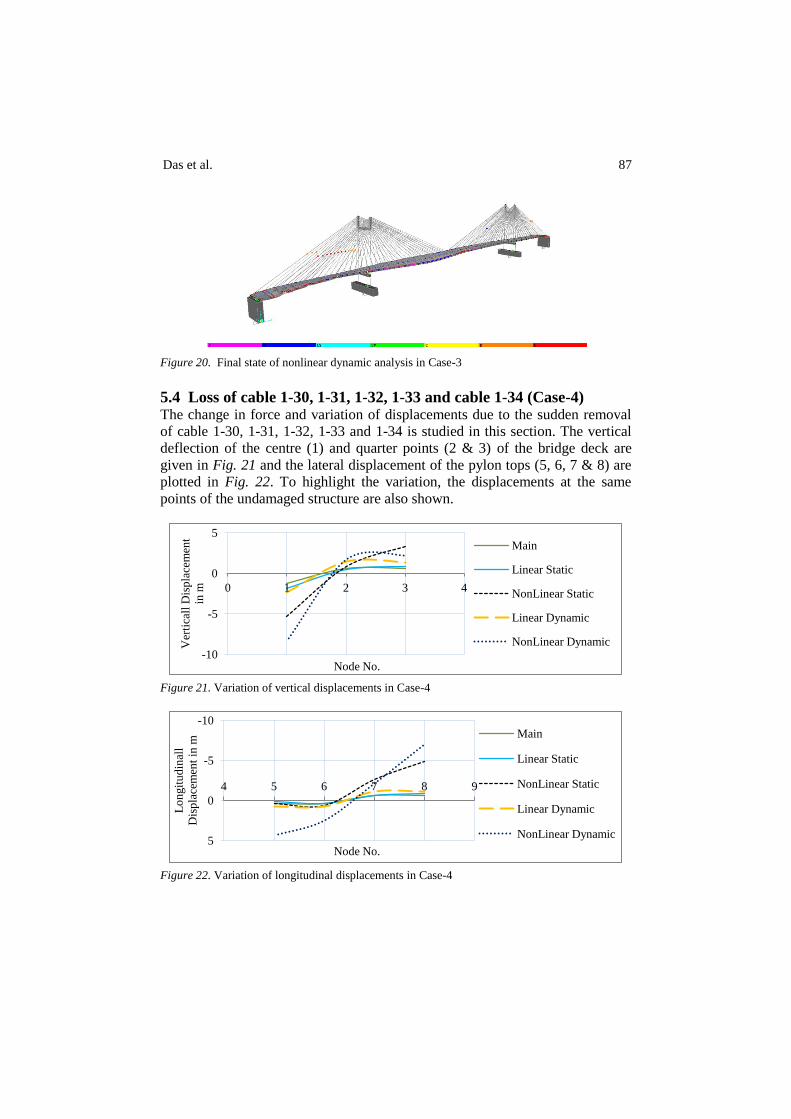
Fig. 19 and Fig. 20 show the final state of the model obtained from the
nonlinear static and dynamic procedure respectively, before total collapse of the
whole structure.
Figure 19. Final state of nonlinear static analysis in Case-3
-5000
0
5000
10000
15000
20000
0 2 4 6 8
Axia
l fo
rce
in k
N
Time in Secs
Frame 1-1
Frame 1-4
Frame 1-5
Frame 2-1
Das et al. 87
Figure 20. Final state of nonlinear dynamic analysis in Case-3
5.4 Loss of cable 1-30, 1-31, 1-32, 1-33 and cable 1-34 (Case-4) The change in force and variation of displacements due to the sudden removal
of cable 1-30, 1-31, 1-32, 1-33 and 1-34 is studied in this section. The vertical
deflection of the centre (1) and quarter points (2 & 3) of the bridge deck are
given in Fig. 21 and the lateral displacement of the pylon tops (5, 6, 7 & 8) are
plotted in Fig. 22. To highlight the variation, the displacements at the same
points of the undamaged structure are also shown.
Figure 21. Variation of vertical displacements in Case-4
Figure 22. Variation of longitudinal displacements in Case-4
-10
-5
0
5
0 1 2 3 4
Ver
tica
ll D
isp
lace
men
t
in m
Node No.
Main
Linear Static
NonLinear Static
Linear Dynamic
NonLinear Dynamic
-10
-5
0
5
4 5 6 7 8 9
Lo
ngit
ud
inal
l
Dis
pla
cem
ent
in m
Node No.
Main
Linear Static
NonLinear Static
Linear Dynamic
NonLinear Dynamic
88 Progressive collapse vulnerability of a cable stayed bridge
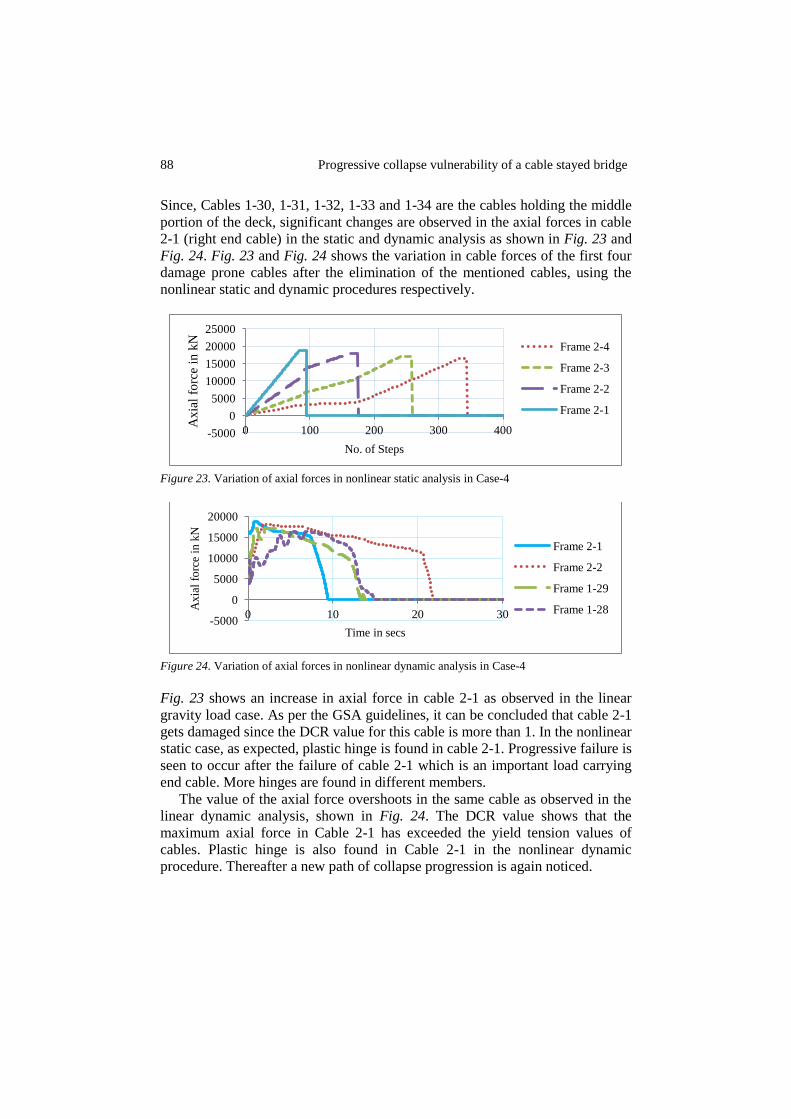
Since, Cables 1-30, 1-31, 1-32, 1-33 and 1-34 are the cables holding the middle
portion of the deck, significant changes are observed in the axial forces in cable
2-1 (right end cable) in the static and dynamic analysis as shown in Fig. 23 and
Fig. 24. Fig. 23 and Fig. 24 shows the variation in cable forces of the first four
damage prone cables after the elimination of the mentioned cables, using the
nonlinear static and dynamic procedures respectively.
Figure 23. Variation of axial forces in nonlinear static analysis in Case-4
Figure 24. Variation of axial forces in nonlinear dynamic analysis in Case-4
Fig. 23 shows an increase in axial force in cable 2-1 as observed in the linear
gravity load case. As per the GSA guidelines, it can be concluded that cable 2-1
gets damaged since the DCR value for this cable is more than 1. In the nonlinear
static case, as expected, plastic hinge is found in cable 2-1. Progressive failure is
seen to occur after the failure of cable 2-1 which is an important load carrying
end cable. More hinges are found in different members.
The value of the axial force overshoots in the same cable as observed in the
linear dynamic analysis, shown in Fig. 24. The DCR value shows that the
maximum axial force in Cable 2-1 has exceeded the yield tension values of
cables. Plastic hinge is also found in Cable 2-1 in the nonlinear dynamic
procedure. Thereafter a new path of collapse progression is again noticed.
-5000
0
5000
10000
15000
20000
25000
0 100 200 300 400
Axia
l fo
rce
in k
N
No. of Steps
Frame 2-4
Frame 2-3
Frame 2-2
Frame 2-1
-5000
0
5000
10000
15000
20000
0 10 20 30
Axia
l fo
rce
in k
N
Time in secs
Frame 2-1
Frame 2-2
Frame 1-29
Frame 1-28
Das et al. 89
5.5 Loss of cable 1-11, 1-12, 1-13, 1-14 and cable 1-15 (Case-5) In this section the behaviour of the bridge model is studied for initial failure of
cables 1-11, 1-12, 1-13, 1-14 and 1-15. It is clearly noticed from all the four
analysis procedures that the model remains in a safe situation after these five
cables rupture initially due to some accidental cause. All the axial forces in the
remaining cables are observed to stay within the yield limit. The girders are also
seen to be safe and no cracks have occurred in the bridge deck. So, further
investigation was done by failing more nearby cables and it was observed that
after an initial rupture of two more cables, cable 1-16 and 1-17, the model was
still safe in all the four analysis. When cables 1-9 and 1-8 were ruptured, a
collapse progression was observed to originate in the nonlinear dynamic
analysis. So, at least seven cables on the same side of the pylon are required to
fail to start a failure sequence. This is considered to be a very rare case and thus
ignored in this present study.
5.6 Discussion of results The mid part or the centre of the bridge deck undergoes maximum vertical
displacement and the top of the pylon are subjected to maximum transverse and
longitudinal displacements resulting due to high rotation developed due to its
self weight.
Axial stresses in the cables connecting the end of the deck with the top of the
pylons are very high under the self weight of the structural model. These are the
most important load carrying members in the model. Thus, failure of these end
cables increases the possibility to initiate the collapse progression throughout
the structure.
As the pylons are approached from either end of the model, a decrease in the
axial forces in cables is observed. Again a force increment is noticed as the
centre of the deck is reached, although it is lesser than the previous variation.
Also in the last failure case (Case-5) discussed in Section 5, it is noticed that, if
failure occurs in a cable near to the pylon, the possibility of progressive collapse
becomes less as the small amount of axial force incorporated with that cable(s)
before failure, easily gets redistributed among the other nearby cables.
The collapse progression determined from the nonlinear static and dynamic
cases follows a different pattern in each cable loss case. In the nonlinear static
case the sudden impact force due to a cable snap and the dynamic unloading of
a cable is ignored. The elimination of a cable leads to redistribution of axial
force carried by that particular cable initially, throughout the whole structure.
Whereas, in the dynamic analysis, the sudden push due to the dynamic
unloading of that cable also contributes, creating a whole new different pattern
of failure.
In the nonlinear static analysis a similar progressive collapse pattern for all
the cable loss cases is found. When a cable is eliminated from the bridge model

90 Progressive collapse vulnerability of a cable stayed bridge
and analysed, the bridge tries to get back to its symmetric configuration. For
example, when cable 1-1 and cable 1-2 are eliminated, the symmetrically
opposite cables 2-1 and 2-2 rupture in the first step. As the symmetry is reached,
cable 1-3 fails due to the stress reformation. Then again cable 2-3 fails. This
continues and after a certain step, cable 1-35 ruptures with cable 2-35 losing its
load carrying capacity in the next step.
In the nonlinear dynamic analysis a different failure behaviour is noticed for
all the cable loss cases. When a sudden push is generated on the anchorage
joints of the pylons and the deck due to the snapping of a cable, it creates an
extra deflection of both the elements, giving rise to an additional axial force in
the neighbouring cables. So, the bridge model does not get a chance to attain its
symmetric configuration. The nearby cables fail first and then one of the end
cables fail. For example, when cable 1-1 and cable 1-2 are assumed to fail at
first, cable 1-3 and cable 1-4 follows. Then cable 2-1 fails as axial tension
increases in the opposite side of the model. Again cables 1-5, 1-6, and 1-7 get
damaged due to the inertia effect of the pylons and the deck. Then Cable 2-2
fails due to stress redistribution. Thus, a new path of failure progression has
occurred.
In the proposed structure, the loss of one cable does not lead to a progressive
collapse in the nonlinear static case. However in the nonlinear dynamic case, the
whole structure fails as the dynamic amplification factors and sudden impact
forces participate with an important role. Thus, the conservative nature of a
static analysis procedure is concluded, as it cannot provide complete
information on structural response.
A definite concept behind the total collapse may also be derived. Due to the
sudden loss of the mentioned cables for each case, upright deformations start to
develop in the longitudinal girder of the damaged cable plane. The anchorage
joints of the initially ruptured cable(s) on the pylon and deck are pushed in the
opposite direction due to the unloading impact force and thus generate an extra
axial force in the nearby cables. Normal forces acting on this bridge girder gets
transferred to the longitudinal girder of the undamaged cable plane. These
girders can’t resist the additional normal forces and commence to buckle in the
vertical direction. So, vertical deformations grow strongly and can’t be stopped
since the bridge deck is not restrained by fix supports in the longitudinal
direction and thus, ultimate stresses exceeds in the bridge girder. The inertia
effect of the pylon and deck and the downward deflection of the longitudinal
girder of the intact cable plane finally caused the rupture of the nearby cable.
This continues in the vicinity till the structure tries to regain its symmetric
configuration and hence, an end cable fails in the other half of the bridge. The
whole phenomenon discussed is repeated and the girders in the middle of the
decks fail due to flexure. Forces get transferred to the pylons and they are pulled
towards the centre of the deck, causing the final break down of the entire bridge
structure.

Das et al. 91
6 CONCLUSIONS The centre of the bridge deck and the top of the pylons are the most critical
points of a cable stayed bridge. The end cables on either side of the bridge are
the most vulnerable. Failure in these end cables increases the probability of a
failure progression throughout the structure. Lesser the distance of the cable
from the pylon, lesser will be the chance of collapse of the whole structure. So,
strengthening of the end cables might offer better resistance against progressive
collapse. The dynamic procedure provides a completely different trend of
progressive collapse, compared to the static method. In the static procedure the
structure tries to reach for its symmetrical configuration, whereas, in the
dynamic study the impact force does not offer that much time. A nonlinear
static analysis alone is conservative in nature and thus to trace the failure
progression due to an initial failure of one or more cables, the nonlinear
dynamic analysis starting with the initial stressed state given by the nonlinear
static procedure is the best solution. A DAF of 2.0 is approximately justified by
comparing the deflection values obtained from the static and dynamic analysis
REFERRENCES [1] Starossek, U, “Progressive Collapse of Bridges – Aspects of Analysis and Design”,
International Symposium on Sea-Crossing Long-Span Bridges, Mokpo, Korea, 2006.
[2] Liu, Y, Han, B, Xiao, Ma, “Advances in Progressive Collapse of Bridge Structures”, Pacific
Science Review, Vol. 13, No. 3, pp. 173-181, 2011.
[3] Cai, JG, Xu, YX, Zhuang, LP, Feng, J, Zhang, J, “Comparison of various procedures for
progressive collapse analysis of cable-stayed bridges”, Journal of Zhejiang University-
Science A, Vol. 13, No. 5, pp. 323-334, 2012.
[4] Wolff, M, Starossek, U, “Cable-loss analysis and collapse behaviour of cable-stayed bridges”,
Proc. 5th International, Conference on Bridge Maintenance, Safety and Management,
(IABMAS2010), Philadelphia, USA, 2010.
[5] Das. R, “Progressive Collapse of a Cable Stayed Bridge”, M. Tech. Thesis, Department of
Earthquake Engineering, Indian Institute of Technology, Roorkee, India, 2015.
Received: June 30, 2015 Accepted: Aug. 31, 2015
Copyright © International Journal of Bridge Engineering