project 164
TRANSCRIPT
8/8/2019 Project 164
http://slidepdf.com/reader/full/project-164 1/60
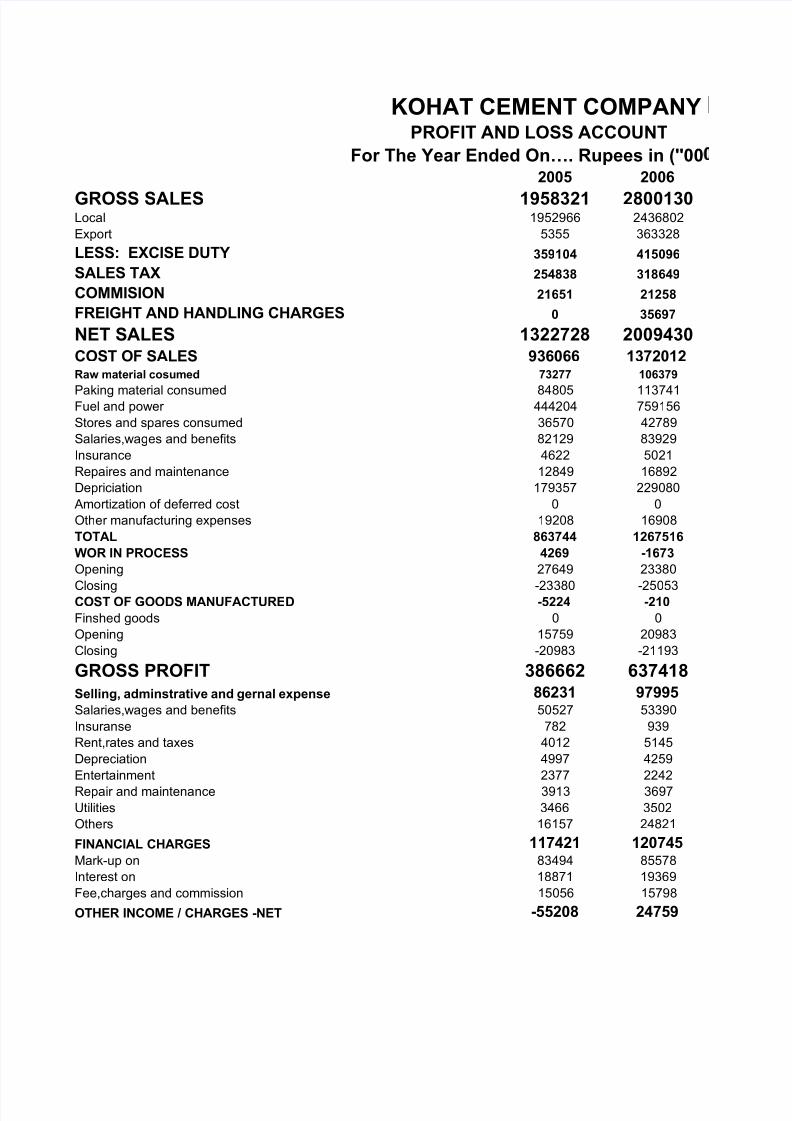
KOHAT CEMENT COMPANYPROFIT AND LOSS ACCOUNT
For The Year Ended On…. Rupees in (''002005 2006
GROSS SALES 1958321 2800130Local 1952966 2436802
Export 5355 363328
LESS: EXCISE DUTY 359104 415096
SALES TAX 254838 318649
COMMISION 21651 21258
FREIGHT AND HANDLING CHARGES 0 35697
NET SALES 1322728 2009430COST OF SALES 936066 1372012Raw material cosumed 73277 106379
Paking material consumed 84805 113741Fuel and power 444204 759156
Stores and spares consumed 36570 42789
Salaries,wages and benefits 82129 83929
Insurance 4622 5021
Repaires and maintenance 12849 16892
Depriciation 179357 229080
Amortization of deferred cost 0 0
Other manufacturing expenses 19208 16908
TOTAL 863744 1267516
WOR IN PROCESS 4269 -1673
Opening 27649 23380
Closing -23380 -25053COST OF GOODS MANUFACTURED -5224 -210
Finshed goods 0 0
Opening 15759 20983
Closing -20983 -21193
GROSS PROFIT 386662 637418
Selling, adminstrative and gernal expense 86231 97995Salaries,wages and benefits 50527 53390
Insuranse 782 939
Rent,rates and taxes 4012 5145
Depreciation 4997 4259
Entertainment 2377 2242
Repair and maintenance 3913 3697
Utilities 3466 3502
Others 16157 24821
FINANCIAL CHARGES 117421 120745Mark-up on 83494 85578
Interest on 18871 19369
Fee,charges and commission 15056 15798
OTHER INCOME / CHARGES -NET -55208 24759

8/8/2019 Project 164
http://slidepdf.com/reader/full/project-164 2/60
TOTAL 148444 243499
PROFIT / (LOSS) BEFORE TAXATION 238218 393919
TAXATION 186047 61830CURRENT -6695 11331
DEFERRED 192742 50499
PROFIT / (LOSS) AFTER TAXATION 424265 332089ACCUMULATED LOSS BROUGHT FORWARD -833393 0
ACCUMULATED LOSS CARRIED FORWARD -409128(RUPEES)
BASIC EARNINGS / (LOSS) PER SHARE 4.45
DILUTED EARNINGS /(LOSS) PER SHARE 3.79 2.33
8/8/2019 Project 164
http://slidepdf.com/reader/full/project-164 3/60
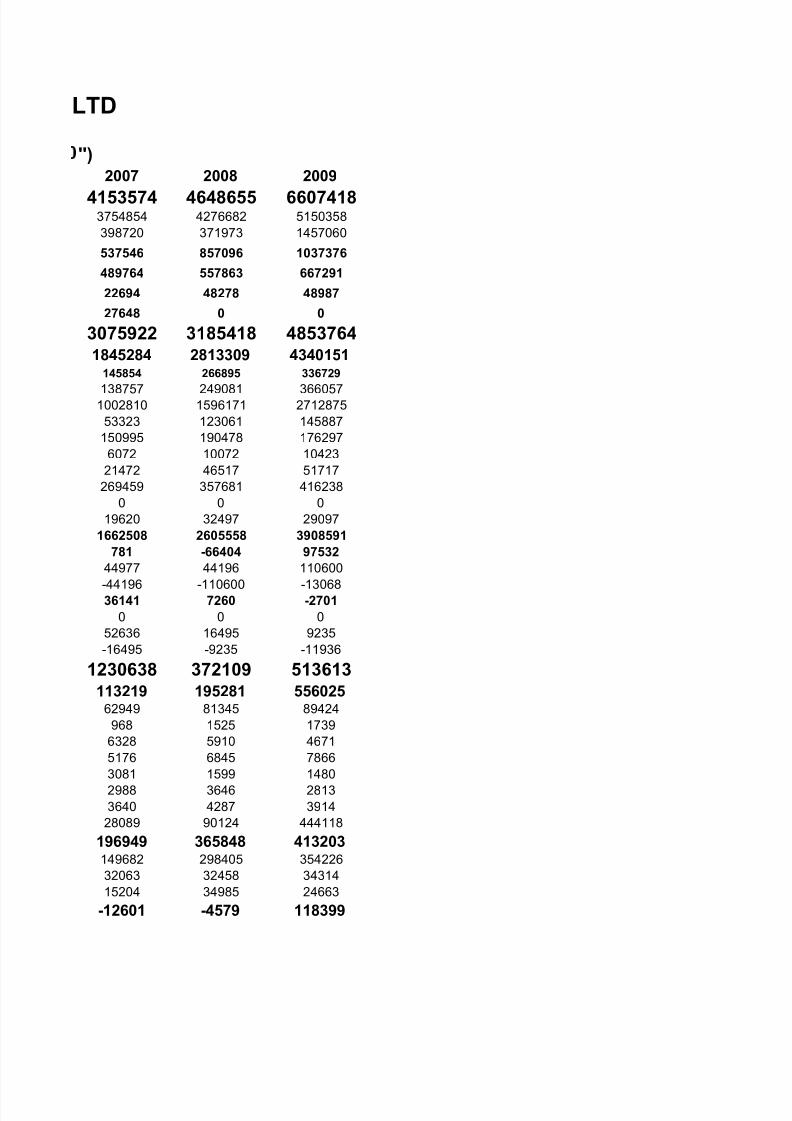
LTD
'')2007 2008 2009
4153574 4648655 66074183754854 4276682 5150358
398720 371973 1457060
537546 857096 1037376
489764 557863 667291
22694 48278 48987
27648 0 0
3075922 3185418 48537641845284 2813309 4340151
145854 266895 336729
138757 249081 3660571002810 1596171 2712875
53323 123061 145887
150995 190478 176297
6072 10072 10423
21472 46517 51717
269459 357681 416238
0 0 0
19620 32497 29097
1662508 2605558 3908591
781 -66404 97532
44977 44196 110600
-44196 -110600 -1306836141 7260 -2701
0 0 0
52636 16495 9235
-16495 -9235 -11936
1230638 372109 513613113219 195281 556025
62949 81345 89424
968 1525 1739
6328 5910 4671
5176 6845 7866
3081 1599 1480
2988 3646 2813
3640 4287 3914
28089 90124 444118
196949 365848 413203149682 298405 354226
32063 32458 34314
15204 34985 24663
-12601 -4579 118399
8/8/2019 Project 164
http://slidepdf.com/reader/full/project-164 4/60
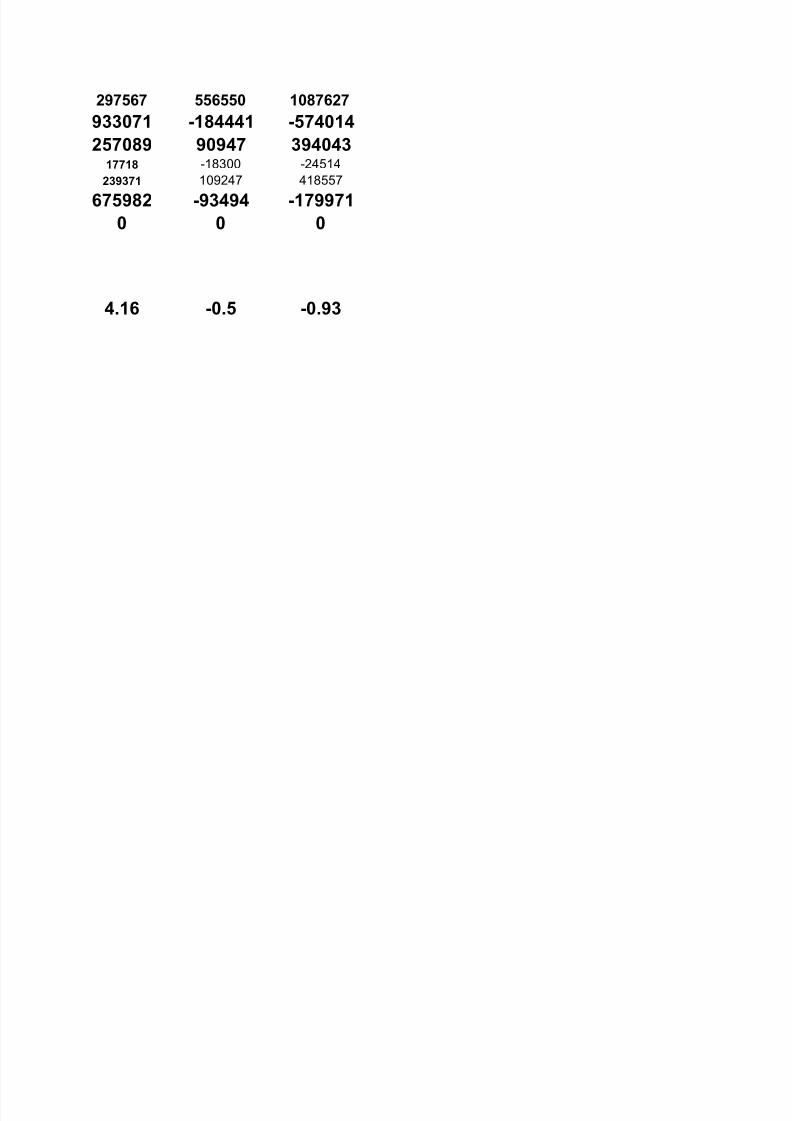
297567 556550 1087627
933071 -184441 -574014
257089 90947 39404317718 -18300 -24514
239371 109247 418557
675982 -93494 -1799710 0 0
4.16 -0.5 -0.93

8/8/2019 Project 164
http://slidepdf.com/reader/full/project-164 5/60
KOHAT CEMENT COMPANY LTBALANCE SHEET
AS ENDED ON DEC 31…… ( Rupees in '
2005 2006
CURRENT ASSETS 395013 462683Cash and Bank Balance 37199 17529
Current accounts 36890 16970
Deposit accounts 66 54
Cash in hand 243 505
Others 0 0
Stock in trade 50809 56825
Raw material 2757 3433
Packing material 3689 7146
Work in process 23380 25053
Finished goods 20983 21193
Trade Debts 24712 18944
loans,Deposits,Payments, 27413 82266Loans-unsecured,considerd goods 1309 1265Advances-Unsecured 22651 72633
Executives 2283 1857
Employees 1214 2417
Suppliers and Contractors 1130 13839
Excise Duty 4759 42274
tax-net 13265 12246
Deposit's 772 600
Prepayments 2080 1235
Other recievables 601 6533
Stores,spares andloose tools 254880 287119
Stores 94968 70520Spares 118020 209898
Loose tools 2044 2590
Spares in transit 39848 4111
NONE CURRENT ASSETS 3879637 6425232
Tangible fixed assets 3657284 6381731
Operating fixed assets 3572688 4398164
Capital work in process 84596 1983567
Long term loans 5956 6718
Long term deoposits 23655 36783
Utilities 12480 12480
Leasing companies 10349 23150
Others 826 1153Deferred tax asset-net 192742 0
available tax losses 523672 0
tax depreciation -356183 0
retirement benefits 19749 0
others 5504 0
TOTAL ASSETSCURRENT LIABILITIES 383121 989539

8/8/2019 Project 164
http://slidepdf.com/reader/full/project-164 6/60
Current maturities of redeemable 189058 63695
capital and loans
Redeemable capital 10160 63695
Foreign Currency Loans 146277 0
Local Currency loans 32621 0
Current portion of liabilities against assets subject to finance le 6189 13114
Creditors,accrued and other liabilities 185969 912730Creditors 26298 488772
accrued expense 22069 74993
Other liabilities 137602 348965
Unclaimed divedend 1905 0
NON-CURRENT LIABILITIES 3346286 3647953
Redeemable Capital 185923 418021
long term loans 196083 418021
current maturity under liabilities -10160 0
Long Term Loans 1911662 1973151
foreign cuurency loans 907554 871651
local currency loans 1183006 1165195
current portion shown under current liabilities -178898 -63695
Deferred Liabilities 1236845 975490
Liabilities Against Assets Suject To Finance Lease 9536 274644
Long term deoposits 2320 6647
From distributers 1000 640
From suppliers 657 1000
From employees 663 5007
CONTINGENCIES AND COMMITMENTS 0 0
SHARE CAPITAL AND RESERVES 545243 1547466
Authorized Capital 2500000 2500000
200000000 ordinary shares @ Rs.10/- 2000000 2000000
50000000 preference shares @ Rs.10/- 500000 500000Issued, Subscribed And Paid-up 954371 1547466
Capital
ordinary shares @Rs.10/-each fully 0 0
paid in cash
Accumulated Loss -409128 0
DEFERRED INCOME 0 702957
Liabilities 3729407 5340449
TOTAL LIABILTIE & equity 4274650 6887915

8/8/2019 Project 164
http://slidepdf.com/reader/full/project-164 7/60
000')
2007 2008 2009
617732 966292 787308104752 305492 139183
70684 304661 76103
54 54 54
1167 777 768
32847 0 62258
96757 150294 68691
23609 16480 7936
12457 13978 35751
44196 110600 13068
16495 9236 11936
12490 29717 40124
27875 64203 1121171514 1612 145723055 59371 72315
1747 1385 2607
2572 2915 2059
4203 18717 56925
3634 32847 0
10899 3507 10724
600 2350 18490
950 641 227
1756 229 19628
375858 416586 427193
105450 112886 126543248642 282275 276506
13233 14371 8404
8533 7054 15740
7787264 7644205 9685281
7683391 7510640 9570865
7075726 7509855 9508720
607665 785 62145
5064 7248 6415
98809 126317 108001
35730 35730 35741
61766 89267 70977
1313 1320 12830 0 0
0 0 0
0 0 0
0 0 0
0 0 0
1398304 2073259 2987709

8/8/2019 Project 164
http://slidepdf.com/reader/full/project-164 8/60
354170 99720 378836
354170 0 0
0 0 0
0 99720 378836
133585 0 0
910549 1973539 2608873298260 283428 29594
42463 72176 110932
569826 1617935 2468347
0 0 0
4080287 3866811 2939564
945660 144100 91965
945660 144100 91965
0 0 0
1812063 2293709 1701777
818255 674802 771469
1347978 2190993 1898619
-354170 -572086 -968311
862867 937178 906186
454070 486577 237795
5627 5247 1841
220 600 300
400 635 316
5007 4012 1225
0 0 0
2926405 2670427 4545316
2500000 2500000 2500000
2000000 2000000 2000000
500000 500000 5000001624839 1698148 1995324
0 0 0
0 0 0
1301566 972279 2549992
5478591 5940070 5927273
8404996 8610497 10472589

8/8/2019 Project 164
http://slidepdf.com/reader/full/project-164 9/60
KOHAT CEMENT COMPANY LTDProfit And Loss Account
For The Year Ended On…. Rupees in (''000'')
Trend Analysis
2005 2006 2007
GROSS SALES 100 143 212
Local 100 125 192
Export 100 6785 7446
LESS: EXCISE DUTY 100 116 150
SALES TAX 100 125 192
COMMISION 100 98 105
FREIGHT AND HANDLING CHARGES 0 0 0
NET SALES 100 152 233
COST OF SALES 100 147 197Raw material cosumed 100 145 199
Paking material consumed 100 134 164
Fuel and power 100 171 226
Stores and spares consumed 100 117 146
Salaries,wages and benefits 100 102 184
Insurance 100 109 131
Repaires and maintenance 100 131 167
Depriciation 100 128 150
Amortization of deferred cost 0 0 0
Other manufacturing expenses 100 88 102
TOTAL 100 147 192
WOR IN PROCESS 100 -39 18Opening 100 85 163
Closing 100 107 189
COST OF GOODS MANUFACTURED 100 4 -692
Finshed goods 0 0 0
Opening 100 133 334
Closing 100 101 79
GROSS PROFIT 100 165 318
Selling, adminstrative and gernal expense 100 114 131
Salaries,wages and benefits 100 106 125
Insuranse 100 120 124
Rent,rates and taxes 100 128 158
Depreciation 100 85 104
Entertainment 100 94 130
Repair and maintenance 100 94 76
Utilities 100 101 105
Others 100 154 174
FINANCIAL CHARGES 100 103 168

8/8/2019 Project 164
http://slidepdf.com/reader/full/project-164 10/60
Mark-up on 100 102 179
Interest on 100 103 170
Fee,charges and commission 100 105 101
OTHER INCOME / CHARGES -NET 100 -45 23
TOTAL 100 164 200
PROFIT / (LOSS) BEFORE TAXATION 100 165 392TAXATION 100 33 138
CURRENT 100 -169 -265
DEFERRED 100 26 124
PROFIT / (LOSS) AFTER TAXATION 100 78 159
ACCUMULATED LOSS BROUGHT FORWARD 100 0 0
ACCUMULATED LOSS CARRIED FORWARD 100 0 0
BASIC EARNINGS / (LOSS) PER SHARE 100 0 0
DILUTED EARNINGS /(LOSS) PER SHARE 100 61 110

8/8/2019 Project 164
http://slidepdf.com/reader/full/project-164 11/60
2008 2009
237 337
219 264
6946 27209
239 289
219 262
223 226
0 0
241 367
301 464364 460
294 432
359 611
337 399
232 215
218 226
362 402
199 232
0 0
169 151
302 453
-1555 2285160 400
473 56
-139 52
0 0
105 59
44 57
96 133
226 645
161 177
195 222
147 116
137 157
67 62
93 72
124 113
558 2749
312 352
8/8/2019 Project 164
http://slidepdf.com/reader/full/project-164 12/60
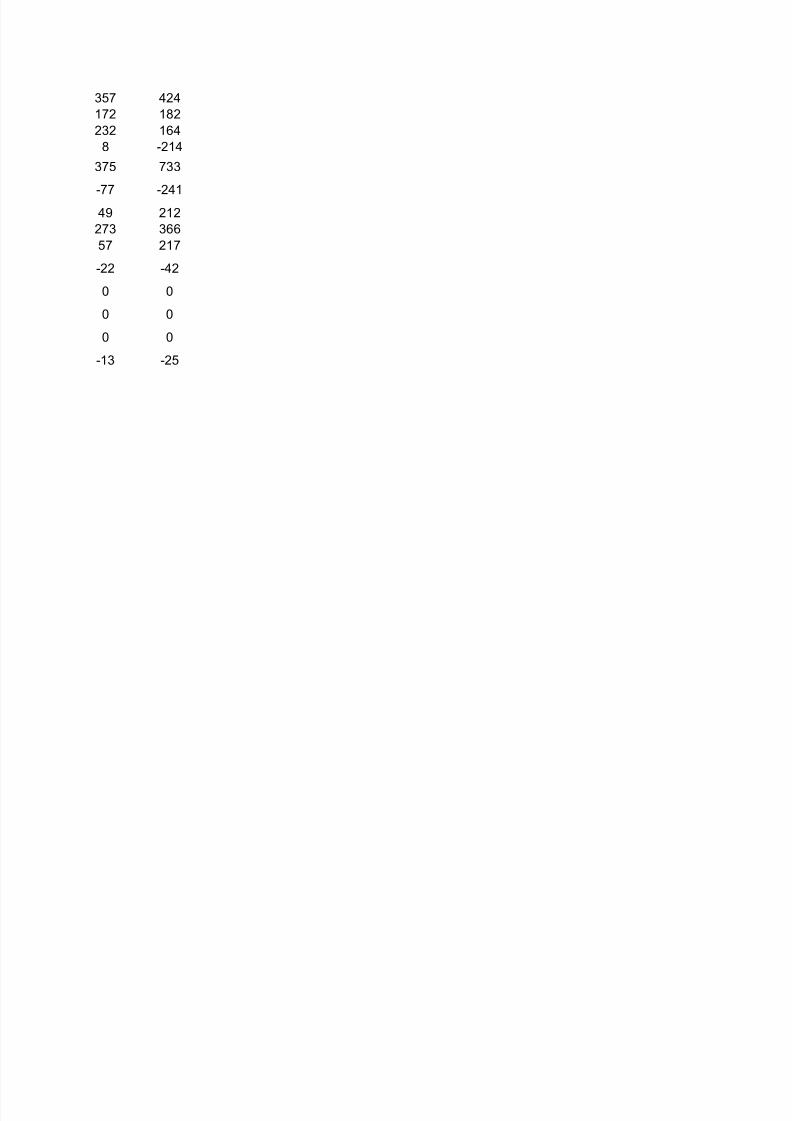
357 424
172 182
232 164
8 -214
375 733
-77 -24149 212
273 366
57 217
-22 -42
0 0
0 0
0 0
-13 -25
8/8/2019 Project 164
http://slidepdf.com/reader/full/project-164 13/60
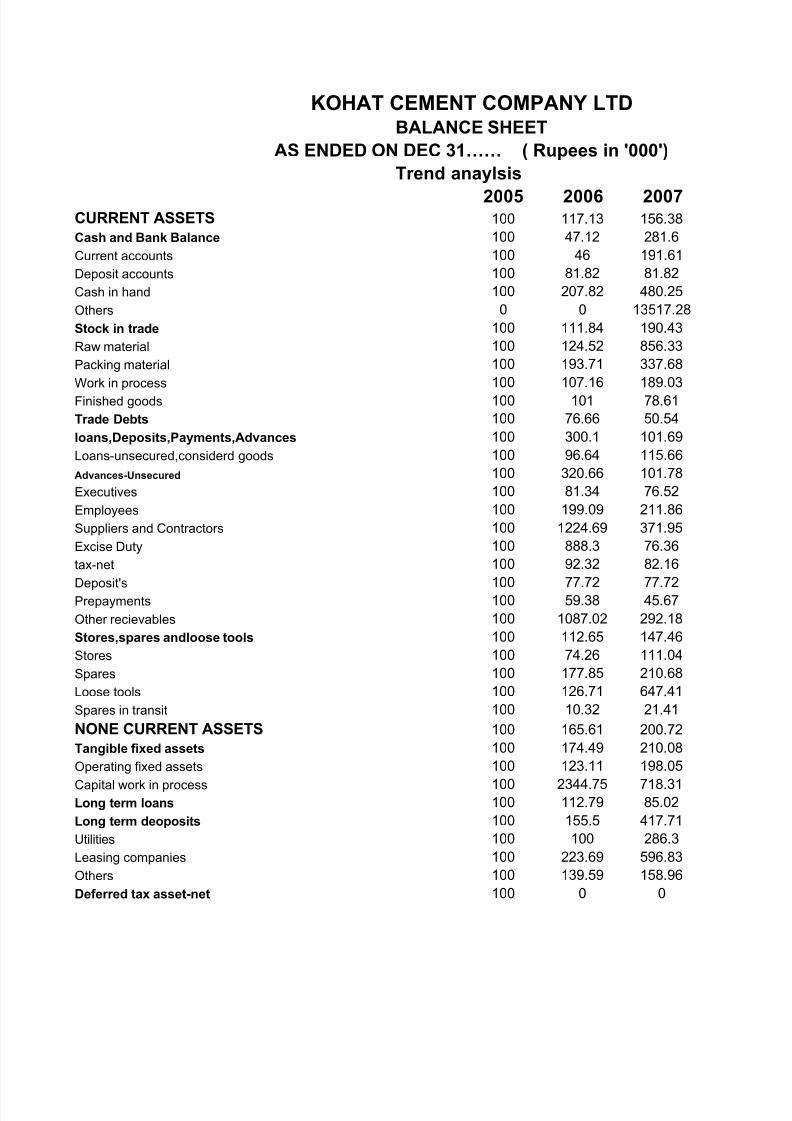
KOHAT CEMENT COMPANY LTDBALANCE SHEET
AS ENDED ON DEC 31…… ( Rupees in '000')
Trend anaylsis
2005 2006 2007CURRENT ASSETS 100 117.13 156.38
Cash and Bank Balance 100 47.12 281.6
Current accounts 100 46 191.61
Deposit accounts 100 81.82 81.82
Cash in hand 100 207.82 480.25
Others 0 0 13517.28
Stock in trade 100 111.84 190.43
Raw material 100 124.52 856.33
Packing material 100 193.71 337.68
Work in process 100 107.16 189.03
Finished goods 100 101 78.61
Trade Debts 100 76.66 50.54
loans,Deposits,Payments,Advances 100 300.1 101.69
Loans-unsecured,considerd goods 100 96.64 115.66
Advances-Unsecured 100 320.66 101.78
Executives 100 81.34 76.52
Employees 100 199.09 211.86
Suppliers and Contractors 100 1224.69 371.95
Excise Duty 100 888.3 76.36
tax-net 100 92.32 82.16
Deposit's 100 77.72 77.72Prepayments 100 59.38 45.67
Other recievables 100 1087.02 292.18
Stores,spares andloose tools 100 112.65 147.46
Stores 100 74.26 111.04
Spares 100 177.85 210.68
Loose tools 100 126.71 647.41
Spares in transit 100 10.32 21.41
NONE CURRENT ASSETS 100 165.61 200.72
Tangible fixed assets 100 174.49 210.08
Operating fixed assets 100 123.11 198.05
Capital work in process 100 2344.75 718.31Long term loans 100 112.79 85.02
Long term deoposits 100 155.5 417.71
Utilities 100 100 286.3
Leasing companies 100 223.69 596.83
Others 100 139.59 158.96
Deferred tax asset-net 100 0 0

8/8/2019 Project 164
http://slidepdf.com/reader/full/project-164 14/60
available tax losses 100 0 0
tax depreciation 100 0 0
retiement benefits 100 0 0
others 100 0 0
TOTAL ASSETS 100 161.13 196.62
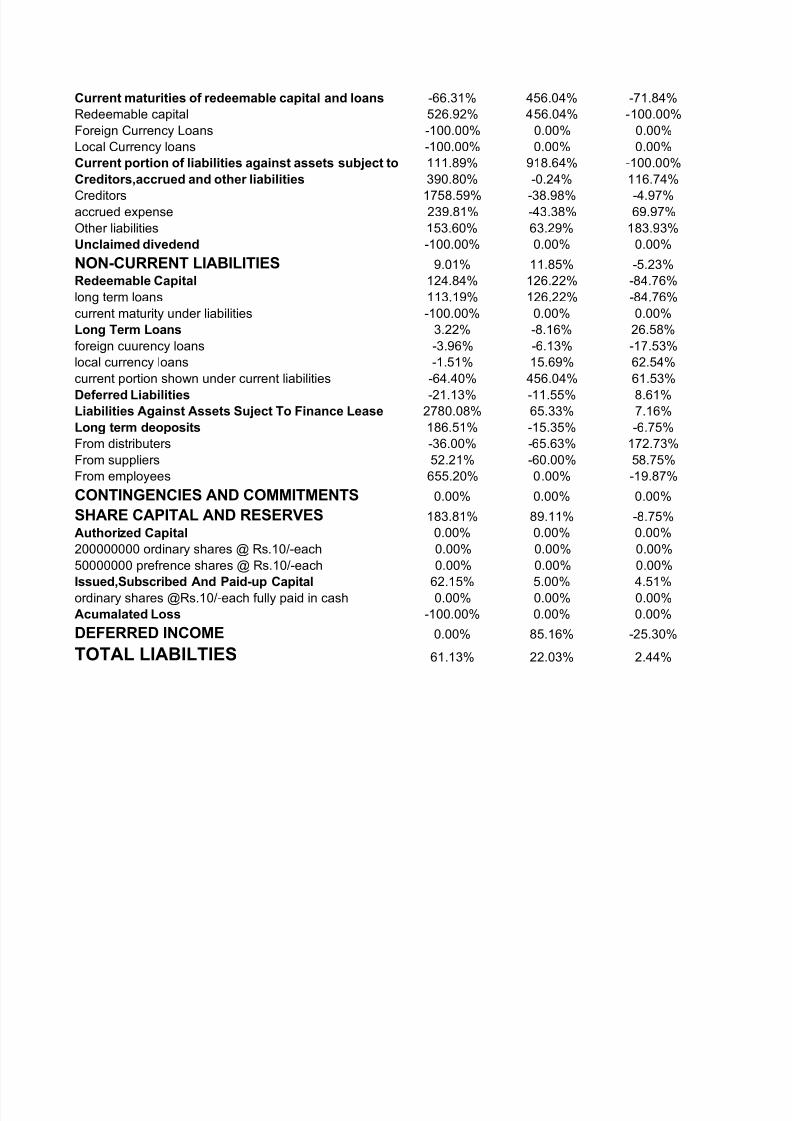
CURRENT LIABILITIES 100 258.28 364.98Current maturities of redeemable capital and loans 100 33.69 187.33
Redeemable capital 100 626.92 3485.93
Foreign Currency Loans 100 0 0
Local Currency loans 100 0 0
Current portion of liabilities against assets subject to finance le 100 211.89 2158.43
Creditors,accrued and other liabilities 100 490.8 489.62
Creditors 100 1858.59 1134.15
accrued expense 100 339.81 192.41
Other liabilities 100 253.6 414.11
Unclaimed divedend 100 0 0
NON-CURRENT LIABILITIES 100 109.01 121.93
Redeemable Capital 100 224.84 508.63
long term loans 100 213.19 482.28
current maturity under liabilities 100 0 0
Long Term Loans 100 103.22 94.79
foreign cuurency loans 100 96.04 90.16
local currency loans 100 98.49 113.95
current portion shown under current liabilities 100 35.6 197.97
Deferred Liabilities 100 78.87 69.76
Liabilities Against Assets Suject To Finance Lease 100 2880.08 4761.64
Long term deoposits 100 286.51 242.54From distributers 100 64 22
From suppliers 100 152.21 60.88
From employees 100 755.2 755.2
CONTINGENCIES AND COMMITMENTS 0 0 0
SHARE CAPITAL AND RESERVES 100 283.81 536.72
Authorized Capital 100 100 100
200000000 ordinary shares @ Rs.10/-each 100 100 100
50000000 prefrence shares @ Rs.10/-each 100 100 100
Issued,Subscribed And Paid-up Capital 100 162.15 170.25
ordinary shares @Rs.10/-each fully paid in cash 0 0 0
Acumalated Loss 100 0 0DEFERRED INCOME 0 0 0
TOTAL LIABILTIES 100 161.13 196.62

8/8/2019 Project 164
http://slidepdf.com/reader/full/project-164 15/60
2008 2009244.62 199.31
821.24 374.16
825.86 206.3
81.82 81.82
319.75 316.05
0 25620.58
295.8 135.19
597.75 287.85
378.91 969.12
473.05 55.89
44.02 56.88
120.25 162.37
234.21 408.99
123.15 111.31
262.11 319.26
60.67 114.19
240.12 169.6
1656.37 5037.61
690.21 0
26.44 80.84
304.4 2395.0830.82 10.91
38.1 3265.89
163.44 167.61
118.87 133.25
239.18 234.29
703.08 411.15
17.7 39.5
197.03 249.64
205.36 261.69
210.2 266.15
0.93 73.46121.69 107.71
534 456.57
286.3 286.39
862.57 685.83
159.81 155.33
0 0

8/8/2019 Project 164
http://slidepdf.com/reader/full/project-164 16/60
0 0
0 0
0 0
0 0
201.43 244.99
541.15 779.8352.75 200.38
0 0
0 0
305.69 1161.33
0 0
1061.22 1402.85
1077.75 112.53
327.05 502.66
1175.81 1793.83
0 0
115.56 87.85
77.51 49.46
73.49 46.9
0 0
119.99 89.02
74.35 85.01
185.21 160.49
319.78 541.26
75.77 73.27
5102.53 2493.66
226.16 79.3560 30
96.65 48.1
605.13 184.77
0 0
489.77 833.63
100 100
100 100
100 100
177.93 209.07
0 0
0 00 0
201.43 244.99
8/8/2019 Project 164
http://slidepdf.com/reader/full/project-164 17/60
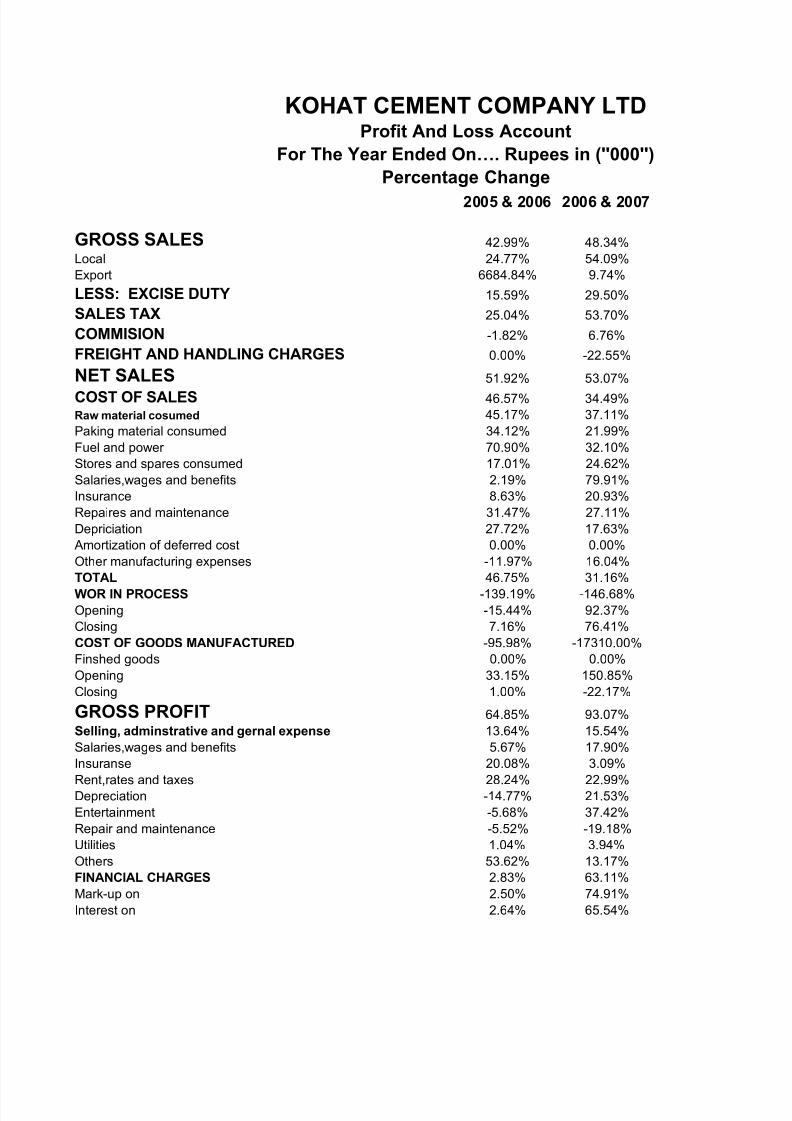
KOHAT CEMENT COMPANY LTDProfit And Loss Account
For The Year Ended On…. Rupees in (''000'')
Percentage Change
2005 & 2006 2006 & 2007
GROSS SALES 42.99% 48.34%
Local 24.77% 54.09%
Export 6684.84% 9.74%
LESS: EXCISE DUTY 15.59% 29.50%
SALES TAX 25.04% 53.70%
COMMISION -1.82% 6.76%
FREIGHT AND HANDLING CHARGES 0.00% -22.55%
NET SALES 51.92% 53.07%
COST OF SALES 46.57% 34.49%
Raw material cosumed 45.17% 37.11%
Paking material consumed 34.12% 21.99%
Fuel and power 70.90% 32.10%
Stores and spares consumed 17.01% 24.62%
Salaries,wages and benefits 2.19% 79.91%
Insurance 8.63% 20.93%
Repaires and maintenance 31.47% 27.11%
Depriciation 27.72% 17.63%
Amortization of deferred cost 0.00% 0.00%
Other manufacturing expenses -11.97% 16.04%
TOTAL 46.75% 31.16%
WOR IN PROCESS -139.19% -146.68%
Opening -15.44% 92.37%
Closing 7.16% 76.41%
COST OF GOODS MANUFACTURED -95.98% -17310.00%
Finshed goods 0.00% 0.00%
Opening 33.15% 150.85%
Closing 1.00% -22.17%
GROSS PROFIT 64.85% 93.07%
Selling, adminstrative and gernal expense 13.64% 15.54%
Salaries,wages and benefits 5.67% 17.90%
Insuranse 20.08% 3.09%
Rent,rates and taxes 28.24% 22.99%Depreciation -14.77% 21.53%
Entertainment -5.68% 37.42%
Repair and maintenance -5.52% -19.18%
Utilities 1.04% 3.94%
Others 53.62% 13.17%
FINANCIAL CHARGES 2.83% 63.11%
Mark-up on 2.50% 74.91%
Interest on 2.64% 65.54%

8/8/2019 Project 164
http://slidepdf.com/reader/full/project-164 18/60
Fee,charges and commission 4.93% -3.76%
OTHER INCOME / CHARGES -NET -144.85% -150.89%
TOTAL 64.03% 22.20%
PROFIT / (LOSS) BEFORE TAXATION 65.36% 136.87%
TAXATION -66.77% 315.80%
CURRENT -269.25% 56.37%DEFERRED -73.80% 374.01%
PROFIT / (LOSS) AFTER TAXATION -21.73% 103.55%
ACCUMULATED LOSS BROUGHT FORWAR -100.00% 0.00%
ACCUMULATED LOSS CARRIED FORWARD -100.00% 0.00%
BASIC EARNINGS / (LOSS) PER SHARE -100.00%
DILUTED EARNINGS /(LOSS) PER SHARE -38.52% 78.54%

8/8/2019 Project 164
http://slidepdf.com/reader/full/project-164 19/60
2007 & 2008 2008 & 2009
11.92% 42.14%
13.90% 20.43%
-6.71% 291.71%
59.45% 21.03%
13.90% 19.62%
112.73% 1.47%
-100.00% 0.00%
3.56% 52.37%
52.46% 54.27%
82.99% 26.17%
79.51% 46.96%
59.17% 69.96%
130.78% 18.55%
26.15% -7.44%
65.88% 3.48%
116.64% 11.18%
32.74% 16.37%
0.00% 0.00%
65.63% -10.46%
56.72% 50.01%
-8602.43% -246.88%
-1.74% 150.25%
150.25% -88.18%
-79.91% -137.20%
0.00% 0.00%
-68.66% -44.01%
-44.01% 29.25%
-69.76% 38.03%
72.48% 184.73%
29.22% 9.93%
57.54% 14.03%
-6.61% -20.96%32.24% 14.92%
-48.10% -7.44%
22.02% -22.85%
17.77% -8.70%
220.85% 392.79%
85.76% 12.94%
99.36% 18.71%
1.23% 5.72%
8/8/2019 Project 164
http://slidepdf.com/reader/full/project-164 20/60
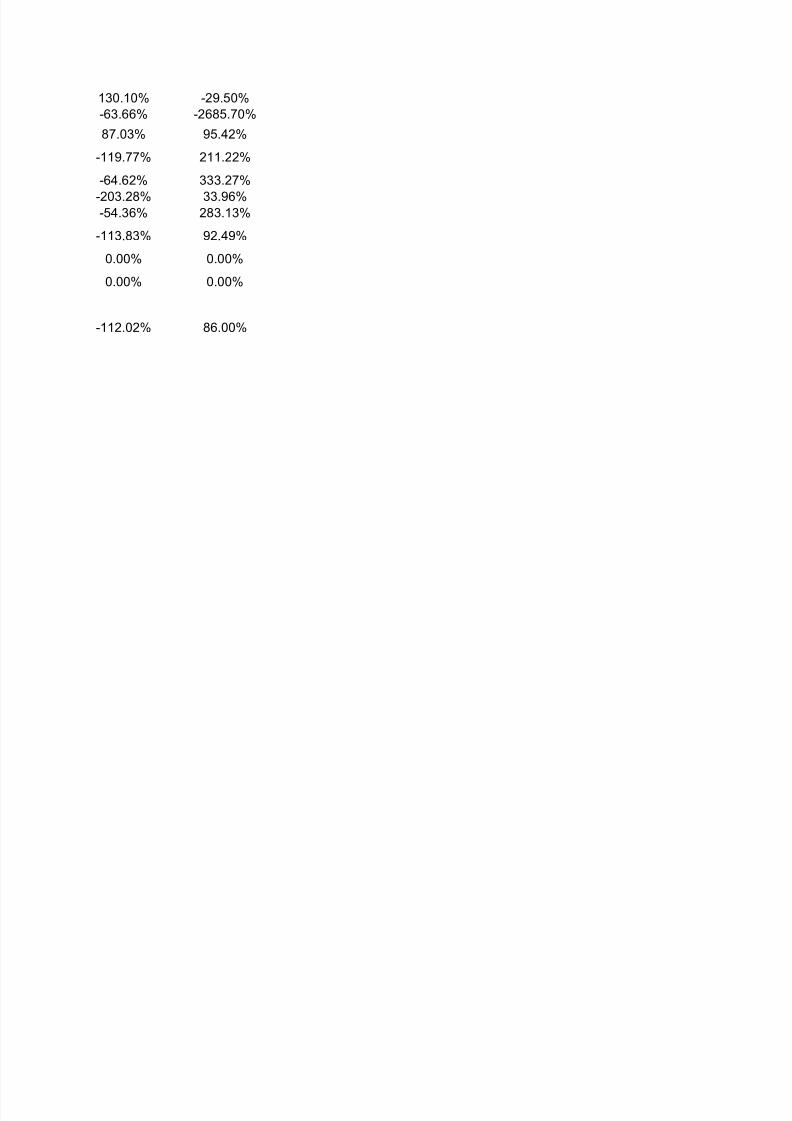
130.10% -29.50%
-63.66% -2685.70%
87.03% 95.42%
-119.77% 211.22%
-64.62% 333.27%
-203.28% 33.96%-54.36% 283.13%
-113.83% 92.49%
0.00% 0.00%
0.00% 0.00%
-112.02% 86.00%
8/8/2019 Project 164
http://slidepdf.com/reader/full/project-164 21/60
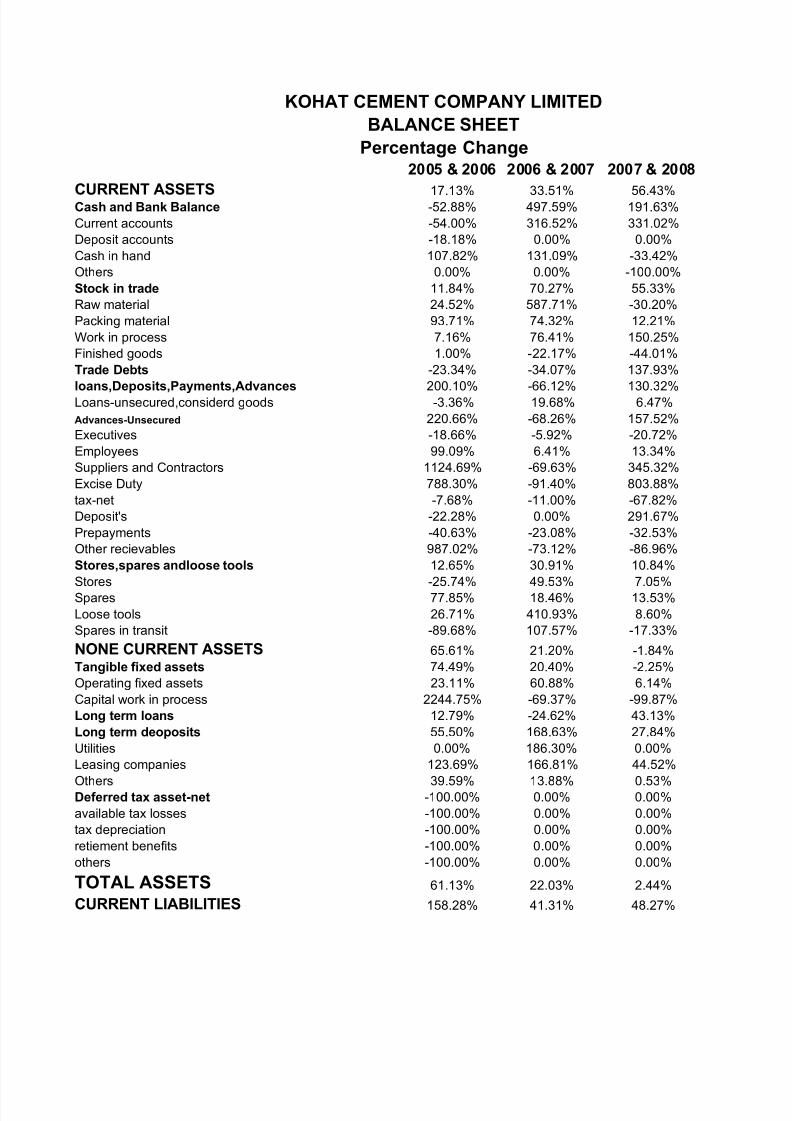
KOHAT CEMENT COMPANY LIMITED
BALANCE SHEET
Percentage Change2005 & 2006 2006 & 2007 2007 & 2008
CURRENT ASSETS 17.13% 33.51% 56.43%Cash and Bank Balance -52.88% 497.59% 191.63%
Current accounts -54.00% 316.52% 331.02%
Deposit accounts -18.18% 0.00% 0.00%
Cash in hand 107.82% 131.09% -33.42%
Others 0.00% 0.00% -100.00%
Stock in trade 11.84% 70.27% 55.33%
Raw material 24.52% 587.71% -30.20%
Packing material 93.71% 74.32% 12.21%
Work in process 7.16% 76.41% 150.25%
Finished goods 1.00% -22.17% -44.01%
Trade Debts -23.34% -34.07% 137.93%
loans,Deposits,Payments,Advances 200.10% -66.12% 130.32%Loans-unsecured,considerd goods -3.36% 19.68% 6.47%
Advances-Unsecured 220.66% -68.26% 157.52%
Executives -18.66% -5.92% -20.72%
Employees 99.09% 6.41% 13.34%
Suppliers and Contractors 1124.69% -69.63% 345.32%
Excise Duty 788.30% -91.40% 803.88%
tax-net -7.68% -11.00% -67.82%
Deposit's -22.28% 0.00% 291.67%
Prepayments -40.63% -23.08% -32.53%
Other recievables 987.02% -73.12% -86.96%
Stores,spares andloose tools 12.65% 30.91% 10.84%
Stores -25.74% 49.53% 7.05%Spares 77.85% 18.46% 13.53%
Loose tools 26.71% 410.93% 8.60%
Spares in transit -89.68% 107.57% -17.33%
NONE CURRENT ASSETS 65.61% 21.20% -1.84%
Tangible fixed assets 74.49% 20.40% -2.25%
Operating fixed assets 23.11% 60.88% 6.14%
Capital work in process 2244.75% -69.37% -99.87%
Long term loans 12.79% -24.62% 43.13%
Long term deoposits 55.50% 168.63% 27.84%
Utilities 0.00% 186.30% 0.00%
Leasing companies 123.69% 166.81% 44.52%
Others 39.59% 13.88% 0.53%Deferred tax asset-net -100.00% 0.00% 0.00%
available tax losses -100.00% 0.00% 0.00%
tax depreciation -100.00% 0.00% 0.00%
retiement benefits -100.00% 0.00% 0.00%
others -100.00% 0.00% 0.00%
TOTAL ASSETS 61.13% 22.03% 2.44%
CURRENT LIABILITIES 158.28% 41.31% 48.27%
8/8/2019 Project 164
http://slidepdf.com/reader/full/project-164 22/60

8/8/2019 Project 164
http://slidepdf.com/reader/full/project-164 23/60
2008 & 2009
-18.52%-54.44%
-75.02%
0.00%
-1.16%
0.00%
-54.30%
-51.84%
155.77%
-88.18%
29.23%
35.02%
74.63%-9.62%
21.80%
88.23%
-29.37%
204.14%
-100.00%
205.79%
686.81%
-64.59%
8471.18%
2.55%
12.10%-2.04%
-41.52%
123.14%
26.70%
27.43%
26.62%
7816.56%
-11.49%
-14.50%
0.03%
-20.49%
-2.80%0.00%
0.00%
0.00%
0.00%
0.00%
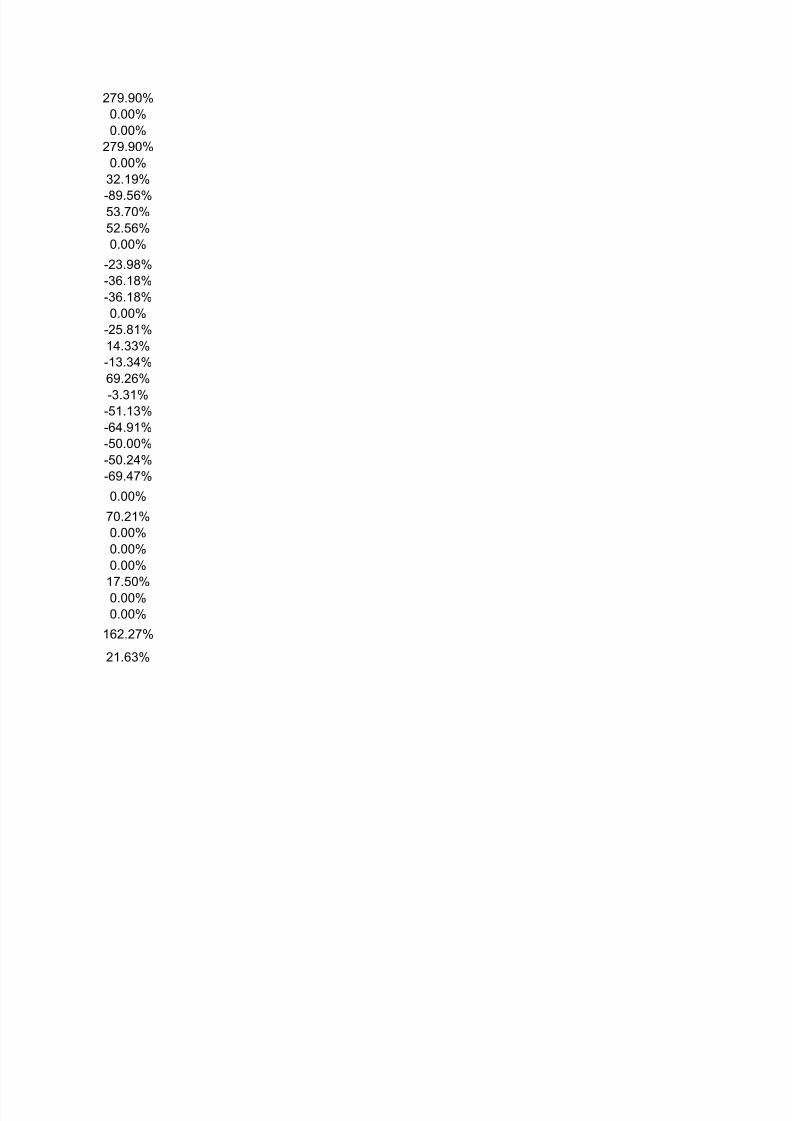
21.63%
44.11%
8/8/2019 Project 164
http://slidepdf.com/reader/full/project-164 24/60
279.90%
0.00%
0.00%
279.90%
0.00%
32.19%
-89.56%53.70%
52.56%
0.00%
-23.98%
-36.18%
-36.18%
0.00%
-25.81%
14.33%
-13.34%
69.26%
-3.31%-51.13%
-64.91%
-50.00%
-50.24%
-69.47%
0.00%
70.21%
0.00%
0.00%
0.00%
17.50%0.00%
0.00%
162.27%
21.63%

8/8/2019 Project 164
http://slidepdf.com/reader/full/project-164 25/60
KOHAT CEMENT COMPANY LTD
Ratio analysis
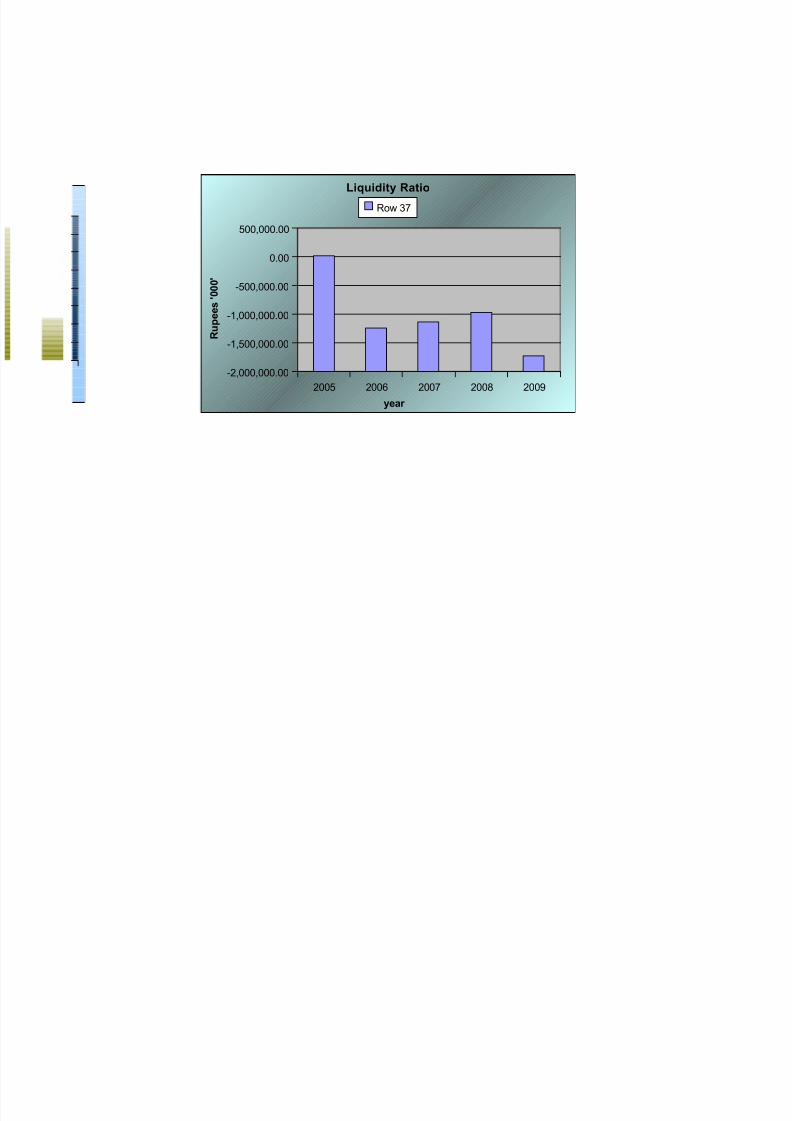
2005 2006 2007 2008 2009net working capital 11892 -526856 -780572 -1106967 -2200401
current ratio 1.03 0.47 0.44 0.47 0.26
acid ratio 0.9 0.41 0.37 0.39 0.24Cash Ratio 0.1 0.02 0.07 0.15 0.05
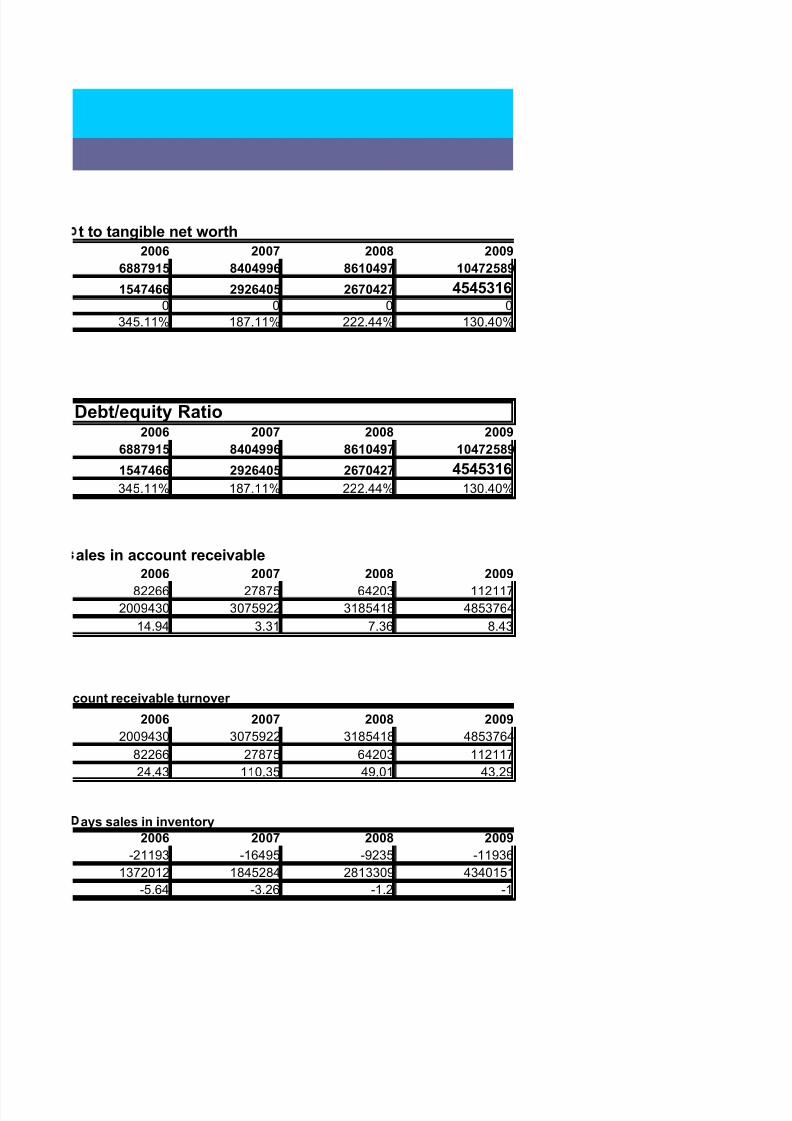
Debt/Equity Ratio 683.99% 345.11% 187.21% 222.44% 130.40%
Debt to Tangible Net worth 683.99% 345.11% 187.21% 222.44% 130.40%
Day's sales in account Receivable 7.56 14.94 3.31 7.36 8.43
Account Receivable turnover 48.25 24.43 110.35 49.61 43.29
Day's sales in inventory -8.18 -5.64 -3.26 -1.2 -1
Inventory turnover 18.42 24.14 19.07 18.72 63.18
Net profit margin 32.07% 16.53% 21.98% -2.94% -3.71%
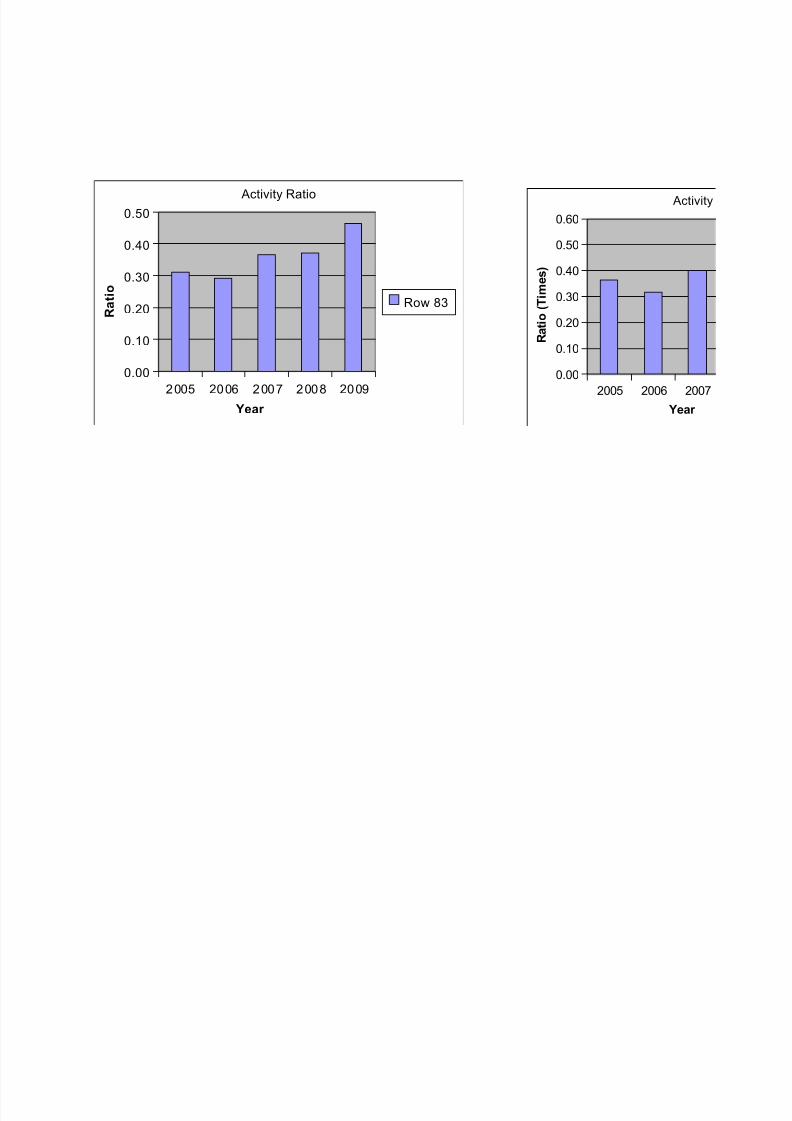
Total assets turnover 0.31 0.29 0.37 0.37 0.46
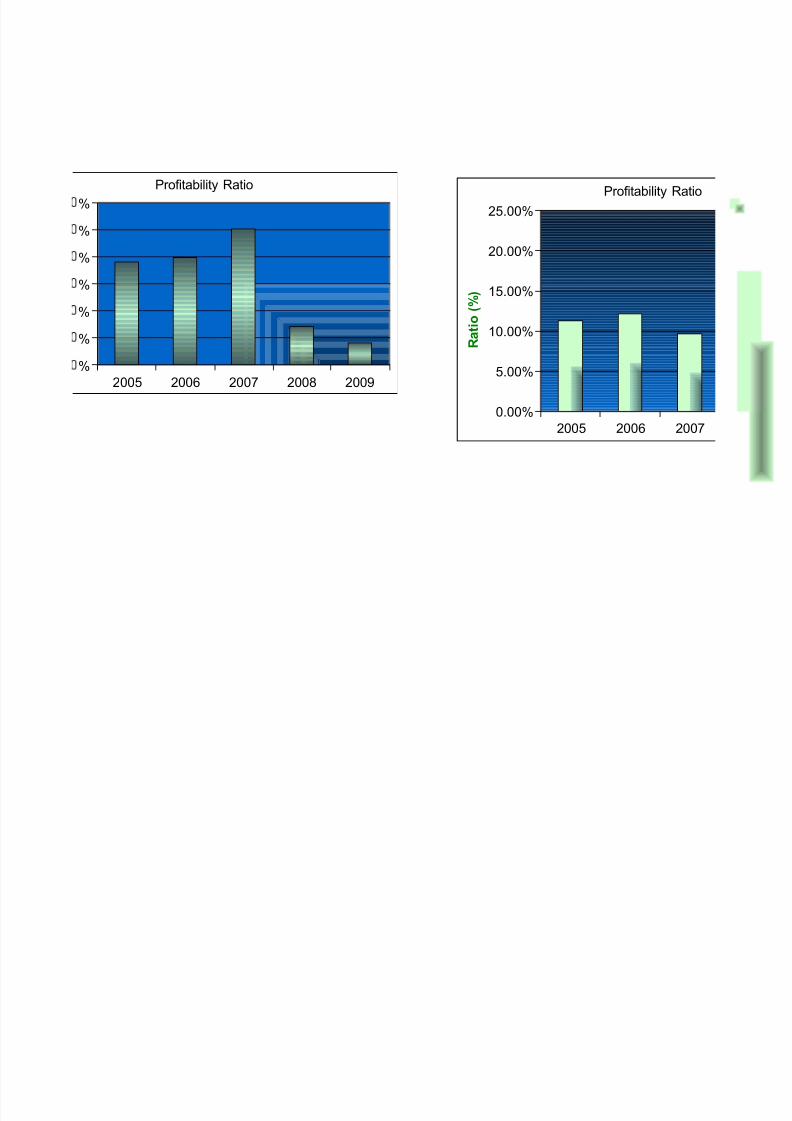
Return on assets 9.93% 4.82% 8.04% -1.09% -1.72%
Operating income margin -4.17% 1.23% -0.41% -0.14% 2.44%
Operating assets turnover 0.37 0.46 0.43 0.42 0.51Return on operating assets 11.88% 7.55% 9.55% -1.24% -1.89%
Sales to fixed assets 0.36 0.31 0.4 0.42 0.51
Return on investment 0.15 0.1 0.08 0.07 0.06
Return on total equity 9.93% 6.16% 5.05% 4.93% 4.05%
Gross profit margin 29.23% 31.72% 40.01% 11.68% 10.58%
Price/earning ratio 1.17 1.91 1.07 -8.9 -4.78
Percentage of retained earning 1 1 1 1 1
8/8/2019 Project 164
http://slidepdf.com/reader/full/project-164 26/60
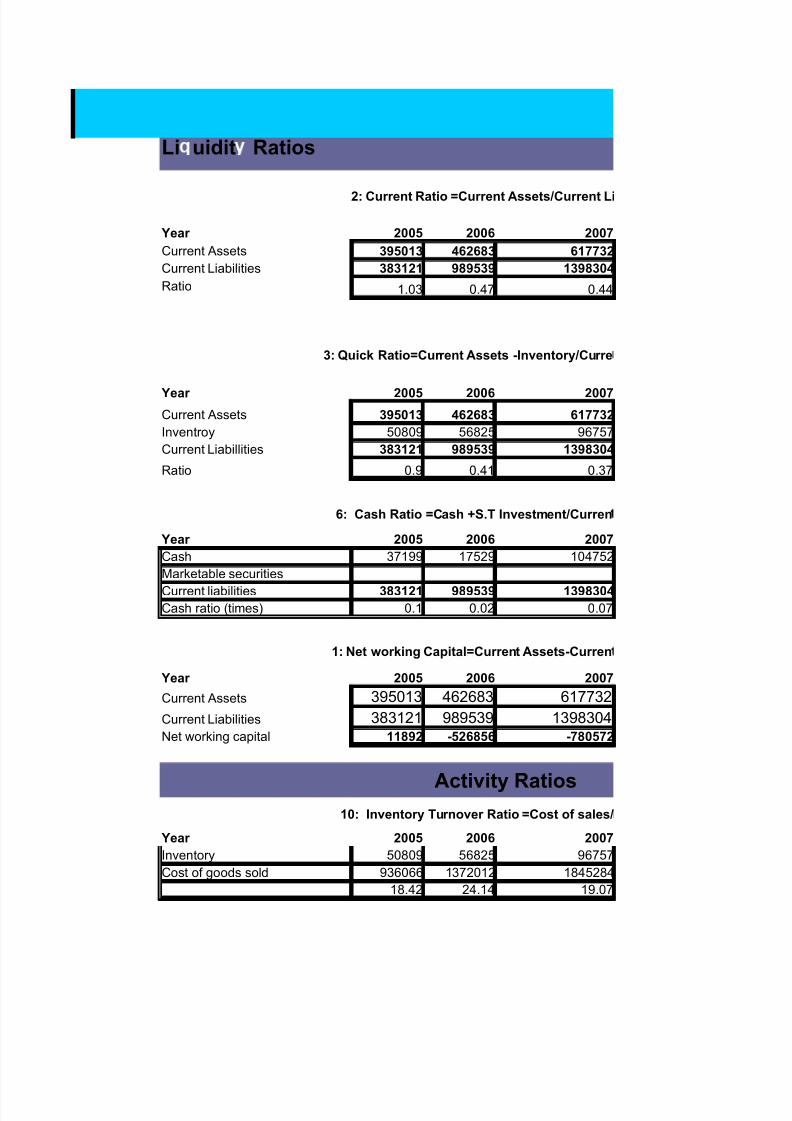
Li uidit Ratios
2: Current Ratio =Current Assets/Current Li
Year 2005 2006 2007
Current Assets 395013 462683 617732
Current Liabilities 383121 989539 1398304
Ratio 1.03 0.47 0.44
3: Quick Ratio=Current Assets -Inventory/Curre
Year 2005 2006 2007
Current Assets 395013 462683 617732
Inventroy 50809 56825 96757
Current Liabillities 383121 989539 1398304
Ratio 0.9 0.41 0.37
6: Cash Ratio =Cash +S.T Investment/Curren
Year 2005 2006 2007
Cash 37199 17529 104752
Marketable securities
Current liabilities 383121 989539 1398304
Cash ratio (times) 0.1 0.02 0.07
1: Net working Capital=Current Assets-Curren
Year 2005 2006 2007
Current Assets 395013 462683 617732
Current Liabilities 383121 989539 1398304Net working capital 11892 -526856 -780572
Activity Ratios10: Inventory Turnover Ratio =Cost of sales/
Year 2005 2006 2007
Inventory 50809 56825 96757
Cost of goods sold 936066 1372012 1845284
18.42 24.14 19.07

8/8/2019 Project 164
http://slidepdf.com/reader/full/project-164 27/60
15: Operating Asset Turnover
Year 2005 2006 2007Net sales 1322728 2009430 3075922
Operating assets 3572688 4398164 7075726
operating asset turnover 0.37 0.46 0.43
12: Total Asset Turnover Ratio =Sales/Tota
Year 2005 2006 2007
Net sales 1322728 2009430 3075922Average total assets 4274650 6887915 8404996
Total asset turnover 0.31 0.29 0.37
11: Net profit margin=(Net Profit/Net sale
Year 2005 2006 2007
Net income 424265 332089 675982
Net sales 1322728 2009430 3075922
Net profit margin 32.07% 16.53% 21.98%
16: Return on Operating Assets
Year 2005 2006 2007
Net income 424265 332089 675982
Operating assets 3572688 4398164 7075726
Return on operating assets 11.88% 7.55% 9.55%
22: Percentage Of Retained Earnin
Year 2005 2006 2007
Net income 424265 332089 675982
Dividend 1905 0 0
percentage of retained earning 1 1 1

8/8/2019 Project 164
http://slidepdf.com/reader/full/project-164 28/60
8/8/2019 Project 164
http://slidepdf.com/reader/full/project-164 29/60
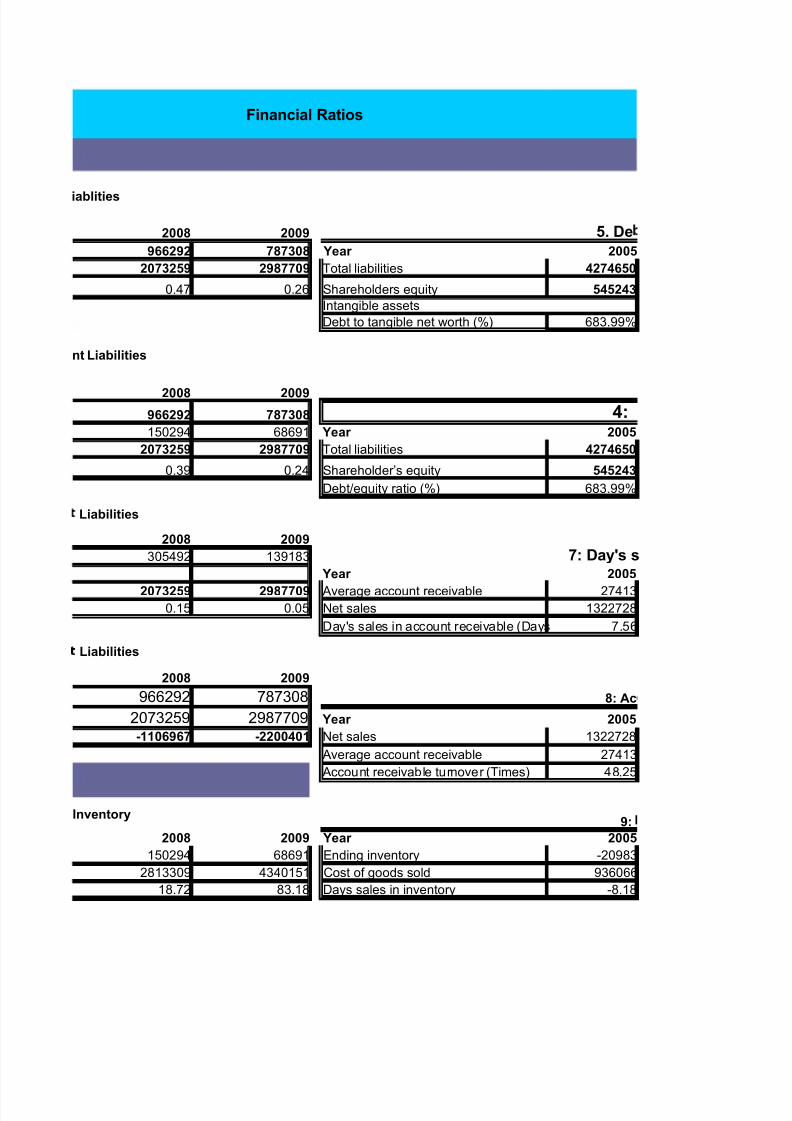
Financial Ratios
iablities
5. De2008 2009
966292 787308 Year 2005
2073259 2987709 Total liabilities 4274650
0.47 0.26 Shareholders equity 545243
Intangible assets
Debt to tangible net worth (%) 683.99%
nt Liabilities
2008 2009
966292 787308 4:150294 68691 Year 2005
2073259 2987709 Total liabilities 4274650
0.39 0.24 Shareholder’s equity 545243
Debt/equity ratio (%) 683.99%
Liabilities
7: Day's s2008 2009
305492 139183
Year 2005
2073259 2987709 Average account receivable 27413
0.15 0.05 Net sales 1322728
Day's sales in account receivable (Days 7.56
Liabilities
2008 2009
8: Ac966292 787308
2073259 2987709 Year 2005
-1106967 -2200401 Net sales 1322728
Average account receivable 27413
Account receivable turnover (Times) 48.25
Inventory9:
2008 2009 Year 2005
150294 68691 Ending inventory -20983
2813309 4340151 Cost of goods sold 936066
18.72 83.18 Days sales in inventory -8.18

8/8/2019 Project 164
http://slidepdf.com/reader/full/project-164 30/60
Year 2005
Net income 424265
Total assets 4274650return on assets 9.93%
2008 20093185418 4853764
14:7509855 9508720
0.42 0.51 Year 2005
Operating income -55208
Net sales 1322728
operating income margin -4.17%
l Assets
17
2008 2009 Year 2005
3185418 4853764 Net sales 1322728861097 10172589 Total fixed assets 3657284
0.37 0.46 Sales to fixed assets 0.36
)*100
2008 2009
-93494 -179971 18:
3185418 4853764 Year 2005
-2.94% -3.71% Net income 424265
Preferred stock dividend 0
Total equity 4274650
Return on total equity (%) 9.93%
2008 2009
-93494 -179971
7509855 9508720 1
-1.24% -1.89% Year 2005
Gross profit 386662
Net sales 1322728Gross profit margin 29.23%
2008 2009
-93494 -179971
0 0
20: E1 1
Year 2005
Net income 424265

8/8/2019 Project 164
http://slidepdf.com/reader/full/project-164 31/60
Number of common share outstanding 0
Earning per common share 8
2
Year 2005
Market price per common share
Earning per share 3.79
Price/earning ratio 1.17
8/8/2019 Project 164
http://slidepdf.com/reader/full/project-164 32/60
t to tangible net worth
2006 2007 2008 2009
6887915 8404996 8610497 10472589
1547466 2926405 2670427 45453160 0 0 0
345.11% 187.11% 222.44% 130.40%
Debt/equity Ratio2006 2007 2008 2009
6887915 8404996 8610497 10472589
1547466 2926405 2670427 4545316
345.11% 187.11% 222.44% 130.40%
ales in account receivable2006 2007 2008 2009
82266 27875 64203 112117
2009430 3075922 3185418 4853764
14.94 3.31 7.36 8.43
count receivable turnover
2006 2007 2008 2009
2009430 3075922 3185418 4853764
82266 27875 64203 112117
24.43 110.35 49.01 43.29
ays sales in inventory
2006 2007 2008 2009
-21193 -16495 -9235 -11936
1372012 1845284 2813309 4340151
-5.64 -3.26 -1.2 -1
8/8/2019 Project 164
http://slidepdf.com/reader/full/project-164 33/60
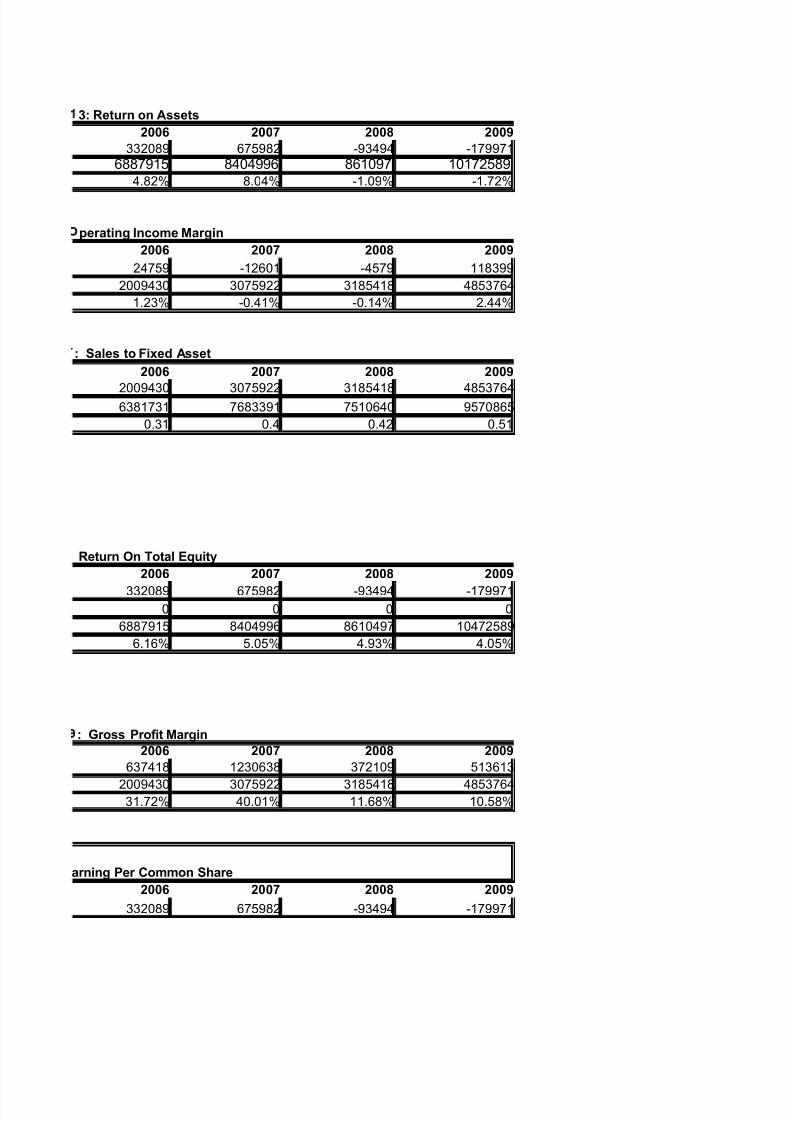
3: Return on Assets
2006 2007 2008 2009
332089 675982 -93494 -179971
6887915 8404996 861097 101725894.82% 8.04% -1.09% -1.72%
perating Income Margin
2006 2007 2008 2009
24759 -12601 -4579 118399
2009430 3075922 3185418 4853764
1.23% -0.41% -0.14% 2.44%
: Sales to Fixed Asset
2006 2007 2008 2009
2009430 3075922 3185418 48537646381731 7683391 7510640 9570865
0.31 0.4 0.42 0.51
Return On Total Equity
2006 2007 2008 2009
332089 675982 -93494 -179971
0 0 0 0
6887915 8404996 8610497 10472589
6.16% 5.05% 4.93% 4.05%
: Gross Profit Margin
2006 2007 2008 2009
637418 1230638 372109 513613
2009430 3075922 3185418 485376431.72% 40.01% 11.68% 10.58%
arning Per Common Share
2006 2007 2008 2009
332089 675982 -93494 -179971

8/8/2019 Project 164
http://slidepdf.com/reader/full/project-164 34/60
8/8/2019 Project 164
http://slidepdf.com/reader/full/project-164 35/60
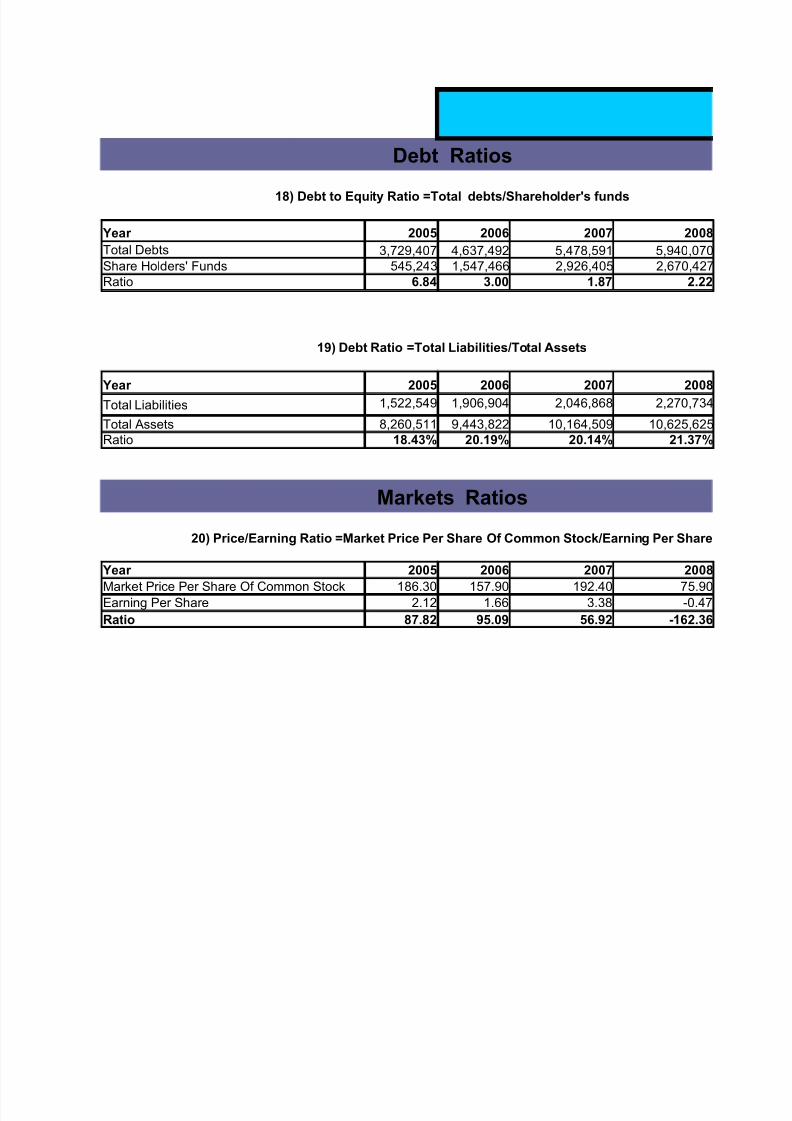
Debt Ratios
18) Debt to Equity Ratio =Total debts/Shareholder's funds
Year 2005 2006 2007 2008
Total Debts 3,729,407 4,637,492 5,478,591 5,940,070
Share Holders' Funds 545,243 1,547,466 2,926,405 2,670,427
Ratio 6.84 3.00 1.87 2.22
19) Debt Ratio =Total Liabilities/Total Assets
Year 2005 2006 2007 2008Total Liabilities 1,522,549 1,906,904 2,046,868 2,270,734
Total Assets 8,260,511 9,443,822 10,164,509 10,625,625
Ratio 18.43% 20.19% 20.14% 21.37%
Markets Ratios
20) Price/Earning Ratio =Market Price Per Share Of Common Stock/Earning Per Share
Year 2005 2006 2007 2008
Market Price Per Share Of Common Stock 186.30 157.90 192.40 75.90Earning Per Share 2.12 1.66 3.38 -0.47
Ratio 87.82 95.09 56.92 -162.36

8/8/2019 Project 164
http://slidepdf.com/reader/full/project-164 36/60

8/8/2019 Project 164
http://slidepdf.com/reader/full/project-164 37/60

8/8/2019 Project 164
http://slidepdf.com/reader/full/project-164 38/60
8/8/2019 Project 164
http://slidepdf.com/reader/full/project-164 39/60
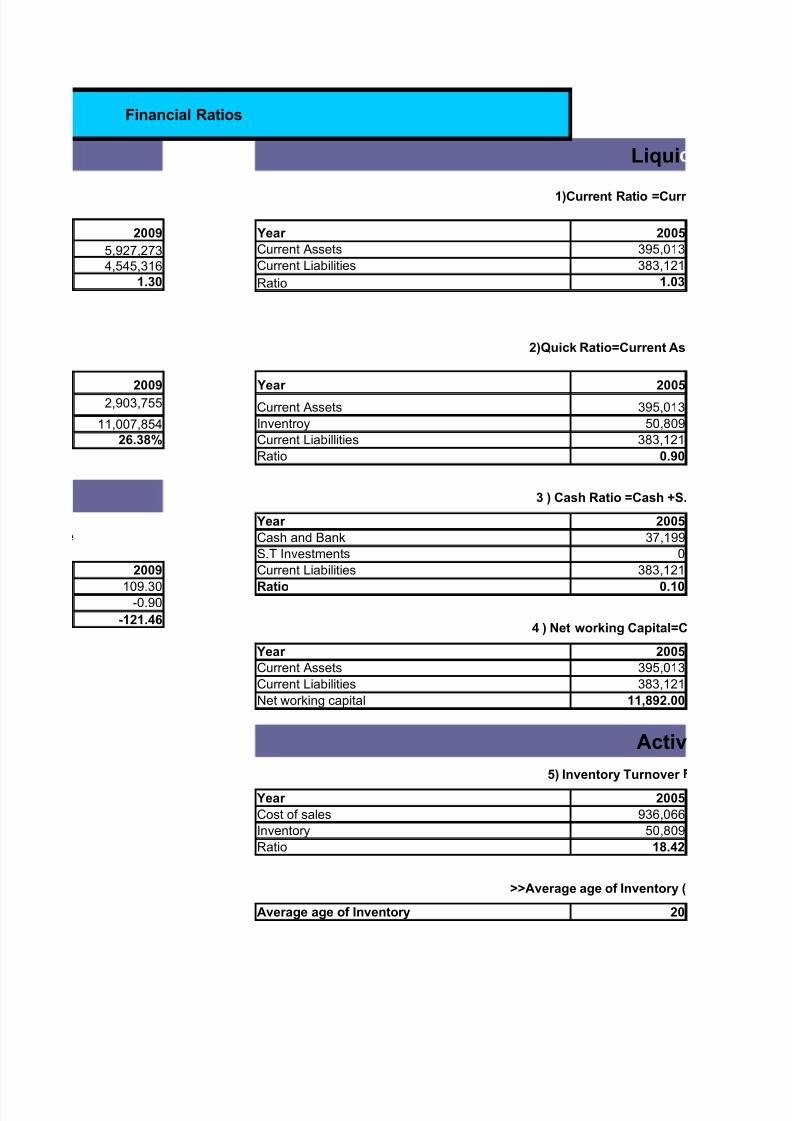
Financial Ratios
Liqui
1)Current Ratio =Curr
2009 Year 2005
5,927,273 Current Assets 395,013
4,545,316 Current Liabilities 383,121
1.30 Ratio 1.03
2)Quick Ratio=Current As
2009 Year 20052,903,755 Current Assets 395,013
11,007,854 Inventroy 50,809
26.38% Current Liabillities 383,121
Ratio 0.90
3 ) Cash Ratio =Cash +S.
Year 2005
Cash and Bank 37,199
S.T Investments 0
2009 Current Liabilities 383,121
109.30 Ratio 0.10-0.90
-121.464 ) Net working Capital=C
Year 2005
Current Assets 395,013
Current Liabilities 383,121
Net working capital 11,892.00
Activ
5) Inventory Turnover
Year 2005
Cost of sales 936,066
Inventory 50,809
Ratio 18.42
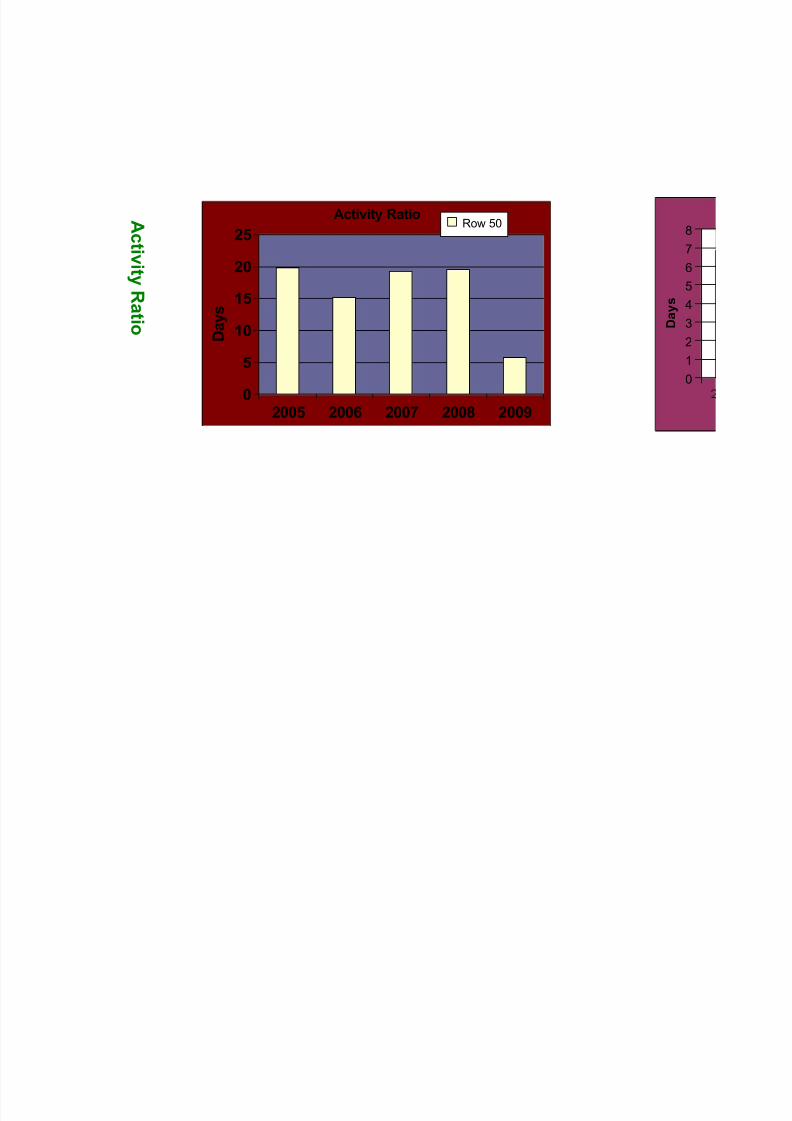
>>Average age of Inventory (
Average age of Inventory 20
8/8/2019 Project 164
http://slidepdf.com/reader/full/project-164 40/60
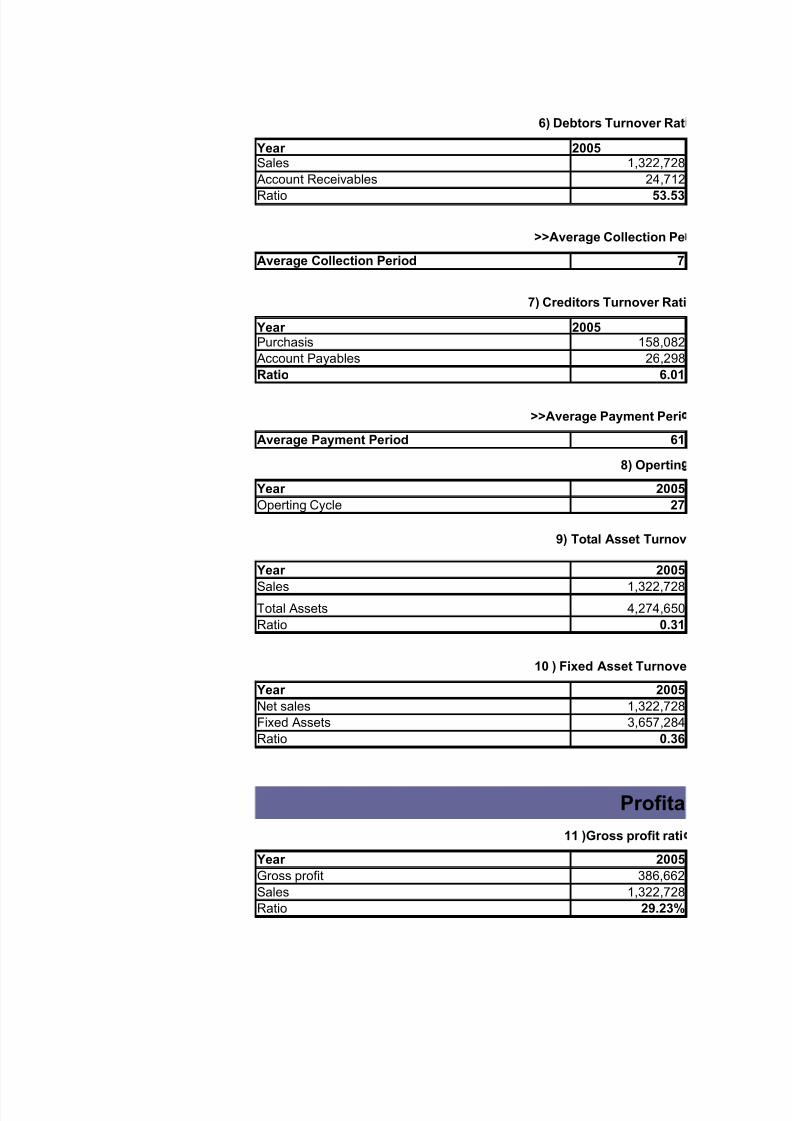
6) Debtors Turnover Rat
Year 2005Sales 1,322,728
Account Receivables 24,712
Ratio 53.53
>>Average Collection Pe
Average Collection Period 7
7) Creditors Turnover Rati
Year 2005Purchasis 158,082
Account Payables 26,298
Ratio 6.01
>>Average Payment Peri
Average Payment Period 61
8) Opertin
Year 2005
Operting Cycle 27
9) Total Asset Turnov
Year 2005
Sales 1,322,728
Total Assets 4,274,650
Ratio 0.31
10 ) Fixed Asset Turnove
Year 2005
Net sales 1,322,728
Fixed Assets 3,657,284
Ratio 0.36
Profita
11 )Gross profit rati
Year 2005
Gross profit 386,662
Sales 1,322,728
Ratio 29.23%
8/8/2019 Project 164
http://slidepdf.com/reader/full/project-164 41/60
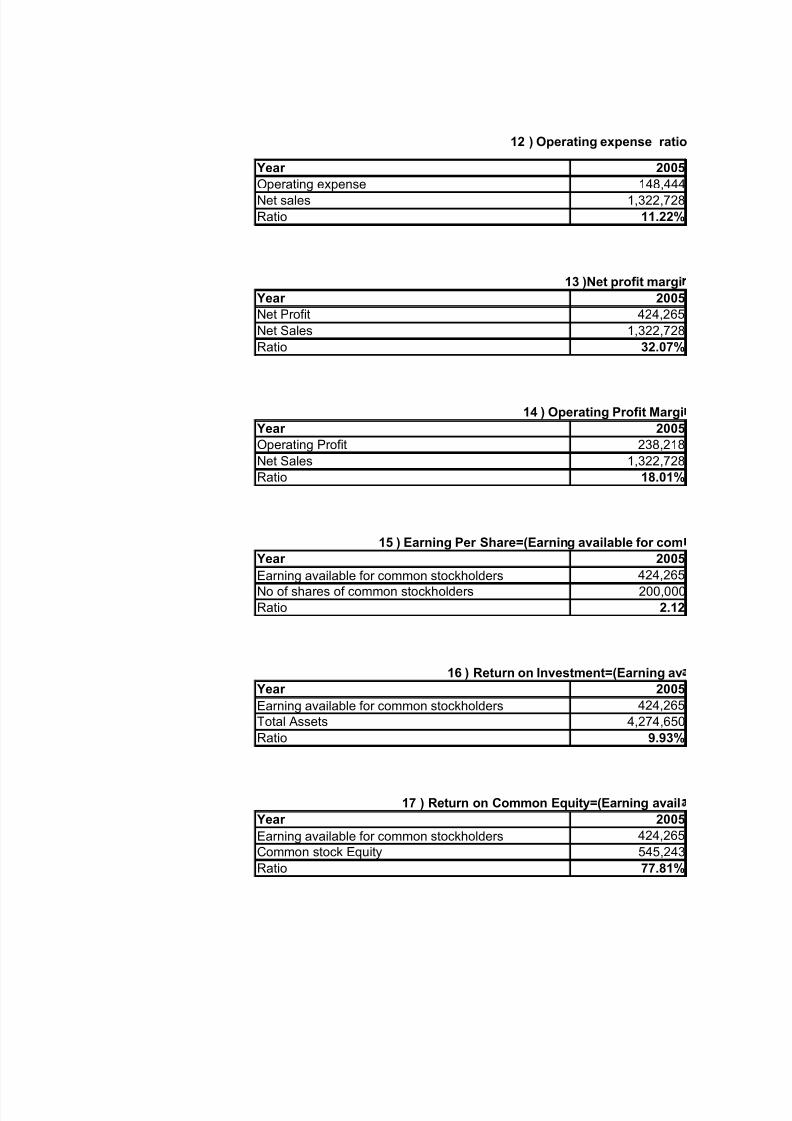
12 ) Operating expense ratio
Year 2005
Operating expense 148,444
Net sales 1,322,728
Ratio 11.22%
13 )Net profit margi
Year 2005
Net Profit 424,265
Net Sales 1,322,728
Ratio 32.07%
14 ) Operating Profit Margi
Year 2005
Operating Profit 238,218
Net Sales 1,322,728
Ratio 18.01%
15 ) Earning Per Share=(Earning available for com
Year 2005
Earning available for common stockholders 424,265
No of shares of common stockholders 200,000Ratio 2.12
16 ) Return on Investment=(Earning av
Year 2005
Earning available for common stockholders 424,265
Total Assets 4,274,650
Ratio 9.93%
17 ) Return on Common Equity=(Earning avail
Year 2005
Earning available for common stockholders 424,265
Common stock Equity 545,243
Ratio 77.81%

8/8/2019 Project 164
http://slidepdf.com/reader/full/project-164 42/60

8/8/2019 Project 164
http://slidepdf.com/reader/full/project-164 43/60
ity Ratios
ent Assets/Current Liablities
2006 2007 2008 2009
462,683 617,732 966,292 787,308
989,539 1,398,304 2,073,259 2,987,709
0.47 0.44 0.47 0.26
sets -Inventory/Current Liabilities
2006 2007 2008 2009462,683 617,732 966,292 787,308
56,825 96,757 150,294 68,691
989,539 1,398,304 2,073,259 2,987,709
0.41 0.37 0.39 0.24
T Investment/Current Liabilities
2006 2007 2008 2009
17,529 104,752 305,492 139,183
0 0 0 0
989,539 1,398,304 2,073,259 2,987,709
0.02 0.07 0.15 0.05
urrent Assets-Current Liabilities
2006 2007 2008 2009
462,683 617,732 966,292 787,308
1,703,806 1,761,218 1,937,662 2,524,426
-1,241,123.00 -1,143,486.00 -971,370.00 -1,737,118.00
ity Ratios
atio =Cost of sales/Inventory
2006 2007 2008 2009
1,372,012 1,845,284 2,813,309 4,340,151
56,825 96,757 150,294 68,691
24.14 19.07 18.72 63.18
Days)=(Inventory/Cost of sales)*365
15 19 19 6

8/8/2019 Project 164
http://slidepdf.com/reader/full/project-164 44/60
io = Sales/ Average receivables
2006 2007 2008 20092,009,430 3,075,922 3,185,418 4,853,764
18,944 12,490 29,717 40,124
106.07 246.27 107.19 120.97
riod =365/Debtor Turnover Ratio
3 1 3 3
o = Purchasis/ Average payables
2006 2007 2008 2009220,120 284,611 515,976 702,786
80,585 78,590 67,500 29,594
2.73 3.62 7.64 23.75
d =365/Creditors Turnover Ratio
134 101 48 15
Cycle= AAI+ACP
2006 2007 2008 2009
19 21 23 9
er Ratio =Sales/Total Assets
2006 2007 2008 2009
2,009,430 3,075,922 3,185,418 4,853,764
6,887,915 8,404,996 8,610,497 10,472,589
0.29 0.37 0.37 0.46
r Ratio =Net sales/Fixed Assets
2006 2007 2008 2009
2,009,430 3,075,922 3,185,418 4,853,764
6,381,731 7,683,391 7,510,640 9,570,865
0.31 0.40 0.42 0.51
bilty Ratios
=( Gross profit/Sales)*100
2006 2007 2008 2009
637,418 1,230,638 372,109 513,613
2,009,430 3,075,922 3,185,418 4,853,764
31.72% 40.01% 11.68% 10.58%
8/8/2019 Project 164
http://slidepdf.com/reader/full/project-164 45/60
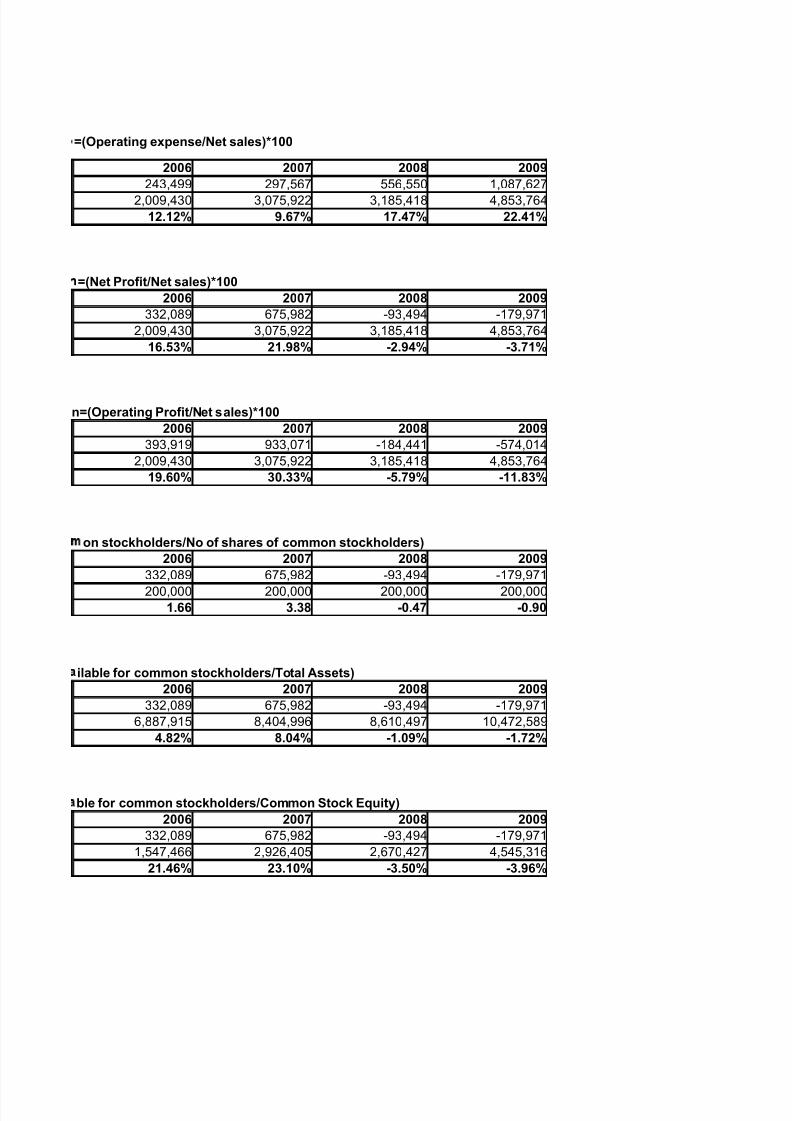
=(Operating expense/Net sales)*100
2006 2007 2008 2009
243,499 297,567 556,550 1,087,627
2,009,430 3,075,922 3,185,418 4,853,764
12.12% 9.67% 17.47% 22.41%
=(Net Profit/Net sales)*100
2006 2007 2008 2009
332,089 675,982 -93,494 -179,971
2,009,430 3,075,922 3,185,418 4,853,764
16.53% 21.98% -2.94% -3.71%
n=(Operating Profit/Net sales)*100
2006 2007 2008 2009
393,919 933,071 -184,441 -574,014
2,009,430 3,075,922 3,185,418 4,853,764
19.60% 30.33% -5.79% -11.83%
on stockholders/No of shares of common stockholders)
2006 2007 2008 2009
332,089 675,982 -93,494 -179,971
200,000 200,000 200,000 200,0001.66 3.38 -0.47 -0.90
ilable for common stockholders/Total Assets)
2006 2007 2008 2009
332,089 675,982 -93,494 -179,971
6,887,915 8,404,996 8,610,497 10,472,589
4.82% 8.04% -1.09% -1.72%
ble for common stockholders/Common Stock Equity)
2006 2007 2008 2009
332,089 675,982 -93,494 -179,971
1,547,466 2,926,405 2,670,427 4,545,316
21.46% 23.10% -3.50% -3.96%

8/8/2019 Project 164
http://slidepdf.com/reader/full/project-164 46/60
8/8/2019 Project 164
http://slidepdf.com/reader/full/project-164 47/60
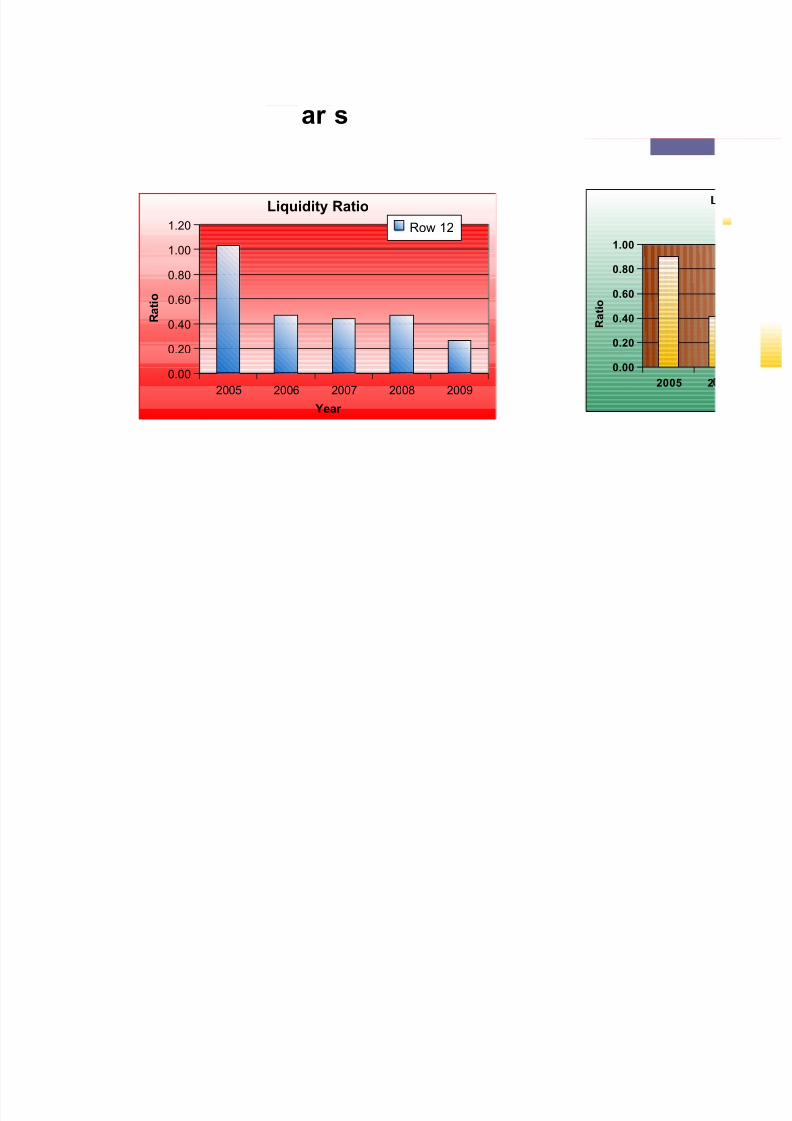
ar s
2005 2006 2007 2008 2009
0.00
0.20
0.40
0.60
0.80
1.00
1.20
Liquidity Ratio
Row 12
Year
Ratio
2005 2
0.00
0.20
0.40
0.60
0.80
1.00
Ratio

8/8/2019 Project 164
http://slidepdf.com/reader/full/project-164 48/60
06 2007 2008 2009
iquidity Ratio
Row 22
Year
2005 2006 2007 2008 2009
0.00
0.02
0.04
0.06
0.08
0.10
0.12
0.14
0.16
Liquidity RatioRow 30
Year
Ratio
8/8/2019 Project 164
http://slidepdf.com/reader/full/project-164 49/60
2005 2006 2007 2008 2009
-2,000,000.00
-1,500,000.00
-1,000,000.00
-500,000.00
0.00
500,000.00
Liquidity Ratio
Row 37
year
Rupees'000'
8/8/2019 Project 164
http://slidepdf.com/reader/full/project-164 50/60
A c t i vi t yR a t i o
2005 2006 2007 2008 20090
5
10
15
20
25
Activity RatioRow 50
Days
0
1
2
3
4
5
6
7
8
Days

8/8/2019 Project 164
http://slidepdf.com/reader/full/project-164 51/60
005 2006 2007 2008 2009
Activity Ratio
Row 61
Year
2005 2006 2007 2008 2
0
20
40
60
80
100
120
140
160
Activity Ratio
Year
Days

8/8/2019 Project 164
http://slidepdf.com/reader/full/project-164 52/60
2005 2006 2007 2008 2009
0
5
10
15
20
25
30
Activity Ratio
Row 76
Year
Days
009
Row 72
8/8/2019 Project 164
http://slidepdf.com/reader/full/project-164 53/60
2005 2006 2007 2008 2009
0.00
0.10
0.20
0.30
0.40
0.50Activity Ratio
Row 83
Year
Ratio
2005 2006 2007
0.00
0.10
0.20
0.30
0.40
0.50
0.60
Activity
Year
Ratio(Times)

8/8/2019 Project 164
http://slidepdf.com/reader/full/project-164 54/60
P r of i t a b i l t i yR a t i o s
2008 2009
Ratio
Row 90
2005 2006 2007 2008
0.00%
10.00%
20.00%
30.00%
40.00%
50.00%
Profitability Ratio
Row 99
Year
Ratio(%)

8/8/2019 Project 164
http://slidepdf.com/reader/full/project-164 55/60
2009
2005 2006 2007 2008 2009
-10.00%
0.00%
10.00%
20.00%
30.00%
40.00%
Profitability Ratio
Row 114
Year
Ratio(%)
-20.0
-10.0
0.0
10.0
20.0
30.0
40.0
Ratio(%)
8/8/2019 Project 164
http://slidepdf.com/reader/full/project-164 56/60
2005 2006 2007 2008 2009
%
%
%
%
%
%
%
Profitability Ratio
2005 2006 2007
0.00%
5.00%
10.00%
15.00%
20.00%
25.00%Profitability Ratio
Ratio(%)
8/8/2019 Project 164
http://slidepdf.com/reader/full/project-164 57/60
2008 2009
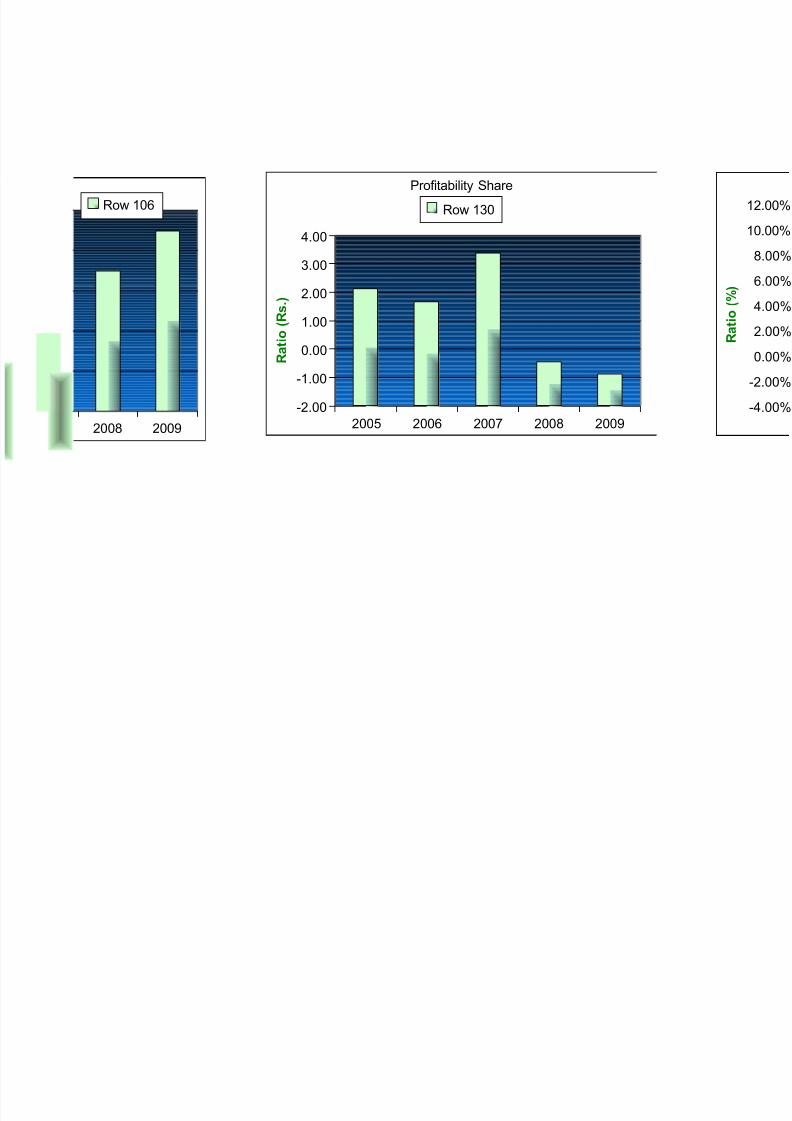
Row 106
2005 2006 2007 2008 2009
-2.00
-1.00
0.00
1.00
2.00
3.00
4.00
Profitability Share
Row 130
Ratio(Rs.)
Ratio(%)

8/8/2019 Project 164
http://slidepdf.com/reader/full/project-164 58/60
2005 2006 2007 2008 2009
-4.00%
-2.00%
0.00%
2.00%
4.00%
6.00%
8.00%
10.00%
12.00%
Profitability RatioRow 138
Ratio(%)
2005 2006
-10.00%0.00%
10.00%
20.00%
30.00%
40.00%
50.00%
60.00%
70.00%
80.00%
90.00%
Profitabi
Ratio(%)

8/8/2019 Project 164
http://slidepdf.com/reader/full/project-164 59/60
D e b t R a t i o s
2005 2006 2007 2008
0.00
1.00
2.00
3.00
4.00
5.00
6.00
7.00
8.00
Debt Ratio
Year
Ratio(Times)
2007 2008 2009
ility RatioRow 146

8/8/2019 Project 164
http://slidepdf.com/reader/full/project-164 60/60
2009
Row 12
2005 2006 2007 2008 2009
0.00%
5.00%
10.00%
15.00%
20.00%
25.00%
30.00%
Debt Ratio
Row 21
Ratio(%)