project 4: hatchery trout evaluations - home … · project 4: hatchery trout evaluations ....
TRANSCRIPT
PROJECT 4: HATCHERY TROUT EVALUATIONS
Grant # F-73-R-35
Report Period July 1, 2012 to June 30, 2013
John Cassinelli Senior Fisheries Research Biologist
Martin Koenig
Regional Fisheries Biologist
IDFG Report Number 13-04 January 2013

Annual Performance Report
July 1, 2012 to June 30, 2013
Grant # F-73-R-35
Project 4: Hatchery Trout Evaluations
Subproject #1: Improving Returns of Hatchery Catchable Rainbow Trout: Statewide Exploitation Rates and Evaluating Rearing Density
Subproject #2: Relative Performance of Triploid Kokanee in Idaho Lakes and Reservoirs
By
John Cassinelli
Martin Koenig
Idaho Department of Fish and Game 600 South Walnut Street
P.O. Box 25 Boise, ID 83707
IDFG Report Number 13-04 January 2013

TABLE OF CONTENTS Page
ANNUAL PERFORMANCE REPORT ......................................................................................... 1 SUBPROJECT #1: IMPROVING RETURNS OF HATCHERY CATCHABLE RAINBOW
TROUT: STATEWIDE EXPLOITATION RATES AND EVALUATING REARING DENSITY .............................................................................................................................. 1
ABSTRACT ................................................................................................................................. 1 INTRODUCTION ........................................................................................................................ 3
Study Questions ....................................................................................................................... 4 METHODS .................................................................................................................................. 5
Study Sites ............................................................................................................................... 5 Rearing Density Study ............................................................................................................. 6
American Falls Hatchery ....................................................................................................... 6 Hagerman Hatchery .............................................................................................................. 7 Nampa Hatchery ................................................................................................................... 7
Strain Evaluation ...................................................................................................................... 7 Tagging .................................................................................................................................... 7 Data Analysis ........................................................................................................................... 8
RESULTS ................................................................................................................................... 9 Statewide Exploitation .............................................................................................................. 9 Rearing Density Trial.............................................................................................................. 10 Strain Evaluation .................................................................................................................... 10 Season of Release ................................................................................................................. 11 Size and Rank at Release ...................................................................................................... 11 Tag Reporting Rate ................................................................................................................ 11
DISCUSSION............................................................................................................................ 12 Statewide Exploitation ............................................................................................................ 12 Rearing Density ..................................................................................................................... 12 Strain Evaluation .................................................................................................................... 15 Season of Release ................................................................................................................. 15 Size and Rank at Release ...................................................................................................... 16 Tag Reporting Rate ................................................................................................................ 16
RECOMMENDATIONS ............................................................................................................. 17 ACKNOWLEDGEMENTS ......................................................................................................... 18 LITERATURE CITED ................................................................................................................ 19 ANNUAL PERFORMANCE REPORT ....................................................................................... 37 SUBPROJECT #2: RELATIVE PERFORMANCE OF TRIPLOID KOKANEE IN IDAHO
LAKES AND RESERVOIRS ................................................................................................ 37 ABSTRACT ............................................................................................................................... 37 INTRODUCTION ...................................................................................................................... 38 OBJECTIVES ........................................................................................................................... 39 METHODS ................................................................................................................................ 39
Study Sites ............................................................................................................................. 39 Collecting Eggs/Spawning ..................................................................................................... 40 Hatchery Rearing ................................................................................................................... 40
i

Table of Contents, continued. Page
Sampling ................................................................................................................................ 40 Data Analysis ......................................................................................................................... 41
RESULTS ................................................................................................................................. 41 DISCUSSION............................................................................................................................ 42 ACKNOWLEDGEMENTS ......................................................................................................... 43 REFERENCES ......................................................................................................................... 44
ii
LIST OF TABLES Page
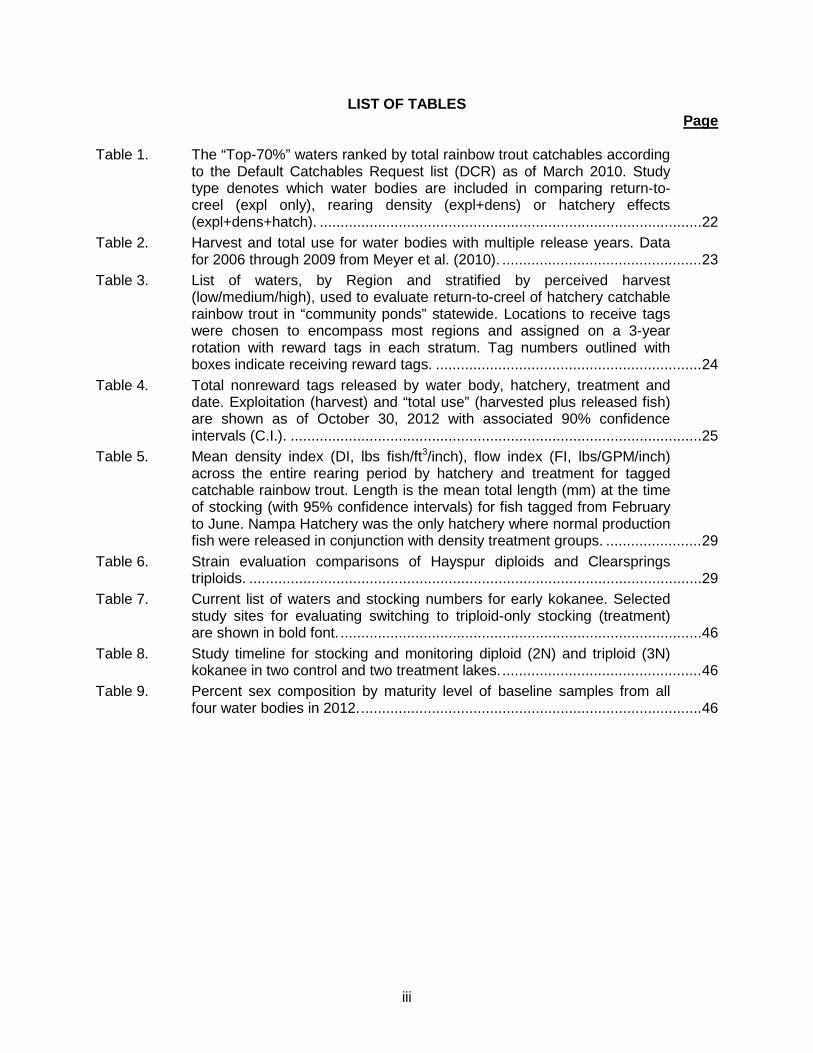
Table 1. The “Top-70%” waters ranked by total rainbow trout catchables according
to the Default Catchables Request list (DCR) as of March 2010. Study type denotes which water bodies are included in comparing return-to-creel (expl only), rearing density (expl+dens) or hatchery effects (expl+dens+hatch). ............................................................................................ 22
Table 2. Harvest and total use for water bodies with multiple release years. Data for 2006 through 2009 from Meyer et al. (2010). ................................................ 23
Table 3. List of waters, by Region and stratified by perceived harvest (low/medium/high), used to evaluate return-to-creel of hatchery catchable rainbow trout in “community ponds” statewide. Locations to receive tags were chosen to encompass most regions and assigned on a 3-year rotation with reward tags in each stratum. Tag numbers outlined with boxes indicate receiving reward tags. ................................................................ 24
Table 4. Total nonreward tags released by water body, hatchery, treatment and date. Exploitation (harvest) and “total use” (harvested plus released fish) are shown as of October 30, 2012 with associated 90% confidence intervals (C.I.). ................................................................................................... 25
Table 5. Mean density index (DI, lbs fish/ft3/inch), flow index (FI, lbs/GPM/inch) across the entire rearing period by hatchery and treatment for tagged catchable rainbow trout. Length is the mean total length (mm) at the time of stocking (with 95% confidence intervals) for fish tagged from February to June. Nampa Hatchery was the only hatchery where normal production fish were released in conjunction with density treatment groups. ....................... 29
Table 6. Strain evaluation comparisons of Hayspur diploids and Clearsprings triploids. ............................................................................................................. 29
Table 7. Current list of waters and stocking numbers for early kokanee. Selected study sites for evaluating switching to triploid-only stocking (treatment) are shown in bold font. ....................................................................................... 46
Table 8. Study timeline for stocking and monitoring diploid (2N) and triploid (3N) kokanee in two control and two treatment lakes. ................................................ 46
Table 9. Percent sex composition by maturity level of baseline samples from all four water bodies in 2012. .................................................................................. 46
iii
LIST OF FIGURES Page
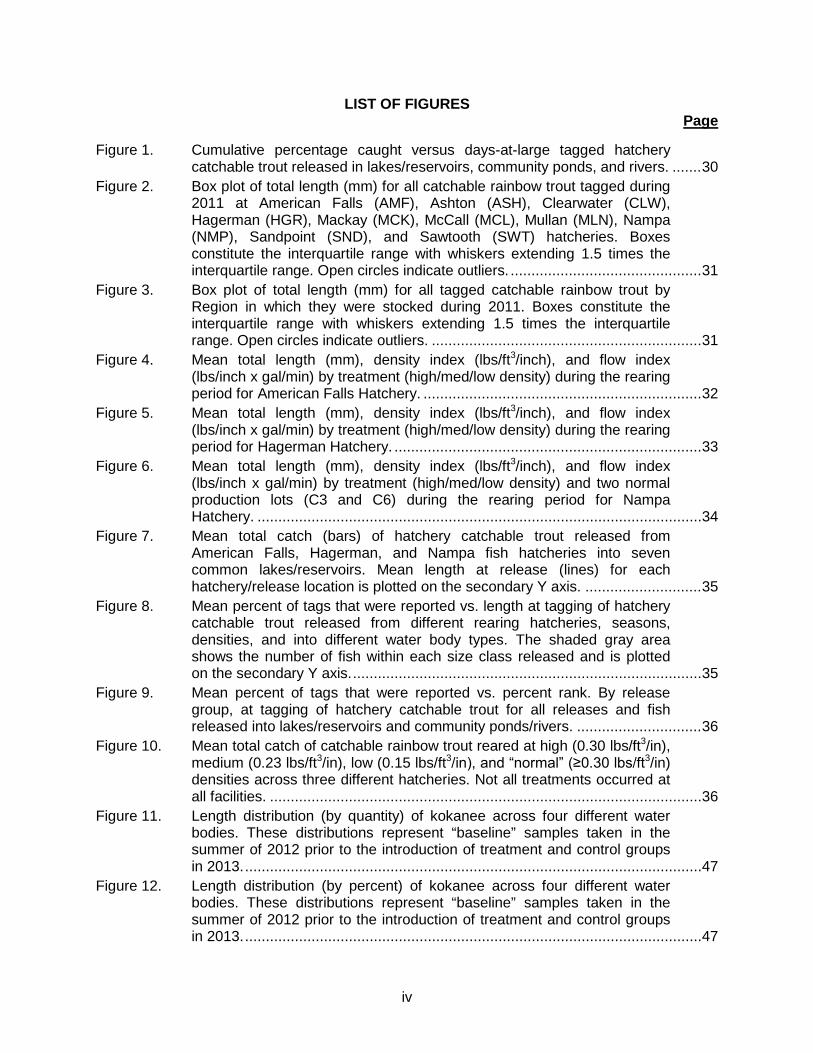
Figure 1. Cumulative percentage caught versus days-at-large tagged hatchery
catchable trout released in lakes/reservoirs, community ponds, and rivers. ....... 30 Figure 2. Box plot of total length (mm) for all catchable rainbow trout tagged during
2011 at American Falls (AMF), Ashton (ASH), Clearwater (CLW), Hagerman (HGR), Mackay (MCK), McCall (MCL), Mullan (MLN), Nampa (NMP), Sandpoint (SND), and Sawtooth (SWT) hatcheries. Boxes constitute the interquartile range with whiskers extending 1.5 times the interquartile range. Open circles indicate outliers. .............................................. 31
Figure 3. Box plot of total length (mm) for all tagged catchable rainbow trout by Region in which they were stocked during 2011. Boxes constitute the interquartile range with whiskers extending 1.5 times the interquartile range. Open circles indicate outliers. ................................................................. 31
Figure 4. Mean total length (mm), density index (lbs/ft3/inch), and flow index (lbs/inch x gal/min) by treatment (high/med/low density) during the rearing period for American Falls Hatchery. ................................................................... 32
Figure 5. Mean total length (mm), density index (lbs/ft3/inch), and flow index (lbs/inch x gal/min) by treatment (high/med/low density) during the rearing period for Hagerman Hatchery. .......................................................................... 33
Figure 6. Mean total length (mm), density index (lbs/ft3/inch), and flow index (lbs/inch x gal/min) by treatment (high/med/low density) and two normal production lots (C3 and C6) during the rearing period for Nampa Hatchery. ........................................................................................................... 34
Figure 7. Mean total catch (bars) of hatchery catchable trout released from American Falls, Hagerman, and Nampa fish hatcheries into seven common lakes/reservoirs. Mean length at release (lines) for each hatchery/release location is plotted on the secondary Y axis. ............................ 35
Figure 8. Mean percent of tags that were reported vs. length at tagging of hatchery catchable trout released from different rearing hatcheries, seasons, densities, and into different water body types. The shaded gray area shows the number of fish within each size class released and is plotted on the secondary Y axis. .................................................................................... 35
Figure 9. Mean percent of tags that were reported vs. percent rank. By release group, at tagging of hatchery catchable trout for all releases and fish released into lakes/reservoirs and community ponds/rivers. .............................. 36
Figure 10. Mean total catch of catchable rainbow trout reared at high (0.30 lbs/ft3/in), medium (0.23 lbs/ft3/in), low (0.15 lbs/ft3/in), and “normal” (≥0.30 lbs/ft3/in) densities across three different hatcheries. Not all treatments occurred at all facilities. ........................................................................................................ 36
Figure 11. Length distribution (by quantity) of kokanee across four different water bodies. These distributions represent “baseline” samples taken in the summer of 2012 prior to the introduction of treatment and control groups in 2013. .............................................................................................................. 47
Figure 12. Length distribution (by percent) of kokanee across four different water bodies. These distributions represent “baseline” samples taken in the summer of 2012 prior to the introduction of treatment and control groups in 2013. .............................................................................................................. 47
iv

ANNUAL PERFORMANCE REPORT SUBPROJECT #1: IMPROVING RETURNS OF HATCHERY CATCHABLE RAINBOW
TROUT: STATEWIDE EXPLOITATION RATES AND EVALUATING REARING DENSITY
State of: Idaho Grant No.: F-73-R-35 Fishery Research Project No.: 4 Title: Hatchery Trout Evaluations Subproject #1: Improving Returns of Hatchery
Catchable Rainbow Trout Contract Period: July 1, 2012 to June 30, 2013
ABSTRACT
Idaho Department of Fish and Game (IDFG) hatcheries are integral to managing coldwater sportfishing opportunities in Idaho. Current hatchery production capacity and funding are not increasing, while demand for hatchery catchable-sized trout remains steady or is increasing. A comprehensive evaluation of hatchery catchable trout exploitation rates (i.e. return-to-creel) in Idaho’s predominant put-and-take fisheries has been lacking. This project is intended to (1) evaluate exploitation rates of the most-stocked water bodies statewide, and (2) conduct research experiments focusing on hatchery rearing techniques to increase return-to-creel of catchable rainbow trout. In 2011, IDFG released 33,359 non-reward tagged hatchery rainbow trout across 49 water bodies, including lakes, reservoirs, community ponds, and rivers. A portion of these releases were intended to evaluate return-to-creel rates of fish reared at high (0.3 lbs/ft3/inch), medium (0.23 lbs/ft3/inch), and low (0.15 lbs/ft3/inch) densities. The statewide average total length (± 95% C.I.) of tagged catchable rainbow trout was 257 ± 0.3 mm (10.1 in). Average harvest and total catch (harvested and released, ± 90% C.I.) for catchable rainbow trout across all evaluated waters was 18.7% (± 4.0%) and 26.0% (± 5.5%), respectively. On average, harvest and total catch for 16 community ponds was 35.9% (± 8.0%) and 49.8% (± 10.9%), respectively. Mean total catch of rainbow trout was significantly different across in-hatchery rearing densities. The low density treatment had the highest total catch (25.5%) on average, and was significantly different from medium- and high-density groups. Water body was a significant factor, indicating much of the variation in total catch was due to inherent differences among waters. Mean total catch of rainbow trout was also significantly different across hatcheries. Hagerman and American Falls hatcheries had similar average total catch of catchable rainbow trout (21.5% and 23.6%, respectively) and were significantly different from Nampa Hatchery (13.5%). When looking at the relative differences between treatments, the total catch of low-density treatment fish was 21.6% higher than high-density fish, on average. However, the higher return-to-creel of fish raised at low densities is not sufficient to offset the reduced number of fish raised and stocked. Additionally, we evaluated returns-to-creel based on release season as well as length- and length rank-at-release. For all water body types combined, summer release groups had the highest catch rates (31.1%) followed by fall (27.4%) and then spring (22.2%). Return-to-creel increased with increasing fish length. For fish length, from 200 mm to 305 mm there was roughly a 5% increase in catch rates for each 25 mm increase in length at stocking. Individual fish’s percent length rank within a release group did not show a consistent correlation to catch, suggesting that length was more important than rank. Future work should further evaluate the relationship between length-at-release and catch rates,
1

and explore rearing options that result in maximizing the size-at-release/rearing cost relationship as well as reduced size variation. Authors: John Cassinelli Senior Fisheries Research Biologist Martin Koenig Regional Fisheries Biologist
2

INTRODUCTION
Idaho Department of Fish and Game (IDFG) hatcheries are integral to managing coldwater sportfishing opportunities in Idaho. IDFG’s “resident” (non-anadromous) hatchery program consists of 10 hatcheries that raise up to 18 species and strains of salmonids for inland coldwater fisheries. In 2009, resident hatcheries stocked over 17.6 million fish in over 500 water bodies (Frew 2010), including about 2.2 million “catchable-sized” rainbow trout. Producing catchable rainbow trout (typically stocked at an average size of 250 mm – 305 mm in length) accounts for over 50% of the annual Resident Hatchery budget and about 84% of the total weight of fish stocked annually. Hagerman, Nampa, and American Falls hatcheries provide the majority of IDFG catchable trout, with Hagerman providing almost half. According to the default catchables request list, catchable rainbow trout Oncorhynchus mykiss are planted in about 293 water bodies throughout Idaho. Catchable rainbow trout raised by IDFG are typically one of six strains, with the majority being Troutlodge Inc. triploid Kamloops (TT), Hayspur triploid (T9), or Hayspur Kamloops triploid (KT) (Table 1). Despite the large number of waters stocked with catchable rainbow trout, a small number of water bodies account for large proportions of the total catchable rainbow trout stocked. For example, five water bodies (Cascade, American Falls, Blackfoot, Chesterfield reservoirs, and the Boise River) account for 21% (456,000 fish) of the total annual catchable production. Fifty percent of the catchable rainbow trout produced by IDFG are stocked in 32 locations, while 60% are stocked into 48 locations (Table 1).
Current hatchery production capacity and funding are not increasing, while demand for
hatchery catchable trout remains steady or is increasing. Despite the costs associated with stocking catchable trout, a comprehensive evaluation of hatchery catchable exploitation rates (i.e. return-to-creel) in Idaho’s predominant put-and-take fisheries has been lacking. Total hatchery production is an insufficient measure to determine whether hatcheries are successful. Instead, hatchery success should be measured in terms of contribution to harvest (Blankenship and Daniels 2004). Recent IDFG studies have begun to evaluate return-to-creel on a statewide basis using angler-caught tagged fish (Meyer et al. 2010). These evaluations were mainly intended to evaluate regional fisheries management objectives and establish typical exploitation rates for warm-water and cold-water fisheries. Meyer et al. (2010) estimated exploitation rates for hatchery catchable rainbow trout in four of the top-10 waters stocked but only six of the top-20 waters. While this represents a step in the right direction, only a handful of water bodies have been evaluated over several years (Table 2), so little is known about variation in return-to-creel rates between years in our major stocked fisheries. Given the current economic climate for IDFG hatchery funding, efforts must be made to ensure that hatchery programs remain efficient while producing a quality product for Idaho anglers.
One of the key metrics defining a “quality” hatchery trout should be measured in terms of
contribution to angler return-to-creel (either catch or harvest). More information on return-to-creel rates of catchable rainbow trout is currently needed. Exploitation rates of Idaho’s most prominent stocked fisheries could identify locations were catch objectives are met or where stocking is not providing the intended benefit. This information could identify underperforming fisheries or poor fish performance. Decisions about effective allocation of catchable trout could subsequently improve the efficiency of the resident hatchery system and directly benefit anglers by increasing return-to-creel of catchable trout. This type of monitoring and evaluation program will be critical to guide the decision-making process and implement changes in allocating catchable rainbow trout production.
In addition to the primary goal of determining exploitation rates for major catchable trout
fisheries, evaluating methods to increase returns-to-creel is also important. Rearing conditions
3
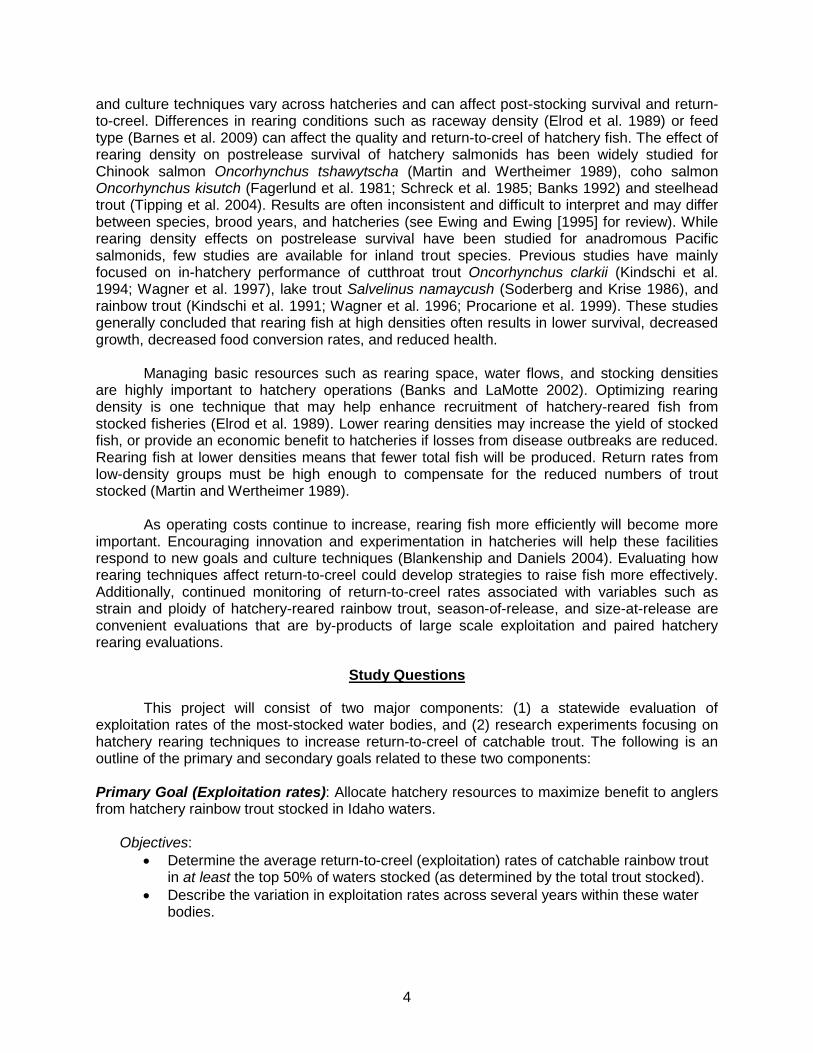
and culture techniques vary across hatcheries and can affect post-stocking survival and return-to-creel. Differences in rearing conditions such as raceway density (Elrod et al. 1989) or feed type (Barnes et al. 2009) can affect the quality and return-to-creel of hatchery fish. The effect of rearing density on postrelease survival of hatchery salmonids has been widely studied for Chinook salmon Oncorhynchus tshawytscha (Martin and Wertheimer 1989), coho salmon Oncorhynchus kisutch (Fagerlund et al. 1981; Schreck et al. 1985; Banks 1992) and steelhead trout (Tipping et al. 2004). Results are often inconsistent and difficult to interpret and may differ between species, brood years, and hatcheries (see Ewing and Ewing [1995] for review). While rearing density effects on postrelease survival have been studied for anadromous Pacific salmonids, few studies are available for inland trout species. Previous studies have mainly focused on in-hatchery performance of cutthroat trout Oncorhynchus clarkii (Kindschi et al. 1994; Wagner et al. 1997), lake trout Salvelinus namaycush (Soderberg and Krise 1986), and rainbow trout (Kindschi et al. 1991; Wagner et al. 1996; Procarione et al. 1999). These studies generally concluded that rearing fish at high densities often results in lower survival, decreased growth, decreased food conversion rates, and reduced health.
Managing basic resources such as rearing space, water flows, and stocking densities
are highly important to hatchery operations (Banks and LaMotte 2002). Optimizing rearing density is one technique that may help enhance recruitment of hatchery-reared fish from stocked fisheries (Elrod et al. 1989). Lower rearing densities may increase the yield of stocked fish, or provide an economic benefit to hatcheries if losses from disease outbreaks are reduced. Rearing fish at lower densities means that fewer total fish will be produced. Return rates from low-density groups must be high enough to compensate for the reduced numbers of trout stocked (Martin and Wertheimer 1989).
As operating costs continue to increase, rearing fish more efficiently will become more
important. Encouraging innovation and experimentation in hatcheries will help these facilities respond to new goals and culture techniques (Blankenship and Daniels 2004). Evaluating how rearing techniques affect return-to-creel could develop strategies to raise fish more effectively. Additionally, continued monitoring of return-to-creel rates associated with variables such as strain and ploidy of hatchery-reared rainbow trout, season-of-release, and size-at-release are convenient evaluations that are by-products of large scale exploitation and paired hatchery rearing evaluations.
Study Questions
This project will consist of two major components: (1) a statewide evaluation of exploitation rates of the most-stocked water bodies, and (2) research experiments focusing on hatchery rearing techniques to increase return-to-creel of catchable trout. The following is an outline of the primary and secondary goals related to these two components: Primary Goal (Exploitation rates): Allocate hatchery resources to maximize benefit to anglers from hatchery rainbow trout stocked in Idaho waters.
Objectives:
• Determine the average return-to-creel (exploitation) rates of catchable rainbow trout in at least the top 50% of waters stocked (as determined by the total trout stocked).
• Describe the variation in exploitation rates across several years within these water bodies.
4
Secondary Goal (Hatchery Rearing Techniques): Increase hatchery production efficiency by modifying rearing practices to maximize return-to-creel rates.
Objectives: • Evaluate return-to-creel rates of rainbow trout raised at different densities at major
IDFG production facilities. • Compare return-to-creel rates of rainbow trout raised at different hatcheries at similar
densities and stocked at the same locations. o Do return-to-creel rates differ when raised under different rearing densities
within the same hatchery? o Do return-to-creel rates differ between hatcheries for fish raised under similar
densities? • Compare return-to-creel rates of different strains of rainbow trout at Hagerman
Hatchery.
Previous research has indicated tag returns can be highly variable across reservoirs and streams and across years, but current data for Idaho’s major catchable fisheries is limited. Teuscher et al. (1998) reported unadjusted tag return rates for catchable rainbow trout in 18 Idaho streams ranged from 7.5 - 42.5%, averaging 17.1%. Megargle and Teuscher (2001) estimated return rates of catchable rainbow trout in 16 Idaho waters between Hagerman, Nampa, and American Falls hatcheries in 1999 and 2000. Return rates were highly variable among locations, (15 - 73%), and showed significant year-to-year variation in return rates within stocking locations and hatcheries. Using high reward tags to establish reporting rates, Meyer et al. (2012) found reporting rates for hatchery rainbow trout (across multiple water bodies) ranged from 41.0% - 56.8% across three years. Given the inherent variation in tag returns between locations and years, this program should proceed for at least five years, and possibly more. Several years of data may be needed to encompass random yearly variation in exploitation rates of the most-stocked fisheries.
METHODS
Study Sites
Study sites were selected based on data in the 2010 Default Catchables Request list. Waters were ranked according to total number of catchable rainbow trout planted annually and chosen to evaluate locations that comprise at least 50% of the total catchable rainbow trout stocked annually (Table 1). Many study sites played a dual role in evaluating exploitation rates, as well as being used for one or more of the following experiments on rearing density treatments, comparisons between hatcheries, strain evaluations, comparisons between seasons of release, and comparisons of length and length rank at release. Additional waters were added, as resources allowed, to evaluate to the 60% stocking level and to add additional waters to increase sample sizes for rearing density comparisons. Exploitation was evaluated as both “total caught” (any fish kept or released) and “harvested” (only fish that were kept).
When taken individually, community ponds do not receive enough fish to be considered
in the “Top-50%,” but they account for the most catchable rainbow trout stocked annually when combined (Table 1). Therefore, a statewide assessment of return-to-creel across community ponds was deemed necessary. Regional Fishery Managers from each Region supplied a list of small ponds with general harvest regulations managed as short-term put-and-take fisheries, often located in or near populated areas. This list was stratified into low/medium/high groups
5

based on perceived harvest, and tags were distributed to include a subsample of ponds in most regions on a three-year rotation (Table 3).
Rearing Density Study
Rainbow trout for the rearing density experiments originated as eggs purchased from Troutlodge Inc., an all-female triploid rainbow trout stock commonly used in IDFG facilities. Density trials were conducted at the three major facilities that produce catchable trout: Hagerman, Nampa, and American Falls hatcheries. Most IDFG facilities set a target maximum density index (DI) value of 0.3 lbs/ft3/inch of fish, based on the recommendations of Piper et al. (1982) and past experience. Rearing density treatment values were assigned low/medium/high as 50%, 75%, and 100% of the target maximum density index value. Therefore, the rearing density index values for the low/medium/high treatments were 0.15, 0.23, and 0.30, respectively. Because of space limitations in 2011, there were only two treatment groups, low (0.15) and high (0.30), at Hagerman Hatchery. All three treatment groups were administered at Nampa and American Falls hatcheries. Rearing density groups were not to exceed the specified maximum treatment density index for each treatment during the rearing period. As fish grew and densities increased, fish were extended into lower raceway sections to avoid exceeding the specified maximum values. Treatment densities were assigned to individual egg lots and carried through one entire raceway, so that only a single treatment was raised in each raceway. The approximate number of fish for each treatment raceway was first established using egg counts. Treatment lots were then inventoried at the fry stage using pound-counts when transferred from hatching containers to outside raceways, and when moved between raceways. At Nampa Hatchery, two groups of “normal” production fish were included in the comparison as a control. However, the high density rearing groups from all three facilities mimicked typical normal rearing densities at each facility.
Rearing density treatment groups were raised using culture techniques standard to each
facility. Raceway densities and fish sizes were monitored closely to minimize size differences between treatment groups and hatcheries. Feeding rates were adjusted using monthly pound counts and feed projections to adjust growth to target size of 3 fish/lb at 10 inches at stocking. Feed projections at each hatchery were done using the Hatchery Constant (HC) method (Piper et al. 1982) with ΔL = 0.025 – 0.033 to target 1 inch of growth per month. Projections were adjusted to reflect changes in loading rates from mortalities and stocking events. All facilities fed treatment groups the floating commercial trout diet (Rangen Inc. EXTR 450). Feed size was adjusted for fish length based on feed guidelines provided by Rangen Inc.
Each hatchery’s rearing environment is outlined below. In addition to evaluating rearing
densities, the study design and repetition at Nampa, American Falls, and Hagerman hatcheries allowed us to compare returns between these three hatcheries as well.
American Falls Hatchery
Rainbow trout were reared on 12.8°C spring water in single-pass fashion. Fry were started in concrete vats (17.5’ x 4’ x 2.5’) and fed using a combination of hand-feeding and belt-feeders. After reaching approximately 200 fish/lb, fish were inventoried using pound counts and moved to outdoor concrete raceways (8’ x 200’ x 2’ sections). Fish were reared in these raceways and hand-fed for the remainder of the rearing period.
6

Hagerman Hatchery
Density treatment groups were reared on the Tucker Spring water source (15°C). Fry were started in indoor concrete vats (14’ x 2.7’ x 2’). After reaching 1.80 inches, fish were inventoried using pound counts and moved to small outdoor concrete raceways (100’ x 3.6’ x 1.8’). After reaching 3 inches, fish were again inventoried and moved to large concrete raceways (8’ x 100’ x 2’ sections). Upon reaching 8 inches, fish were again inventoried and moved to large concrete raceways (12’ x 100’ x 2’ sections), where they were raised for the remainder of the rearing period. Fish were fed by hand until reaching 4 inches in the large raceways, at which time they were fed mechanically with a tractor.
Nampa Hatchery
Nampa Hatchery raised fish on single-pass water from a spring source at 15°C. Density treatment groups were hatched into small concrete outdoor raceways (5’ x 25’’ x 2’ sections) and fed using a combination of hand-feeding and belt feeders on a 12-hour timer. After reaching 50-75 fish/lb, fish were inventoried using pound counts and moved to large outdoor concrete raceways (12’ x 100’ x 2’ sections) and hand-fed for the remainder of the rearing period.
Strain Evaluation
Five water bodies were used to evaluate two different strains of hatchery rainbow trout. Mann and Dierkes lakes as well as Mountain Home, Cascade, and Magic reservoirs were stocked with both Hayspur diploids and Clearsprings triploids. All fish were reared at Hagerman Hatchery under similar rearing conditions, and release groups for each strain were of similar size. All releases were done in the fall of 2011 between early October and early November.
Tagging
The majority of catchable rainbow trout raised in IDFG facilities are all-female rainbow trout that originated as eggs purchased from Troutlodge, Inc. (TT). The Hayspur Hatchery broodstock facility also supplied a significant portion of triploid catchable trout eggs (T9), though not as many as the TT group (Table 1). This resulted in a mix of TT and T9 evaluations, depending on which lots were normally scheduled to stock the evaluated waters (Table 1).
Trout were crowded within raceways, then collected with dip nets to be tagged.
Crowding fish ensured a random sample of fish from the entire raceway and reduced size-selected bias. Trout were individually measured for total length (mm) and tagged using 70 mm (51 mm of tubing) fluorescent orange Floy® FD-68BC T-bar anchor tags treated with algaecide. By taking lengths of all tagged fish, we were also able to evaluate effects of size-at-release on tagging returns, since fish were released within a day of tagging. All fish greater than 160 mm in a sample were tagged to reduce bias. Trout were returned to submerged enclosures or empty raceway sections and allowed to recover overnight. Tagged trout were then loaded by dip net onto stocking trucks and transported to stocking locations. Mortalities and shed tags were collected and recorded before loading fish for transport. After stocking, truck tanks were checked for shed tags.
Site-specific exploitation rates were determined using the normal requested stock of fish
whenever possible, originating from the typical facility. In these locations, fish (non-density trial) were marked from the normal production lot raceways. Tagged fish were loaded along with the total stocking load, allowed to mix, and were stocked using standard release methods. Fish from
7
the rearing density trial were tagged from the respective experimental raceways, and then combined and loaded with the normal lot of fish scheduled for that stocking event. For additional comparisons, some hatcheries stocked density trial fish in locations they normally do not stock. In these cases, tagged fish were transported alone without additional production fish. Anchor tags were labeled with “IDFG” and tag reporting phone number (IDFG 1-866-258-0338) on one side, with the tag number on the reverse side. Anglers could report tags using the IDFG “Tag-You’re-It” phone system and website, as well as at regional IDFG offices and by mail.
Meyer et al. (2012) estimated average non-reward tag reporting rates for hatchery trout
in Idaho at about 49.4% with year/site-specific ranges from 33.5 to 75.2%. The wide range observed suggests reporting rates at individual water bodies may continue to vary widely. Using reward tags to correct for tag return rates over time can help reduce this inaccuracy and ensure exploitation rates are accurately calculated. Reward tags were used to monitor potential declines in tag reporting rate that can occur over time if anglers lose interest or become “swamped” by too many tags (Henny and Burnham 1976). Additionally, few tags have been used in evaluating return-to-creel from community ponds, so whether the average reporting rate differed from other water types was unknown. A subset of waters was chosen to receive reward tags in addition to standard non-reward tags. In locations that received reward tags, rewards were distributed at a constant rate of 10% of the total tags planted. Reward tags were identical to non-reward tags in size, shape and color, but contained additional text (“Reward”) and the amount (“$50”). Tags of $50 were used because they have shown sufficiently high reporting rates (88.4%) for catchable rainbow without the added cost of $100 or $200 tags (Meyer et al. 2012).
Most stocked waters receive several plants over the course of the fishing season. Tags
were distributed to characterize average return rates over the fishing season more accurately. Most lakes and reservoirs were stocked with a large plant of trout in spring, followed by a second smaller plant in fall. We distributed tags during spring and fall stocking events to capture both stocking events. Other locations were stocked more frequently (community ponds, rivers). For these waters, we randomly chose one month within each quarter and distributed tags evenly across those months. Typically, 400 tags (plus any reward tags at a 10% rate when used) were stocked for exploitation rates. In smaller waters, we reduced the number of tags in a given plant to no more than 10% of the total fish stocked to avoid “swamping” anglers with tags. We used a similar tagging protocol for the rearing density trial groups. We tagged 200 fish from each treatment group per stocking event. In some cases (Nampa Hatchery), we had the opportunity to tag additional groups of normal production rainbow trout (n = 200) for added comparisons.
Data Analysis
Angler tag return rate (λ) was estimated using the relative reporting rate of non-reward tags relative to that of high-reward tags (Pollock et al. 2001). The associated variance was calculated according to Henny and Burnham (1976) and used to generate 90% confidence intervals. Statewide average reporting rate for rainbow trout found in Meyer et al. (2012) was calculated using $100 and $200 reward tags,
NtNrRtRr
//
=λ
where Rt and Rr are the number of standard tags released and reported, respectively. Nt and Nr are the number of high-reward tags released and reported, respectively. We were concerned
8
that tag reporting rates may have changed over time from previous studies, and that the average tag reporting rate might be different for heavily fished community ponds. We calculated tag reporting rates separately for community ponds (where rewards were used) and all other waters. Reporting rates (based on $50 tags) were then corrected to account for the fact that only about 88.4% of $50 tags are actually reported, using the data of Meyer et al. (2012). Angler tag return rate was only based on tag returns from waters where both non-reward and reward tags were stocked simultaneously (always a 10:1 ratio)
We calculated exploitation within one year (365 days) after stocking according to the
methods of Meyer et al. (2010). The annual unadjusted harvest rate (u) was calculated as the number of non-reward tagged fish reported as harvested within one year of tagging, divided by the number of non-reward tags released. Unadjusted harvest and total catch were adjusted (u’) by incorporating the average angler tag reporting rate (λ), first year tag loss (Tagl), and tagging mortality (Tagm) for rainbow trout tagged as part of this study. Extensive Floy®-tagging from 2006 to 2009 presented in Meyer et al. (2010) found values for all three variables of λ = 49.4, Tagl = 8.2%, and Tagm = 0.8%. Estimates were calculated for each individual stocking event using the formula:
𝑢′ =
𝑢𝜆(1 − 𝑇𝑎𝑔𝑙)(1 − 𝑇𝑎𝑔𝑚)
Variance for the denominator in the above equation was estimated using the
approximate formula for the variance of a product in Yates (1953). Variance for u’ was calculated using the approximate formula for the variance of a ratio (Yates 1953) and used to derive 90% confidence intervals. A more complete description of these methods and the associated formulas is presented in Meyer et al. (2010). Because some anglers release fish voluntarily, exploitation estimates may not necessarily characterize the utilization of fish by anglers (Quinn 1996). To account for catch-and-release in addition to harvest, we also calculated “total catch.” For total catch, we changed u’ to include the total fish caught for each release group, including those harvested and released. Calculations were otherwise performed as described above.
We compared tag returns across rearing densities, hatcheries, strain, seasons-of-release, and size-at-release with multiple ANOVA and Tukey’s multiple comparisons using Proc GLM with α = 0.1 (SAS 9.2). The models included angler catch as the dependent variable. Sample size for comparisons was based on individual water bodies as the unit of observation. Initial analyses indicated second- and third-order interaction terms were not significant, so we limited our analyses to include only first-order interaction terms.
RESULTS
Statewide Exploitation
In 2011, 33,359 nonreward tagged hatchery rainbow trout were released across 49 water bodies statewide with 202 individual tag groups (Table 1 and 4). By November 1, 2012, anglers returned 4,780 of these tags (within 365 days of each individual plant). Harvest and total catch varied widely (0-100.0%) across all water bodies. Table 3 provides detailed results by IDFG Region for each water body in this study, by stocking event. On average, statewide harvest and total catch (± 90% C.I.) for hatchery catchable rainbow trout across the waters we evaluated was 18.7% (± 4.0%) and 26.0% (± 5.5%), respectively, for all tags released in 2011
9

and reported within 365 days of release. During 2011, tagged rainbow trout were released into 16 community ponds over 46 tagging events (which included Wilson Springs ponds). On average, harvest and total catch for these community ponds was 35.9% (± 8.0%) and 49.8% (± 10.9%), respectively. However, estimated harvest for individual tag groups varied widely across ponds, ranging from 0% to 100% (Table 3). Catchable trout in community ponds and rivers were caught quickly after stocking. The mean and median days-at-large for community ponds were 17 and 7 days, respectively and for rivers 20 and 9 days, respectively. Catchables in lakes and reservoirs had more of a delayed catch with mean and median days-at-large of 89 and 53 days, respectively (Figure 1).
The statewide average total length (± 95% C.I.) of catchable rainbow trout tagged during
2011 was 257 ± 0.3 mm (10.1 in) when considered across all waters and hatcheries. However, total length varied among hatcheries (Figure 2), and was likely influenced by tagging date (later tagged fish being larger), and the rearing hatchery of origin. Total length of tagged catchable trout was less variable across Regions, with Region 1 having slightly shorter fish, and Region 6 having slightly longer fish (Figure 3).
Rearing Density Trial
Rearing density index values fluctuated over time during the rearing period as fish grew and as rearing space was adjusted. Raceway volume was adjusted over time to prevent treatment groups from exceeding treatment densities. On average, treatment densities were below the specified maximum density values of 0.15, 0.23, and 0.30 for the low/medium/high-density treatments (Table 5). Densities at American Falls and Hagerman hatcheries were consistently below specified treatment values (Figure 4, Figure 5), while density index values at Nampa Hatchery were the closest to the specified treatments (Figure 6). Rainbow trout included in the density rearing experiment ranged in size from 242 mm to 258 mm at the time of stocking, with slight differences in average length between density treatment groups. At all three hatcheries, low-density fish were slightly longer than both medium- and high-density fish (Table 5), with the difference being most pronounced at Nampa Hatchery (15 mm). However, when combined across treatments, overall mean length at stocking was similar across American Falls, Hagerman, and Nampa hatcheries (Table 5).
Mean total catch of rainbow trout was significantly different across rearing densities (P
<0.0001, F = 12.49, df = 3). The low density treatment had the highest total catch (25.5%) on average, and was significantly different from medium-density (21.0%) and high-density groups (20.0%). Mean total catch for the medium- and high-density groups were not statistically distinguishable. Water body was a significant factor (P <0.0001, F = 90.37, df = 19) in the model, indicating much of the variation in total catch was due to inherent differences among water bodies. Mean total catch of rainbow trout was also significantly different across hatcheries (P <0.0001, F = 34.01, df = 2). Total catch was similar between Hagerman and American Falls hatcheries (21.5% and 23.6%), but was significantly different from Nampa Hatchery (13.5%) (Figure 7). However, the model included a significant interaction between water body and rearing hatchery, indicating that the return rate by hatchery was influenced by the waters each hatchery stocked.
Strain Evaluation
Five water bodies were used to evaluate Hayspur diploid and Clearsprings triploid catchable rainbow trout. Overall, mean total catch for the Hayspur and Clearsprings groups were 17.0% and 16.6%, respectively. Differences in meant total catch were not significant
10

between the two strains. Comparisons of harvest and total catch for the five water bodies can be found in Table 6.
Season of Release
We analyzed return rates across season of release for spring (March - May), summer (June - August), and fall (September - November) releases. Only two water bodies included releases during the winter (December - February), so we excluded winter releases from the analysis. Catch rates differed significantly across release seasons (P <0.0001, F = 48.34, df = 2). For all water body types combined, summer release groups had the highest catch rates (31.1%) followed by fall (27.4%) and spring (22.2%). However, season of release also had a significant interaction with hatchery and water body type. Using Tukey’s HSD Test, summer, spring, and fall seasons were all significantly different from each other. When rivers and community ponds were removed, the relationship was maintained with summer (26.3%) still having the highest total catch rates followed by fall (21.5%) and then spring (20.2%). Summer returns remained significantly higher than spring and fall returns, but fall and spring were no longer statistically different.
Size and Rank at Release
Length of fish at tagging ranged from 100 to 425 mm, with 90% of fish between 212 and 301 mm. Length at tagging varied across release groups, and we evaluated both length at tagging and a fish’s percent length rank within a release group. Length and rank were binned into 25 mm and 10% groups, respectively. From 200 mm (about 8 inches) to 305 mm (about 12 inches) there was roughly a 5% increase in catch rates for each 25 mm (1 inch) increase in length at tagging. This relationship was very consistent regardless of rearing hatchery, rearing density, season of release or water body type (Figure 8). Individual’s percent length rank within a release groups did not show a consistent correlation to catch. At smaller sizes (8 to 9 inches) there appeared to be an inverse relationship between percent length rank and catch, with lower ranking fish being reported at higher rates than moderate to longer lengths (10 to 12 inches). This relationship varied depending on water body type (Figure 9) and the inverse relationship was stronger for rivers and community ponds. Because of the apparent differences in tag returns by length and rank between lakes/reservoirs and community ponds/rivers, we ran our General Linear Model with only lakes/reservoirs data (since they represent the majority of release water bodies). The main factors were rearing hatchery, binned length, and binned rank. The model indicated that catch rates of fish in different length groups were significantly different (P <0.0001, F = 3.08, df = 11) while catch rates by percent rank did not differ significantly. However, there was a significant interaction between rearing hatchery and length group, indicating differences in catch by length groups may not be consistent across hatcheries.
Tag Reporting Rate
We released $50 reward tags across 26 waters, with seven of these waters considered as community ponds. The statewide overall average tag reporting rate for catchable hatchery rainbow trout using nonreward tags was 47.6%. When community ponds were removed, this statewide average reporting rate was slightly higher (48.5%), while the reporting rate at community ponds alone was 46.2%. These results suggest that the tag reporting rate is slightly lower for community ponds, but probably does not differ significantly.
11
DISCUSSION
Statewide Exploitation
Our estimates of overall statewide harvest (18.7%) and total catch (26.0%) of hatchery catchable trout are slightly higher than those previously reported by Meyer et al. (2010) (15.7% and 22.8%). This is reasonable, given that their estimate was based on 18 waters over 4 years, and mainly included larger reservoirs, which generally show lower exploitation rates. Our more recent estimates include several community ponds, which probably increased the average exploitation rate statewide (Table 4).
Estimated harvest for community ponds varied widely across different ponds. No tags
were returned from several ponds (Freedom Park, Rupert Gravel, Connor ponds) while other locations had harvest as high as 100.0% for some release groups (Wilson Ponds). These results indicate a highly variable rate of urban pond use, but overall urban pond catch rates (49.8%) were over double the catch rates for lakes, reservoirs, and rivers combined (22.9%). These results indicate that overall, community ponds play an important role in Idaho’s fishery management and as a whole provide an efficient fishing opportunity for Idaho anglers.
The mean number of days-at-large for catchables released into community ponds (17
days) and rivers (20 days) was much lower than for lakes/reservoirs (89 days). Most community ponds are small water bodies that receive a high amount of fishing effort. The high amount of effort coupled with high total catch rates results in the majority of fish being caught in a short amount of time. In rivers, survival post stocking likely plays a large role. High and Meyer (2009) found that 85% of radio tagged and 75% of T-bar anchor tagged catchable rainbow trout were no longer available to anglers four weeks post-stocking in an Idaho river. These results indicate that although overall total catch rates for rivers are relatively low (when compared to community ponds), the days-at-large also remain low because fish that aren’t caught in a short period of time have a very low rate of survival. Conversely, survival in the lakes and reservoirs we studied appears to be higher, as the mean days-at-large was equivalent to almost three months. This was further emphasized when looking at the preliminary returns of fish tagged and released in 2011, post 365 days-at-large. These results, through mid-November of 2012, show catch rates of 0.0% for rivers, 0.1% for community ponds, and 1.4% for lakes/reservoirs. These results are preliminary and incomplete, as some release groups were just entering their second year at large and a complete analysis of the 365 to 730 days-at-large will not be possible until November of 2013.
Rearing Density
The effects of hatchery rearing density on salmonids are well documented in the literature. Increased rearing density is associated with detrimental effects. Decreased growth, weight, food conversion efficiency, and survival have been shown to occur during hatchery rearing for coho salmon (Fagerlund et al. 1981) and cutthroat trout Oncorhynchus clarkii (Kindschi et al. 1994; Procarione et al. 1999). Fagerlund et al. (1981) reported that juvenile coho salmon raised at higher densities showed significant decreases in weight, length, condition factor, and food conversion efficiency, as well as higher mortality. Kindschi and Koby (1994) found similar results, with high densities (0.48–2.30 lb/ft3/in) adversely affecting weight gain, feed conversion, survival, and fish health in cutthroat trout reared over 18 weeks. Procarione et al. (1999) showed rainbow trout reared at high densities (over 4 weeks) had lower growth and food conversion rates, but that high density itself was probably not a chronic stressor. Soderberg and Krise (1986) studied growth and survival of lake trout raised in circular tanks at
12

four densities: 0.25, 0.50, 1.0, 2.0 lb/ft3/in. They found mortality was higher at the highest density, but found no differences in growth over the 97 day experiment. Most published studies have focused on the in-hatchery impacts to fish health and growth, generally over time frames much shorter than the 10-12 months needed to produce a catchable-sized rainbow trout, with little study on how rearing conditions affect post-stocking survival.
Some studies have examined how rearing density may affect post-stocking survival of
salmonids, with most studies focusing on anadromous salmon species and little on rainbow trout. Elrod et al (1989) found post-stocking survival of fingerling lake trout reared at a standard density was only 76% of those raised under low densities. Ewing and Ewing (1995) reported that increased hatchery rearing density produced lower percent survival to adulthood for Chinook salmon in 14 of 15 brood years, but not in coho salmon. The authors speculated that longer rearing time at higher density could impose higher stress on hatchery fish. Generally, rearing density was negatively correlated with the percent survival of salmon smolts and subsequent adult returns. However, in most studies, the higher number of smolts produced offset the effects of greater density, providing more returned adults (Martin and Wertheimer 1989; Banks 1992; Banks and LaMotte 2002). Contrary to most salmon studies, Tipping et al. (2004) found no difference in adult survival of steelhead raised under reduced raceway loading and density. These authors recommended raising more fish (same raceways, higher densities) to increase adult steelhead return rates.
In our study, total catch of catchable rainbow trout were highest for fish reared at lower
densities, but the effect seemed most pronounced at Hagerman Hatchery (Figure 10). Hagerman and American Falls hatcheries had similar average total catch of catchable rainbow trout (21.5% and 23.6%), and were significantly different from Nampa Hatchery (13.5%). However, we must be careful when interpreting these results, as the model included a significant interaction of water and rearing hatchery, indicating that differences between hatcheries were not consistent across water bodies. Therefore, we cannot make general conclusions about the relative performance between hatcheries without considering the waters in which fish were stocked. Effects of rearing density probably interact with other factors such as water flow, disease loading, and water quality. These factors vary among hatcheries and complicate the relationship of rearing density to angler return rates, as certain relationships may only be applicable at individual facilities.
Results indicate that fish raised at a lower density actually return to anglers at higher rates. When looking at the relative differences between treatments, the total catch of low-density treatment fish was 21.6% higher than high-density fish, on average. Total catch for normal production was lower than the low-density treatment (Figure 10) and similar to med/high treatment groups, but differences were not statistically significant. This was most likely a result of the limited sample size (n = 6) and high variation in returns across waters. Results from the normal production group were most similar to the high-density group, which was not surprising given the fact that these two groups experienced similar rearing density conditions during rearing. Increased survival associated with lower rearing density is well documented among studies of salmon returns (Martin and Wertheimer 1989; Banks 1992; Ewing and Ewing 1995; Banks and LaMotte 2002). However, as Martin and Wertheimer (1989) cautioned, “the adult return rate must be great enough to compensate for the reduced number of smolts produced.” In our study, the increase in total catch is not proportional to the decline in numbers of fish raised. A 50% decline in the number of fish raised would need to produce a 100% increase in total use to offset the fact that half as many fish were raised. Additionally, while loading fish at lower densities reduced overall feed costs (fewer fish to feed), overall operational costs are mostly unchanged and the cost-per-fish likely increased due to the fact that most facilities have
13

fixed costs associated with pumping water and mechanized feeding, regardless of the rearing density.
After stocking was completed, American Falls Hatchery staff suggested that raceway
inventories had been inaccurate, and that the calculated density index values were incorrect. Fewer fish than projected remained at the end of the rearing period, suggesting actual rearing densities were lower than calculated. This was presumably a result of errors made during the inventory process when moving fish from the early rearing vats to the outside raceways. American Falls staff used stocking records of total pounds of fish stocked to back-calculate actual rearing densities in the treatment raceways. The average low and medium density index values did not differ between the back-calculated and projected values. However, back-calculations from stocking records indicated the average density index for the high-density group was 0.19 instead of 0.16 as projected during rearing. This suggests that the high-density group was actually raised at higher density than previously thought, making it much closer in fact to the prescribed separations and maximum treatment values intended. This observation also corroborates the observed mortality and oxygen stress in the high-density rearing group.
American Falls Hatchery experienced some low dissolved oxygen, presumably stressing fish and causing some mortality in the high-density groups. In mid-March 2011, Tim Klucken (Hatchery Manager) reported oxygen levels in the lower high-density treatment raceway (#13) had reached 5.6 ppm. Fish were “gilling” on the bottom and riding high in the water column, presumably under stress from low oxygen. He had earlier anticipated a problem might arise when he reported his concern about the flow index values exceeding 1.4 lbs/GPM/inch, above the normal recommended levels of 1.25 lbs/GPM/inch. Records indicate fish were above the recommended flow index values for several weeks near the end of the rearing cycle (Figure 4) because of limited water flows. At the time, more raceways were filled to meet production demands, spreading out available water across more raceways and reducing flows in individual raceways. This may have caused added stress on this experimental group, which could have affected post-stocking performance. American Falls Hatchery was the only hatchery where treatment groups exceeded recommended flow index values (Figures 4, 5, 6). Flows may be more critical than rearing densities at this station, and dissolved oxygen may be the limiting factor as loading increases.
As expected, rearing densities fluctuated greatly over the rearing period, as well as between hatcheries. At American Falls Hatchery, separation of the density treatments did not achieve the specified goal of 50%/75%/100% of the maximum treatment value. Average density index for the high-density group was on average only 0.16 (Table 5). The low and medium-density treatments were at 63% and 81% of the maximum, respectively, showing slightly above the desired treatment values. Overall, fish were reared at much lower densities at American Falls compared to Nampa and Hagerman hatcheries, mainly because water flow became limiting before treatment densities could be achieved. On average, density index values at Hagerman Hatchery were below the specified maximum treatment levels, but maintained excellent separation between treatments. The low-density was 50% of the high-density group, so we are confident that a real difference in treatments was applied between groups. Nampa Hatchery staff did well in keeping treatment densities at or below specified maximums (Figure 6). Nampa Hatchery achieved average density index values closest to the specified treatment levels, and maintained good separation between high, medium, and low treatments. The low and medium-density treatments were 52% and 80% of the maximum average density (Table 5), getting close to the desired 50% and 75% levels. Additionally, we tagged some groups of normal production at Nampa Hatchery. On average, Nampa Hatchery normal production fish had density index values higher than the high-density treatment groups (0.3) during some
14

portion of the rearing period (Figure 6). However, this trend was not consistent as illustrated by the consistent higher densities of Raceway C6 but not Raceway C3 (Figure 6). The highest densities usually occur most often in April through June, when fish have reached their largest size and stocking has not begun in earnest.
This density work was repeated again in 2012 and tags from those treatments were
being recovered at the time of this report. The second year of the density study will be reported in the 2013/2014 report.
Strain Evaluation
The 2011 comparison of Hayspur vs. Clearsprings rainbow trout was implemented by Hagerman Hatchery as an on-station evaluation of in-hatchery survival and disease resistance. Tagging to evaluate return-to-creel was later added to compliment the in-hatchery work. Unfortunately, there was an oversight as to the ploidy level of the two strains and the Hayspur strain was diploid while the Clearsprings strain was triploid. Numerous studies have compared survival of diploid vs. triploid trout and lower survival after stocking for triploid salmonids (compared to their diploid counterparts) has been found in all-female rainbow trout fry (Brock et al. 1994), fingerling rainbow trout (Simon et al. 1993) and fingerling coho salmon Oncorhynchus kisutch (Rutz and Baer 1996). Previous IDFG research using mixed-sex rainbow trout (Hayspur strain) in lakes and reservoirs found significantly lower catch rates of triploids relative to diploids in the same water bodies (Koenig and Meyer 2011). Overall, the return of triploid trout in alpine lakes in Idaho was low compared to diploid trout, with diploids accounting for 68% of the total marked fish caught. Generally, a 1.5-2:1 ratio of diploid:triploid returns can be expected for mixed-sex rainbow trout, based on several years of stocking and surveys (Koenig 2012). Releasing one strain that was diploid and one that was triploid likely confounded the results of this comparison.
For the 365 days post-release that we evaluated, there was no significant difference in
return-to-creel rates between the two strains. However, we are unable to determine if the Clearsprings triploid trout had lower post-release survival but higher catch rates, resulting in similar overall return-to-creel reporting to the Hayspur diploid group. In 2012, there were paired releases of diploid Hayspur and Clearsprings fish released, but some groups failed to receive tags (due to timing issues) resulting in a lower level of replication. Results of the on-station component of the evaluation were handled by Hagerman Hatchery and will be reported by that facility.
Season of Release
As part of the overall exploitation study, tagged trout releases occur throughout the year to encompass requested stocking schedules. We analyzed return-to-creel rates across season-of-release for spring, summer, and fall releases. Summer release groups had the highest catch rates followed by fall and then spring. These findings seem reasonable, given that fishing effort is likely highest in the summer months at most water bodies. This information will be important moving forward, as it may shape the timeframes for future stocking events at specific water bodies. For example, Chesterfield and Magic Valley reservoirs showed over a two-fold increase in return-to-creel rates from fall stockings when compared to spring/summer stockings, while Winchester Lake showed the opposite. If these types of water body-specific trends continue over time, stocking could be scheduled towards periods of higher return-to-creel rates, to improve overall catch rate of hatchery catchables.
15
Size and Rank at Release
On average, IDFG hatcheries met the goal of producing catchable rainbow trout at the requested 10-inch length. However, while the average length of catchable trout was achieved, length was variable within and between hatcheries. Length-at-stocking is influenced by tagging date, rearing hatchery, and the rearing period, all of which can affect size throughout the stocking season. Catchable rainbow trout from McCall, Sandpoint, Mullan, Sawtooth, and Clearwater hatcheries originate from Nampa Hatchery. Therefore, mean length at these facilities depends largely on the size distribution at Nampa Hatchery at the time fish are transferred for redistribution. Little growth is expected after fish reach redistribution facilities. Regional average length of catchable trout should be directly related to the stocking and rearing hatchery. In the case of Region 1, these fish were stocked from Mullan and Sandpoint hatcheries, redistributed originally from Nampa Hatchery in spring 2011 for stocking throughout the summer. The minimum length presented in Figure 2 and Figure 3 is slightly biased high, because we did not consistently tag fish less than 160 mm, though fish below 160 mm were rare. Variation in hatchery catchable rainbow trout length using current rearing techniques should be expected. Within any production lot, there is a genetic basis for slow growth in some fish (Westers 2001). Additionally, culture techniques to reduce size variation (such as hand-feeding, demand feeders, or grading) are not commonly employed in large IDFG facilities. Benefits from minimizing size variation in IDFG hatcheries have not been thoroughly evaluated.
Length of fish at tagging (and subsequent stocking) was highly correlated with angler
catch rates. We showed that from eight to 12 inches, there is about a 5% increase in catch rate per one inch increase in length at stocking. Similarly, Yule et al. (2000) showed a direct correlation between larger size-at-stocking and increased return-to-creel for hatchery catchable rainbow trout stocked into two reservoirs. However, raising larger fish comes with a cost. Future work in regards to the secondary objective of this research project (hatchery rearing techniques) should further evaluate the relationship between length/size-at-release and catch rates and explore rearing options that result in maximizing the size-at-release/rearing cost relationship as well as reduced size variation.
Tag Reporting Rate
At this time, the overall tag reporting rate does not appear to be changing much from that reported previously by Meyer et al. (2012). They found the nonreward average reporting rate for hatchery trout was 49.4%, which is only slightly higher than our findings (47.6%). We saw the average reporting rate actually decreased slightly when looking at community ponds, but that was based on a limited sample of only seven waters where reward tags were used. Further reward tagging in community ponds in 2012 should increase this sample size, which should provide more definitive evidence of whether the nonreward tag reporting rate differs significantly from the statewide average. If so, harvest and catch estimates could be calculated separately for community ponds to provide more accurate estimates in those waters. Additional reward tagging in 2012 across a greater range of waters will improve the resolution of tag reporting data statewide. Anecdotal observations by IDFG staff have suggested the statewide average reporting rate may be significantly different from local reporting rates, which could result in biased estimates of exploitation. If enough reward tags are returned, it may be possible to examine whether reporting rates differ across geographic regions of the state. Additionally, reporting rates of fish tagged in 2011 also appear to be correlated with fish size, with a higher reporting rate for larger fish, although preliminary analyses suggest that this effect will have a miniscule influence on exploitation estimates. However, this relationship will be further evaluated as more tag return data is accumulated.
16

RECOMMENDATIONS
1. Continue collecting and compiling tag returns. a. November 2013 will complete two years at large for the 2011 tag groups (analyze
carryover and return-to-creel over a longer period) and one year at large for 2012 tags (second round of data for 1 year post release returns).
2. Further evaluate statewide exploitation through continued tagging in release year 2013
across the top 50% to 60% of waters stocked. 3. Further evaluate hatchery rearing techniques to assess if decreased size variation and a
larger size-at-stocking are feasible rearing objectives resulting in a significant increase in return-to-creel.
17
ACKNOWLEDGEMENTS
We would like to acknowledge the hard work and dedication of Eric Herrera, Chris Sullivan, and Steve Elle for assisting with tagging fish. We would also like to thank Regional Managers for recommendations and help designing and implementing the study as well as Regional Staff for their assistance tagging as well. Additionally, we would like to thank Kevin Yelton and the staff at American Falls Hatchery, Chris Jeszke and the staff at Ashton Hatchery, Cassie Sundquist and the staff at Clearwater Hatchery, Joe Chapman and the staff at Hagerman State Hatchery, Pat Moore and the staff at Mackay Hatchery, John Rankin and the staff at Mullan and Sandpoint Hatcheries, Rick Alsager and the staff at Nampa Hatchery, Gene McPherson and the staff at McCall Hatchery, and Brent Snider and the staff at Sawtooth Hatchery for all their assistance tagging, rearing, and releasing fish. We would also like to thank Tony Lamansky and Art Butts for development and continued technical support of the Access database that stores all tagging events and returns. A big thank you goes to Liz Mamer, Kristi Stevenson, and Debi Jensen for all their hard work managing the database and the constant tag return information. We also thank Mike Peterson and Kevin Meyer for editing this report.
18
LITERATURE CITED
Banks, J. L. 1992. Effects of density and loading on coho salmon during hatchery rearing and after release. The Progressive Fish-Culturist 54:137-147.
Banks, J. L., and E. M. LaMotte. 2002. Effects of four density levels on tule fall Chinook salmon
during hatchery rearing and after release. North American Journal of Fisheries Management 64:24-33.
Barnes, M. E., G. Simpson, and D. J. Durben. 2009. Post-stocking harvest of catchable-sized
rainbow trout enhanced by dietary supplementation with a fully fermented commercial yeast culture during hatchery rearing. North American Journal of Fisheries Management 29:1287-1295.
Blankenship, H. L., and E. Daniels. 2004. A scientific and systematic redesign of Washington
state salmonid hatcheries. American Fisheries Society Symposium 44:561-572. Brock, I. V., P. A. Hansen, D. N. McBride, and A. C. Havens. 1994. Culture and performance of
triploid rainbow trout in Alaska. Transactions of the North American Wildlife and Natural Resources Conference 59:263-273.
Elrod, J. H., D. E. Ostergaard, and C. P. Schneider. 1989. Effect of rearing density on post-
stocking survival of lake trout in Lake Ontario. The Progressive Fish Culturist 51:189-193.
Ewing, R. D., and S. K. Ewing. 1995. Review of the effects of rearing density on survival to
adulthood of Pacific salmon. The Progressive Fish Culturist 57:1-25. Fagerlund, U. H. M., J. R. McBride, and E. T. Stone. 1981. Stress-related effects of hatchery
rearing density on coho salmon. Transactions of the American Fisheries Society 110:644-649.
Frew, T. S. 2010. Resident fish hatcheries 2010 annual report. Idaho Department of Fish and
Game, Annual Report 11-119, Boise. Henny, C. J., and K. P. Burnham. 1976. A reward band study of mallards to estimate band
reporting rates. The Journal of Wildlife Management 40(1):1-14. High B., and K. A. Meyer. 2009. Survival and dispersal of hatchery triploid rainbow trout in an
Idaho river. North American Journal of Fisheries Management 29:1797-1805. Kindschi, G. A., and R. F. Koby, Jr. 1994. Performance and oxygen consumption of Snake River
cutthroat trout reared at four densities with supplemental oxygen. The Progressive Fish Culturist 56:13-18.
Kindschi, G. A., C. E. Smith, and R. F. Koby, Jr. 1991. Performance of two strains of rainbow
trout reared at four densities with supplemental oxygen. The Progressive Fish Culturist 53:203-209.
19

Koenig, M. K., and K. A. Meyer. 2011. Relative Performance of Diploid and Triploid Catchable Rainbow Trout Stocked in Idaho Lakes and Reservoirs. North American Journal of Fisheries Management 31:605-613.
Koenig, M. K. 2012. Idaho Department of Fish and Game. Annual Performance Report Number
12-11. Boise. Martin, R. M., and A. Wertheimer. 1989. Adult production of Chinook salmon reared at different
densities and released as two smolt sizes. The Progressive Fish Culturist 51:194-200. Megargle, D. J., and D. T. Teuscher. 2001. Idaho Department of Fish and Game. Annual
Performance Report Number 01-49. Boise. Meyer, K. A., F. S. Elle, T. Lamansky, E. R. J. M. Mamer, and A. E. Butts. 2012. A reward-
recovery study to estimate tagged-fish reporting rates by Idaho anglers. North American Journal of Fisheries Management 32:696-703.
Meyer, K. A., F. S. Elle, T. Lamansky, and E. R. J. M. Mamer. 2010. Idaho Department of Fish
and Game, Annual Performance Report 10-12. Boise. Piper, R. G., I. B. McElwain, L. E. Orme, J. P. McCraren, L. G. Fowler, and J. R. Leonard. 1982.
Fish hatchery management. U.S. Fish and Wildlife Service, Washington, D.C. Pollock, K. H., J. M. Hoenig, W. S. Hearn, and B. Calingaert. 2001. Tag reporting rate
estimation: 1. An evaluation of the high-reward tagging method. North American Journal of Fisheries Management 21:521-532.
Procarione, L. S., T. P. Barry, and J. A. Malison. 1999. Effect of high rearing densities and
loading rates on the growth and stress responses of juvenile rainbow trout. North American Journal of Aquaculture 61:91-96.
Quinn, S. P. 1996. Trends in regulatory and voluntary catch-and-release fishing. Pages 152-162
in L. E. Miranda, and D. R. DeVries, editors. Multidimensional approaches to reservoir fisheries management. American Fisheries Society, Symposium 16, Bethesda, Maryland.
Rutz, D. S., and C. C. Baer. 1996. Comparative performance of stocked mixed-sex and all-
female rainbow trout and triploid coho salmon in landlocked lakes in Southcentral Alaska, 1994 and 1995. Alaska Department of Fish and Game, Fishery Data Series No. 96-23, Anchorage.
Schreck, C. B., R. Patino, C. K. Pring, J. R. Winton, and J. E. Holway. 1985. Effects of rearing
density on indices of smoltification and performance of coho salmon, Oncorhynchus kisutch. Aquaculture 45:345-358.
Simon, D. C., C. G. Scalet, and J. C. Dillon. 1993. Field performance of triploid and diploid
rainbow trout in South Dakota ponds. North American Journal of Fisheries Management 13:134-140.
Soderberg, R. W., and W. F. Krise. 1986. Effects of rearing density on growth and survival of
lake trout. The Progressive Fish-Culturist 48:30-32.
20
Teuscher, D., C. B. Alexander, J. C. Dillon, and D. J. Schill. 1998. Idaho Department of Fish and
Game, Job Performance Report 98-45. Boise. Tipping, J. M., J. B. Byrne, and T. D. Hillson. 2004. The effect of juvenile rearing density on
adult returns of summer steelhead. North American Journal of Aquaculture 66:319-324. Wagner, E. J., S. S. Intelmann, and M. D. Routledge. 1996. The effects of fry rearing density on
hatchery performance, fin condition, and agonistic behavior of rainbow trout Oncorhynchus mykiss fry. Journal of the World Aquaculture Society 27:264-274.
Wagner, E. J., T. Jeppsen, R. Arndt, M. D. Routledge, and Q. Bradwisch. 1997. Effects of
rearing density upon cutthroat trout hematology, hatchery performance, fin erosion, and general health and condition. The Progressive Fish Culturist 59:173-187.
Westers, H. 2001. Production. Pages 31-89 in G. A. Wedemeyer, editor. Fish hatchery
management, second edition. American Fisheries Society, Bethesda, Maryland. Yates, F. 1953. Sampling methods for censuses and surveys, Second Edition. Charles Griffin
and Co. Ltd., London. Yule, D. L., R. A. Whaley, P. H. Mavrakis, D. D. Miller, and S. A. Flickinger. 2000. Use of strain,
season of stocking, and size at stocking to improve fisheries for rainbow trout in reservoirs with walleyes. North American Journal of Fisheries Management 20:10-18.
21
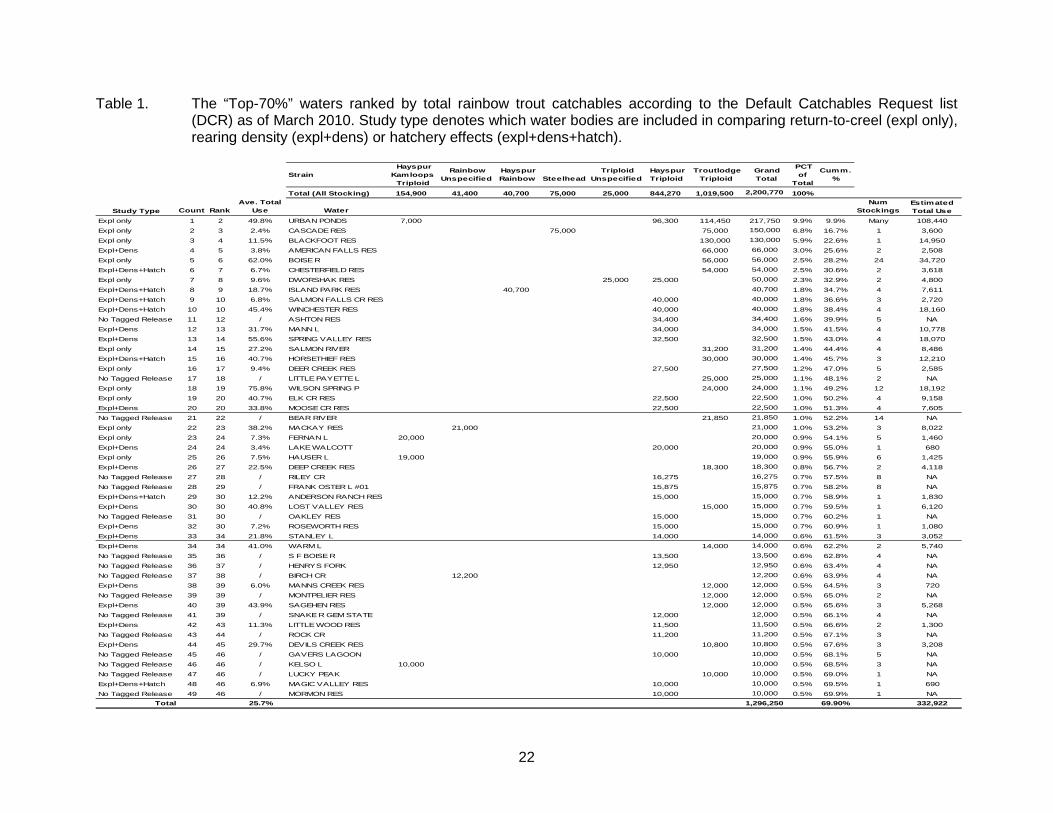
Table 1. The “Top-70%” waters ranked by total rainbow trout catchables according to the Default Catchables Request list (DCR) as of March 2010. Study type denotes which water bodies are included in comparing return-to-creel (expl only), rearing density (expl+dens) or hatchery effects (expl+dens+hatch).
Strain Hayspur
Kamloops Triploid
Rainbow Unspecified
Hayspur Rainbow
Steelhead
Triploid Unspecified
Hayspur Triploid
Troutlodge Triploid
Grand Total
PCT of
Total
Cumm. %
Total (All Stocking) 154,900 41,400 40,700 75,000 25,000 844,270 1,019,500 2,200,770 100%
Study Type Count RankAve. Total
Use WaterNum
StockingsEstimated Total Use
Expl only 1 2 49.8% URBAN PONDS 7,000 96,300 114,450 217,750 9.9% 9.9% Many 108,440Expl only 2 3 2.4% CASCADE RES 75,000 75,000 150,000 6.8% 16.7% 1 3,600Expl only 3 4 11.5% BLACKFOOT RES 130,000 130,000 5.9% 22.6% 1 14,950Expl+Dens 4 5 3.8% AMERICAN FALLS RES 66,000 66,000 3.0% 25.6% 2 2,508Expl only 5 6 62.0% BOISE R 56,000 56,000 2.5% 28.2% 24 34,720Expl+Dens+Hatch 6 7 6.7% CHESTERFIELD RES 54,000 54,000 2.5% 30.6% 2 3,618Expl only 7 8 9.6% DWORSHAK RES 25,000 25,000 50,000 2.3% 32.9% 2 4,800Expl+Dens+Hatch 8 9 18.7% ISLAND PARK RES 40,700 40,700 1.8% 34.7% 4 7,611Expl+Dens+Hatch 9 10 6.8% SALMON FALLS CR RES 40,000 40,000 1.8% 36.6% 3 2,720Expl+Dens+Hatch 10 10 45.4% WINCHESTER RES 40,000 40,000 1.8% 38.4% 4 18,160No Tagged Release 11 12 / ASHTON RES 34,400 34,400 1.6% 39.9% 5 NAExpl+Dens 12 13 31.7% MANN L 34,000 34,000 1.5% 41.5% 4 10,778Expl+Dens 13 14 55.6% SPRING VALLEY RES 32,500 32,500 1.5% 43.0% 4 18,070Expl only 14 15 27.2% SALMON RIVER 31,200 31,200 1.4% 44.4% 4 8,486Expl+Dens+Hatch 15 16 40.7% HORSETHIEF RES 30,000 30,000 1.4% 45.7% 3 12,210Expl only 16 17 9.4% DEER CREEK RES 27,500 27,500 1.2% 47.0% 5 2,585No Tagged Release 17 18 / LITTLE PAYETTE L 25,000 25,000 1.1% 48.1% 2 NAExpl only 18 19 75.8% WILSON SPRING P 24,000 24,000 1.1% 49.2% 12 18,192Expl only 19 20 40.7% ELK CR RES 22,500 22,500 1.0% 50.2% 4 9,158Expl+Dens 20 20 33.8% MOOSE CR RES 22,500 22,500 1.0% 51.3% 4 7,605No Tagged Release 21 22 / BEAR RIVER 21,850 21,850 1.0% 52.2% 14 NAExpl only 22 23 38.2% MACKAY RES 21,000 21,000 1.0% 53.2% 3 8,022Expl only 23 24 7.3% FERNAN L 20,000 20,000 0.9% 54.1% 5 1,460Expl+Dens 24 24 3.4% LAKE WALCOTT 20,000 20,000 0.9% 55.0% 1 680Expl only 25 26 7.5% HAUSER L 19,000 19,000 0.9% 55.9% 6 1,425Expl+Dens 26 27 22.5% DEEP CREEK RES 18,300 18,300 0.8% 56.7% 2 4,118No Tagged Release 27 28 / RILEY CR 16,275 16,275 0.7% 57.5% 8 NANo Tagged Release 28 29 / FRANK OSTER L #01 15,875 15,875 0.7% 58.2% 8 NAExpl+Dens+Hatch 29 30 12.2% ANDERSON RANCH RES 15,000 15,000 0.7% 58.9% 1 1,830Expl+Dens 30 30 40.8% LOST VALLEY RES 15,000 15,000 0.7% 59.5% 1 6,120No Tagged Release 31 30 / OAKLEY RES 15,000 15,000 0.7% 60.2% 1 NAExpl+Dens 32 30 7.2% ROSEWORTH RES 15,000 15,000 0.7% 60.9% 1 1,080Expl+Dens 33 34 21.8% STANLEY L 14,000 14,000 0.6% 61.5% 3 3,052Expl+Dens 34 34 41.0% WARM L 14,000 14,000 0.6% 62.2% 2 5,740No Tagged Release 35 36 / S F BOISE R 13,500 13,500 0.6% 62.8% 4 NANo Tagged Release 36 37 / HENRYS FORK 12,950 12,950 0.6% 63.4% 4 NANo Tagged Release 37 38 / BIRCH CR 12,200 12,200 0.6% 63.9% 4 NAExpl+Dens 38 39 6.0% MANNS CREEK RES 12,000 12,000 0.5% 64.5% 3 720No Tagged Release 39 39 / MONTPELIER RES 12,000 12,000 0.5% 65.0% 2 NAExpl+Dens 40 39 43.9% SAGEHEN RES 12,000 12,000 0.5% 65.6% 3 5,268No Tagged Release 41 39 / SNAKE R GEM STATE 12,000 12,000 0.5% 66.1% 4 NAExpl+Dens 42 43 11.3% LITTLE WOOD RES 11,500 11,500 0.5% 66.6% 2 1,300No Tagged Release 43 44 / ROCK CR 11,200 11,200 0.5% 67.1% 3 NAExpl+Dens 44 45 29.7% DEVILS CREEK RES 10,800 10,800 0.5% 67.6% 3 3,208No Tagged Release 45 46 / GAVERS LAGOON 10,000 10,000 0.5% 68.1% 5 NANo Tagged Release 46 46 / KELSO L 10,000 10,000 0.5% 68.5% 3 NANo Tagged Release 47 46 / LUCKY PEAK 10,000 10,000 0.5% 69.0% 1 NAExpl+Dens+Hatch 48 46 6.9% MAGIC VALLEY RES 10,000 10,000 0.5% 69.5% 1 690No Tagged Release 49 46 / MORMON RES 10,000 10,000 0.5% 69.9% 1 NA
25.7% 1,296,250 69.90% 332,922Total
22
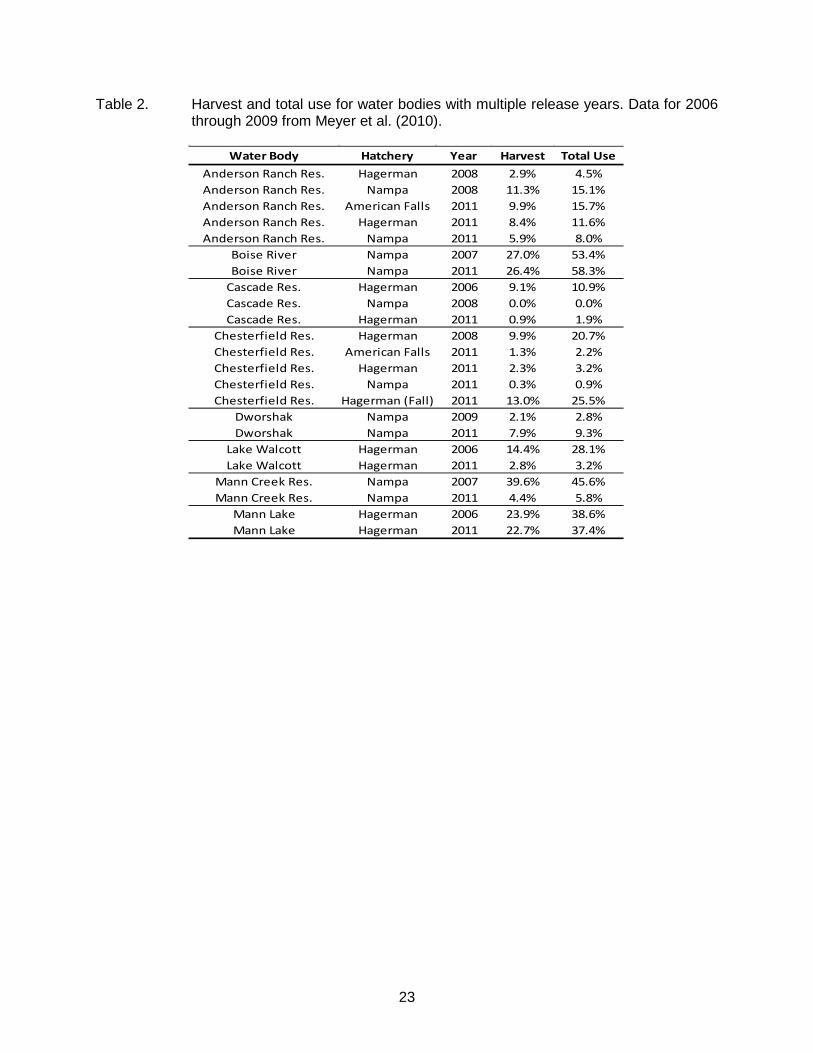
Table 2. Harvest and total use for water bodies with multiple release years. Data for 2006 through 2009 from Meyer et al. (2010).
Water Body Hatchery Year Harvest Total UseAnderson Ranch Res. Hagerman 2008 2.9% 4.5%Anderson Ranch Res. Nampa 2008 11.3% 15.1%Anderson Ranch Res. American Falls 2011 9.9% 15.7%Anderson Ranch Res. Hagerman 2011 8.4% 11.6%Anderson Ranch Res. Nampa 2011 5.9% 8.0%
Boise River Nampa 2007 27.0% 53.4%Boise River Nampa 2011 26.4% 58.3%
Cascade Res. Hagerman 2006 9.1% 10.9%Cascade Res. Nampa 2008 0.0% 0.0%Cascade Res. Hagerman 2011 0.9% 1.9%
Chesterfield Res. Hagerman 2008 9.9% 20.7%Chesterfield Res. American Falls 2011 1.3% 2.2%Chesterfield Res. Hagerman 2011 2.3% 3.2%Chesterfield Res. Nampa 2011 0.3% 0.9%Chesterfield Res. Hagerman (Fall) 2011 13.0% 25.5%
Dworshak Nampa 2009 2.1% 2.8%Dworshak Nampa 2011 7.9% 9.3%
Lake Walcott Hagerman 2006 14.4% 28.1%Lake Walcott Hagerman 2011 2.8% 3.2%
Mann Creek Res. Nampa 2007 39.6% 45.6%Mann Creek Res. Nampa 2011 4.4% 5.8%
Mann Lake Hagerman 2006 23.9% 38.6%Mann Lake Hagerman 2011 22.7% 37.4%
23

Table 3. List of waters, by Region and stratified by perceived harvest (low/medium/high), used to evaluate return-to-creel of hatchery catchable rainbow trout in “community ponds” statewide. Locations to receive tags were chosen to encompass most regions and assigned on a 3-year rotation with reward tags in each stratum. Tag numbers outlined with boxes indicate receiving reward tags.
Region Water Stocked Tags 2011 Tags 2012 Tags 2013
03B Caldwell P #2 2,400 25003B Caldwell P #3 2,000 03B Duff Lane Pond 1,000 25003B Eagle Island Park Pond 4,500 25003B Quinn Pond 4,500 03B Veterans Pond 4,000 4 Connor Pond 1,000 2504 Emerald Lake 6,000 6 Rigby Lake 5,000 250Region Water Stocked Tags 2011 Tags 2012 Tags 2013
1 Crystal Lake 3,000 25003B Caldwell City P 5,000 25003B Ed's Pond 1,750 25003B Horseshoe Bend Mill P 6,000 25003B Merrill Park P 5,000 03B Payette Greenbelt P 3,500 25003B Sego Prairie P 1,750 03M Browns P 4,450 03M Council Park P 2,000 2504 Camas P #02 3,000 2504 Dierkes lake 7,000 2004 Dollar Lake 600 4 Featherville Dredge P 6,000 1504 Penny Lake 2,900 4 Rupert Gravel Pond 2,000 2506 Rexburg City P 3,600 6 Roberts Gravel P 5,400 2507 Kids Creek P 2,400 250Region Water Stocked Tags 2011 Tags 2012 Tags 2013
1 Post Falls Park P 4,000 2502 Hordemann P 850 175 2502 Robinson P 7,750 2752 Snake River Levee P 8,550 20003B Marsing Hwy P 6,000 03B McDevitt P 7,500 27503B Park Center 8,000 27503B Riverside 7,200 27503B Sawyers P 7,500 27503B Settlers Park P 2,400 03B Ten Mile P 5,250 27503B Weiser Community P 4,200 03M Fischer P 5,000 25003M Rowlands P 6,000 2504 Filer P 7,600 2504 Freedom Park P (Burley) 1,500 1504 Heagle Park P 500 2504 Lake Creek L 2,100 2506 Ryder Park P 5,000 2506 Trail Creek P 3,600 2507 Blue Mountain Meadow P 1,500 7 Hyde P 800 250
High
Low
Medium
24
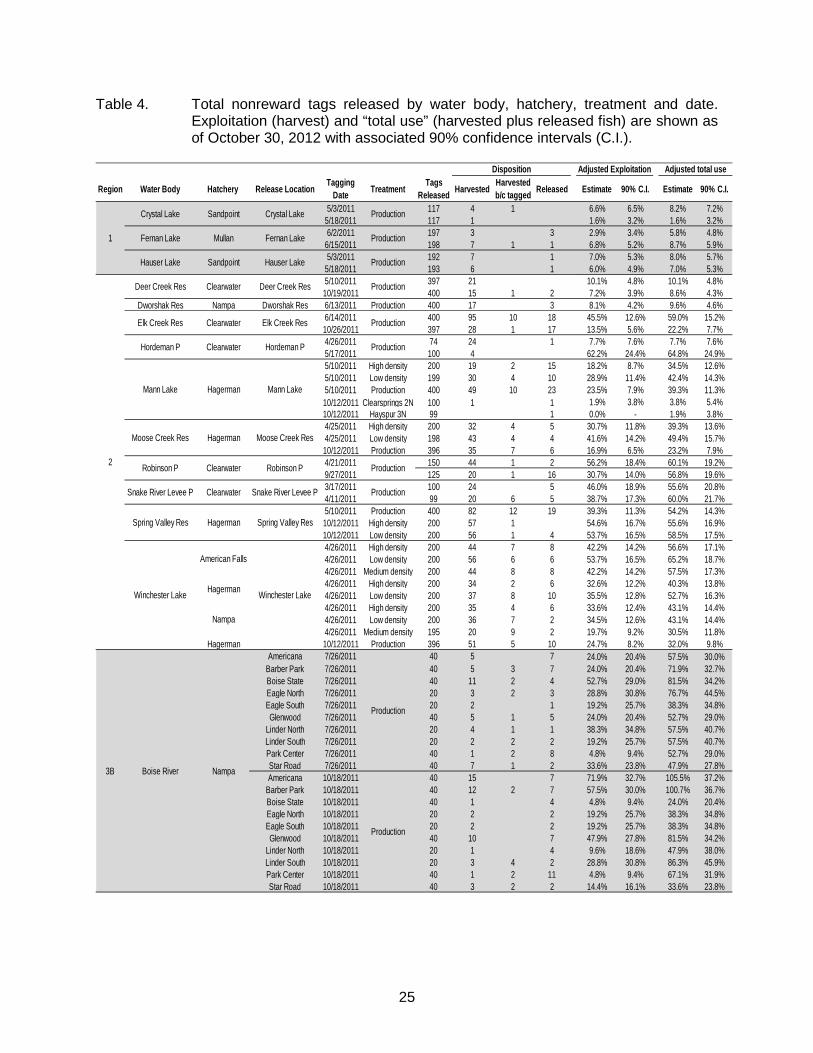
Table 4. Total nonreward tags released by water body, hatchery, treatment and date. Exploitation (harvest) and “total use” (harvested plus released fish) are shown as of October 30, 2012 with associated 90% confidence intervals (C.I.).
Region Water Body Hatchery Release Location Tagging Date Treatment Tags
Released Harvested Harvested b/c tagged Released Estimate 90% C.I. Estimate 90% C.I.
5/3/2011 117 4 1 6.6% 6.5% 8.2% 7.2%5/18/2011 117 1 1.6% 3.2% 1.6% 3.2%6/2/2011 197 3 3 2.9% 3.4% 5.8% 4.8%
6/15/2011 198 7 1 1 6.8% 5.2% 8.7% 5.9%5/3/2011 192 7 1 7.0% 5.3% 8.0% 5.7%
5/18/2011 193 6 1 6.0% 4.9% 7.0% 5.3%5/10/2011 397 21 10.1% 4.8% 10.1% 4.8%10/19/2011 400 15 1 2 7.2% 3.9% 8.6% 4.3%
Dworshak Res Nampa Dworshak Res 6/13/2011 Production 400 17 3 8.1% 4.2% 9.6% 4.6%6/14/2011 400 95 10 18 45.5% 12.6% 59.0% 15.2%10/26/2011 397 28 1 17 13.5% 5.6% 22.2% 7.7%4/26/2011 74 24 1 7.7% 7.6% 7.7% 7.6%5/17/2011 100 4 62.2% 24.4% 64.8% 24.9%5/10/2011 High density 200 19 2 15 18.2% 8.7% 34.5% 12.6%5/10/2011 Low density 199 30 4 10 28.9% 11.4% 42.4% 14.3%5/10/2011 Production 400 49 10 23 23.5% 7.9% 39.3% 11.3%10/12/2011 Clearsprings 2N 100 1 1 1.9% 3.8% 3.8% 5.4%10/12/2011 Hayspur 3N 99 1 0.0% - 1.9% 3.8%4/25/2011 High density 200 32 4 5 30.7% 11.8% 39.3% 13.6%4/25/2011 Low density 198 43 4 4 41.6% 14.2% 49.4% 15.7%10/12/2011 Production 396 35 7 6 16.9% 6.5% 23.2% 7.9%4/21/2011 150 44 1 2 56.2% 18.4% 60.1% 19.2%9/27/2011 125 20 1 16 30.7% 14.0% 56.8% 19.6%3/17/2011 100 24 5 46.0% 18.9% 55.6% 20.8%4/11/2011 99 20 6 5 38.7% 17.3% 60.0% 21.7%5/10/2011 Production 400 82 12 19 39.3% 11.3% 54.2% 14.3%10/12/2011 High density 200 57 1 54.6% 16.7% 55.6% 16.9%10/12/2011 Low density 200 56 1 4 53.7% 16.5% 58.5% 17.5%4/26/2011 High density 200 44 7 8 42.2% 14.2% 56.6% 17.1%4/26/2011 Low density 200 56 6 6 53.7% 16.5% 65.2% 18.7%4/26/2011 Medium density 200 44 8 8 42.2% 14.2% 57.5% 17.3%4/26/2011 High density 200 34 2 6 32.6% 12.2% 40.3% 13.8%4/26/2011 Low density 200 37 8 10 35.5% 12.8% 52.7% 16.3%4/26/2011 High density 200 35 4 6 33.6% 12.4% 43.1% 14.4%4/26/2011 Low density 200 36 7 2 34.5% 12.6% 43.1% 14.4%4/26/2011 Medium density 195 20 9 2 19.7% 9.2% 30.5% 11.8%
Hagerman 10/12/2011 Production 396 51 5 10 24.7% 8.2% 32.0% 9.8%Americana 7/26/2011 40 5 7 24.0% 20.4% 57.5% 30.0%
Barber Park 7/26/2011 40 5 3 7 24.0% 20.4% 71.9% 32.7%Boise State 7/26/2011 40 11 2 4 52.7% 29.0% 81.5% 34.2%Eagle North 7/26/2011 20 3 2 3 28.8% 30.8% 76.7% 44.5%Eagle South 7/26/2011 20 2 1 19.2% 25.7% 38.3% 34.8%Glenwood 7/26/2011 40 5 1 5 24.0% 20.4% 52.7% 29.0%
Linder North 7/26/2011 20 4 1 1 38.3% 34.8% 57.5% 40.7%Linder South 7/26/2011 20 2 2 2 19.2% 25.7% 57.5% 40.7%Park Center 7/26/2011 40 1 2 8 4.8% 9.4% 52.7% 29.0%Star Road 7/26/2011 40 7 1 2 33.6% 23.8% 47.9% 27.8%Americana 10/18/2011 40 15 7 71.9% 32.7% 105.5% 37.2%
Barber Park 10/18/2011 40 12 2 7 57.5% 30.0% 100.7% 36.7%Boise State 10/18/2011 40 1 4 4.8% 9.4% 24.0% 20.4%Eagle North 10/18/2011 20 2 2 19.2% 25.7% 38.3% 34.8%Eagle South 10/18/2011 20 2 2 19.2% 25.7% 38.3% 34.8%Glenwood 10/18/2011 40 10 7 47.9% 27.8% 81.5% 34.2%
Linder North 10/18/2011 20 1 4 9.6% 18.6% 47.9% 38.0%Linder South 10/18/2011 20 3 4 2 28.8% 30.8% 86.3% 45.9%Park Center 10/18/2011 40 1 2 11 4.8% 9.4% 67.1% 31.9%Star Road 10/18/2011 40 3 2 2 14.4% 16.1% 33.6% 23.8%
Production
Production
NampaBoise River3B
Hagerman
2
Winchester Lake
American Falls
Winchester Lake
Hordeman P
Moose Creek Res Hagerman Moose Creek Res
Robinson P Clearwater Robinson P
Clearwater Hordeman P
Nampa
Clearwater Snake River Levee P
Production
Spring Valley Res Hagerman Spring Valley Res
Snake River Levee P
Disposition Adjusted Exploitation Adjusted total use
Deer Creek Res Clearwater Deer Creek Res Production
Elk Creek Res Clearwater Elk Creek Res Production
Mann Lake Hagerman Mann Lake
Production
Production
1
Crystal Lake Sandpoint Crystal Lake Production
Fernan Lake Mullan Fernan Lake Production
Hauser Lake Sandpoint Hauser Lake Production
25

Table 4. Continued.
Region Water Body Hatchery Release Location Tagging Date Treatment Tags
Released Harvested Harvested b/c tagged Released Estimate 90% C.I. Estimate 90% C.I.
4/6/2011 125 40 1 10 61.4% 20.4% 78.2% 23.5%10/18/2011 125 29 4 6 44.5% 17.1% 59.8% 20.1%
4/6/2011 125 21 2 3 32.2% 14.4% 39.9% 16.1%10/19/2011 125 24 2 10 36.8% 15.4% 55.2% 19.3%4/20/2011 High density 197 4 2 3.9% 3.9% 5.8% 4.8%4/20/2011 Low density 199 10 1 9.6% 6.2% 10.6% 6.5%4/20/2011 Medium density 198 3 2.9% 3.3% 2.9% 3.3%4/20/2011 Production 199 2 1 2 1.9% 2.7% 4.8% 4.3%4/6/2011 150 30 6 15 38.3% 14.8% 65.2% 20.1%
10/19/2011 125 17 1 5 26.1% 12.9% 35.3% 15.1%10/12/2011 Clearsprings 2N 100 5 3 1 9.6% 8.5% 17.3% 11.4%10/12/2011 Hayspur 3N 100 10 19.2% 12.1% 19.2% 12.1%
6/7/2011 High density 200 28 4 5 26.8% 10.9% 35.5% 12.8%6/7/2011 Low density 200 40 3 12 38.3% 13.4% 52.7% 16.3%6/7/2011 Medium density 200 27 5 14 25.9% 10.7% 44.1% 14.6%6/7/2011 Production 200 30 4 11 28.8% 11.3% 43.1% 14.4%2/3/2011 50 24 1 2 92.0% 33.1% 103.5% 34.5%
2/10/2011 50 22 3 84.4% 32.0% 95.9% 33.6%2/17/2011 50 18 2 4 69.0% 29.6% 92.0% 33.1%2/24/2011 50 26 2 3 99.7% 34.1% 118.9% 36.1%4/6/2011 50 12 4 46.0% 24.9% 61.4% 28.1%
4/14/2011 50 22 1 6 84.4% 32.0% 111.2% 35.4%4/22/2011 50 14 53.7% 26.6% 53.7% 26.6%4/28/2011 50 15 1 57.5% 27.4% 61.4% 28.1%7/7/2011 High density 50 14 6 3 53.7% 26.6% 88.2% 32.6%
7/14/2011 49 6 3 9 23.5% 18.4% 70.4% 30.0%8/4/2011 50 11 1 2 42.2% 23.9% 53.7% 26.6%
8/10/2011 50 12 1 6 46.0% 24.9% 72.9% 30.2%10/7/2011 50 10 1 38.3% 22.9% 42.2% 23.9%10/15/2011 50 13 5 49.9% 25.7% 69.0% 29.6%10/19/2011 50 8 1 4 30.7% 20.7% 49.9% 25.7%10/27/2011 50 10 2 6 38.3% 22.9% 69.0% 29.6%10/31/2011 Clearsprings 2N 200 2 1 1.9% 2.7% 2.9% 3.3%10/31/2011 Hayspur 3N 200 1 1 1.0% 1.9% 1.9% 2.7%5/17/2011 High density 200 39 4 10 37.4% 13.2% 50.8% 16.0%5/17/2011 Low density 200 36 7 5 34.5% 12.6% 46.0% 15.0%5/17/2011 Medium density 200 41 6 12 39.3% 13.6% 56.6% 17.1%5/17/2011 High density 200 25 3 5 24.0% 10.2% 31.6% 12.0%5/17/2011 Low density 199 39 2 7 37.6% 13.3% 46.2% 15.1%5/17/2011 High density 200 24 4 5 23.0% 10.0% 31.6% 12.0%5/17/2011 Low density 200 31 5 1 29.7% 11.5% 35.5% 12.8%5/17/2011 Medium density 200 35 3 5 33.6% 12.4% 41.2% 14.0%
Hagerman 9/16/2011 Production 400 59 5 6 28.3% 9.0% 33.6% 10.1%6/6/2011 High density 199 25 5 3 24.1% 10.2% 31.8% 12.0%6/6/2011 Low density 200 49 2 1 47.0% 15.2% 49.9% 15.8%
5/20/2011 125 15 5 7 23.0% 12.0% 41.4% 16.5%7/8/2011 122 39 9 2 61.3% 20.6% 78.6% 23.7%
6/28/2011 High density 200 32 5 4 30.7% 11.8% 39.3% 13.6%6/28/2011 Low density 200 42 2 6 40.3% 13.8% 47.9% 15.4%6/28/2011 Medium density 200 42 5 5 40.3% 13.8% 49.9% 15.8%6/28/2011 Production 200 19 5 4 18.2% 8.7% 26.8% 10.9%5/4/2011 High density 200 10 3 2 9.6% 6.2% 14.4% 7.7%5/4/2011 Low density 200 13 1 4 12.5% 7.1% 17.3% 8.5%5/4/2011 Medium density 200 9 2 7 8.6% 5.8% 17.3% 8.5%5/4/2011 High density 198 8 3 1 7.7% 5.5% 11.6% 6.9%5/4/2011 Low density 200 10 2 1 9.6% 6.2% 12.5% 7.1%5/4/2011 High density 200 4 1 3.8% 3.8% 4.8% 4.3%5/4/2011 Low density 200 8 5 7.7% 5.5% 12.5% 7.1%5/4/2011 Medium density 200 7 1 6.7% 5.1% 7.7% 5.5%
Disposition Adjusted exploitation Adjusted total use
4
Production
Production
Production
Production
Production
Curlew Boat Ramp
Nampa
Hagerman
American Falls
Wilson Springs P Nampa
Production
Caldwell Rotary P
3B
NampaSage Hen Res
Mountain Home Res
Horsethief ResHorsethief Res
City Boat Ramp HagermanCascade Res
Nampa
Hagerman
NampaManns Creek Res
NampaCaldwell Rotary P
NampaMcDevitt P
Hagerman
Eagle Island Park P Nampa
Wilson Springs P
3M
Warm Lake NampaWarm Lake
Anderson Ranch Res
Rowlands P McCall Boat Ramp
American Falls
Lost Valley Res HagermanLost Valley Res
Sage Hen Res
Mountain Home Res
McDevitt P
Manns Creek Res
Eagle Island Park P
26

Table 4. Continued.
Region Water Body Hatchery Release Location Tagging Date Treatment Tags
Released Harvested Harvested b/c tagged Released Estimate 90% C.I. Estimate 90% C.I.
Connor P Hagerman Connor P 4/19/2011 Production 148 0.0% - 0.0% -10/11/2011 Clearsprings 2N 95 6 2 12 12.1% 9.8% 40.4% 18.0%10/11/2011 Hayspur 3N 99 12 3 10 23.2% 13.4% 48.4% 19.4%
Featherville Dredge P Hagerman Featherville Dredge P 6/13/2011 Production 149 25 7 3 32.2% 13.4% 45.0% 16.2%Freedom Park P Hagerman Freedom Park P 4/20/2011 Production 74 0.0% - 0.0% -
4/12/2011 High density 200 0.0% - 0.0% -4/12/2011 Low density 200 6 1 5.8% 4.7% 6.7% 5.1%
Little Camas Res Hagerman Little Camas Res 4/11/2011 Production 397 40 2 3 19.3% 7.0% 21.7% 7.6%6/21/2011 High density 200 8 2 4 7.7% 5.5% 13.4% 7.4%6/21/2011 Low density 199 14 1 1 13.5% 7.4% 15.4% 8.0%6/21/2011 Medium density 200 7 2 3 6.7% 5.1% 11.5% 6.8%6/21/2011 Production 199 4 1 3.9% 3.9% 4.8% 4.3%4/26/2011 High density 200 0.0% - 0.0% -4/26/2011 Low density 200 4 1 3.8% 3.8% 4.8% 4.3%4/26/2011 Medium density 200 1 1.0% 1.9% 1.0% 1.9%4/26/2011 High density 200 6 5.8% 4.7% 5.8% 4.7%4/26/2011 Low density 200 2 1 1.9% 2.7% 2.9% 3.3%4/26/2011 High density 200 1 1 1.0% 1.9% 1.9% 2.7%4/26/2011 Low density 200 4 1 3.8% 3.8% 4.8% 4.3%4/26/2011 Medium density 195 0.0% - 0.0% -11/2/2011 Clearsprings 2N 199 16 5 5 15.4% 8.0% 25.1% 10.5%11/2/2011 Hayspur 3N 200 16 2 6 15.3% 8.0% 23.0% 10.0%4/6/2011 High density 200 4 1 3.8% 3.8% 4.8% 4.3%4/6/2011 Low density 200 8 2 7.7% 5.5% 9.6% 6.2%
Rupert Gravel P Hagerman Rupert Gravel P 4/19/2011 Production 149 0.0% - 0.0% -4/19/2011 High density 200 1 1.0% 1.9% 1.0% 1.9%4/19/2011 Low density 200 6 1 4 5.8% 4.7% 10.5% 6.5%4/19/2011 Medium density 200 6 2 5.8% 4.7% 7.7% 5.5%4/19/2011 High density 200 4 2 3.8% 3.8% 5.8% 4.7%4/19/2011 Low density 200 9 2 4 8.6% 5.8% 14.4% 7.7%4/19/2011 High density 200 3 0.0% - 2.9% 3.3%4/19/2011 Low density 199 3 1 1 2.9% 3.3% 4.8% 4.3%4/19/2011 Medium density 198 3 1 2.9% 3.3% 3.9% 3.9%
Hagerman 9/8/2011 Production 400 15 3 7.2% 3.9% 8.6% 4.3%4/11/2011 High density 200 6 5.8% 4.7% 5.8% 4.7%4/11/2011 Low density 200 1 1.0% 1.9% 1.0% 1.9%4/11/2011 Medium density 200 4 3.8% 3.8% 3.8% 3.8%10/18/2011 Production 399 4 2 3 1.9% 1.9% 4.3% 3.0%
Blackfoot Res Hagerman Blackfoot Res 9/27/2011 Production 399 15 4 5 7.2% 3.9% 11.5% 5.1%5/17/2011 High density 275 3 2.1% 2.4% 2.1% 2.4%5/17/2011 Low density 200 2 0.0% - 1.9% 2.7%5/17/2011 Medium density 200 2 1 1.9% 2.7% 2.9% 3.3%5/17/2011 High density 200 0.0% - 0.0% -5/17/2011 Low density 200 5 2 4.8% 4.3% 6.7% 5.1%5/17/2011 High density 200 1 1 1.0% 1.9% 1.9% 2.7%5/17/2011 Low density 200 0.0% - 0.0% -5/17/2011 Medium density 200 1 0.0% - 1.0% 1.9%
Hagerman 10/14/2011 Production 400 28 9 18 13.4% 5.6% 26.4% 8.6%5/10/2011 High density 200 10 2 6 9.6% 6.2% 17.3% 8.5%5/10/2011 Low density 200 17 1 11 16.3% 8.2% 27.8% 11.1%5/10/2011 High density 200 16 4 2 15.3% 8.0% 21.1% 9.5%5/10/2011 Low density 200 28 4 8 26.8% 10.9% 38.3% 13.4%
4
Disposition Adjusted exploitation Adjusted total use
Roseworth Res Hagerman
Nampa
Hagerman
American Falls
Grays Landing
Dierke's Lake HagermanDierke's Lake
Little Wood Res NampaLittle Wood Res
Gifford Springs
Hagerman
American Falls
Myrtle Point
Sportsmans Park
Nampa
Hagerman
Devils Creek Res
Deep Creek Res
Devils Creek Res Hagerman
Hagerman
Hagerman
American Falls
Chesterfield Res5
Roseworth Res
Salmon Falls Creek Res
American FallsAmerican Falls Res
Lake Walcott
Chesterfield Res
Main Boat Ramp
Magic ResWest Magic
Hagerman
Nampa
27

Table 4. Continued.
Region Water Body Hatchery Release Location Tagging Date Treatment Tags
Released Harvested Harvested b/c tagged Released Estimate 90% C.I. Estimate 90% C.I.
6/13/2011 High density 200 24 2 1 23.0% 10.0% 25.9% 10.7%6/13/2011 Low density 200 30 3 3 28.8% 11.3% 34.5% 12.6%6/13/2011 Medium density 200 24 4 3 23.0% 10.0% 29.7% 11.5%6/13/2011 High density 199 1 1 1.0% 1.9% 1.9% 2.7%6/13/2011 Low density 200 6 3 1 5.8% 4.7% 9.6% 6.2%6/13/2011 High density 200 5 4.8% 4.3% 4.8% 4.3%6/13/2011 Low density 199 4 3.9% 3.9% 3.9% 3.9%6/13/2011 Medium density 200 2 2 1.9% 2.7% 3.8% 3.8%9/21/2011 High density 199 24 5 3 23.1% 10.0% 30.8% 11.8%9/21/2011 Low density 195 35 4 4 34.4% 12.7% 42.3% 14.4%5/17/2011 High density 200 25 7 3 24.0% 10.2% 33.6% 12.4%5/17/2011 Low density 200 25 3 6 24.0% 10.2% 32.6% 12.2%5/17/2011 Medium density 200 34 9 8 32.6% 12.2% 48.9% 15.6%6/3/2011 Production 200 20 7 14 19.2% 9.0% 39.3% 13.6%
6/21/2011 Production 199 28 7 3 27.0% 10.9% 36.6% 13.1%6/22/2011 50 15 3 4 57.5% 27.4% 84.4% 32.0%7/12/2011 50 7 5 1 26.8% 19.4% 49.9% 25.7%7/25/2011 45 14 1 1 59.6% 29.0% 68.2% 30.6%8/8/2011 55 10 7 34.9% 21.0% 59.3% 26.7%9/7/2011 50 8 2 30.7% 20.7% 38.3% 22.9%
9/27/2011 49 14 1 54.8% 27.0% 58.7% 27.8%4/20/2011 50 7 1 4 26.8% 19.4% 46.0% 24.9%8/24/2011 49 4 3 15.7% 15.2% 27.4% 19.8%
Section 5 6/22/2011 56 1 1 3 3.4% 6.7% 17.1% 14.9%Section 6 6/23/2011 172 18 8 11 20.1% 9.8% 41.2% 14.7%Section 7 6/23/2011 56 4 3 13.7% 13.3% 24.0% 17.5%Section 8 6/23/2011 116 13 1 5 21.5% 12.0% 31.4% 14.6%Section 6 9/19/2011 38 1 0.0% - 5.0% 9.9%Section 7 9/20/2011 38 1 1 5.0% 9.9% 10.1% 13.9%Section 8 9/20/2011 24 0.0% - 0.0% -
6/21/2011 High density 200 12 5 5 11.5% 6.8% 21.1% 9.5%6/21/2011 Low density 200 21 3 7 20.1% 9.2% 29.7% 11.5%6/21/2011 Medium density 200 12 2 5 11.5% 6.8% 18.2% 8.7%6/21/2011 Production 200 10 5 4 9.6% 6.2% 18.2% 8.7%
Production
Disposition Adjusted exploitation Adjusted total use
Production
Production
Stanley Lake NampaStanley Lake
Island Park Res
Boat Ramp
Trail Creek P Trail Creek P Ashton
Nampa
HagermanMcCrae
American Falls
Mackay
American Falls
Mackay Parking lot
SawtoothSalmon River7
6
Mackay Res
Hagerman
Kids Creek P
28

Table 5. Mean density index (DI, lbs fish/ft3/inch), flow index (FI, lbs/GPM/inch) across the entire rearing period by hatchery and treatment for tagged catchable rainbow trout. Length is the mean total length (mm) at the time of stocking (with 95% confidence intervals) for fish tagged from February to June. Nampa Hatchery was the only hatchery where normal production fish were released in conjunction with density treatment groups.
Table 6. Strain evaluation comparisons of Hayspur diploids and Clearsprings triploids.
Overall meanDI FI Length (mm) DI FI Length (mm) DI FI Length (mm) length (mm)
Low 0.10 0.32 257 (± 1) 0.10 0.50 266 (± 1) 0.13 0.29 257 (± 1) 247 (± 1)Medium 0.13 0.49 255 (± 1) - - - 0.20 0.50 251 (± 1) 258 (± 1)High 0.16* 0.67 253 (± 1) 0.21 0.79 266 (± 1) 0.25 0.59 242 (± 1) 253 (± 1)Normal Production - - - - - - 0.30 - 251 (± 2) 257 (± 1)Overall avg. 254 (± 1) 253 (± 1) 252 (± 1) 253 (± 1)*Back-calculated density index values from stocking records suggest this value was actually 0.19.
Hagerman NampaAmerican Falls
Harvested Harvested b/c tagged Released Estimate 90% C.I. Estimate 90% C.I.
10/12/2011 Clearsprings 2N 100 1 1 1.9% 3.7% 3.7% 5.2%
10/12/2011 Hayspur 3N 99 1 0.0% - 1.9% 3.7%
10/12/2011 Clearsprings 2N 100 5 3 1 9.3% 8.2% 16.7% 11.1%
10/12/2011 Hayspur 3N 100 10 18.5% 11.7% 18.5% 11.7%
10/31/2011 Clearsprings 2N 200 2 1 1.9% 2.6% 2.8% 3.2%
10/31/2011 Hayspur 3N 200 1 1 0.9% 1.8% 1.9% 2.6%
10/11/2011 Clearsprings 2N 95 6 2 12 11.7% 9.5% 39.0% 17.3%
10/11/2011 Hayspur 3N 99 12 3 10 22.4% 12.9% 46.7% 18.7%
11/2/2011 Clearsprings 2N 199 16 5 5 14.9% 7.7% 24.2% 10.1%
11/2/2011 Hayspur 3N 200 16 2 6 14.8% 7.7% 22.2% 9.6%
Disposition Adjusted total useAdjusted exploitation
Dierke's Lake
Magic Res
Water Body Tagging Date Treatment Tags
Released
Mann Lake
Mountain Home Res
Cascade Res
29

Figure 1. Cumulative percentage caught versus days-at-large tagged hatchery catchable
trout released in lakes/reservoirs, community ponds, and rivers.
30

Figure 2. Box plot of total length (mm) for all catchable rainbow trout tagged during 2011 at
American Falls (AMF), Ashton (ASH), Clearwater (CLW), Hagerman (HGR), Mackay (MCK), McCall (MCL), Mullan (MLN), Nampa (NMP), Sandpoint (SND), and Sawtooth (SWT) hatcheries. Boxes constitute the interquartile range with whiskers extending 1.5 times the interquartile range. Open circles indicate outliers.
Figure 3. Box plot of total length (mm) for all tagged catchable rainbow trout by Region in
which they were stocked during 2011. Boxes constitute the interquartile range with whiskers extending 1.5 times the interquartile range. Open circles indicate outliers.
31

Figure 4. Mean total length (mm), density index (lbs/ft3/inch), and flow index (lbs/inch x
gal/min) by treatment (high/med/low density) during the rearing period for American Falls Hatchery.
32
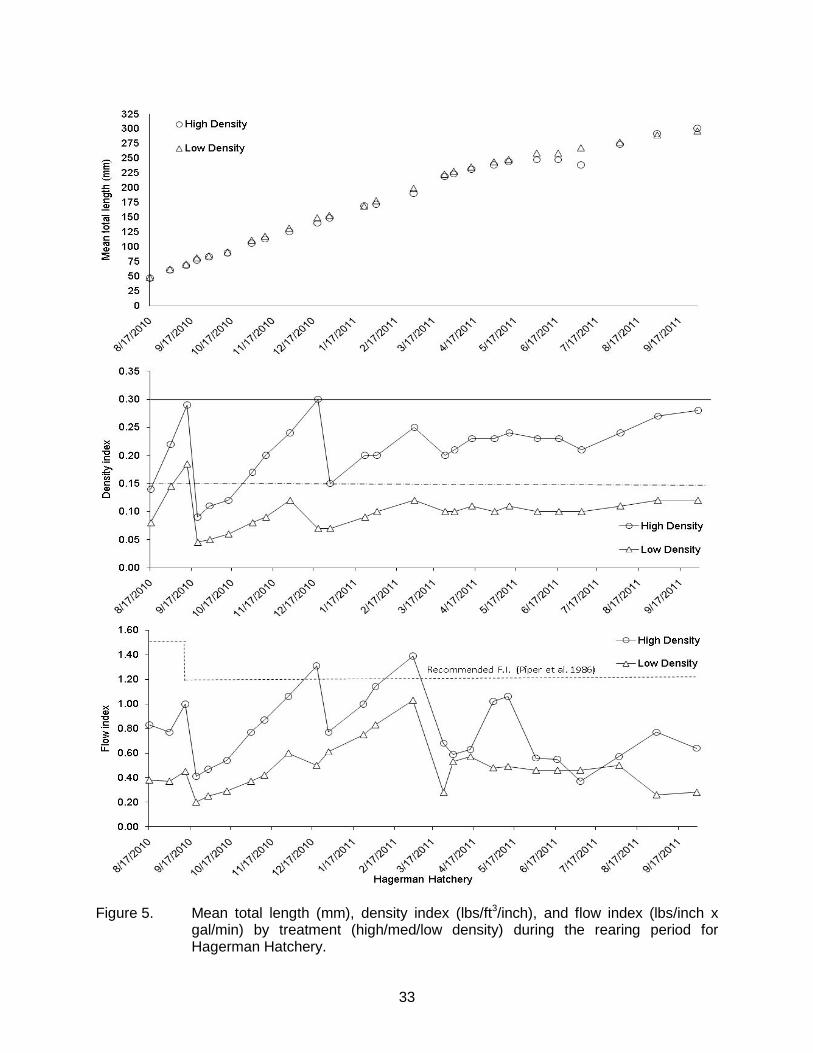
Figure 5. Mean total length (mm), density index (lbs/ft3/inch), and flow index (lbs/inch x
gal/min) by treatment (high/med/low density) during the rearing period for Hagerman Hatchery.
33
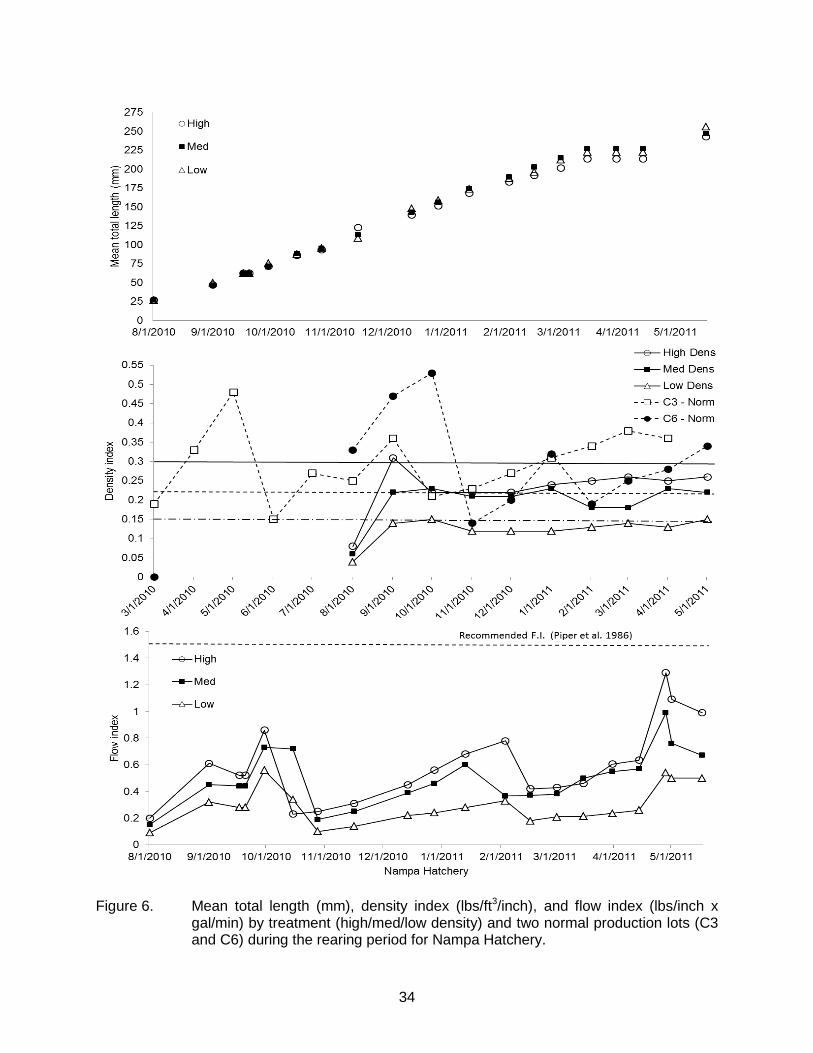
Figure 6. Mean total length (mm), density index (lbs/ft3/inch), and flow index (lbs/inch x
gal/min) by treatment (high/med/low density) and two normal production lots (C3 and C6) during the rearing period for Nampa Hatchery.
34

Figure 7. Mean total catch (bars) of hatchery catchable trout released from American Falls,
Hagerman, and Nampa fish hatcheries into seven common lakes/reservoirs. Mean length at release (lines) for each hatchery/release location is plotted on the secondary Y axis.
Figure 8. Mean percent of tags that were reported vs. length at tagging of hatchery
catchable trout released from different rearing hatcheries, seasons, densities, and into different water body types. The shaded gray area shows the number of fish within each size class released and is plotted on the secondary Y axis.
35
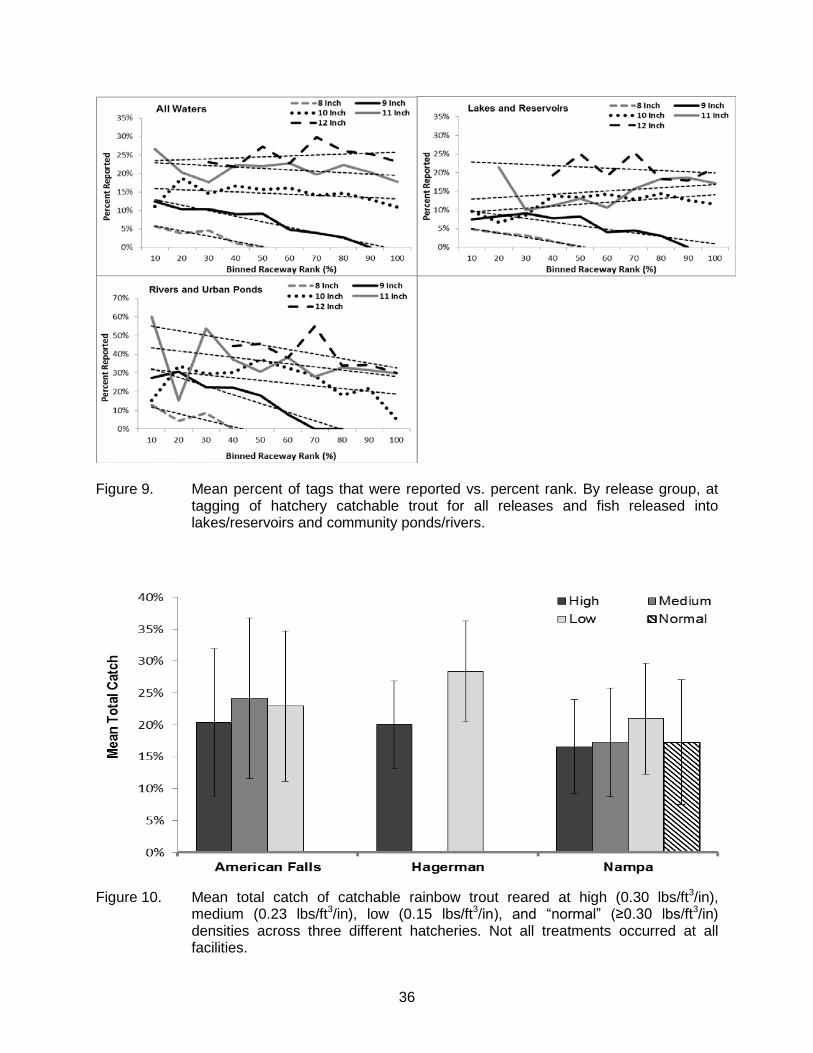
Figure 9. Mean percent of tags that were reported vs. percent rank. By release group, at
tagging of hatchery catchable trout for all releases and fish released into lakes/reservoirs and community ponds/rivers.
Figure 10. Mean total catch of catchable rainbow trout reared at high (0.30 lbs/ft3/in),
medium (0.23 lbs/ft3/in), low (0.15 lbs/ft3/in), and “normal” (≥0.30 lbs/ft3/in) densities across three different hatcheries. Not all treatments occurred at all facilities.
36
ANNUAL PERFORMANCE REPORT SUBPROJECT #2: RELATIVE PERFORMANCE OF TRIPLOID KOKANEE IN IDAHO LAKES
AND RESERVOIRS
State of: Idaho Grant No.: F-73-R-35 Fishery Research Project No.: 4 Title: Hatchery Trout Evaluations Subproject #1: Relative Performance of Triploid
Kokanee in Idaho Lakes and Reservoirs
Contract Period: July 1, 2012 to June 30, 2013
ABSTRACT
Kokanee salmon Oncorhynchus nerka are an important recreational species in reservoirs and lakes across the western United States. Harvest rates of kokanee are heavily influenced by growth rates, population density, and fish size. Additionally, kokanee mature early and typically spawn and die at age-three or age-four. Due to slow growth rates, short lifespan, and angler preference for larger fish, kokanee are often only exploited for a short period of time during their last year. In Idaho, using triploid salmonids has become increasingly common in hatchery-supported freshwater fisheries. Benefits of stocking triploid salmonids may include increased longevity and survival, genetic protection of wild stocks, as well as increased growth. However, the benefits and relative performance of diploid and triploid salmonids is often species-specific. In some cases, drawbacks of stocking triploid salmonids may include higher mortality and reduced growth during early life-history stages. Previous research on the performance of triploid kokanee relative to diploid conspecifics is limited to only a few examples and questions remain about sterile kokanee performance. The objectives of this study were to: (1) describe kokanee populations before and after switching to triploid-only stocking relative to control lakes, (2) increase catch-per-unit-effort (CPUE) of 250 mm (or greater) kokanee by 25%, and (3) increase the proportion of “quality” sized kokanee (i.e., fish >300 mm in length) by 25% after switching to triploid-only kokanee stocking. Four water bodies were selected to be used in our evaluation, two treatments (Mirror Lake and Montpelier Reservoir) and two controls (Lower Twin Lake and Devils Creek Reservoir). In 2012, we completed one season of initial sampling to describe the existing populations of diploid kokanee. Devils Creek Reservoir had the largest kokanee, followed by Montpelier, Twin Lake, and Mirror Lake. CPUE was highest in Mirror Lake followed by Devils Creek, Twin Lake, and Montpelier. Beyond this initial sampling, stocking at the two treatment lakes will switch to stocking only pressure-treated triploid kokanee, while control lakes will continue with normal diploid stocking consistent with previous stocking. Consistent year-to-year sampling will continue annually through 2017, when the first group of triploid kokanee will have reached age-four, to document any increase in longevity or mean size in the population. Authors: John Cassinelli Martin Koenig Senior Fisheries Research Biologist Regional Fisheries Biologist
37
INTRODUCTION
Kokanee salmon Oncorhynchus nerka are an important recreational species in reservoirs and lakes across the western United States and Canada (Rieman and Myers 1992). Kokanee may support high yield fisheries or provide a forage base for large piscivores (Wydoski and Bennett 1981). While kokanee are important to the harvest-oriented anglers and for providing trophy fisheries, managing for healthy kokanee populations is often problematic (Beattie and Clancey 1991). Harvest rates of kokanee are heavily influenced by growth rates, population density, and fish size. Since the majority of kokanee populations in Idaho are found in oligotrophic lakes or reservoirs, growth rates are low, especially when population densities exceed 50 fish/ha (Rieman and Maiolie 1995). Additionally, kokanee mature early and typically spawn and die at age-three or age-four (Johnston et al. 1993). Due to slow growth rates, short life span, and angler's preference for larger fish, kokanee are often only exploited for a short period of time during their last year.
In Idaho, hatchery-reared diploid (2N) kokanee are stocked to supplement wild
populations and to provide put/grow/take fisheries. Using triploid (3N) salmonids has become increasingly common in hatchery-supported freshwater fisheries. Triploid salmonids are functionally sterile, and the common assertion is that sterility provides a fisheries or aquaculture benefit (Teuscher et al. 2003). Benefits of stocking triploid salmonids may include increased longevity and survival (Ihssen et al. 1990), genetic protection of wild stocks (Rohrer and Thorgaard 1986), as well as increased growth (Habicht et al. 1994; Sheehan et al. 1999). However, the benefits and relative performance of 2N and 3N salmonids is often species-specific. In some cases, drawbacks of stocking triploid salmonids may include higher mortality and reduced growth during early life-history stages (Myers and Hershberger 1991). For example, triploid rainbow trout often survive at lower rates in some reservoirs, even when stocked at “catchable” sizes (Koenig and Meyer 2011), or when mixed-sex fry are stocked in alpine lakes (Koenig et al. 2011). Additionally, past pressure treatment trials indicated survival to eye-up for 3N kokanee egg lots are at least 10% lower than 2N control groups (M. Koenig, unpublished data), requiring more eggs be collected to meet stocking requests.
Previous research on the performance of 3N kokanee relative to 2N conspecifics is limited to only a few examples. Parkinson and Tsumura (1988) evaluated hormone-sterilized kokanee in three lakes, and found that sterilized fish survived at only 10% the rate of control fish up to maturity. Despite low early survival, sterilized kokanee lived beyond the normal life span, but no size advantage was ever achieved.
Johnston et al. (1993) performed a similar evaluation (in one lake) also using hormone-sterilized kokanee. Their results showed very low catch of treated kokanee at age-one and -two, but catch increased relative to controls after age-three. Despite longevity to age-seven, the total catch of treated kokanee was always lower than controls, even over the long term. Total catch of treated kokanee was about 30-75% of controls over a seven-year period, while most control fish were returned within four years. As with Parkinson and Tsumura (1988), sterile kokanee did not show any growth advantage.
In 2005, IDFG began a multiyear study to examine relative growth and survival of 3N and 2N kokanee across five lakes and reservoirs (Koenig 2011). Diploid and 3N kokanee were stocked together in each reservoir in similar numbers during spring 2005 and sampled from 2007-2009. Results from the 2007 sample (which recaptured the most fish) indicated that 73% of recaptured marked fish were diploid, and that there was no size difference between 2N and 3N groups. This study suffered from low triploid-induction rates (79%) and very few recaptured
38
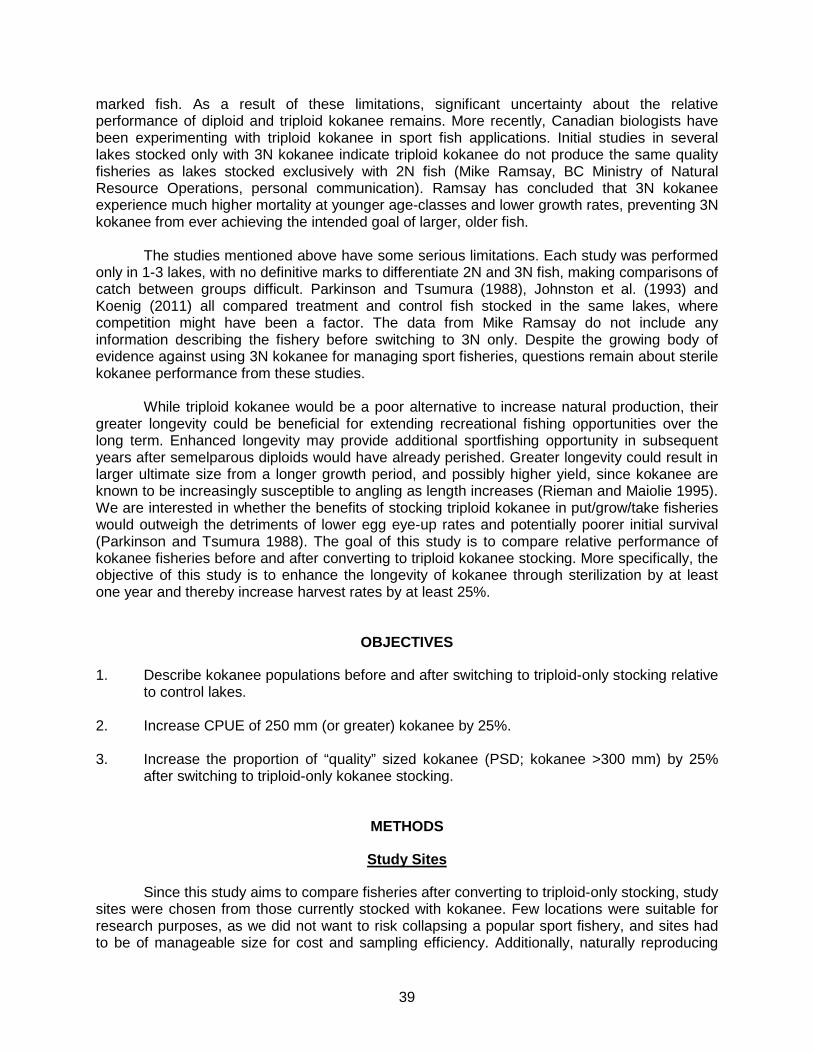
marked fish. As a result of these limitations, significant uncertainty about the relative performance of diploid and triploid kokanee remains. More recently, Canadian biologists have been experimenting with triploid kokanee in sport fish applications. Initial studies in several lakes stocked only with 3N kokanee indicate triploid kokanee do not produce the same quality fisheries as lakes stocked exclusively with 2N fish (Mike Ramsay, BC Ministry of Natural Resource Operations, personal communication). Ramsay has concluded that 3N kokanee experience much higher mortality at younger age-classes and lower growth rates, preventing 3N kokanee from ever achieving the intended goal of larger, older fish.
The studies mentioned above have some serious limitations. Each study was performed
only in 1-3 lakes, with no definitive marks to differentiate 2N and 3N fish, making comparisons of catch between groups difficult. Parkinson and Tsumura (1988), Johnston et al. (1993) and Koenig (2011) all compared treatment and control fish stocked in the same lakes, where competition might have been a factor. The data from Mike Ramsay do not include any information describing the fishery before switching to 3N only. Despite the growing body of evidence against using 3N kokanee for managing sport fisheries, questions remain about sterile kokanee performance from these studies.
While triploid kokanee would be a poor alternative to increase natural production, their
greater longevity could be beneficial for extending recreational fishing opportunities over the long term. Enhanced longevity may provide additional sportfishing opportunity in subsequent years after semelparous diploids would have already perished. Greater longevity could result in larger ultimate size from a longer growth period, and possibly higher yield, since kokanee are known to be increasingly susceptible to angling as length increases (Rieman and Maiolie 1995). We are interested in whether the benefits of stocking triploid kokanee in put/grow/take fisheries would outweigh the detriments of lower egg eye-up rates and potentially poorer initial survival (Parkinson and Tsumura 1988). The goal of this study is to compare relative performance of kokanee fisheries before and after converting to triploid kokanee stocking. More specifically, the objective of this study is to enhance the longevity of kokanee through sterilization by at least one year and thereby increase harvest rates by at least 25%.
OBJECTIVES
1. Describe kokanee populations before and after switching to triploid-only stocking relative to control lakes.
2. Increase CPUE of 250 mm (or greater) kokanee by 25%. 3. Increase the proportion of “quality” sized kokanee (PSD; kokanee >300 mm) by 25%
after switching to triploid-only kokanee stocking.
METHODS
Study Sites
Since this study aims to compare fisheries after converting to triploid-only stocking, study sites were chosen from those currently stocked with kokanee. Few locations were suitable for research purposes, as we did not want to risk collapsing a popular sport fishery, and sites had to be of manageable size for cost and sampling efficiency. Additionally, naturally reproducing
39

populations of kokanee may confound results and make interpreting treatment effects difficult. Mirror Lake and Montpelier Reservoir will be used as treatment sites, while Lower Twin Lake and Devils Creek Reservoir will be used as controls (Table 7).
The existing populations of normally stocked diploid kokanee in Mirror Lake and Montpelier Reservoir will serve as the baseline for which to compare the treatment of switching to stocking only triploid kokanee. One season (2012) of initial sampling will describe the existing populations (length distributions, age classes, growth rates) of diploid kokanee at all four water bodies. After this initial sampling, stocking at the treatment lakes will switch to stocking only triploid kokanee, while control lakes will continue with normal diploid stocking consistent with previous stocking. Since a particular cohort of kokanee will not impact the fishery until at least a year after stocking, a second season of monitoring in 2013 will serve as an additional year of baseline data for the existing populations, both in treatment and control water bodies.
Collecting Eggs/Spawning
The first triploid treatment and diploid control groups were spawned in September of 2012 during normally scheduled weir operations on the Deadwood River. Normal production kokanee were used for the 2N control groups. Triploid production lots were made using pressure-treatment on site. The recipe used was a treatment of 9500 psi at 350 Celsius Minutes After Fertilization (CMAF) for five minutes. Additional treatment and control groups will be spawned in identical fashion in 2013 through 2016.
Hatchery Rearing
Fertilized eggs were shipped by aircraft to Cabinet Gorge Hatchery where they are being reared until the eyed egg stage. Diploid and triploid test groups received different otolith thermal marks to distinguish them from existing diploid kokanee, and from subsequent year classes to ensure correct age identification. This mark will be confirmed prior to stocking. Stocking lots for Devils Creek and Montpelier reservoirs will be transferred to Mackay Hatchery to complete rearing, while Cabinet Gorge Hatchery will rear kokanee for Mirror and Lower Twin lakes.
Prior to stocking triploid groups, 100 blood samples and 10 control (diploid) samples will be collected to check triploid-induction rates. Blood samples will be collected by severing the caudal peduncle of each fish and immersing it in a tube filled with Alsever's solution. Samples will be shipped to Dr. Jeff Hinshaw at North Carolina State University for analysis by flow cytometry. At the time of stocking, mean size of the diploid and triploid groups will be recorded. Total length (mm) and weight (g) will be collected from 100 individual fish in each group.
Sampling
Kokanee sampling began in 2012 and will continue annually through 2017 (Table 8), when the first group of triploid kokanee will have reached age-four. Net locations for sampling fish were initially randomly assigned, and will be repeated in each following year. The limnetic zone of each lake was divided into numbered squares and a random number generator was used to select three squares that will serve as monitoring locations where one net will be placed. Net locations were recorded with GPS and will be used for sampling each year. One net was fished at each location for a total of three net-nights per lake. This will be repeated in subsequent years to help reduce random variation in catch-per-unit-effort between years. Sampling effort may be increased if catch rates are low and more kokanee samples are needed to adequately characterize the populations.
40
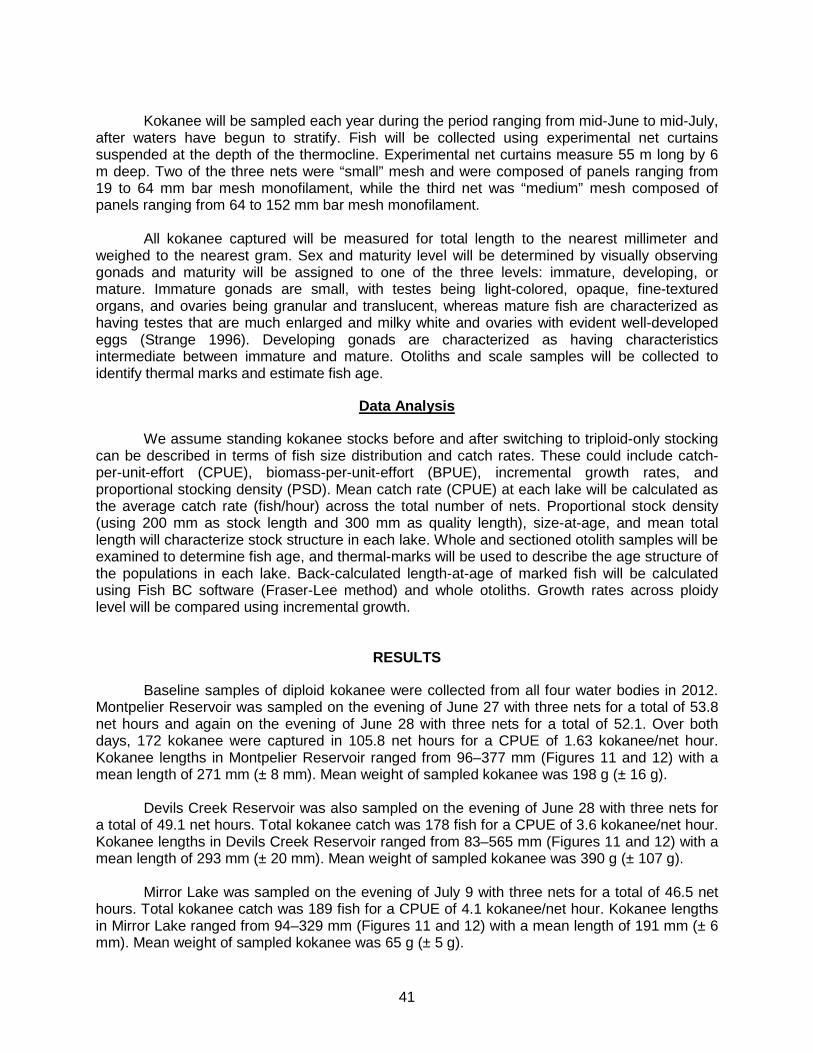
Kokanee will be sampled each year during the period ranging from mid-June to mid-July,
after waters have begun to stratify. Fish will be collected using experimental net curtains suspended at the depth of the thermocline. Experimental net curtains measure 55 m long by 6 m deep. Two of the three nets were “small” mesh and were composed of panels ranging from 19 to 64 mm bar mesh monofilament, while the third net was “medium” mesh composed of panels ranging from 64 to 152 mm bar mesh monofilament.
All kokanee captured will be measured for total length to the nearest millimeter and weighed to the nearest gram. Sex and maturity level will be determined by visually observing gonads and maturity will be assigned to one of the three levels: immature, developing, or mature. Immature gonads are small, with testes being light-colored, opaque, fine-textured organs, and ovaries being granular and translucent, whereas mature fish are characterized as having testes that are much enlarged and milky white and ovaries with evident well-developed eggs (Strange 1996). Developing gonads are characterized as having characteristics intermediate between immature and mature. Otoliths and scale samples will be collected to identify thermal marks and estimate fish age.
Data Analysis
We assume standing kokanee stocks before and after switching to triploid-only stocking can be described in terms of fish size distribution and catch rates. These could include catch-per-unit-effort (CPUE), biomass-per-unit-effort (BPUE), incremental growth rates, and proportional stocking density (PSD). Mean catch rate (CPUE) at each lake will be calculated as the average catch rate (fish/hour) across the total number of nets. Proportional stock density (using 200 mm as stock length and 300 mm as quality length), size-at-age, and mean total length will characterize stock structure in each lake. Whole and sectioned otolith samples will be examined to determine fish age, and thermal-marks will be used to describe the age structure of the populations in each lake. Back-calculated length-at-age of marked fish will be calculated using Fish BC software (Fraser-Lee method) and whole otoliths. Growth rates across ploidy level will be compared using incremental growth.
RESULTS
Baseline samples of diploid kokanee were collected from all four water bodies in 2012. Montpelier Reservoir was sampled on the evening of June 27 with three nets for a total of 53.8 net hours and again on the evening of June 28 with three nets for a total of 52.1. Over both days, 172 kokanee were captured in 105.8 net hours for a CPUE of 1.63 kokanee/net hour. Kokanee lengths in Montpelier Reservoir ranged from 96–377 mm (Figures 11 and 12) with a mean length of 271 mm (± 8 mm). Mean weight of sampled kokanee was 198 g (± 16 g).
Devils Creek Reservoir was also sampled on the evening of June 28 with three nets for a total of 49.1 net hours. Total kokanee catch was 178 fish for a CPUE of 3.6 kokanee/net hour. Kokanee lengths in Devils Creek Reservoir ranged from 83–565 mm (Figures 11 and 12) with a mean length of 293 mm (± 20 mm). Mean weight of sampled kokanee was 390 g (± 107 g).
Mirror Lake was sampled on the evening of July 9 with three nets for a total of 46.5 net
hours. Total kokanee catch was 189 fish for a CPUE of 4.1 kokanee/net hour. Kokanee lengths in Mirror Lake ranged from 94–329 mm (Figures 11 and 12) with a mean length of 191 mm (± 6 mm). Mean weight of sampled kokanee was 65 g (± 5 g).
41

Twin Lake was sampled on the evening of July 10 with three nets for a total 47.0 net
hours and again on the evening of July 11 with three nets for a total of 42.8 net hours. Over both days, 273 kokanee were captured in 89.8 net hours for a CPUE of 3.0 kokanee/net hour. Kokanee lengths in Twin Lake ranged from 95–406 mm (Figures 11 and 12) with a mean length of 228 mm (± 12 mm). Mean weight of sampled kokanee was 235 g (± 21 g).
Sex and maturity levels of the baseline populations were variable across water bodies
(Table 9) and the sex and maturity level of a significant portion (25.4%–74.0%) of the fish at each water body could not be determined. Montpelier Reservoir had the highest percentage of sexually mature fish and all four water bodies had a higher percentage of sexually mature males than females.
DISCUSSION
At the time of this report, only initial baseline sampling of diploid kokanee at the four study water bodies has occurred. These samples show that the size, sex, and maturity structure across the four water bodies appear to be highly variable. However, there was a high proportion of fish in all water bodies that had unknown maturity levels. It may be more realistic to categorize fish as either mature or immature and remove the developing classification. This may make identifying level of maturity more straight forward.
Average lengths ranged from 191 mm to 293 mm and average weight ranging from 65 g to 390 g. Kokanee densities also appear to be highly variable with CPUEs ranging from 1.6 to 4.1 kokanee/net hour across water bodies. Mirror Lake kokanee were the smallest fish sampled, on average, but Mirror Lake also had the highest CPUE of the four waters. Devils Creek had the largest fish overall, but also had 74% of fish that were of unknown sex and maturity, indicating that determination of sex and maturity level from visual inspection may be more difficult than originally thought.
The age-structure of the populations in these water bodies is not yet known, as otoliths were being aged at the time of this report. A more complete analysis of the baseline samples, as well as data from the initial sampling post treatment, will be available in the July 2013-June 2014 report.
42

ACKNOWLEDGEMENTS
We would like to acknowledge Eric Herrera and Erin Larson for assisting with baseline sample collection. We would like to thank Steve Elle and Liz Mamer for their help with aging otoliths. We would also like to thank Bob Becker and the staff at Nampa Fish Hatchery for their assistance collecting and pressure shocking kokanee eggs at Deadwood Reservoir. Additionally, we would like to thank John Rankin and the staff at Cabinet Gorge Hatchery and Pat Moore and the staff at Mackay Hatchery for their work rearing and releasing fish. We also thank Mike Peterson and Kevin Meyer for editing this report.
43

REFERENCES
Beattie, W. D., and P. T. Clancey. 1991. Effects of Mysis relicta on the zooplankton community and kokanee population of Flathead Lake, Montana. American Fisheries Society Symposium 9: 39-48.
Habicht, C., J. E. Seeb, R. B. Gates, I. R. Brock, and C. A. Olito. 1994. Triploid coho salmon
outperform diploid and triploid hybrids between coho salmon and Chinook salmon during their first year. Canadian Journal of Fisheries and Aquatic Sciences 51:31-37.
Ihssen, P. E., L. R. McKay, I. McMillan, and R. B. Phillips. 1990. Ploidy manipulation and
gynogenesis in fishes: cytogenetic and fisheries applications. Transactions of the American Fisheries Society 119:698-717.
Johnston, N. T., E. A. Parkinson, and K. Tsumura. 1993. Longevity and growth of hormone-
sterilized kokanee. North American Journal of Fisheries Management 13:284-290. Koenig, M. K., and K. A. Meyer. 2011. Relative performance of diploid and triploid catchable
rainbow trout stocked in Idaho lakes and reservoirs. North American Journal of Fisheries Management 31: 605-613.
Koenig, M. K., J. R. Kozfkay, K. A. Meyer, and D. J. Schill. 2011. Performance of Diploid and
Triploid Rainbow Trout Stocked in Idaho Alpine Lakes. North American Journal of Fisheries Management 31: 124-133.
Myers, J. M., and W. K. Hershberger. 1991. Early growth and survival of heat shocked and
tetraploid-derived triploid rainbow trout. Aquaculture 96:97-101. Parkinson, E. A., and K. Tsumura. 1988. Growth and survival of hormone-sterilized coho
Oncorhynchus kisutch and kokanee salmon O. nerka in a lacustrine environment. Canadian Journal of Fisheries and Aquatic Sciences 45:1490-1494.
Rieman, B. E., and D. Myers. 1992. Influence of fish density and relative productivity on growth
of kokanee in ten oligotrophic lake and reservoirs in Idaho. Transactions of the American Fisheries Society 121:178-191.
Rieman, B. E., and M. A. Maiolie. 1995. Kokanee population density and resulting fisheries.
North American Journal of Fisheries Management 15:229-237. Rohrer, R. L., and G. H. Thorgaard. 1986. Evaluation of two hybrid trout strains in Henry’s Lake,
Idaho, and comments on the potential use of sterile triploid hybrids. North American Journal of Fisheries Management 6:367-371.
Sheehan, R. J., S. P. Shasteen, A. V. Suresh, A. R. Kapuscinski, and J. E. Seeb. 1999. Better
growth in all-female diploid and triploid rainbow trout. Transactions of the American Fisheries Society 128:491-498.
Strange, R. T. 1996. Field examination of fishes. Pages 433-446 in B. R. Murphy and D. W.
Willis, editors. Fisheries techniques, 2nd edition. American Fisheries Society, Bethesda, Maryland.
44

Teuscher, D. M., D. J. Schill, D. J. Megargle, and J. C. Dillon. 2003. Relative survival and growth of triploid and diploid rainbow trout in two Idaho reservoirs. North American Journal of Fisheries Management 23:983-988.
Wydoski, R. S., and D. H. Bennett. 1981. Forage species in lakes and reservoirs of the western
United States. Transaction of the American Fisheries Society 110:764-771.
45

Table 7. Current list of waters and stocking numbers for early kokanee. Selected study sites for evaluating switching to triploid-only stocking (treatment) are shown in bold font.
Table 8. Study timeline for stocking and monitoring diploid (2N) and triploid (3N) kokanee
in two control and two treatment lakes.
Table 9. Percent sex composition by maturity level of baseline samples from all four water
bodies in 2012.
Region Lake Name Hatchery Number Comments1 Hauser L. Cabinet Gorge 0 Stocking discontinued1 Hayden L. Cabinet Gorge 100,000 Fishery risk?1 Lower Twin L. Cabinet Gorge 60,000 Study site - TREATMENT1 Mirror L. Cabinet Gorge 5,000 Study site - CONTROL1 Spirit L. Cabinet Gorge 0 Stocking discontinued
3B Arrowrock Res. Mackay 50,000 Too big, fishery risk3B Lucky Peak Res. Mackay 200,000 Too big, fishery risk3M Cascade Res Mackay 250,000 Too big, natural production3M Payette L. Mackay 460,000 Too big, natural production3M Warm L. Cabinet Gorge 50,000 Natural production, 3N already4 Anderson Ranch Res. Mackay 0 Stocking discontinued5 Devils Creek Res. Mackay 7,000 Study site - TREATMENT5 Montpelier Res. Mackay 6,000 Study site - CONTROL6 Island Park Res. Mackay 250,000 Too big, fishery risk6 Ririe Res. Mackay 210,000 Too big, fishery risk
Treatment 2012 2013 2014 2015 2016 2017Control Stock 2N2N-no mark ages 0, 1, 2 0, 1, 2 0, 1, 2 0, 1, 2 0, 1, 2 0, 1, 2
Treatment Stock 2N Stock 3N only2N-no mark ages 0, 1, 2 1, 2 2 none none none3N-marked 0 0, 1 0, 1, 2 0, 1, 2, 3 0, 1, 2, 3, 4
Sex Mirror Lake Montpelier Reservoir
Devils Creek Twin Lake Total
Immature Female 0.0% 4.7% 0.0% 18.4% 6.6%Developing Female 19.4% 4.1% 6.6% 0.0% 6.6%
Mature Female 7.5% 17.6% 6.1% 10.0% 10.3%Immature Male 35.1% 5.9% 0.0% 5.0% 9.8%
Developing Male 0.0% 0.0% 0.0% 0.0% 0.0%Mature Male 12.7% 41.8% 13.3% 36.3% 27.0%
Unknown 25.4% 25.9% 74.0% 30.3% 39.8%
46
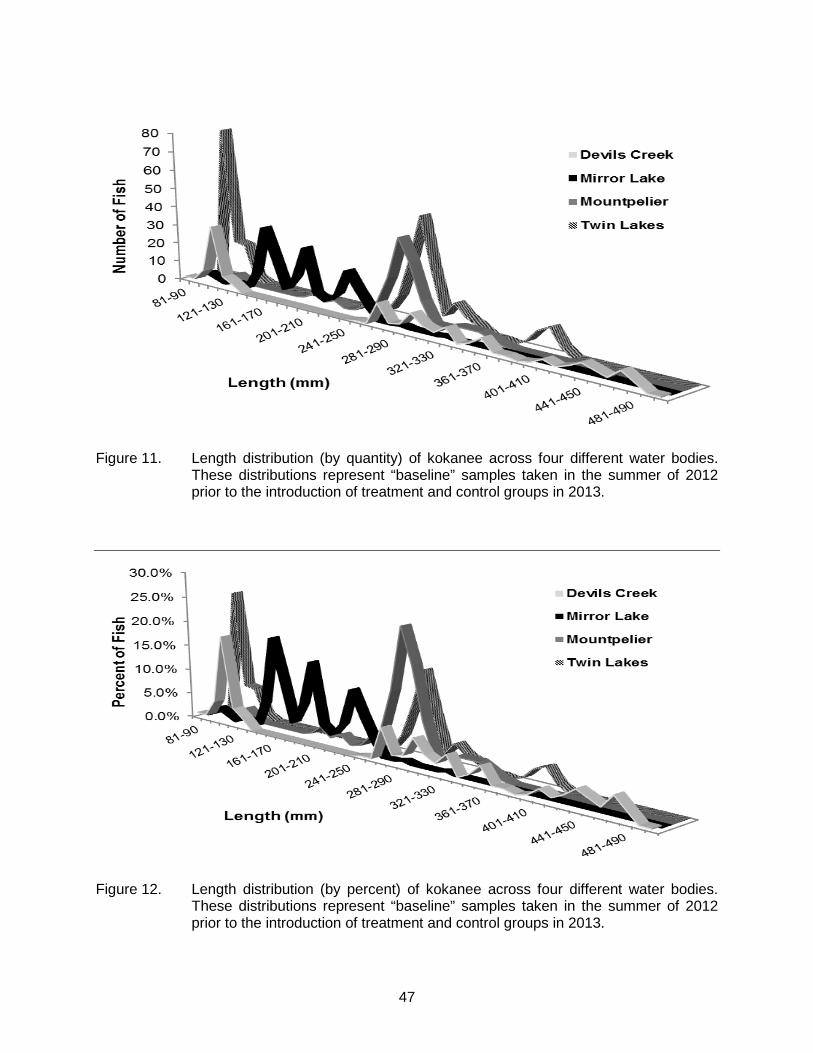
Figure 11. Length distribution (by quantity) of kokanee across four different water bodies.
These distributions represent “baseline” samples taken in the summer of 2012 prior to the introduction of treatment and control groups in 2013.
Figure 12. Length distribution (by percent) of kokanee across four different water bodies.
These distributions represent “baseline” samples taken in the summer of 2012 prior to the introduction of treatment and control groups in 2013.
47

Prepared by: Approved by: IDAHO DEPARTMENT OF FISH AND GAME John Cassinelli Daniel J. Schill Senior Fisheries Research Biologist Fisheries Research Manager Martin Koenig Edward B. Schriever, Chief Regional Fisheries Biologist Bureau of Fisheries
48