project and site description hollandse kust (west) wind
TRANSCRIPT

Hollandse Kust (west) Wind Farm Zone
Project and Site Description June 2021
>> Sustainable. Agricultural. Innovative. International.

This document has been produced for information purposes only and is not intended to replace any legal orformally communicated rules, regulations or requirements. More information on the site studies, including all reports and other deliverables mentioned in this PSD, can be found at offshorewind.rvo.nl when available.
Version June 2021
Netherlands Enterprise Agency2 Project and Site Description Hollandse Kust (west) 3
Foreword 4
1 Objectives and reading guide 6 1.1 Objectives 7 1.2 Reading guide 7 1.3 Site investigations quality and certification 7 1.4 Experts and contractors 10 1.5 PSD development 10
2 Offshore wind power development in the Netherlands 12 2.1 Looking towards 2030 and beyond 13 2.2 Zero-subsidy development 13 2.3 Wind & water works 14
3 Site description and offshore grid 16 3.1 General description of the Hollandse Kust (west) Wind Farm Zone 17 3.2 Layout and coordinates of HKWWFZ 17 3.3 Existing infrastructure 17 3.4 TenneT offshore grid connection system 18 3.5 Realisation Agreement and Connection and Transmission Agreement 18 3.6 Applicable codes 19 3.7 Step-by-step process to connection 19
4 Site Studies 20 4.1 Archaeological desk study 22 4.2 Unexploded ordnance (UXO) risk assessment desk study 24 4.3 Geological desk study 26 4.4 Geophysical survey 27 4.5 Archaeological assessment of Geophysical survey results 33 4.6 Geotechnical survey 35 4.7 Archaeological assessment of paleo-landscapes 46 4.8 Morphodynamics and Scour Mitigation desk study 48 4.9 Metocean desk study 54 4.10 Metocean measurement campaign 59 4.11 Wind Resource Assessment 63
5 Resources for further information 66 5.1 Useful websites to help keep track 67
Appendices 68
Contents
Netherlands Enterprise Agency4 Project and Site Description Hollandse Kust (west) 5
Thanks to a concerted effort by the industry and the relevant government agencies, progress in the Dutch offshore wind market has continued apace last year. The tender for the Hollandse Kust (noord) project was successfully completed in 2020. The first electricity was delivered to the onshore grid from the Borssele Offshore wind farms. Significantly, too, construction work on other Dutch offshore projects and the TenneT offshore grid network continued in a Covid-19-safe way during the difficult times we have all found ourselves facing during 2020.
As we publish this Project and Site Description (PSD) for the Hollandse Kust (west) Wind Farm Zone (HKWWFZ), the Netherlands' offshore programme moves forward to its next stage. Our ambition for offshore wind to become part of everyday Dutch life is resolute. We are now looking at the development of projects in Wind Farm Zones further out in the North Sea. The Government and wind industry groups are working closely with (coastal) municipalities, ports, and provinces to see how that can be done success- fully so we can seize the associated opportunities - economic and environmental - for the benefit of all.
Government agencies, industry, and environmental groups are working in a concerted effort to help Dutch citizens understand fully why we believe offshore wind power has a central role to play in our future. It will help in meeting our climate change agenda, create a significant number of jobs, and ensure the Netherlands has a sustainable, low carbon, electricity supply for the long term. As well as local consultations, a succesful school programme (primary) has already been created whilst colleges, universities, and knowledge institu-tes are establishing more programmes to ensure we have a skilled offshore wind workforce going forward.
For the wind industry itself, the Netherlands continues to provide a stable policy and investment environ-ment, thanks to our clear long-term vision and market framework. Innovation in the sector remains critical however, especially as projects move further out to sea. It is therefore good to see the industry bringing forward new solutions for the market, such as the unmanned Deep Dig-It trencher specially developed to bury the cables required as part of TenneT's offshore grid network for the Hollandse Kust (zuid) Wind Farm Zone. Such forward thinking developments are also needed to reduce environmental impact, or streamline O&M, or to ensure offshore wind plays a significant role in the growth of the green hydrogen market.
The Government continues to play its supportive role. For prospective developers of the HKWWFZ, the Netherlands Enterprise Agency (RVO) has maintained its emphasis on providing more complete and high-quality site data. A thorough quality assurance procedure has been followed for the HKW site investigations, including verification against applicable standards by accredited certification bodies. This PSD document therefore enables companies to optimise project designs and prepare bid(s) for the upcoming tender.
Meanwhile, we continue to share Dutch offshore wind experience with the rest of the world through our international campaign, Wind & water works. Through our Partners for International Business initiative, amongst others, we are also helping Dutch companies make the most of offshore wind opportunities elsewhere in Europe, along with those in Asia and the US.
Foreword

Netherlands Enterprise Agency6 Project and Site Description Hollandse Kust (west) 7
1.Objectives and reading guide
1.1 Objectives
This Project and Site Description (PSD) is for any party interested in participating in the planned permit tender for the Hollandse Kust (west) Wind Farm Sites (HKWWFS) VI and VII in the Netherlands. This PSD has been streamlined to provide a direct focus on project specification and development requirements along with site data (including maps and tables) and site investigation results. This PSD document therefore summarises: • A description of the site, surroundings, and characteristics of
HKWWFZ;• All data collected by the Netherlands Enterprise Agency (RVO)
regarding the physical environment of selected areas within the Hollandse Kust (west) Wind Farm Zone (HKWWFZ);
• A selection of constraints, technical requirements, and permit related issues deemed to be most relevant for development of HKWWFS VI and VII .
This document has been produced for information purposes only and is not intended to replace any legal or formally communicated rules, regulations, or requirements. More information on the site studies, including all reports and other deliverables mentioned in this PSD, can be found at offshorewind.rvo.nl.
Readers should note that information relating to the tender and permit process itself, as well as to the overarching legal frameworks and regulatory decisions pertinent to develop-ment of offshore wind projects in the HKWWFZ, will be made available after official publication in the Netherlands Government Gazette. Furthermore, publication of relevant laws and related bid documents and information can be found at rvo.nl/windenergie-op-zee. When the tender is officially opened, the application forms and related bid documents will be available to download at mijnrvo.nl.
1.2 Reading guide
This PSD for the HKWWFZ presents an overview of all relevant project requirements and site information for parties interested in preparing a bid for a permit to build and operate a wind farm at this site. This PSD covers the following aspects in the different chapters:
Chapter 1: Objectives and reading guide
Chapter 2: Offshore wind power development in the Netherlands Background information on Dutch offshore wind develop-ment to date, including progress on achieving the goals of the offshore wind energy roadmap 2030.
Chapter 3: Hollandse Kust (west) - site description General information on the HKWWFZ, the location, and surroundings. Information on the work on the offshore grid connection system by transmission system operator (TSO) TenneT is included.
Chapter 4: Site Studies and investigationsAn updated overview of all the studies, surveys, and measuring campaigns performed to date on the HKWWFZ, covering the following:• Obstructions: Archaeological desk study, Archaeological
assessment of Geophysical survey results, UXO risk assessment desk study, Palaeoenvironmental assessment;
• Soil: Geological desk study, Geophysical survey, Geo-technical survey, Morphodynamical and Scour Mitigation desk study;
• Wind and Water: Wind Resource Assessment, Metocean desk study, Metocean measurement campaign.
Chapter 5: Resources for further information Useful links for further information including Wind & water works.
1.3 Site investigations quality and certification1.3.1 ProcedureThe Netherlands Enterprise Agency (RVO), assisted by independent experts, managed the process of site investigati-ons for the HKWWFZ. RVO maintained a quality assurance procedure to provide accurate, practical, high quality studies.First, the scope of the different studies was determined using the following steps:1. RVO determined the preliminary scope of the different
studies. Lessons learned from the site investigations at the Borssele, Hollandse Kust (zuid), and (noord) Wind Farm Zones were taken into account;
2. Where applicable, input was provided on these scope descriptions by internal experts, other governmental departments, agencies, external experts, and the industry (Netherlands Wind Energy Association);
3. At market consultation sessions, the scope descriptions were discussed with market parties with input on complete-ness provided by the attendees at workshops;
4. The study deliverables were reviewed by internal experts from other governmental departments and external experts;
5. For studies with results becoming part of the design basis for the developer, the accredited certifying body DNV was contracted to confirm the completeness of the scope.

Netherlands Enterprise Agency8 Project and Site Description Hollandse Kust (west) 9
1.3.2 ProcurementThe procurement of the different studies was carried out in compliance with the applicable procurement procedures within RVO. The desk studies have been procured through a limited tender where, for each study, at least two expert parties were invited to submit their proposal. Some of the site investigations were procured through a public European tender. All proposals have been assessed by internal experts, other governmental departments, agencies, and external experts. Contractors were selected on the basis of determining the most economic advantageous offer, with safety, quality, and track record as the primary award criteria.
1.3.3 Quality assuranceAfter procurement, whilst work was being conducted by the specific contractor, quality assurance was performed as follows:1. A project team, from RVO and external experts, was
assigned for each study. The project team monitored that the execution of the scope was in compliance with the scope description;
2. Draft reports and other deliverables were reviewed by internal and independent, external experts;
3. Where applicable, accredited certifying body DNV reviewed reports and other deliverables and provided a Verification Letter to assure the results were acquired in compliance with DNVGL-SE-0190:2015-12 and other applicable industry standards. Certification deliverables are added to the published reports where applicable.
An overall Statement of Compliance for the complete set of site studies was issued in April 2021, allowing the studies to be used in the design basis of an offshore wind farm. The following was applied: Document No. DNVGL-SE-0190:2020-09 Project certification of wind power plants. DNV assesses the complete set of site studies as 'Cutting Edge'. By fulfilling the require-ments in DNVGL-SE-0190, the Site Assessment Requirements listed in EN 61400-22:2011-01 Wind turbines – Part 22: Conformity Testing and Certification are also fulfilled.
1.3.4 Certification statusSeveral site studies and investigations for the HKWWFZ have been conducted. Table 1.1 shows the status of individual and overall certification by DNV.
Change LogNotable changes in comparison to previous Project and Site Descriptions:• Morphodynamical and Scour Mitigation desk study shows a
higher level of detail because of the use of vibrocores;• The Geotechnical (GT) campaign results in a Ground Model
and a higher degree of Geotechnical Interpretation, including the delivery of Synthetic CPT profiles;
• DNV was assigned to validate the Geotechnical Parameters report and its use within a Design Basis for Offshore Wind Turbine Structures in accordance with DNVGL-ST-0437 and DNVGL-ST-0126. This Geotechnical Parameter report is considered as ‘cutting edge’, defining a new baseline for offshore wind farm tender preparations.
Site Studies Site Study Certification
Overall Certification
Archaeological desk study Quality approved Received in April 2021
Archaeological assessment Quality approved
Palaeoenvironmental assessment Quality approved
Geophysical campaign Certification received
Geological desk study Quality approved
UXO desk study Quality approved
Morphodynamics and Scour Mitigation desk study Certification received
Wind Resource Assessment desk study Certification received
Metocean desk study Certification received
Metocean measurement campaign Quality approved
Geotechnical survey results Certification received
Geotechnical interpretation Certification received
Table 1.1 Quality approval and certification status.
The accredited certification body is Germanischer Lloyd Industrial Services GmbH, Brooktorkai 18, 20457 Hamburg. DNV GL Renewables Certification is the trading name of DNV GL’s certification business in the renewable energy industry.
STATEMENT OF COMPLIANCE Statement No.: Issued SC-DNVGL-SE-0190-05500-2 2021-04-16
Issued for:
Site Conditions Assessment of
Wind Farm Zone Hollandse Kust (west) Comprising:
Wind Turbines, Substation and Power Cables Specified in Annex 1 Issued to:
Netherlands Enterprise Agency Croeselaan 15 3521 BJ Utrecht The Netherlands According to:
DNVGL-SE-0190:2020-09 Project certification of wind power plants Based on the documents: CR-SC-DNVGL-SE-0190-05500-2 Certification Report, dated 2021-04-16 Changes of the site conditions are to be approved by DNV GL. Hamburg, 2021-04-16
Hellerup, 2021-04-16
For DNV GL Renewables Certification
For DNV GL Renewables Certification
i.V. Fabio Pollicino Service Line Leader Project Certification
By DAkkS according DIN EN IEC/ISO 17065 accredited Certification Body for products. The accreditation is valid for the fields of certification listed in the certificate.
Helena Hunt Project Manager
1.3.5 Statement of Compliance

Netherlands Enterprise Agency10 11Project and Site Description Hollandse Kust (west)
1.4 Experts and contractors
Experts and contractors that have provided input in the process include:• BLIX Consultancy (Project management, experts);• Oldbaum (Project management, experts);• The Cultural Heritage Agency (experts, Archaeological desk
study);• Rijkswaterstaat;• Arcadis Nederland B.V. (Geological desk study);• REASeuro (UXO desk study);• Periplus (Archaeological desk study);• Tractebel (Wind Resource Assessment); • Deltares (Morphodynamical & Scour Mitigation desk study);• Fugro (Metocean campaign, Geophysical survey,
Geotechnical survey);• DHI (Metocean desk study);• RPS (Client reps Geophysical and Geotechnical survey);• DNV (experts, GIS);• DNV Denmark for Certification deliverables; • Ministry of Defence (experts, UXO desk study risk assessment).
1.5 PSD development
This Project and Site Description is developed and improved in cooperation with its users. We welcome feedback. Please send your feedback via [email protected].
Netherlands Enterprise Agency12 Project and Site Description Hollandse Kust (west) 13
The Netherlands started developing wind energy technology in the mid 1970’s and has been a key player ever since, both onshore and offshore, along the whole supply chain. In fact, the Netherlands was one of the first countries to install wind turbines offshore: in 1994 the Lely offshore wind farm was installed in the shallow waters of the ‘IJsselmeer’ and comprised four 0.5 MW NedWind 40/500 turbines which had a rotor diameter of 40 m. Almost three decades later, we have surpassed all earlier expectations, entering a period of zero-subsidy development for offshore wind in the Netherlands and the use of 11 MW turbines with rotor diameters of 200 m.
2.1 Looking towards 2030 and beyondIn September 2014, the Government published its first roadmap towards 4.5 GW of offshore wind in the Netherlands. This set out a schedule of tenders in designated Wind Farm Zones, offering 700 MW of development each year in the period 2015 - 2019, with all wind farms to be fully operational by 2023.
Borssele and Hollandse Kust (zuid) Wind Farm Zones were allocated 1.500 MW each, with 700 MW allocated for Hollandse Kust (noord). The Borssele wind farms have been developed and deliver electricity to the onshore grid. Commissioning of the Hollandse Kust (zuid) Wind Farm Sites (I-IV) is scheduled to start in the first half of 2022.
In light of the success of the initial roadmap, the Dutch Ministry of Economic Affairs and Climate Policy called for the deploy-ment of an additional 7 GW of offshore wind by 2030. This will bring the Netherlands' total offshore wind capacity to 11.5 GW. RVO and transmission system operator (TSO) TenneT are conducting the necessary preparations for the Wind Farm Zones to be developed until 2030.
The first, Hollandse Kust (west), for which this PSD is created, foresees a total of 1.4 GW (2 x 700 MW) of installed capacity. The wind farms will most likely be connected to the grid in a similar way as the previous wind farms: using 700 MW A/C platforms, infield cables with a voltage level of 66 kV, transmit-ted to shore with 220 kV AC export cables. RVO will provide a set of site data comparable with those for HKZWFZ and HKNWFZ. After Hollandse Kust (west), the next zone is Ten noorden van de Waddeneilanden, where 700 MW is planned. The third zone is IJmuiden Ver, with a planned capacity of 4 GW.
For offshore wind developments in the period after 2030, the Government and stakeholders are making preparations to designate new areas within the 'Programma Noordzee 2022-2027' (North Sea Programme 2022-2027).
The 'Ontwerp Programma Noordzee 2022-2027' (North Sea Programme Design 2022-2027) identifies eight new search areas, with an option for an additional 27 GW offshore wind after 2030. However, it is possible the Government will decide to accelerate the roll-out to meet the increased European CO2 reduction target for 2030. This would require an amendment to the 2030 roadmap, which will be up to a new cabinet to decide upon later in 2021.
The Ministry of Economic Affairs and Climate Policy has initiated a process to develop a new approach and Offshore Wind Roadmap towards 2040. On June 3, 2021, the process was kicked-off during a special webinar. Government, wind farm developers, grid operators, and industrial parties are working together to shape the new approach and roadmap towards 2040. For more information on this process and a link to the webinar recording please visit rvo.nl/onderwerpen/duurzaam-ondernemen/duurzame-energie-opwekken/windenergie-op-zee.
2.2 Zero-subsidy development
For the Hollandse Kust (zuid) Wind Farm Sites I and II (2017) and III and IV (2018) tenders, the Government decided to invite companies to submit zero-subsidy bids. This decision was made in light of the decreasing bids in the Netherlands (i.e. for the Borssele wind farms) and in Denmark, as well as companies submitting zero-subsidy bids for similar projects in Germany. The decision to see if companies could develop projects without the exploitation subsidies originally anticipated for the HKZWFZ proved right. These offshore wind farms will be the first built without state subsidy anywhere in the world.
2.Offshore wind power development in the Netherlands

Netherlands Enterprise Agency14 Project and Site Description Hollandse Kust (west) 15
On July 29, 2020, it was announced that CrossWind, a con sor tium comprising Shell and Eneco, is going to build and operate the third unsubsidised wind farm in the Dutch North Sea. The wind farm will be in the Hollandse Kust (noord) Wind Farm Zone (HKNWFZ). The wind farm will have a capacity of over 750 MW and its construction will mean that by 2023, offshore wind power will provide 16% of the Netherlands' electricity needs.
During the assessment of the tenders for this wind farm permit, one of the aspects focused on was the use of innovative applications. CrossWind will test a variety of innovations in the field of energy storage and flexibility, with the possibility of rolling them out on a larger scale at other wind farms in the future.
2.3 Wind & water works
The Dutch Government participates in active knowledge sharing with foreign government agencies in Europe, as well as in Asia and America. At the same time, we work with the industry, knowledge institutions, and trade organisations to create new opportunities for our supply chain in the Netherlands and across the globe. Once a year, we welcome foreign delegations and guests to the Netherlands for the Offshore Energy Exhibition and Conference (OEEC) in Amsterdam. During this three-day event, we share knowledge, network, present our innovative supply chain, and showcase new findings.
Are you interested in connecting with the Dutch Govern- ment, specific businesses, or knowledge institutions within our supply chain? Please visit Wind & water works (windandwaterworks.com). We are keen to learn and share our knowledge with others.
Please note: the schedule assumes the developments will fit within the ecological frameworks and that the permit procedures for the export cables and supply of electricity into the high-voltage grid will have been completed in a timely manner.
Capacity (GW) Wind Farm Zone Shortest distance from the coast Tender Year of commissioning
1.4 Hollandse Kust (west) 53 km 2021 2025 to 2026
0.7Ten noorden van de Waddeneilanden
56 km 2022 2027
4.0 IJmuiden Ver 62 km 2023 to 2024 2028 to 2029
Table 2.1 Development towards 2030.
Dutch Off shore Wind Farm Zones
Legenda
Current Dutch Wind Farm Zones: ~2,5 GW
Future Dutch Wind Farm Zones: ~8,5 GW
tenders 2023 - 2024
IJmuiden Ver4,000 MW
6
tender 2021
Hollandse Kust (west)1,400 MW
4
6
4
3
2
1
Site V Two Towers, 19 MW
Site III and IV Blauwwind, 731,5 MW
Site I and II Ørsted, 752 MW
Borssele 1
Site I and II Vatt enfall, 760 MW
Site III and IVVatt enfall,760 MW
Luchterduinen 129 MW
Hollandse Kust (zuid) 2
North Sea Coast
5662 53 24 18,5100 km 0 km
2146 5 3
Ten noorden van de Waddeneilanden 700 MW tender 2022
Gemini 600 MW
55
Hollandse Kust (noord)
Egmond aan Zee 108 MW
Prinses Amalia 120 MW
3
Site V CrossWind, 759 MW
December - 2020

Netherlands Enterprise Agency16 Project and Site Description Hollandse Kust (west) 17
3.Site description and offshore grid
3.1 General description of the Hollandse Kust (west)
Wind Farm Zone
Hollandse Kust (west) Wind Farm Zone (HKWWFZ) is located approximately 28.6 nautical miles (53 km) off the west coast of the Netherlands. There are two wind farm sites in tended within the HKWWFZ: HKW Wind Farm Site VI and VII (HKWWFS VI and VII).
3.2 Layout and coordinates of HKWWFZThe total surface area of both Wind Farm Sites within the zone is approximately 176 km2. The area includes safety zones and maintenance zones of infrastructure (active cables crossing the sites). This reduces the effective area available for new wind farm construction.
The two sites within the HKWWFZ will accommodate 2 x 700 MW of offshore wind power capacity. Transmission
system operator (TSO) TenneT will construct two offshore platforms with two grid connections within the HKWWFZ.
Coordinate tables for the boundaries of HKWWFS VI and VII, maintenance zones, infield cable corridors, and safety zones are published in Appendix C, Memo Boundaries and Coordinates, available on offshorewind.rvo.nl.
3.3 Existing infrastructure
3.3.1 Cables and pipelinesThere are several active and inactive existing cables and pipe lines crossing the HKWWFZ. These can be seen in Figure 3.1. The description of pipelines and cables in HKWWFZ can be found in Appendix C, which consists of a Word file and an Excel file.
3.3.2 Nearby Wind FarmsSites within both the Hollandse Kust (noord) and Hollandse Kust (zuid) Wind Farm Zones are currently under development. Please consult developers of the projects within these zones when conducting activities in these areas. Coordinates can be found in Appendix C.
540.000 550.000 560.000
5.83
0.00
05.
840.
000
5.85
0.00
0Active cables
Abandoned cables
Active pipelines
Abandoned pipelines
Wind Farm Site Boundary
Designated Wind Farm Zone
EPSG 25831 - ETRS89 / UTM zone 31N
¬«2
¬«6
¬«5
¬«4
¬«3
¬«1
¬«7
¬«8¬«9
¬«10
Figure 3.1 The Hollandse Kust (west) Wind Farm Zone and surrounding areas.
Netherlands Enterprise Agency18 Project and Site Description Hollandse Kust (west) 19
Table 3.1 Planned TenneT Platforms HKW.
3.3.3 Offshore platforms and other nearby activitiesThere are several existing (mining) platforms and boreholes (both active and inactive) in or around the HKWWFZ.
3.3.4 Exclusion zonesA 500 m safety zone is defined around the HKWWFZ. No construction ships or building activities are allowed in this safety zone. Pipelines and cables, including their maintenance zones (500 m on both sides of the pipelines/cables), are also excluded from the safety zone. The turbines need to be constructed and located in such a way that their blade tips are within the site boundaries and outside the maintenance zones.
There are plans for a new shipping corridor (Newcastle – IJmuiden) at the northern tip of HKWWFZ. This shipping corridor, including the safety zone, is planned not to cross the Wind Farm Sites, but this is still under negotiation as the Wind Farm Site Decisions are not final yet. Under the National Water Plan 2016-2021, vessels up to 24 m are allowed to cross the entire area (under conditions).
3.4 TenneT offshore grid connection systemThe Ministry of Economic Affairs and Climate Policy formally designated TenneT as offshore grid operator in the Netherlands on September 6, 2016. The Electricity Act 1998 introduced a ‘Development Framework for the offshore grid’, which provides a technical framework and outlines the future development of offshore wind energy in the Netherlands.
The Development Framework for the offshore grid was published by the Ministry of Economic Affairs and Climate Policy and amended in September 2018 and May 2021.
As prescribed in the Development Framework, TenneT will build grid connections for the 11.5 GW of new offshore wind capacity planned under the Offshore Wind Roadmap towards 2030.
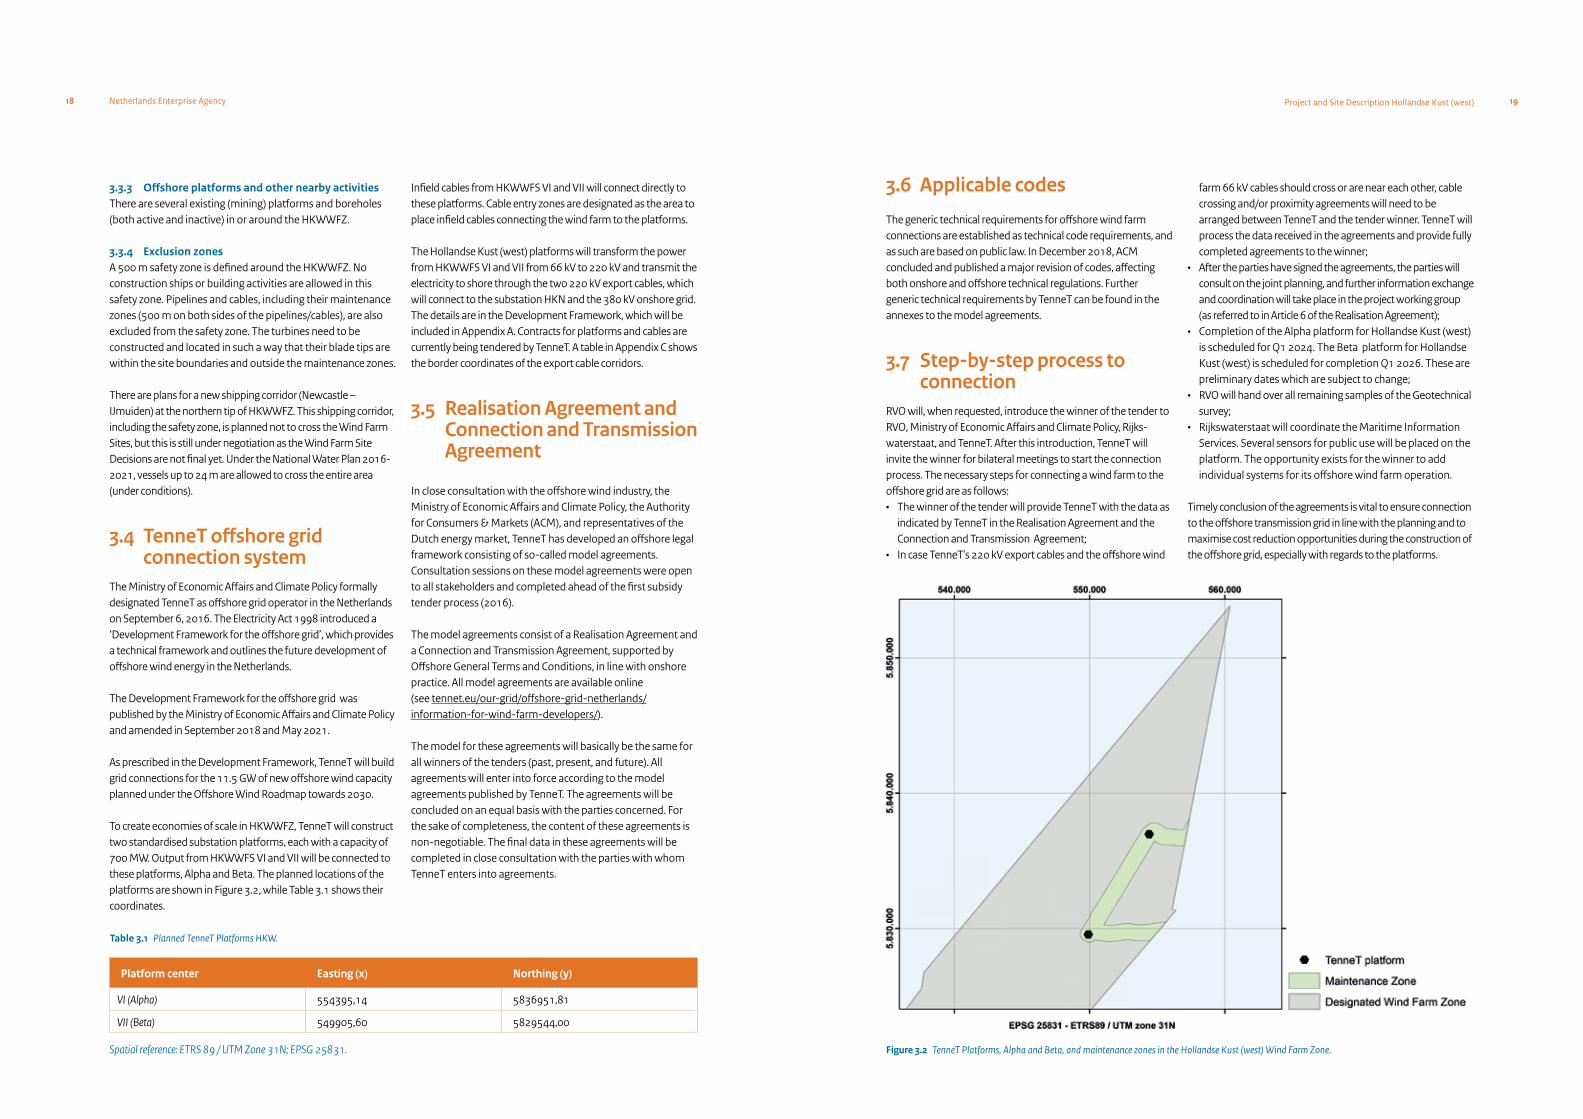
To create economies of scale in HKWWFZ, TenneT will construct two standardised substation platforms, each with a capacity of 700 MW. Output from HKWWFS VI and VII will be connected to these platforms, Alpha and Beta. The planned locations of the platforms are shown in Figure 3.2, while Table 3.1 shows their coordinates.
Infield cables from HKWWFS VI and VII will connect directly to these platforms. Cable entry zones are designated as the area to place infield cables connecting the wind farm to the platforms.
The Hollandse Kust (west) platforms will transform the power from HKWWFS VI and VII from 66 kV to 220 kV and transmit the electricity to shore through the two 220 kV export cables, which will connect to the substation HKN and the 380 kV onshore grid. The details are in the Development Framework, which will be included in Appendix A. Contracts for platforms and cables are currently being tendered by TenneT. A table in Appendix C shows the border coordinates of the export cable corridors.
3.5 Realisation Agreement and Connection and Transmission
Agreement
In close consultation with the offshore wind industry, the Ministry of Economic Affairs and Climate Policy, the Authority for Consumers & Markets (ACM), and representatives of the Dutch energy market, TenneT has developed an offshore legal frame work consisting of so-called model agreements. Consultation sessions on these model agreements were open to all stakeholders and completed ahead of the first subsidy tender process (2016).
The model agreements consist of a Realisation Agreement and a Connection and Transmission Agreement, supported by Offshore General Terms and Conditions, in line with onshore practice. All model agreements are available online (see tennet.eu/our-grid/offshore-grid-netherlands/information-for-wind-farm-developers/).
The model for these agreements will basically be the same for all winners of the tenders (past, present, and future). All agreements will enter into force according to the model agreements published by TenneT. The agreements will be concluded on an equal basis with the parties concerned. For the sake of completeness, the content of these agreements is non-negotiable. The final data in these agreements will be completed in close consultation with the parties with whom TenneT enters into agreements.
3.6 Applicable codes
The generic technical requirements for offshore wind farm connections are established as technical code requirements, and as such are based on public law. In December 2018, ACM concluded and published a major revision of codes, affecting both onshore and offshore technical regulations. Further generic technical requirements by TenneT can be found in the annexes to the model agreements.
3.7 Step-by-step process to connection RVO will, when requested, introduce the winner of the tender to RVO, Ministry of Economic Affairs and Climate Policy, Rijks-water staat, and TenneT. After this introduction, TenneT will invite the winner for bilateral meetings to start the connection process. The necessary steps for connecting a wind farm to the offshore grid are as follows:• The winner of the tender will provide TenneT with the data as
indicated by TenneT in the Realisation Agreement and the Connection and Transmission Agreement;
• In case TenneT's 220 kV export cables and the offshore wind
Platform center Easting (x) Northing (y)
VI (Alpha) 554395,14 5836951,81
VII (Beta) 549905,60 5829544,00
Spatial reference: ETRS 89 / UTM Zone 31N; EPSG 25831.
farm 66 kV cables should cross or are near each other, cable crossing and/or proximity agreements will need to be arranged between TenneT and the tender winner. TenneT will process the data received in the agreements and provide fully completed agreements to the winner;
• After the parties have signed the agreements, the parties will consult on the joint planning, and further information ex change and coordination will take place in the project working group (as referred to in Article 6 of the Realisation Agreement);
• Completion of the Alpha platform for Hollandse Kust (west) is scheduled for Q1 2024. The Beta platform for Hollandse Kust (west) is scheduled for completion Q1 2026. These are preliminary dates which are subject to change;
• RVO will hand over all remaining samples of the Geotechnical survey;
• Rijkswaterstaat will coordinate the Maritime Information Services. Several sensors for public use will be placed on the platform. The opportunity exists for the winner to add individual systems for its offshore wind farm operation.
Timely conclusion of the agreements is vital to ensure connection to the offshore transmission grid in line with the planning and to maximise cost reduction opportunities during the construction of the offshore grid, especially with regards to the platforms.
Figure 3.2 TenneT Platforms, Alpha and Beta, and maintenance zones in the Hollandse Kust (west) Wind Farm Zone.

Netherlands Enterprise Agency20 Project and Site Description Hollandse Kust (west) 21
Results from previous tenders show this approach will provide the basis for an optimal tender result. In providing a more comprehensive data package, risk is significantly reduced for the developer, as is the need for conservatism in the assumpti-ons of the tender design, while the business case for the project and the overall planning can be optimised.In this chapter, the scope of work and results of the individual studies and investigations are summarised, covering the following:• Obstructions: Archaeological desk study, Archaeological
assessment of Geophysical survey results, UXO risk assessment desk study, Palaeoenvironmental assessment;
• Soil: Geological desk study, Geophysical survey, Geotechnical survey, Morphodynamical and Scour Mitigation desk study;
• Wind and Water: Wind Resource Assessment, Metocean measurement campaign, Metocean desk study.
The Netherlands Enterprise Agency (RVO) is responsible for publishing the site information companies require to prepare bids for the permit tender for the HKWWFZ. The site information package has sufficient detail and quality to be used as input for preliminary engineering design studies.
Figure 4.1 Site studies and investigations for the Hollandse kust (west) Wind Farm Zone.
4.Site Studies
Metocean campaign *
TurbineInstallationprocedures
Turbine layout Foundation and cable design
ArchaeologyUnexploded
Ordnance (UXO)Geology Seabed
94,779 mm
Obstructions Soil
Wind resource Metocean
Wind & Water
Geophysical site investigation *
Geotechnical siteinvestigation *
UXO risk assessment **
Geological desk study **
Archaeological desk study **
Archaeological assessment **
Ground model *
Wind Resource Assessment *
Morphology study *
Yieldassessment
Metocean desk study *
* Certified, ** Quality approved
Figure 4.1 shows how the various studies and investigations relate to each other as well to which element of the wind farm design they feed into. The findings of the Archaeological, UXO and Geological desk studies were used to define the scope of work and basis of the Geophysical site investigation. The results of this comprehensive Geophysical site investigation refine and partly supersede those of the three earlier desk studies and further feeds into the main Archaeological assessment, the Geotechnical site investigation and the Morphodynamical study.
Meanwhile, the Wind Resource Assessment takes into account the intermediate findings of the Metocean measurement campaign. This PSD includes summaries of the studies and site investigations for the HKWWFZ.

Netherlands Enterprise Agency22 Project and Site Description Hollandse Kust (west) 23
4.1 Archaeological desk study
4.1.1 Overview - aims, objectives, and approachThe purpose of this study was to provide insight into any archaeological aspects that may have an impact on the development of the HKWWFZ (Figure 4.3). To meet this goal, available geological, archaeological, and historical sources have been studied, and information has been gathered on seabed disturbances induced by human activities in the past.The main objectives of the study were to:1. Assess whether archaeological remains (e.g. plane and ship
wrecks or prehistoric remains) are (or likely to be) present at the HKWWFZ. And if present:
2. Describe the known information (location, size, and dating) of these remains;
3. Assess the possible risks of offshore wind farm develop-ment on these remains;
4. Assess options to mitigate disturbance on these remains;5. Determine whether further archaeological assessments
should be carried out and make a recommendation on the scope of future investigations;
6. Specify obligations and requirements for any activity carried out in the Wind Farm Zone which may affect the archaeolo-gical aspects. These activities include (but are not limited to) site investigations, monitoring activities, installation activities, and operational activities.
4.1.2 SupplierPeriplus Archeomare was assigned by RVO to conduct an Archaeological desk study of the HKWWFZ. This company has a track record in maritime archaeological research, most notably the Archaeological desk study and assessment of geophysical data for the Hollandse Kust (noord) and Hollandse Kust (zuid) Wind Farm Zones.
4.1.3 ResultsThe studied wreck databases indicate that 23 known ship -wrecks are present in the HKWWFZ (Figure 4.2). Apart from the known wrecks, the area may contain remains of undisco-vered shipwrecks or WWII aircraft.
The desk study also concludes that locally in situ remains of prehistoric sites may be present. Late Paleolithic and Mesolithic campsites and inhumations can occur in the cover sand dunes and ridges (top of Wierden Member and embed-ded Usselo Bed), and along the valleys of small streams (Singraven Member). The covering Basal Peat Bed and Velsen Bed can contain well-preserved lost objects, intentional deposits, and dumps.
Remains of Neanderthal campsites can be expected along the shores of fresh water lakes and beaches of lagoons which developed at the transition from Eemian to Weichselian. The sediments (clay and sand) are part of the Brown Bank Member. Within the peat of the covering Woudenberg Formation, well-preserved lost objects, intentional deposits, and dumps can be encountered.
The ice-pushed river sands of the Yarmouth Roads Formation can contain reworked flint artefacts from Lower and Middle Paleolithic times. At the top of the ice-pushed ridge, in situ remains of campsites and inhumations of Neanderthal and Late Paleolithic and Mesolithic hunters and gatherers can be expected. The ice-pushed ridge pre-dates the above-men-tioned Eemian, Weichselian, and Early Holocene deposits. All archaeological levels of interest are located under a < 1 to 17 metre cover of Holocene deposits of the Bligh Bank Member, possibly preceded by the Naaldwijk Formation (Figure 4.2).
As Figure 4.2 shows, the maritime Archaeological desk study of the HKWWFZ indicates that 23 ship wrecks (22 ships and one submarine) are to be expected in the area. Six ship wrecks and a submarine have been identified. Four of the ship wrecks are recent and have no archaeological value, whilst two ship wrecks and the submarine do have archaeological value. For the other sixteen wrecks, details like name, type, and date of sinking are not known, nor are the exact locations. Additional information on these wrecks can be obtained by the execution of a geophysical site survey.
4.1.4 WebinarThe results of the Archaeological desk study performed at the HKWWFZ were presented and discussed at a webinar on October 15, 2020. Please refer to offshorewind.rvo.nl/obstructionsw for details.
4.1.5 Conclusions and recommendationsWithin the investigated area of the Wind Farm Zone, there is a high probability for the presence of (remains of) ship and plane wrecks, mostly resulting from WWII.
Periplus Archeomare recommends conducting a geophysical survey in order to:• Map the locations of known and unknown wreck sites in
detail and assess their potential archaeological value; and• Create an inventory of the parts of the HKWWFZ which have
not been investigated in previous surveys.The findings of this desk study have served as a starting point for subsequent investigation, most notably the Geophysical site investigation (section 4.4) and, following that, an Archaeological assessment of the Geophysical site investiga-tion (section 4.5). The results of this desk study are now to a large extent superseded by the findings of these reports.
Figure 4.2 Known objects in the HKWWFZ.
Figure 4.3 Historical map (1675) of the HKWWFZ investigation area and its surroundings.
Netherlands Enterprise Agency24 Project and Site Description Hollandse Kust (west) 25
4.2 Unexploded ordnance (UXO) risk assessment desk study
4.2.1 Overview - aims, objectives, and approachThe UXO desk study, performed in Q3 of 2018, provides initial insight into the risk of encountering unexploded ordnances (UXOs). The main objectives of this study are to:1. Identify risks and/or constraints for offshore wind farm related
activities in the HKWWFZ as a result of the presence of UXOs;2. Identify areas within the HKWWFZ where wind farm
construction or cable installation should be avoided;3. Identify requirements, from a UXO perspective, that should
be taken into account for: • Determining the different sites in the WFZ; • Carrying out safe geophysical and geotechnical
investigations; • Safe installation of wind turbine foundations; • Safe installation of cables.
4.2.2 SupplierREASeuro performed the UXO desk study. The company is specialised in (offshore) UXO desk studies, risk assessments, and UXO clearance operations. Since 2012, REASeuro has been involved with several offshore projects in the North Sea
and Persian Gulf, performing data analysis, project risk assessments, and coordination of UXO clearance activities. Moreover, the company has performed the UXO desk study for the Borssele and Hollandse Kust (zuid, noord) Wind Farm Zones and export cable routes.
4.2.3 ResultsThe UXO risk assessment study consists of two sequent phases: historical research (1) and UXO risk assessment (2). The historical research delivers essential input for the risk assessment.
According to the historical research, the HKWWFZ and surrounding areas were the scene of war-related activities during World War I and World War II.
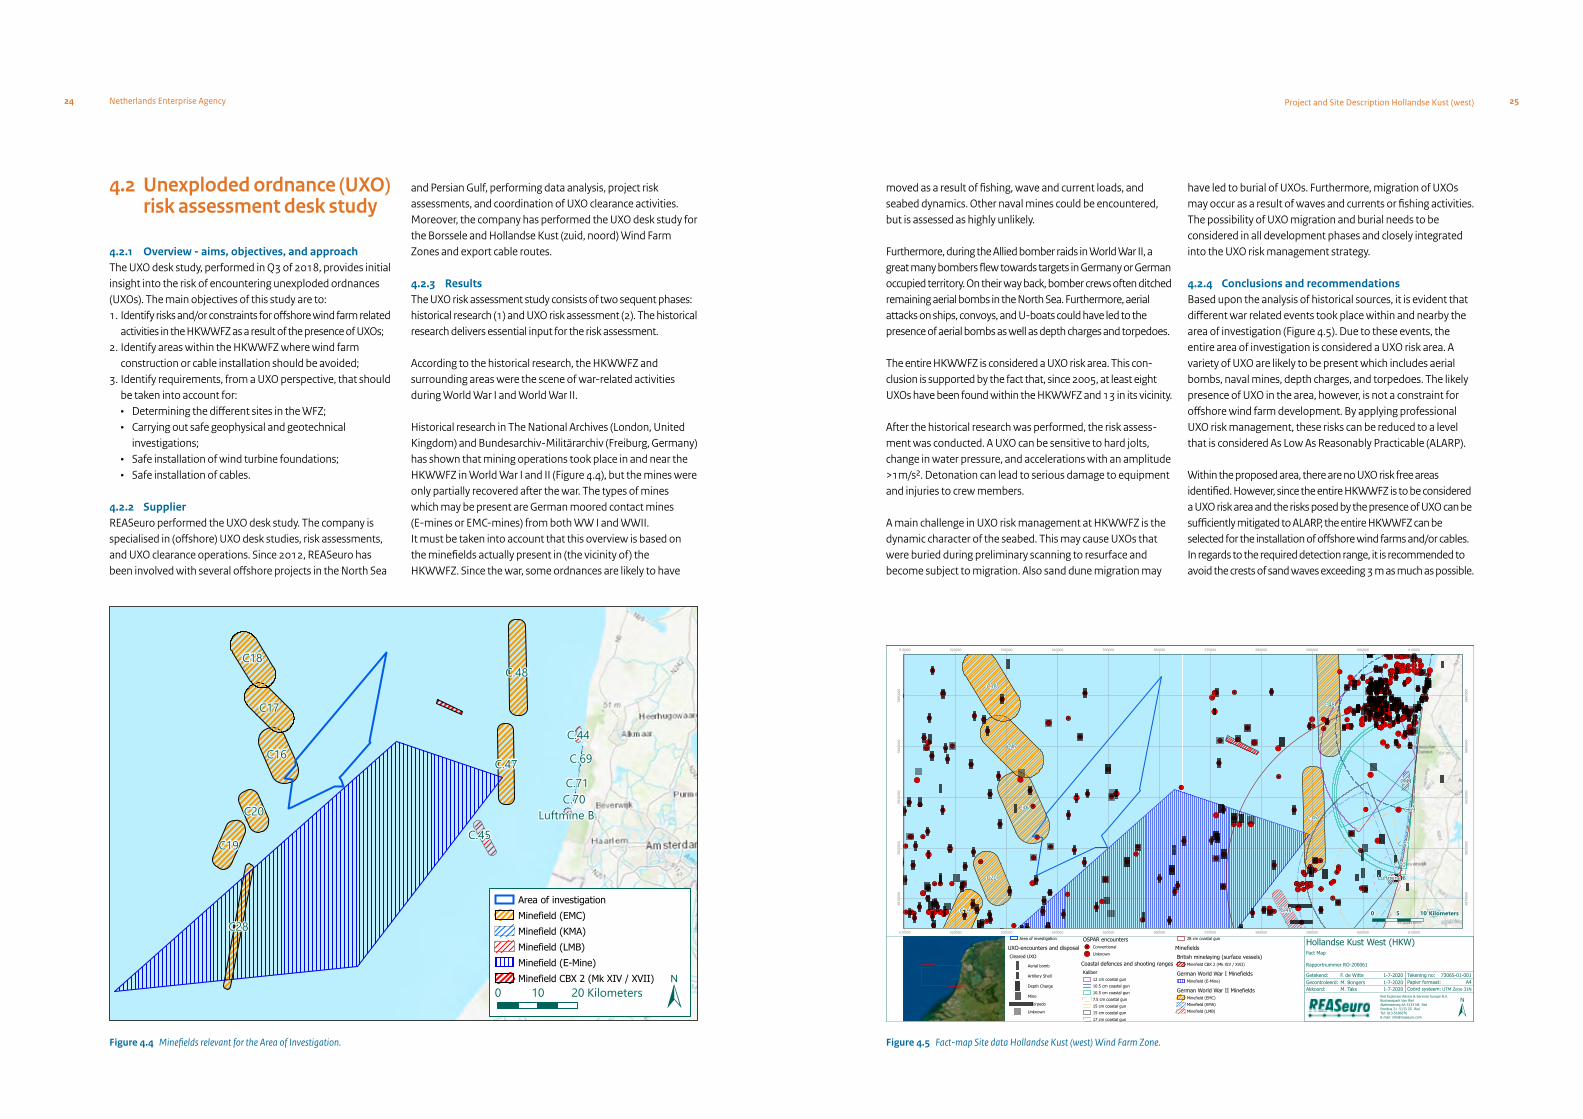
Historical research in The National Archives (London, United Kingdom) and Bundesarchiv-Militärarchiv (Freiburg, Germany) has shown that mining operations took place in and near the HKWWFZ in World War I and II (Figure 4.4), but the mines were only partially recovered after the war. The types of mines which may be present are German moored contact mines (E-mines or EMC-mines) from both WW I and WWII.It must be taken into account that this overview is based on the minefields actually present in (the vicinity of) the HKWWFZ. Since the war, some ordnances are likely to have
have led to burial of UXOs. Furthermore, migration of UXOs may occur as a result of waves and currents or fishing activities. The possibility of UXO migration and burial needs to be considered in all development phases and closely integrated into the UXO risk management strategy.
4.2.4 Conclusions and recommendationsBased upon the analysis of historical sources, it is evident that different war related events took place within and nearby the area of investigation (Figure 4.5). Due to these events, the entire area of investigation is considered a UXO risk area. A variety of UXO are likely to be present which includes aerial bombs, naval mines, depth charges, and torpedoes. The likely presence of UXO in the area, however, is not a constraint for offshore wind farm development. By applying professional UXO risk management, these risks can be reduced to a level that is considered As Low As Reasonably Practicable (ALARP).
Within the proposed area, there are no UXO risk free areas identified. However, since the entire HKWWFZ is to be considered a UXO risk area and the risks posed by the presence of UXO can be sufficiently mitigated to ALARP, the entire HKWWFZ can be selected for the installation of offshore wind farms and/or cables. In regards to the required detection range, it is recommended to avoid the crests of sand waves exceeding 3 m as much as possible.
moved as a result of fishing, wave and current loads, and seabed dynamics. Other naval mines could be encountered, but is assessed as highly unlikely.
Furthermore, during the Allied bomber raids in World War II, a great many bombers flew towards targets in Germany or German occupied territory. On their way back, bomber crews often ditched remaining aerial bombs in the North Sea. Furthermore, aerial attacks on ships, convoys, and U-boats could have led to the presence of aerial bombs as well as depth charges and torpedoes.
The entire HKWWFZ is considered a UXO risk area. This con- clusion is supported by the fact that, since 2005, at least eight UXOs have been found within the HKWWFZ and 13 in its vicinity.
After the historical research was performed, the risk assess-ment was conducted. A UXO can be sensitive to hard jolts, change in water pressure, and accelerations with an amplitude >1m/s². Detonation can lead to serious damage to equipment and injuries to crew members.
A main challenge in UXO risk management at HKWWFZ is the dynamic character of the seabed. This may cause UXOs that were buried during preliminary scanning to resurface and become subject to migration. Also sand dune migration may
C.48
C.45
C.44C.69
C.71C.70
C.47
Luftmine B
C19
C28
C20
C16
C17
C18
0 2010 Kilometers ±
Area of investigationMinefield (EMC)Minefield (KMA)Minefield (LMB)Minefield (E-Mine)Minefield CBX 2 (Mk XIV / XVII)
Figure 4.4 Minefields relevant for the Area of Investigation.
±Riel Explosive Advice & Services Europe B.V.Businesspark Van RielAlphenseweg 4A 5133 NE RielPostbus 21 5133 ZG RielTel: 013-5186076E-mail: [email protected]
UTM Zone 31NA4
73065-01-001
M. TaksM. BongersF. de Witte
Coörd systeem:Papier formaat:Tekening no:
1-7-20201-7-20201-7-2020
Akkoord:Gecontroleerd:Getekend:
Fact Map
Rapportnummer RO-200061
Hollandse Kust West (HKW)
C.48
C.45
C.44
C.69
C.71
C.70
C.47
Luftmine B
C19
C20
C16
C17
C18
5850000
5840000
5830000
5820000
5810000
5850000
5840000
5830000
5820000
5810000
610000600000590000580000570000560000550000540000530000520000510000
610000600000590000580000570000560000550000540000530000520000510000
Area of investigation
UXO-encounters and disposalCleared UXO
Aerial bomb
Artillery Shell
Depth Charge
Mine
Torpedo
Unknown
OSPAR encountersConventionalUnknown
Coastal defences and shooting rangesKaliber
12 cm coastal gun10.5 cm coastal gun10.5 cm coastal gun7.5 cm coastal gun15 cm coastal gun15 cm coastal gun17 cm coastal gun
28 cm coastal gun
MinefieldsBritish minelaying (surface vessels)
Minefield CBX 2 (Mk XIV / XVII)
German World War I MinefieldsMinefield (E-Mine)
German World War II MinefieldsMinefield (EMC)Minefield (KMA)Minefield (LMB)
0 105 Kilometers
Fact mapHollandse Kust West (HKW)
Figure 4.5 Fact-map Site data Hollandse Kust (west) Wind Farm Zone.

Netherlands Enterprise Agency26 Project and Site Description Hollandse Kust (west) 27
sufficient to detect ferrous naval mines which are likely to be present in the area. The risk also posed by the possible presence of depth charges and torpedoes will be mitigated sufficiently by applying the recommended threshold value.
4.2.5 UXO removal procedureWithin the Dutch Exclusive Economic Zone (EEZ), the Netherlands Explosive Disposal Authority (“Explosieven Opruimingsdienst”, EOD) is responsible for all maritime UXO disposal operations. If a wind farm developer identifies a UXO at a location where activities are planned, it needs to be removed. This should be reported to the Dutch Coastguard. Royal Netherlands Navy will dispose of the UXO. No disposal costs will be charged to the wind farm developer.
4.2.6 Webinar The results of the UXO risk assessment desk study performed at the HKWWFZ were presented and discussed at a webinar on October 8, 2020. Please refer to offshorewind.rvo.nl/obstructionsw for details.
4.3 Geological desk study
This study was the starting point for several other studies. However, more in-depth Geophysical and Geotechnical site investigations have since been conducted hence the desk study is not described further in this PSD.
4.4 Geophysical survey
4.4.1 Overview - aims, objectives, and approachThe Geophysical site survey at the Hollandse Kust (west) Wind Farm Zone (HKWWFZ) was designed to collect factual data on the seabed and sub-surface conditions, with the aim of improving the bathymetrical, morphological, and geological understanding of the area. The results were interpreted and integrated to form the basis for further geotechnical and morphodynamic studies. The resulting ground model serves as the basis for the design and installation of the wind farm infrastructure and support structures.
The possible effects of a detonation to vessels, equipment, personnel, and surroundings may form an intolerable risk. This means mitigation measures are required to reduce the risks to ALARP. It is recommended to investigate the possible presence of UXO by performing a UXO geophysical survey prior to any intrusive works. The mitigation measures consist of UXO survey, identification of potential UXO objects, re-routing or re-location of cables and structure if possible, and disposal of UXO items if required.
Due to the highly dynamic soil morphology and possible associated migration and burial of UXOs, it is recommended that companies conduct UXO search (and removal) operations immediately prior to construction activities at the intended construction locations. The limited temporal validity of the collected survey data should be taken into account when planning survey and construction operations.
According to the risk assessment, the 250 lbs Air Dropped Bomb is deemed the smallest ferrous threat item for an ALARP sign-off. The ferrous weight of these bombs can range from 50 kg to 83 kg dependent on the make, modification, and type of munition. Assuming these items can be successfully detected and identified within the geophysical datasets, larger objects will also be detectable. Magnetometry is generally considered the most reliable and common method of UXO geophysical survey. The provisional magnetometer (MAG) threshold is set on 50 kg ferrous mass. This threshold is also
In order to achieve these objectives, the specific aims of the Geophysical survey were to:• Present a detailed bathymetric chart; • Identify seabed features, including natural objects such as
boulders, man-made debris, existing infrastructure, and wrecks (both known and previously unmapped);
• Interpret and identify the main seismostratigraphic units, including any mobile sediments and any other significant interfaces that might impact on the engineering design;
• Locate any structural complexities or geohazards within the shallow geological succession such as faulting, accumulati-ons of shallow gas, peat, buried channels;
• Present a detailed geological interpretation to show facies variations and structural feature changes via appropriate maps and sections;
Figure 4.6 Overview of Bathymetry and cross section showing sand banks with superimposed sand waves and megaripples.

Netherlands Enterprise Agency28 Project and Site Description Hollandse Kust (west) 29
• Input into the specification and scope for a geotechnical sampling and testing programme;
• Present a comprehensive interpretation of the survey results to assist design of the offshore foundations, structures, and cable burial.
The Geophysical survey was carried out via two parallel campaigns. A shallow Geophysical survey was conducted by Fugro Frontier from October 22, 2018 to February 17, 2019. The deeper geological conditions were investigated using the ultra-high-resolution multi-channel seismic acquisition on survey vessel Fugro Pioneer between October 11, 2018 and January 25, 2019. Equipment used to carry out the investiga-tion included multi-beam echo sounder (MBES), side scan sonar (SSS), marine magnetometer (MAGN), sub-bottom profiler (SBP), single-channel high-resolution seismic sparker (SCS), and multi-channel high-resolution sparker (MCS).
4.4.2 SupplierFugro was contracted by RVO to conduct the Geophysical survey of the HKWWFZ. Fugro is an integrator of geotechnical, survey, subsea, and geosciences services.
Services are designed to support engineering design and large structure building projects. The company has previously performed investigations for offshore wind farm projects in The Netherlands, Belgium, United Kingdom, Denmark, and Germany. The company is familiar with the local conditions and technical requirements for a Geophysical survey of the HKWWFZ. DNV was contracted to review the study results and provide certification of the results.
4.4.3 Results4.4.3.1 Bathymetry and seabed morphologyThe water depth generally increases from the north-east towards the south-west with minimum values of 18.5 m LAT at the top of the sand bank crests to a maximum of 35.5 m LAT, adjacent to a sandbank in the south-west of the HKWWFZ. The seabed in the survey area is characterised by a highly dynamic morphology with mobile sedimentary bedforms. These bedforms are superimposed, forming a compound of flow transverse marine subaqueous dunes and have the following order of decreasing magnitude: sandbanks, sand waves, and megaripples (Figure 4.6).
Three sand banks run in a north-north-east to south-south-west direction with maximum heights of 6 m and wavelengths of up to 10 km.
Sand waves occur over the entire site with a west-north-west crest direction and average wave lengths of 350 m, although they can vary between 120 m and 700 m. Wave height varies between 1.5 m and 5 m. The sand waves generally show a north-north-east facing lee side, suggesting a prograding movement in the same direction.
Megaripples are ubiquitous across the survey area and typically superimposed on the stoss-side of the sand waves with crest directions of west-north-west to east-south-east. Their wave lengths range between 10 m and 20 m and wave heights range from 0.5 m to 1.5 m. Based on the morphology and depositional regime, the seafloor sediment was classified as predominantly sand.
4.4.3.2 Wrecks, cables, pipelines, and oil installationsInfrastructure and wrecks were identified via a combination of MBES, SSS, and MAGN. Eight pipelines, with 24 associated rock dumps, were observed and five cables were detected and confirmed against existing databases. Three platforms were observed, the P6-B platform in the north-east, the P6-D platform near the north-western survey boundary, and the P09-Horizon platform on the south eastern boundary. Spudcan depressions were observed at the site of two abandoned well heads in the eastern side of the survey area.
Nine wrecks were identified and correlated to wreck positions in the provided Archaeological desk study. One possible wreck, not previously listed, was observed in MBES and SSS. (Figure 4.7). A cluster of high amplitude magnetic anomalies located near the crest of a sand wave suggests a possible wreck or structure (Figure 4.8). Eight additional wrecks listed in the database were not detected during the survey.
4.4.3.3 Sedimentary regimeThe interpretation of the sub-surface was based on multi-channel ultra-high resolution seismic (MCS), single channel ultra-high resolution seismic (SCS), and sub-bottom profiler (SBP) data, to a depth of 120 m below seabed. Seven seismostratigraphical units were initially identified and interpreted in the HKWWFZ. The geological ground model HKW has now been delivered, based on the results of the geotechnical works HKW. Results are presented in section 4.6. The geological ground model as delivered with the ‘Geological desk study HKW’ and ‘Geophysical survey HKW’ is therefore superseded.
Figure 4.7 Possible and previously unknown wreck, seen on MBES and SSS.

Netherlands Enterprise Agency30 Project and Site Description Hollandse Kust (west) 31
Figure 4.8 Cluster of magnetic anomalies and high amplitude reflection on SBP. Figure 4.9 Distribution of palaeochannels within Unit B.
Netherlands Enterprise Agency32 Project and Site Description Hollandse Kust (west) 33
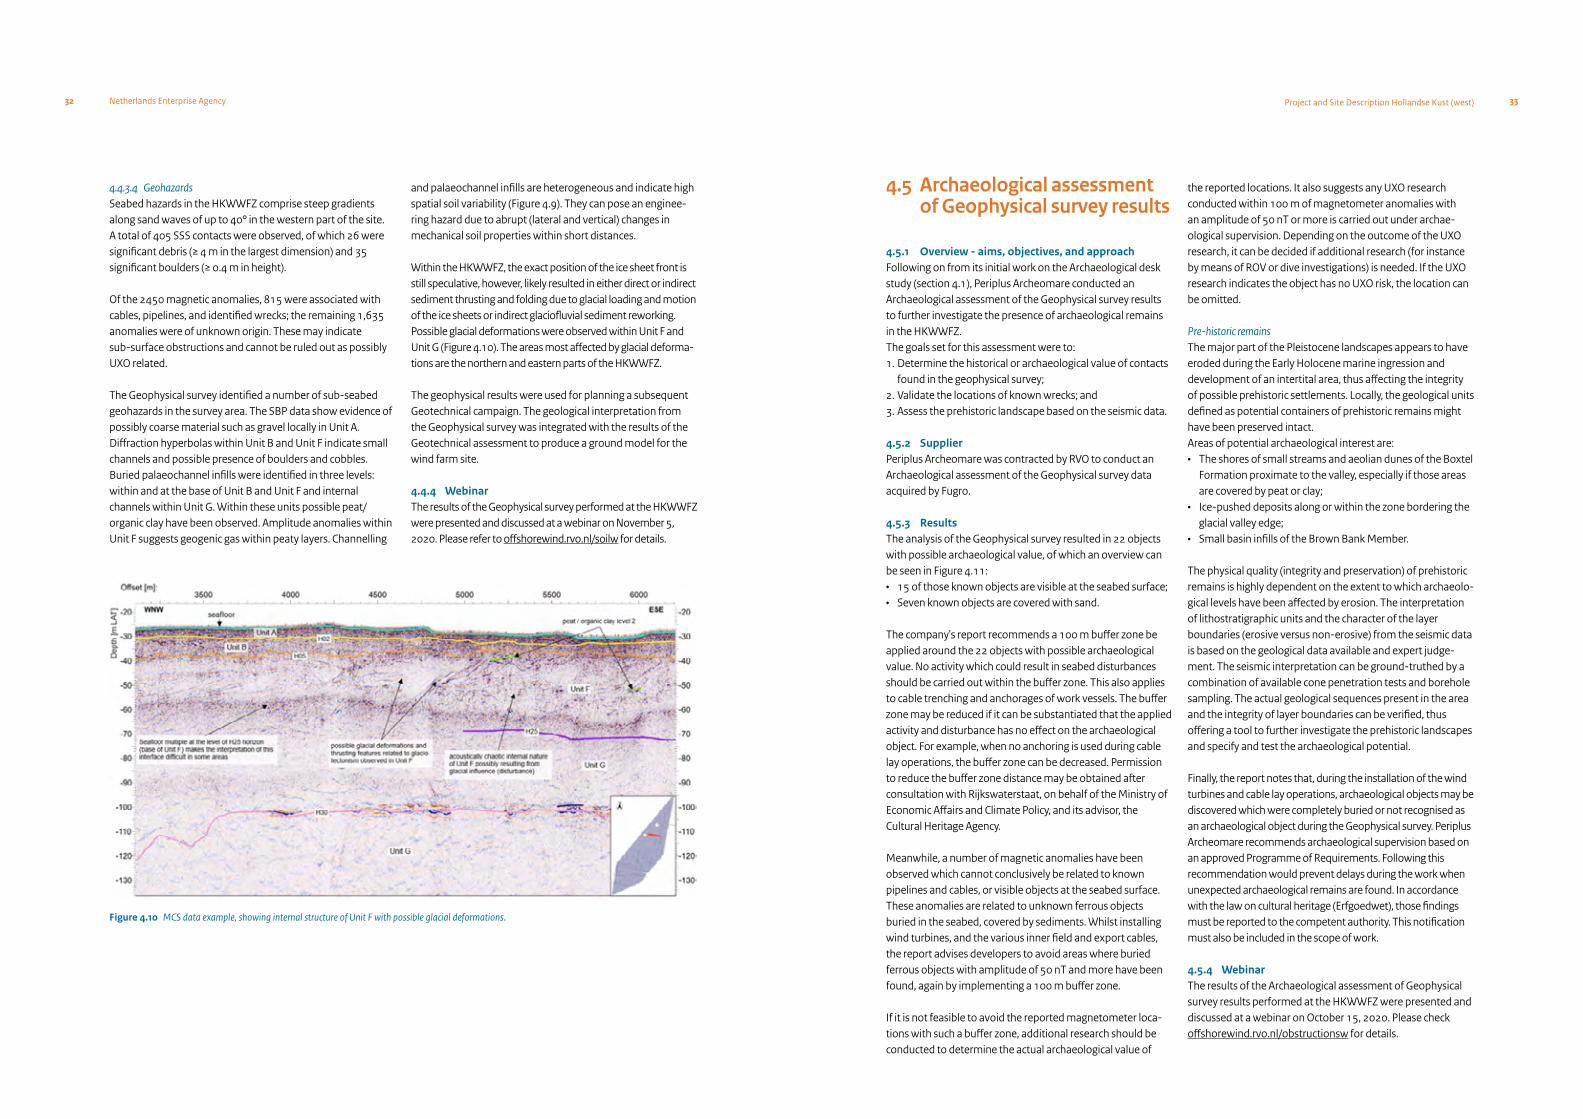
Figure 4.10 MCS data example, showing internal structure of Unit F with possible glacial deformations.
4.4.3.4 GeohazardsSeabed hazards in the HKWWFZ comprise steep gradients along sand waves of up to 40° in the western part of the site. A total of 405 SSS contacts were observed, of which 26 were significant debris (≥ 4 m in the largest dimension) and 35 significant boulders (≥ 0.4 m in height).
Of the 2450 magnetic anomalies, 815 were associated with cables, pipelines, and identified wrecks; the remaining 1,635 anomalies were of unknown origin. These may indicate sub-surface obstructions and cannot be ruled out as possibly UXO related.
The Geophysical survey identified a number of sub-seabed geohazards in the survey area. The SBP data show evidence of possibly coarse material such as gravel locally in Unit A. Diffraction hyperbolas within Unit B and Unit F indicate small channels and possible presence of boulders and cobbles. Buried palaeochannel infills were identified in three levels: within and at the base of Unit B and Unit F and internal channels within Unit G. Within these units possible peat/organic clay have been observed. Amplitude anomalies within Unit F suggests geogenic gas within peaty layers. Channelling
and palaeochannel infills are heterogeneous and indicate high spatial soil variability (Figure 4.9). They can pose an enginee-ring hazard due to abrupt (lateral and vertical) changes in mechanical soil properties within short distances.
Within the HKWWFZ, the exact position of the ice sheet front is still speculative, however, likely resulted in either direct or indirect sediment thrusting and folding due to glacial loading and motion of the ice sheets or indirect glaciofluvial sediment reworking. Possible glacial deformations were observed within Unit F and Unit G (Figure 4.10). The areas most affected by glacial deforma-tions are the northern and eastern parts of the HKWWFZ.
The geophysical results were used for planning a subsequent Geotechnical campaign. The geological interpretation from the Geophysical survey was integrated with the results of the Geotechnical assessment to produce a ground model for the wind farm site.
4.4.4 WebinarThe results of the Geophysical survey performed at the HKWWFZ were presented and discussed at a webinar on November 5, 2020. Please refer to offshorewind.rvo.nl/soilw for details.
4.5 Archaeological assessment of Geophysical survey results
4.5.1 Overview - aims, objectives, and approachFollowing on from its initial work on the Archaeological desk study (section 4.1), Periplus Archeomare conducted an Archaeological assessment of the Geophysical survey results to further investigate the presence of archaeological remains in the HKWWFZ.The goals set for this assessment were to:1. Determine the historical or archaeological value of contacts
found in the geophysical survey;2. Validate the locations of known wrecks; and3. Assess the prehistoric landscape based on the seismic data.
4.5.2 SupplierPeriplus Archeomare was contracted by RVO to conduct an Archaeological assessment of the Geophysical survey data acquired by Fugro.
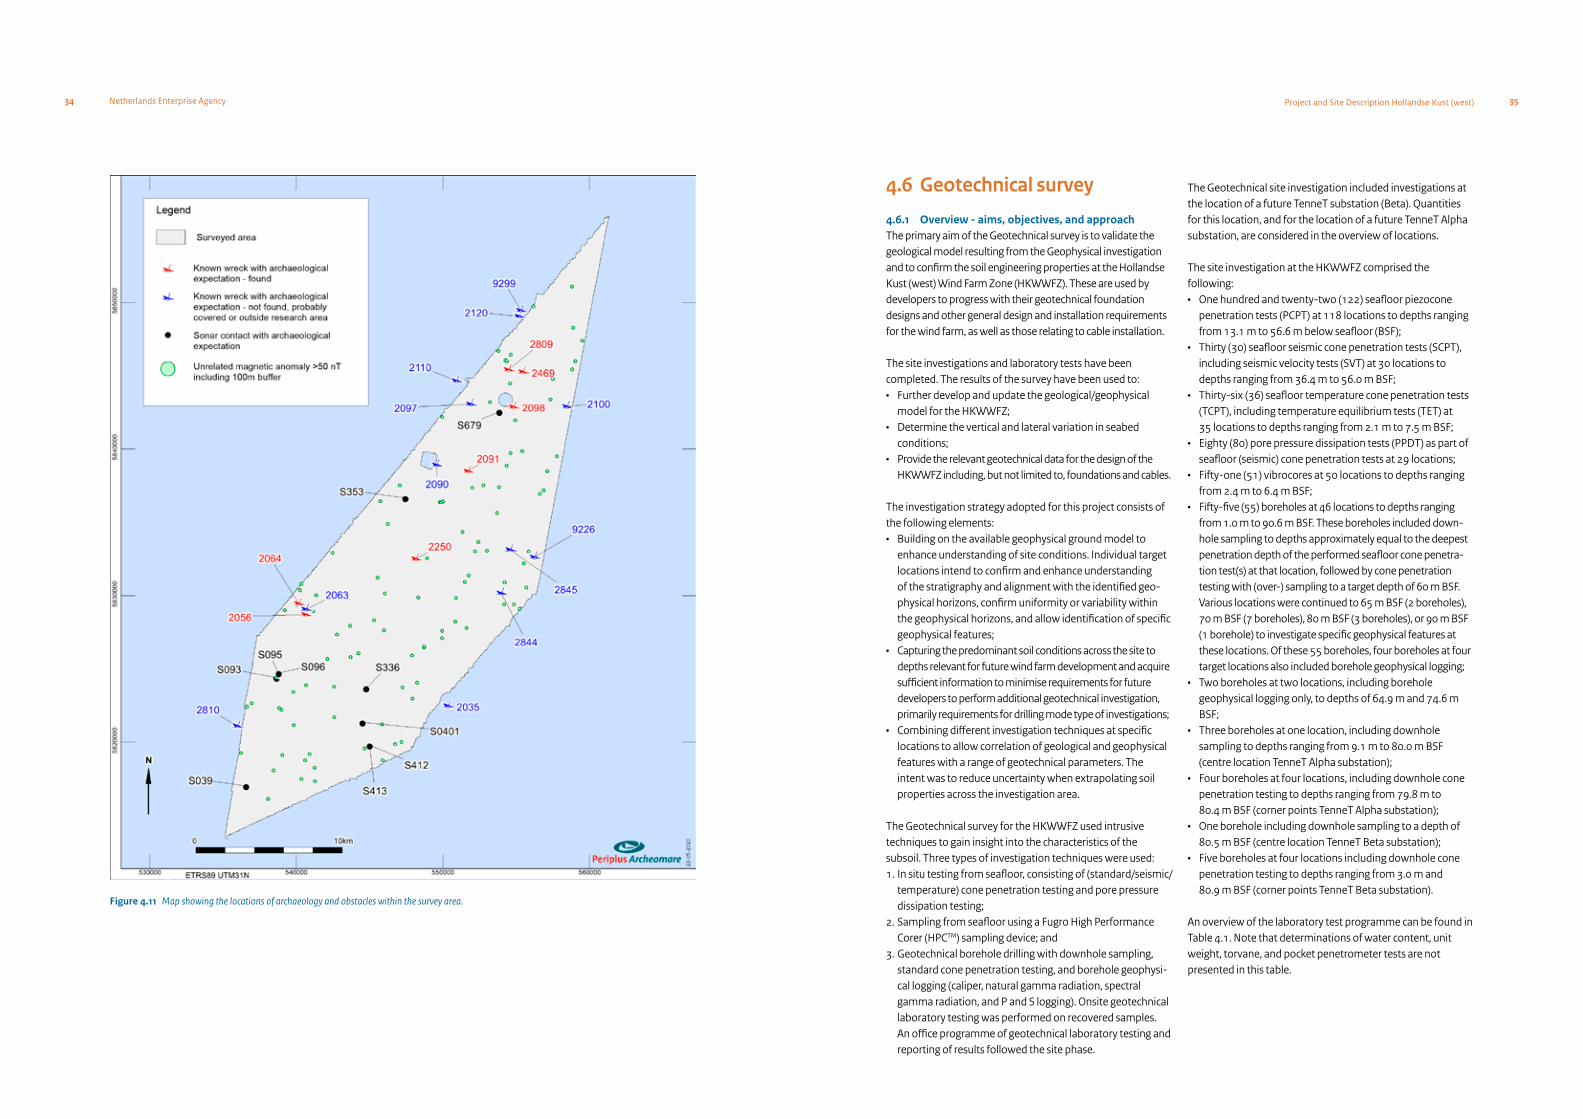
4.5.3 ResultsThe analysis of the Geophysical survey resulted in 22 objects with possible archaeological value, of which an overview can be seen in Figure 4.11:• 15 of those known objects are visible at the seabed surface;• Seven known objects are covered with sand.
The company's report recommends a 100 m buffer zone be applied around the 22 objects with possible archaeological value. No activity which could result in seabed disturbances should be carried out within the buffer zone. This also applies to cable trenching and anchorages of work vessels. The buffer zone may be reduced if it can be substantiated that the applied activity and disturbance has no effect on the archaeological object. For example, when no anchoring is used during cable lay operations, the buffer zone can be decreased. Permission to reduce the buffer zone distance may be obtained after consultation with Rijkswaterstaat, on behalf of the Ministry of Economic Affairs and Climate Policy, and its advisor, the Cultural Heritage Agency.
Meanwhile, a number of magnetic anomalies have been observed which cannot conclusively be related to known pipelines and cables, or visible objects at the seabed surface. These anomalies are related to unknown ferrous objects buried in the seabed, covered by sediments. Whilst installing wind turbines, and the various inner field and export cables, the report advises developers to avoid areas where buried ferrous objects with amplitude of 50 nT and more have been found, again by implementing a 100 m buffer zone.
If it is not feasible to avoid the reported magnetometer loca-tions with such a buffer zone, additional research should be conducted to determine the actual archaeological value of
the reported locations. It also suggests any UXO research conducted within 100 m of magnetometer anomalies with an amplitude of 50 nT or more is carried out under archae-ological supervision. Depending on the outcome of the UXO research, it can be decided if additional research (for instance by means of ROV or dive investigations) is needed. If the UXO research indicates the object has no UXO risk, the location can be omitted. Pre-historic remainsThe major part of the Pleistocene landscapes appears to have eroded during the Early Holocene marine ingression and development of an intertital area, thus affecting the integrity of possible prehistoric settlements. Locally, the geological units defined as potential containers of prehistoric remains might have been preserved intact.Areas of potential archaeological interest are:• The shores of small streams and aeolian dunes of the Boxtel
Formation proximate to the valley, especially if those areas are covered by peat or clay;
• Ice-pushed deposits along or within the zone bordering the glacial valley edge;
• Small basin infills of the Brown Bank Member.
The physical quality (integrity and preservation) of prehistoric remains is highly dependent on the extent to which archaeolo-gical levels have been affected by erosion. The interpretation of lithostratigraphic units and the character of the layer boundaries (erosive versus non-erosive) from the seismic data is based on the geological data available and expert judge-ment. The seismic interpretation can be ground-truthed by a combination of available cone penetration tests and borehole sampling. The actual geological sequences present in the area and the integrity of layer boundaries can be verified, thus offering a tool to further investigate the prehistoric landscapes and specify and test the archaeological potential.
Finally, the report notes that, during the installation of the wind turbines and cable lay operations, archaeological objects may be discovered which were completely buried or not recognised as an archaeological object during the Geophysical survey. Periplus Archeomare recommends archaeological supervision based on an approved Programme of Require ments. Following this recommendation would prevent delays during the work when unexpected archaeological remains are found. In accordance with the law on cultural heritage (Erfgoed wet), those findings must be reported to the competent authority. This notification must also be included in the scope of work.
4.5.4 WebinarThe results of the Archaeological assessment of Geophysical survey results performed at the HKWWFZ were presented and discussed at a webinar on October 15, 2020. Please check offshorewind.rvo.nl/obstructionsw for details.
Netherlands Enterprise Agency34 Project and Site Description Hollandse Kust (west) 35
Figure 4.11 Map showing the locations of archaeology and obstacles within the survey area.
4.6 Geotechnical survey
4.6.1 Overview - aims, objectives, and approachThe primary aim of the Geotechnical survey is to validate the geological model resulting from the Geophysical investigation and to confirm the soil engineering properties at the Hollandse Kust (west) Wind Farm Zone (HKWWFZ). These are used by developers to progress with their geotechnical foundation designs and other general design and installation requirements for the wind farm, as well as those relating to cable installation.
The site investigations and laboratory tests have been completed. The results of the survey have been used to:• Further develop and update the geological/geophysical
model for the HKWWFZ;• Determine the vertical and lateral variation in seabed
conditions;• Provide the relevant geotechnical data for the design of the
HKWWFZ including, but not limited to, foundations and cables.
The investigation strategy adopted for this project consists of the following elements:• Building on the available geophysical ground model to
enhance understanding of site conditions. Individual target locations intend to confirm and enhance understanding of the stratigraphy and alignment with the identified geo -physical horizons, confirm uniformity or variability within the geophysical horizons, and allow identification of specific geophysical features;
• Capturing the predominant soil conditions across the site to depths relevant for future wind farm development and acquire sufficient information to minimise requirements for future developers to perform additional geotechnical investigation, primarily requirements for drilling mode type of investigations;
• Combining different investigation techniques at specific locations to allow correlation of geological and geophysical features with a range of geotechnical parameters. The intent was to reduce uncertainty when extrapolating soil properties across the investigation area.
The Geotechnical survey for the HKWWFZ used intrusive techniques to gain insight into the characteristics of the subsoil. Three types of investigation techniques were used:1. In situ testing from seafloor, consisting of (standard/seismic/
temperature) cone penetration testing and pore pressure dissipation testing;
2. Sampling from seafloor using a Fugro High Performance Corer (HPCTM) sampling device; and
3. Geotechnical borehole drilling with downhole sampling, standard cone penetration testing, and borehole geophysi-cal logging (caliper, natural gamma radiation, spectral gamma radiation, and P and S logging). Onsite geotechnical laboratory testing was performed on recovered samples. An office programme of geotechnical laboratory testing and reporting of results followed the site phase.
The Geotechnical site investigation included investigations at the location of a future TenneT substation (Beta). Quantities for this location, and for the location of a future TenneT Alpha substation, are considered in the overview of locations.
The site investigation at the HKWWFZ comprised the following:• One hundred and twenty-two (122) seafloor piezocone
penetration tests (PCPT) at 118 locations to depths ranging from 13.1 m to 56.6 m below seafloor (BSF);
• Thirty (30) seafloor seismic cone penetration tests (SCPT), including seismic velocity tests (SVT) at 30 locations to depths ranging from 36.4 m to 56.0 m BSF;
• Thirty-six (36) seafloor temperature cone penetration tests (TCPT), including temperature equilibrium tests (TET) at 35 locations to depths ranging from 2.1 m to 7.5 m BSF;
• Eighty (80) pore pressure dissipation tests (PPDT) as part of seafloor (seismic) cone penetration tests at 29 locations;
• Fifty-one (51) vibrocores at 50 locations to depths ranging from 2.4 m to 6.4 m BSF;
• Fifty-five (55) boreholes at 46 locations to depths ranging from 1.0 m to 90.6 m BSF. These boreholes included down-hole sampling to depths approximately equal to the deepest penetration depth of the performed seafloor cone penetra-tion test(s) at that location, followed by cone penetration testing with (over-) sampling to a target depth of 60 m BSF. Various locations were continued to 65 m BSF (2 boreholes), 70 m BSF (7 boreholes), 80 m BSF (3 bore holes), or 90 m BSF (1 borehole) to investigate specific geophysical features at these locations. Of these 55 boreholes, four boreholes at four target locations also included borehole geophysical logging;
• Two boreholes at two locations, including borehole geophysical logging only, to depths of 64.9 m and 74.6 m BSF;
• Three boreholes at one location, including downhole sampling to depths ranging from 9.1 m to 80.0 m BSF (centre location TenneT Alpha substation);
• Four boreholes at four locations, including downhole cone penetration testing to depths ranging from 79.8 m to 80.4 m BSF (corner points TenneT Alpha substation);
• One borehole including downhole sampling to a depth of 80.5 m BSF (centre location TenneT Beta substation);
• Five boreholes at four locations including downhole cone penetration testing to depths ranging from 3.0 m and 80.9 m BSF (corner points TenneT Beta substation).
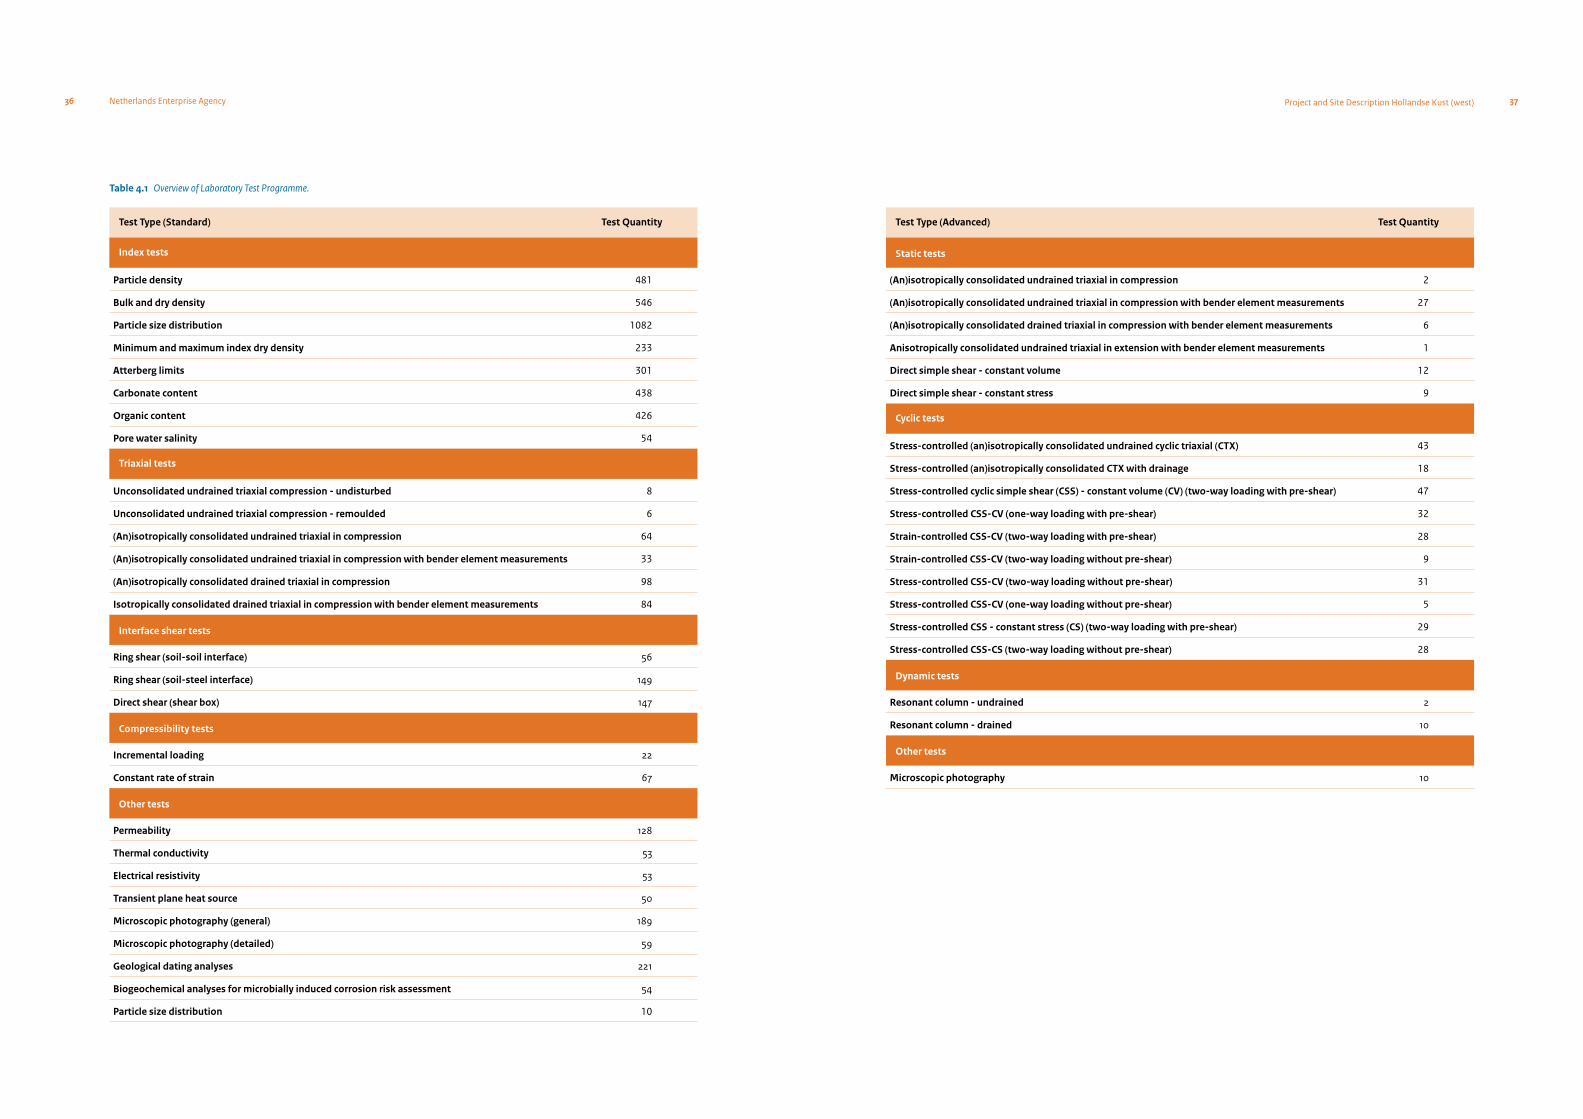
An overview of the laboratory test programme can be found in Table 4.1. Note that determinations of water content, unit weight, torvane, and pocket penetrometer tests are not presented in this table.
Netherlands Enterprise Agency36 Project and Site Description Hollandse Kust (west) 37
Test Type (Standard) Test Quantity
Index tests
Particle density 481
Bulk and dry density 546
Particle size distribution 1082
Minimum and maximum index dry density 233
Atterberg limits 301
Carbonate content 438
Organic content 426
Pore water salinity 54
Triaxial tests
Unconsolidated undrained triaxial compression - undisturbed 8
Unconsolidated undrained triaxial compression - remoulded 6
(An)isotropically consolidated undrained triaxial in compression 64
(An)isotropically consolidated undrained triaxial in compression with bender element measurements 33
(An)isotropically consolidated drained triaxial in compression 98
Isotropically consolidated drained triaxial in compression with bender element measurements 84
Interface shear tests
Ring shear (soil-soil interface) 56
Ring shear (soil-steel interface) 149
Direct shear (shear box) 147
Compressibility tests
Incremental loading 22
Constant rate of strain 67
Other tests
Permeability 128
Thermal conductivity 53
Electrical resistivity 53
Transient plane heat source 50
Microscopic photography (general) 189
Microscopic photography (detailed) 59
Geological dating analyses 221
Biogeochemical analyses for microbially induced corrosion risk assessment 54
Particle size distribution 10
Table 4.1 Overview of Laboratory Test Programme.
Test Type (Advanced) Test Quantity
Static tests
(An)isotropically consolidated undrained triaxial in compression 2
(An)isotropically consolidated undrained triaxial in compression with bender element measurements 27
(An)isotropically consolidated drained triaxial in compression with bender element measurements 6
Anisotropically consolidated undrained triaxial in extension with bender element measurements 1
Direct simple shear - constant volume 12
Direct simple shear - constant stress 9
Cyclic tests
Stress-controlled (an)isotropically consolidated undrained cyclic triaxial (CTX) 43
Stress-controlled (an)isotropically consolidated CTX with drainage 18
Stress-controlled cyclic simple shear (CSS) - constant volume (CV) (two-way loading with pre-shear) 47
Stress-controlled CSS-CV (one-way loading with pre-shear) 32
Strain-controlled CSS-CV (two-way loading with pre-shear) 28
Strain-controlled CSS-CV (two-way loading without pre-shear) 9
Stress-controlled CSS-CV (two-way loading without pre-shear) 31
Stress-controlled CSS-CV (one-way loading without pre-shear) 5
Stress-controlled CSS - constant stress (CS) (two-way loading with pre-shear) 29
Stress-controlled CSS-CS (two-way loading without pre-shear) 28
Dynamic tests
Resonant column - undrained 2
Resonant column - drained 10
Other tests
Microscopic photography 10

Netherlands Enterprise Agency38 Project and Site Description Hollandse Kust (west) 39
4.6.2 SupplierFugro was contracted to perform this Geotechnical site investigation. The site investigation was performed according to ISO 19901-8:2014. The investigation was conducted in two campaigns with geotechnical vessels, MV Despina and MV Normand Flower, between May 15, and September 17, 2019.This included the site investigation for the TenneT Beta substation.
For the TenneT Alpha substation a separate site investigation was performed from the geotechnical vessel Fugro Synergy between February 9 and 15, 2019.
A SEACALF® 20 tons MkIV Constant Drive System (CDS) with a coiled rod system was used for seafloor in situ testing. The unit was fitted with piezocone penetrometers, seismic cone penetrometers, and temperature cone penetrometers. The SEACALF® CDS provided a reliable, safe, and efficient test unit for high quality data acquisition. Sampling from seafloor was performed using a Fugro High Performance Corer (HPCTM) sampling device equipped with a 6.4 m core barrel and an inner PVC liner to contain the sample.
The geotechnical boreholes were performed using open-hole rotary drilling in combination with water and/or drill mud (Pure-Bore®) as drill fluids. Borehole drilling included the use of a seabed frame equipped with a SEACLAM system, for re-entry and for axial and lateral support of the drill string at seafloor. Downhole push sampling and in situ testing employed WIPSAMPLER® and WISON® downhole tools. Downhole cone penetration tests (CPTs) were performed using piezocone penetrometers.
Upon completion of downhole sampling and/or in situ testing and after reaching the required depth for borehole geophysical logging, the drill bit was pulled up to a minimum safe depth with respect to the risk of borehole collapse. This allowed open-hole acquisition of borehole geophysical data by lowering the downhole geophysical tools through the bit into the open-hole. At each location multiple runs were executed, employing a suite of wireline-operated Antares (Caliper, Natural- and Spectral Gamma Ray) and Geovista (P and S suspension logger) downhole geophysical tools.
4.6.3 ResultsResults of the Geotechnical site investigation are presented in the following reports:A geotechnical report containing interpreted CPT logs and results from seafloor in situ testing, including:• Interpretation of soil profile, strata descriptions, and
CPT-derived relative density and undrained shear strength;• Cone resistance (net/total), sleeve friction, pore pressure or
temperature, friction ratio and pore pressure ratio, where applicable;
• Results of seismic velocity tests, i.e. recorded seismic traces (X and Y channel), and derived shear wave velocity and low-strain shear modulus;
• Results of temperature equilibrium tests, i.e. temperature versus time;
• Results of pore pressure dissipation tests, i.e. cone resistance and pore pressure versus time.
A geotechnical report containing geotechnical logs and results from seafloor sampling and laboratory testing, including:• Interpretation of soil profile and strata descriptions based
on available data sources, including sample descriptions and laboratory tests;
• Selected results of laboratory tests.
A geotechnical report containing geotechnical logs and results from borehole sampling and in situ testing and standard laboratory testing, including:• Interpretation of soil profile, strata descriptions, and
CPT-derived relative density and undrained shear strength;• Where applicable, cone resistance (net/total), sleeve friction,
pore pressure, friction ratio and pore pressure ratio;• Results of borehole geophysical logging including (derived)
values for natural gamma radiation measurements, caliper logging, P- and S-wave velocities, and spectral gamma radiation measurements;
• Selected results of (biogeochemical) laboratory tests;• An overview of (remaining) sample material.
0 10 20 30 40 50
0
1
2
3
4
5
6
7
8
9
10
11
12
13
14
15
16
17
18
19
20
21
22
23
24
25
26
27
28
29
30
Dep
th B
elow
Sea
floor
[m]
qc [MPa]
.00 .25 .50 .75 1.00 1.25fs [MPa]
-.5 .0 .5 1.0Bq [-]
0 4 8Rf [%]
1 2 3 4Ic [-]
1 2 3 4
ISBT [-]
0 100 200 300 400 500 600su [kPa]
su [kPa]
0 25 50 75 100 125Dr [%]
0 25 50 75 100 125
Dr [%]GraphicLog 1
GraphicLog 2
sensitive, fine grained
organic soils - PEATS
CLAYS - clay to silty clay
silt mixtures - clayey SILT to silty CLAY
SAND mixtures - silty sand to sandy silt
SANDS - clean sand to silty sand
gravelly sand to sand
very stiff sand to clayey sand
very stiff, fine grained
> Ic plot su< Ic plot Dr
Date Of Testing : 25-May-2019 Water Depth [m] : 28.2 Coordinates [m] : E549649 N5835671
Notes: - Graphic Log 1: using Qtn and Fr / Graphic Log 2: using Qtn and Bq- Refer to Section Text for details
UN
IPLO
T 05
.36.
nl /
Seaf
loor
Geo
tech
nica
l Log
(Rob
erts
on).u
cf /
2019
-08-
01 1
6:12
:25
HHOOLLLLAANNDDSSEE KKUUSSTT ((WWEESSTT)) WWFFZZ -- DDUUTTCCHH SSEECCTTOORR,, NNOORRTTHH SSEEAA
Fugro Document No. P904711/01 (2) Plate A95Figure 4.12 Geotechnical log presenting interpretation of soil profile, strata descriptions, and derived parameters based on CPT data.

Netherlands Enterprise Agency40 Project and Site Description Hollandse Kust (west) 41
Notes:The above proportions refer to the plan area of each soil province with respect to the plan area of the site Soil Unit A can be locally absent, as seismic reflection data cannot detect a top layer thinner than about 0.3 m.* denotes distinguishing soil unit(s) for the particular soil province.() denotes partial presence of soil unit within soil province within the depth range of 0 m to 50 m BSF.
Soil
Province
Proportion of
HKWWFZ [%]
Soil Unit Primary Feature/ Comments
A B1 B2 C1 C2 D E F G
1 31.4 √ √ √* (√) Presence of Soil Unit F
2 18.5 √ (√) √* √ (√) Presence of Soil Unit E
3 9.2 √ √ √* √ √ Presence of Soil Unit C2
4 25.8 √ (√) √* (√) (√) √ (√) Presence of Soil Unit C1
5 7.1 √ √* √ (√) Presence of Soil Unit B2 with at least 7 m thickness
6 5.2 √ √* (√) (√) (√) √ (√) Presence of Soil Unit B1 (internal channels)
7 1.5 √ √* (√) √* (√) (√) √ √ Presence of Soil Units B1 (internal channels) and C1
8 1.3 √ (√) √ (√) (√) √* √ (√) Presence of Soil Unit D
A geological ground model report containing a geological ground model, including:• Geological setting, stratigraphy, lateral variability, cross
sections, depth to top of soil unit maps, and maps presen-ting contours and thickness of soil units;
• Geohazards and assessment of suitability of selected types of structures;
• Results of geological dating analyses.
The geotechnical ground model includes eight soil provinces for spatial zonation of the HKWWFZ. A soil province delineates a spatial zone within which geotechnical characteristics within a depth range of interest are similar. Development of a soil province is closely related to the presence of specific (sequence of) soil units within that zone. Consequently, selection of soil provinces was done based on the presence of one or more distinguishing soil unit(s) within each soil province and within the depth range of focus, i.e. a distinct soil unit likely to impact pile design.
The soil province boundaries were defined on the basis of spatial soil unit boundaries, i.e. considering lateral extent and vertical extent. The algorithms for soil province mapping (1) use the gridded spatial boundaries of the interpreted geo technical soil units (i.e. depth to base and thickness) and (2) combine the spatial boundaries for deriving the soil provinces.
The selected soil provinces include the following fundamental features:• Spatial zonation of the site allowing clustering of CPT profiles for efficient conceptual design of monopiles/jacket piles;• A primary depth range of interest (i.e. from seafloor to 20 m below seafloor), considered as critical for geotechnical
design of monopile and jacket pile foundations;• Presence of one or more distinguishing soil unit(s) within the above depth range of primary focus.
Deep dive 1 Soil Provinces.
Ó* *
Ó* *
Ó* *
P9-HORIZON
P9-A
P9-B
K
%6
%6
%6%6
%6
%6
%6
%6%6%6
%6%6
%6
%6%6%6
%6
%6
%6%6%6
%6
%6
%6%6%6
1
2
345
1
2
3 45
1 1-A
2
3 45
1
2
3 45
1
2
34
5
Vibrocore Array 02
Vibrocore Array 03
Vibrocore Array 01
Vibrocore Array 04
Vibrocore Array 05
Ó(³
Ó(³
TenneT HKWA
TenneT HKWB
(
(
(
(
(
(
(
(
(
((
(
(
(
(
(
(
(
(
(
(
(
(
(
(
(
(
(
((
(
(
(
((
(
(
(
((
(
(
(
(
((
((
((
((
((
(
(
(
(
(
(
(
(
(
((
(
(
(
(
(
(
(
(
(
(
(
(
(
((
((
(
HKW036
HKW037
HKW038
HKW039
HKW040
HKW041
HKW042
HKW043
HKW044
HKW045HKW046
HKW047HKW048
HKW049
HKW050
HKW051
HKW052
HKW053
HKW054
HKW055
HKW056
HKW057
HKW058
HKW059
HKW060
HKW061
HKW062
HKW063
HKW064
HKW065
HKW066
HKW067
HKW068
HKW069HKW070
HKW071
HKW072
HKW073
HKW074
HKW075HKW076
HKW077
HKW078
HKW079
HKW080
HKW081
HKW082HKW083
HKW084HKW085
HKW086 HKW087HKW088
HKW089HKW090
HKW091
HKW092
HKW093
HKW094
HKW095
HKW096
HKW097
HKW098
HKW099HKW100
HKW101
HKW102
HKW103
HKW104
HKW105
HKW106
HKW107
HKW108
HKW109
HKW110
HKW111
HKW112
HKW113
HKW114HKW115
HKW116HKW117
HKW118
3°50'0"E
3°47'30"E
3°45'0"E
3°42'30"E
3°40'0"E
3°37'30"E
3°35'0"E
52°40'0"N
52°38'0"N
52°36'0"N
52°34'0"N
ÐÐÐÐÐÐÐ
ÐÐÐÐÐÐÐ
ÐÐÐÐÐÐÐ
ÐÐÐÐÐÐÐ
5400
00
5420
00
5440
00
5460
00
5480
00
5500
00
5520
00
5540
00
5560
00
5580
00
5822000
5824000
5826000
5828000
5830000
5832000
5834000
5836000
Ò
Ò
Ò
Ò
Ò
Ò
Ò
Ò
Ò
Ò
Ò
Ò
Ò
Ò
Ò
Ò
Ò
Ò
Ò
Ò
Ò
Ò
Ò
Ò
Ò
Ò
Ò
Ò
Ò
Ò
Ò
Ò
Ò
Ò
Ò
Ò
Ò
Ò
Ò
Ò
Ò
Ò
Ò
Ò
Ò
Ò
Ò
Ò
Ò
Ò
Ò
Ò
Ò
Ò
Ò
Ò
Ò
Ò
Ò
Ò
Ò
Ò
Ò
Ò
Ò
Ò
Ò
Ò
Ò
Ò
Ò
Ò
Ò
Ò
Ò
Ò
Ò
Ò
Ò
Ò
GEODETIC PARAM ETERSGEODETIC DATUM
ELLIPSOIDSemi-M ajor AxisInverse Flattening
PROJECTIONCentral M eridian (CM )Latitude of OriginFalse EastingFalse N orthingScale Factor at CM
DATUM TRAN SFORM ATIONSource
VERTICAL DATUM
European Terrestrial Reference System 1989
GRS 19806,378,137.000 m298.257222101
ETRS 1989 / UTM Zone 31N (EPSG 25831)03°00'00'' E00°00'00'' N500,000 mE0 mN0.9996
ITRF2014 to ETRS89 for Epoch 2017.4959 dX=+0.05545 m dY=+0.05295 m dZ=-0.08834 mrX=-0.0023082 '' rY=-0.0139630 '' rZ=+0.0225688 '' Scale=+0.00294455 ppm
Lowest Astronomical Tide (LAT)
¹
2 of 2 C1-2
Fugro Document N o. Chart N o. Plate N o.
0 500 1000 1500 2000 2500250 metres
0 0.1 0.2 0.3 0.4 0.5 0.6 0.7 0.8 0.9 1 nautical mile
P904711/07 (1)
Scale 1 : 20,000 at original A0 page size
GEOTECHNICAL SITE INVESTIGATION
DUTCH SECTOR - NORTH SEA
HOLLANDSE KUST (WEST) WIND FARM ZONE
SOIL PROV IN CES
R VO
Fugro
SOUTH
N OTES1) Refer to Main Text for details.
BelgiumFrance
The Netherlands
U.K.
¹
jAdjacent keyplan
450000 600000 750000
5700
000
5850
000
6000
000
Ó* *
Ó* *
Ó* *
Ó* *
Ó* *
Ó* *
NORTH
SOUTH
The red border below indicates the extentof the presented chart ¹
540000 555000 570000
5820
000
5835
000
5850
000
LEGEN D
Prinses Beatrixlaan 2, 2595 AL Den Haag, The Netherlandswww.rvo.nl
Prismastraat 4, 2631 RT Nootdorp, The Netherlandswww.fugro.com
Structure 500 m exclusion zone
GEN ERAL
HKW - Designated Wind Farm Zone
Ð Geographical grid
Ò UTM grid
Hollandse Kust (west) Wind Farm Zone (HKW WFZ)
Chart extent indicator
StructureÓ* *
Buoyant waterway markingK
SOIL PROVIN CES
Soil Province 1
Soil Province 2
Soil Province 3
Soil Province 4
Soil Province 5
Soil Province 6
Soil Province 7
Soil Province 8
SOIL P ROV IN CES - N ORTHCha r t N o: 1 of 2
GEOTECHN ICAL LOCATION S
Geotechnical location cluster(
Cluster location - TennetT HKW Alpha PlatformÓ(³Cluster location - TennetT HKW Beta PlatformÓ(³
Array of vibrocore locations%6 %6%6
Figure 4.13 Soil provinces.

Netherlands Enterprise Agency42 Project and Site Description Hollandse Kust (west) 43
A geotechnical report containing results of the advanced laboratory testing programme, including:• Results of geotechnical index tests;• Results of microscopic description and photography;• Results of static triaxial tests and direct simple shear tests;• Results of cyclic triaxial tests and cyclic direct simple shear tests;• Results of resonant column tests;• Cyclic test results plotted in S-N graphs including (background)
degradation curves;• Cyclic test results plotted with Drammen Clay model contours
as background.
A report containing results of a geotechnical parameter study, including:• Geotechnical ground model focusing on monopile and
jacket pile foundations;• Determination of soil provinces (deep dive 1) and soil units
(deep dive 2);
• Characteristic values of geotechnical parameters at selected ‘design locations’ for use in selected calculation models and limit states;
• Derived values of geotechnical parameters per (geotechni-cal) soil unit and borehole location;
• Conclusions and recommendations, with focus on data gap analysis for geotechnical information for the detailed design phase;
• Results of a seismic hazard assessment;• Assessment of microbiologically influenced corrosion of
steel (mono)piles.
A geotechnical report containing the results of generation of synthetic CPTs along the seismic lines, based on the applica-tion of machine learning algorithms to the geophysical and geotechnical data (Figure 4.14).
Figure 4.14 Comparison of actual CPT measurements (black trace) with machine learning-derived synthetic CPTs (red trace) at multiple locations within HKWWFZ.
Soil Unit (Geotechnical)
General Description Unit (Geological)
Age – Formation
A Silica fine and medium SAND A Holocene – Southern Bight
B1 Silica to calcareous silica fine and medium SAND and (sandy) silica to calcareous silica SILT
B Holocene – Naaldwijk
B2 Silica to calcareous silica fine and medium SAND
C1 Calcareous silica fine and medium SAND and calcareous slightly sandy to sandy CLAY or SILT
C1 Late Pleistocene – Eem
C2 Silica fine to coarse SAND C2
D Interbedded silty silica to calcareous silica fine and medium SAND and sandy calcareous CLAY or sandy calcareous silica SILT
D Late Pleistocene – Eem
E Silica fine and medium SAND E Late Pleistocene – Eem / Egmont Ground
F Slightly silty to silty silica to calcareous fine and medium SAND, with laminae to thick beds of clay and silt and calcareous to non-calcareous SILT, with laminae of sand
F Early to Mid-Pleistocene – Yarmouth Roads
G Slightly silty to silty calcareous silica to silica fine and medium SAND, with laminae to thick beds of clay and silt and calcareous to non-calcareous CLAY or SILT, with laminae of sand
G Early to Mid-Pleistocene – Yarmouth Roads
The geotechnical ground model defines nine (geotechnical) soil units, which are identical to the geological units except for refinement of geological Unit B.
The soil units distinguish three soil types, i.e. sand, transitional soil, and clay. Each soil unit was geotechnically classified for the purpose of overall soil characterisation. Soil unit classification includes presentation of statistical results for various classification parameters.
Deep dive 2 Soil Units.
Figure 4.15 3D visualization image obtained using SubsurfaceViewer.
In addition to the reports, digital data files accompanying the various reports are also available. These data files comprise the following data types:• AGS 4.0: seafloor CPT data, downhole CPT data,
borehole data;• ASCII: seafloor CPT data, PPDT data, TET data;
synthetic CPT data;• LAS: borehole geophysical logging data;• Excel: shear wave velocity test data, list of remaining sample
material, overview of advanced laboratory test results and individual laboratory test results;
• Excel: LE, BE and HE derived values of geotechnical parameters;
• IHS Kingdom: geological ground model data files;• ArcGIS: geological ground model GIS data files;• SEG-Y: Synthetic CPT data;• SubsurfaceViewer: 3D visualisation of geological ground
model and selected geotechnical data (Figure 4.15).

Netherlands Enterprise Agency44 Project and Site Description Hollandse Kust (west) 45
4.6.4 Southwest corner assessment In February 2021, an additional cone penetration test (CPT) was conducted for HKW due to a recent change in the boundary in the southwest corner of Wind Farm Site VII (HKWWFS VII). The final report on the soil conditions for the small extension of this site is published in June 2021. The report describes the geological and geotechnical soil conditi-ons within this extension area, the site suitability, and the results of the additional CPT. No new soil provinces were identified in the extension area compared to the nes defined in the geotechnical parameters report of HKWWFZ.
The results consist of a report covering the extension area and digital data files. These data files comprise the following data types:• AGS 4.0: seafloor CPT data, downhole CPT data;• ASCII: seafloor CPT data;• ArcGIS: geological ground model GIS data files.
4.6.5 WebinarsThe results of the Geophysical and Geotechnical site investiga-tions performed at the HKWWFZ were presented and discussed in a webinar on November 5, 2020.
The geotechnical ground model, geotechnical parameter study, and synthetic CPTs were presented and discussed in a webinar on November 19, 2020.
Please refer to offshorewind.rvo.nl/soilw for details.
4.6.6 ConclusionSignificant effort was taken to maximise data quality and suitability of geotechnical data for the HKWWFZ. All disclosed reports are reviewed and/or certified by DNV. The geotechnical data was used to ground-truth the geological ground model resulting from the Geophysical campaign and to laterally correlate soil layers and geological features. The unit bounda-ries derived from geophysical data interpretation generally correlate with those identified in the geotechnical data.
The data further enhance and refine the understanding of the identified units and their spatial variability. Interpretation of geological features was based on seismic reflection data and geotechnical data. The results are anticipated to form a solid basis for geotechnical designs at the HKWWFZ.
It is further anticipated that additional sampling boreholes may not be needed in further stages of the development, if a reliable correlation between CPT data and laboratory test data can be made. However, this remains the final responsibility of developers. The samples remaining after the laboratory testing phase will be available to the winning developers, e.g. to perform additional testing.

Netherlands Enterprise Agency46 Project and Site Description Hollandse Kust (west) 47
4.7 Archaeological assessment of paleo-landscapes
4.7.1 Overview - aims, objectives, and approachFollowing on from its initial work on the Archaeological desk study (section 4.1), and the Archaeological assessment of Geophysical data (section 4.5), Periplus Archeomare conduc-ted geo-archaeological research on paleo-landscapes in the HKWWFZ.
The goals set for this research were:1. To assess the geogenesis, occurrence, integrity, and
preservation of prehistoric landscapes; and2. To ‘dress’ these landscapes, picturing the aquatic and
terrestrial paleo-environments, through the analysis of microfossils, mollusks, pollen, diatoms, and palynomorphs stored in the sediments.
4.7.2 SupplierPeriplus Archeomare was contracted by RVO to conduct geo-archaeological research on paleo-landscapes through the study of research reports of borehole sample analysis (Fugro) and biostratigraphic research of designated sample intervals within the borehole samples (BioChron).
4.7.3 ResultsThe borehole locations and the geo-archaeological context are shown in Figure 4.16.
4.7.4 The evolution of prehistoric landscapesDuring the Waardenburg and Westerhoven interglacials, at the onset of the Cromerian (basal Middle Pleistocene), the HKWWFZ was part of a low land area with terrestrial/fresh water tidal environments (Unit F; Yarmouth Roads Formation). This land scape potentially offered opportunities for habitation by early hominins.
A long period of non-sedimentation followed, lasting throughout the late Cromerian, Elsterian, Holsteinian and Saalian. During the Saalian, an advancing ice-sheet shaped a glacial valley along the eastern border of the HKWWFZ. The coarse sands of Unit F were glacially deformed.
Rapid sea level rise resulted in a marine ingression at the onset of the Eemian. The glacial valley was filled with homogeneous coarse sands (Unit E; Eem Formation). A periodically high energy, nearshore, marine environment developed along the valley edge in the eastern part of the area.
West of the beachshore area, a forested landscape developed. Meanwhile a crescent shaped estuary formed along the southern edge of the area. The estuary was filled with layered
silty clays. The Rhine/Meuse River transported reworked palynomorphs to the area which, along with typical Eem pollen assemblages, are found in Unit D (Eem Formation).
The area fully drowned during the Eemian. Throughout the area, layers of silty sand and silty clay with mollusks and wood fragments were deposited (Unit C; Brown Bank Member).
At the onset to the Early Weichselian, the transgressing sea left the Brown Bank Member exposed at the ground surface. During the Weichselian, which lasted some 100 k years, little sedimentation took place. In this period, Neanderthals could have hunted the large mammals which lived in the area. At the end of the Weichselian, some aeolian and fluvial fine sands were deposited. These terrestrial deposits are part of Unit B (Boxtel Formation).
At the onset of the Early Holocene, a fresh-water/terrestrial environment developed. In most places this environment comprised wetlands. Locally, peat was deposited. The area could have offered favorable circumstances for habitation, such as the availability of fresh water, edible plants (such as the found water lilies), shell fish, and fish. Ongoing sea level rise resulted in the development of subtidal/marine and intertidal/marginal marine environments. The sands deposited are also part of Unit B (Naaldwijk Formation).
Ongoing sea level rise finally resulted in the open marine conditions in which the mobile sands of Unit A are deposited to date (Bligh Bank Member).
The geo-archaeological analysis of borehole samples has provided us with new and complementary information on the development of both terrestrial and aquatic landscapes in the HKWWFZ.
Future seabed disturbing activities, like the installation of monopiles and interconnecting cables, are not affected by the outcome of this study and can continue as planned. However, if additional geophysical or geotechnical surveys are carried out, the resulting data is requested to be delivered to the competent authorities. These data include newly collected seismic data, borehole and vibrocore samples and will then be used for additional geo-archaeological research.
Finally, in accordance with the Heritage Act (Erfgoedwet), the developer is obliged to report archaeological finds which come to light during the development of the Wind Farm Zone to the competent authorities.
4.7.5 WebinarThe results of the geo-archaeological research on paleo-land-scapes were not presented in a webinar.
Figure 4.16 Borehole locations selected for geo-archaeological research.

Netherlands Enterprise Agency48 Project and Site Description Hollandse Kust (west) 49
4.8 Morphodynamics and Scour Mitigation desk study
4.8.1 Overview - aims, objectives, and approachThis desk study comprises two main elements. The first part addresses the (autonomous) seabed dynamics in the Hollandse Kust (west) Wind Farm Zone (HKWWFZ). The second part on scour and scour mitigation provides general considerations on how to deal with scour develop-ment and scour mitigation in the HKWWFZ, taking into account the morphodynamics of the area and a range of potential types of foundations. General considerations for cable routing in a morphodynamic environment are also provided. The analysis is based on existing historical data and the survey results obtained in the Geophysical campaign.
The aim of this combined study is to:1. Assess the morphodynamics and characterise the seabed in
the HKWWFZ;2. Characterise the shallow geological and sedimentological
site conditions to a depth of 20 m below the measured seabed level as well as the seabed features in the HKWWFZ;
3. Predict the change in seabed levels in the HKWWFZ over the lifetime of a wind farm (considered period: 2019-2059) to support the design, installation, and maintenance of wind turbines, inter array cables, platforms, and their support structures;
4. Provide guidance on the depths at which Unexploded Ordnances (UXOs) can be encountered based on a hindcast of historic seabed levels (1945-2019);
5. Describe scour conditions to be expected in the HKWWFZ for typical wind farm-related structures;
6. Provide a state-of-the-art overview of scour mitigation measures and their applicability in the HKWWFZ at these structures;
7. Provide guidance on how the morphodynamics should be taken into account for the selection of locations for the structures and cables and for the scour mitigation strategy.
Overall, the information gathered in this desk study should provide detailed information to help developers with the design, installation, and maintenance of wind turbines, inter-array cables, substations, and their support structures, e.g. by choosing smart locations for the wind farm infrastructure.
Compared to Borssele, the Morphodynamic study for the HKWWFZ was extended with a geological analysis of the top layers, hydrodynamic modelling to assess and validate the migration directions of the bed features, and best-estimate seabed levels for five-year periods. Compared to Hollandse Kust (zuid), the most probable depths at which UXOs may be encountered were also computed and maps of expected scour
depths, rock gradings, and scour protection volumes for various monopile diameters added. Compared to Hollandse Kust (noord), new methods for determining seabed dynamics, an improved numerical model using a flexible mesh, and maximum seabed slopes were introduced.
4.8.2 SupplierResearch institute Deltares was awarded the contract to conduct this desk study for the HKWWFZ. Deltares previously conducted morphodynamic studies for other offshore wind farms, including Hollandse Kust (noord), Hollandse Kust (zuid), Borssele. In addition, Deltares has performed scour assessments, developed scour mitigation strategies, and conducted physical model testing for several offshore wind farms.
4.8.3 Results - morphodynamicsThe bathymetry in the HKWWFZ has a non-uniform morpho-logy. This includes a number of prominent sand banks influencing sand wave dynamics and a full coverage of sand waves, which have a pronounced asymmetry towards the north-northeast, indicating migration in that direction (Figure 4.17). The top sediment layer is mobile and covered with sand waves migrating towards the north-northeast with megaripples on top. Considering the entire HKWWFZ, the sand waves have wavelengths in the range of 160 to 540 m, heights of 1.4 to 4.8 m, and migration speeds up to 3.9 m/year with a median speed of 2.3 m/year (Figure 4.18). An analysis of the large-scale seabed variations shows the underlying seabed may be considered static over the lifetime of the wind farm.
A review of available geological and geophysical data indicates that non-erodible layers exist, but they are located too deep to influence the sand wave migration. A numerical analysis of the hydrodynamics and sediment transport in the area indicates the net sediment transport is aligned with the residual tidal flow and towards the north-northeast.
Based on the Best Estimate Bathymetries (BEB) morphodyna-mic analysis, a lowest seabed level (LSBL) and a highest seabed level (HSBL) were determined indicating the seabed levels expected during the lifetime of the wind farm (2019-2059), including uncertainty bands (Figure 4.19). The Best Estimate Bathymetry for a certain year within this period is expected to have the smallest area-averaged total difference with the actual bathymetry measured in that year.
Comparison of the LSBL with the most recent measured bathymetry from 2018-2019 shows a predicted maximum local seabed level lowering of approximately 6.7 m (with -3.2 m as the 99% non-exceedance value). As expected, the largest lowering is found at the location of the existing sand wave crests, while minimal lowering is found at the location of the sand wave troughs.
Figure 4.17 Bathymetry as measured in 2019.
Figure 4.18 Sand wave migration rate.

Netherlands Enterprise Agency50 Project and Site Description Hollandse Kust (west) 51
Comparison of the HSBL with the most recent measured bathymetry from 2018-2019 shows a bathymetric shape similar to the existing static part of the bathymetry, but typically several metres higher and locally as much as 8.6 m (with +5.3 m as the 99% non-exceedance value). Opposite to the seabed lowering, the largest potential rise of the seabed level is found at the current locations of the troughs, just in front of the steep sand wave lee sides, with minimal rising at locations of the present sand wave crests.
Furthermore, a hindcast of seabed levels has been made to assess the possible levels at which UXOs are located. An important assumption in this method is that a UXO will never travel upwards and a typical UXO will self-bury to about half its height. To take into account the full range of possible object levels, the Lowest Object Level (LOL), the Highest Object Level (HOL), and the Best-Estimate Object Level (BEOL) over the period 1945-2021 are calculated.
Figure 4.19 Classification of seabed changes to be expected.
The predicted seabed level changes presented in this study follow from the applied morphological analysis techniques, describing the physics and the natural variability of the analysed morphological system. No additional safety margins for design purposes have been applied. Finally, classification zones were provided to assist developers in determining the locations of their cables and foundations (see Figure 4.19).
4.8.4 Results - scour and scour mitigationIn most situations, offshore structures can either be protected against scour or be designed such that scour development can be allowed. To decide which strategy can best be adopted for a certain foundation type and specific location, information was presented on how to predict the scour depth (when not protected) and how to protect against scour, both taking into account the morphodynamic scenarios of stable, lowering, and rising seabeds (see Figure 4.19).
It can be concluded that, for monopiles, an easily-applicable, well-proven solution is to place the monopiles in: 1. Areas with limited seabed dynamics;2. Just north-east of the sand wave crests;3. Even on top of the sand wave crests and to apply a scour
protection to maintain a more or less fixed seabed level around the foundation.
In the second case, a slightly longer pile is needed, while a longer or thicker scour protection is recommended in the third case to cater for the lowering seabed. Other solutions are also possible, such as leaving out scour protection completely at locations with a rising seabed, when scour protection costs outweigh the costs for additional steel consumption. Gravity-Based-Structures (GBS) will typically need a scour protection due to too severe scour development in the mobile seabeds of the HKWWFZ and the low tolerance for scour due to undermining risks. Locations with a significantly lowering seabed are best to be avoided for GBS. Jacket structures are expected to experience significant scour development as well, but as long as they are not located in areas with lowering seabeds and cable-free spanning risks are mitigated by proper cable protection measures, they can be designed for free scour development. This does not hold for Suction Bucket Jackets: due to the limited penetration depth of the suction cans, scour protection is, in most cases, recommended in the HKWWFZ. Self-installable systems look promising here.
To illustrate the choice for a proper scour mitigation strategy, for monopiles, dynamic equilibrium scour depths (Figure 4.20), stable rock gradings (Figure 4.21), and required scour protection volumes were computed for the entire HKWWFZ. With the provided maps for water depth, maximum seabed lowering, predicted scour depth, stable rock gradings, and required scour protection volumes for each location, it can be computed which
pile length is required, both for when the pile is protected and for when it is left unprotected. In the case of protection, the map plots provide an indication which scour protection is required. With the information provided, the wind farm designer can determine the optimum locations for wind turbine foundations and select a cost-efficient and safe scour mitigation strategy for each foundation.
Next to foundations, this report also discusses general considerations for cable routing in a morphodynamic area such as the HKWWFZ. When smart cable routing techniques are adopted, which avoid the areas with largest morphodyna-mic seabed lowering or other “expensive” areas with higher risks, it is expected that cables can be buried sufficiently deep to avoid cable exposure.
Further optimisation for scour predictions and/or scour protection designs can be achieved by means of physical model testing. Improvement of cable routing can be achieved by smart cable routing with actual foundation locations and additional constraints added to the routing approach. In a morphodynamic area such as the HKWWFZ, it is strongly recommended to always take predicted seabed changes into account right from the beginning.
4.8.5 DeliverablesThe results of the Morphodynamics and Scour Mitigation study are summarised in a desk study report, a GIS archive, and xyz data. The deliverables include:• General background information regarding morphodyna-
mic seabed features, of which sand waves are the most prominent in the HKWWFZ;
• Geological and geophysical characterisation of the site to a depth of 20 m below the measured seabed level;
• Analysis regarding bed form migration speed and direction, including storm effects;
• Summary of performed numerical modelling for tides and sediment transport;
• Predicted future seabed levels (LSBL, HSBL, BEB);• Predicted levels where UXOs can be expected (LOL, HOL, BEOL);• Predicted maximum seabed slopes;• Classification zones and considerations for cables and
foundations;• Recommendations regarding possible scour mitigation
strategies for the HKWWFZ;• Scour predictions for selected foundations, e.g. monopiles,
jacket structures, and Gravity Based Structures;• Map-based estimates for scour depths around monopiles,
taking into account spatially varying hydrodynamics and water depth;
• Scour predictions for selected jack-up platforms (for installation purposes);
• Implications of edge scour around scour protections;• Design requirements for a scour protection;

52 Netherlands Enterprise Agency
Figure 4.20 Estimated scour depth S10 in case monopiles are used as foundation concept.
Figure 4.21 Indicative rock gradings in case of using scour protection consisting of rock.
53Project and Site Description Hollandse Kust (west)
• Description of scour protection methods, e.g. rocks, mattresses, gabions, artificial vegetation, filter units, etc.;
• Map-based estimates for required rock gradings and rock volumes, taking into account spatially varying hydrodyna-mic design conditions, water depth, and seabed variations;
• Recommendations for eco-friendly scour protection designs;• Description of how to deal with cable routing in morphody-
namic environments.
4.8.6 WebinarThe results of the Morphological desk study performed at the HKWWFZ were presented and discussed at a webinar on November 6, 2020.Please refer to offshorewind.rvo.nl/soilw for details.

Netherlands Enterprise Agency54 Project and Site Description Hollandse Kust (west) 55
4.9 Metocean desk study
4.9.1 Overview - aims, objectives, and approach The Metocean desk study provides information on the meteorological and oceanographic (metocean) conditions in the HKWWFZ. It serves as input for the design, installation, and maintenance of wind turbines, inter array cables, substations, and their support structures for companies submitting bids to develop projects at Hollandse Kust (west). In 2019, feasibility level data and a report for the HKWWFZ (and IJmuiden Ver and Ten noorden van de Waddeneilanden) was provided. This study (2020) replaces that previous work and should be used for Hollandse Kust (west) related design, operation, and maintenance.
The Metocean desk study includes the following:1. A general characterisation of the metocean climate at the
sites (e.g. operational conditions, dominant tides, storm severity, spatial uniformity of conditions);
2. Analysis of normal and extreme metocean conditions for winds, waves, currents, water levels, and their joint probability;
3. A comprehensive report for Hollandse Kust (west);4. An online digital metocean database that enables users
(e.g. project developers) to obtain output (time series, tables, and graphs for both normal and extreme conditions) at any requested location within the site boundaries of the
HKWWFZ. The metocean conditions vary across the zone, mainly due to variations of the local bathymetry and tide. With the metocean database, developers will be able to optimise their designs - i.e. for wind turbines, inter array cables, substations, and support structures - based on the conditions at actual locations, rather than using a single conservatively chosen reference point in each zone. The database is available through https://www.metocean-on-demand.com/
It should be noted that the 2019 data published on the metocean portal covered several Dutch offshore Wind Farm Zones, including Hollandse Kust (noord), Hollandse Kust (west), IJmuiden Ver, and Ten noorden van de Wadden-eilanden. That data is available under “Dutch Offshore Wind Farm” dataset. For Hollandse Kust (west), a new dataset (containing the updated data and analyses) has been created. Users should therefore use the new “Hollandse Kust (west)” dataset on the portal.
The development of the online metocean database is one of the main improvements since the Metocean desk study performed for Hollandse Kust (zuid) Wind Farm Zone. This online service will allow developers to access all the metocean information through a user-friendly and easily accessible platform and optimise their preliminary design when preparing a tender bid. The data can also be used for detailed design of the offshore wind farms. In addition, this study uses
Figure 4.22 Time series and scatter comparison of modelled (SWDWF2020) significant wave height against the measurements at HKWB for the period 2019-02-10 to 2019-09-19.
Figure 4.23 Time series and scatter comparison of modelled (SWDWF2020) significant wave height against the measurements at Europlatform for the period 1984-04-01 to 2019-12-31.
DHI’s most advanced statistical analysis tools (based on new advances in non-stationary extreme value statistics) which has resulted in greater uncertainty in the extreme values, enabling better optimised design. The Metocean desk study is superior to previous methods used, especially in the Dutch North Sea, where there are large variations in available fetch and storm systems.
4.9.2 SupplierRVO assigned DHI A/S (DHI) to perform the Metocean desk study. DHI is a renowned hydraulic institute with significant experience in the provision of information on metocean conditions and databases all around the world. DHI has contributed work for most of the existing offshore wind farms in Europe.
4.9.3 ResultsWork started on the Metocean desk study in February 2020. The metocean conditions were established using a dedicated high-resolution model covering the period from 1979 to 2020 (41 years). The modelling procedure comprised a wave model to simulate wave generation and propagation and a hydrody-namic model to simulate currents and water levels.
Both featured an unstructured grid with respective grid resolutions of 300 - 400 m (for wave model) and 200 m (for hydrodynamic model) at the HKWWFZ. The atmospheric forcing for both the wave and hydrodynamic model was taken
from the wind and pressure field data from the Climate Forecast System Reanalysis (CFSR) dataset provided by the National Centres for Environmental Prediction (NCEP). DHI carried out an extensive analysis on the CFSR wind data and performed bias corrections, leading to more accurate wind and wave results. The local hydrodynamic model was forced by a regional DHI model covering the North-Atlantic and optimised with data assimilation techniques up to the start of 2019. The local wave model was forced by DHI’s regional North Sea wave model. An extensive validation of the modelling results was conducted using available local measurements.
The local measurements included wind data from met masts (provided by KNMI) at Europlatform, LEG, F16, F3, J6, K13a, K14, L9, P11, Rijkswaterstaat wave measurements at the platforms Europlatform, F16, F3, J6, K13a, K14, L9, LEG and Q1, in addition to measurements performed by RVO at HKWWFZ and HKNWFZ.
The resulting validation showed very good model perfor-mance and demonstrated accurate and high-quality met-ocean conditions at the Wind Farm Sites (see Figure 4.22 and Figure 4.23).
The metocean analysis covered winds, waves, currents, and water levels, both under normal (ambient) conditions and

Netherlands Enterprise Agency56 Project and Site Description Hollandse Kust (west) 57
extreme storm conditions. The analysis included persistence tables, scatter tables, rose plots, spatial variations, spectral analyses, joint occurrence tables, occurrence of individual wave heights and periods, and misalignment of wind and waves.
Particular attention was paid to the extreme value analyses, since the resulting values are critical for design. Extreme conditions were established based on DHI’s J-EVA tool for winds, currents, and water levels for return periods up to 1000 years and for waves (significant wave height, maximum individual wave height, and maximum crest heights) for return periods up to 10,000 years. Extreme conditions were provided on a directional and monthly basis. In addition, the joint probability of various parameters and the likelihood of breaking waves were assessed.
The report includes results of metocean analysis at five output locations for Hollandse Kust (west). The output locations were selected at similar locations used in the feasibility level report published in 2019, herein called HKW2019, and at the corner points within the HKWWFZ to show spatial variations of the metocean conditions (see Figure 4.24).
Typical design values with a 50-year return period at the output location of HKW2019 include 10-minute wind speed (at 100 m elevation relative to MSL) of 41.4 m/s, a significant wave height of 7.5 m, an associated peak wave period of 12.2 s (to the 50-year significant wave height), and a depth-averaged total current velocity of 1.1 m/s at a water depth of
about 26.5 m MSL (25.6 m LAT). The extreme sea states show spatial variability of around 0.5 m (for 50-year return period significant wave height) across the HKWWFZ.
Extreme values at other locations can be accessed through the metocean database, which enables users to access the modelling data and the analysis results through a user-friendly online interface.
4.9.4 DeliverablesThe results of the Metocean desk study are summarised in a desk study report. The report includes the results for the following:
1. Wind: wind velocity roses, joint occurrence tables, Weibull parameters, persistence of wind speed, extreme wind speeds, wind profiles, wind energy spectra, wind turbulence intensity, and spatial variations;
2. Wave: roses of significant wave height and peak wave period, joint occurrence tables, persistence of wave height, extreme wave conditions, partitioning wind sea and swell, mean storm durations, spatial variations, breaking wave effects, and normal sea states, according to DNV-GL-0437;
3. Currents: current roses, velocity profiles, occurrence tables of current velocity and direction, extreme currents, separation tides, residual currents, and spatial variations;
4. Water levels: astronomical tide levels, extreme water levels, assessment of sea level rise, and spatial variations of water levels;
Figure 4.24 Significant wave height with a 50-year return period at the HKWWFZ, including the output locations.
5. Joint probabilities: joint occurrence tables of wind and waves, current and waves, water levels, and currents;
6. Other metocean parameters: snow and ice accretion, salinity, air and sea temperature, atmospheric and seawater density, marine growth, lightening, and visibility.
The state-of-the-art metocean database is an online digital application that can be accessed via https://www.metocean-on-demand.com. The user-friendly database provides users with different ways to view and access the data. A summary is given below:
1. A graphical user interface with the capability to contain user-defined shapefiles and coordinates with the option to convert UTM coordinates to Long/Lat (see Figure 4.25);
2. Access to modelling results (winds, waves, currents, water levels, and other meteorological parameters) at around 7700 grid points within the HKWWFZ for the period 1979 to 2020 (41 years) at high resolution;
3. Ability to perform analyses: plot time series, rose plots, scatter diagrams, persistence tables, distribution tables, extreme conditions, NSS tables, and surface maps, all with user-defined settings;
4. Ability to export time series data and plots at selected location(s); Outputs can be provided in ASCII, NetCDF, Mat, and DFS format;
5. Ability to download full directional-frequency spectrum on a 1 km grid within the HKWWFZ;
6. Option to validate offshore wave results to altimeter data;7. A tutorial video;8. Ability to make cross scatter tables/plots between two
datasets (for example waves against currents);9. Manual on how to use the database.
4.9.5 WebinarThe results of the Metocean desk study performed at the HKWWFZ were presented and discussed at a webinar on October 15, 2020. Please check offshorewind.rvo.nl/windwaterw for details.
Figures1. Figure 4.22: Time series and scatter comparison of
modelled (SWDWF2020) significant wave height against the measurements at HKWB for the period 2019-02-10 to 2019-09-19.
2. Figure 4.23: Time series and scatter comparison of modelled (SWDWF2020) significant wave height against the measurements at Europlatform for the period 1984-04-01 to 2019-12-31.
3. Figure 4.24: Significant wave height with a 50-year return period at the HKWWFZ, including the output locations.
4. Figure 4.25: Example of graphical user interface of metocean database for the HKWWFZ.
Figure 4.25 Example of graphical user interface of metocean database for the HKWWFZ.

Netherlands Enterprise Agency58 Project and Site Description Hollandse Kust (west) 59
4.10 Metocean measurement campaign
4.10.1 Overview - aims, objectives, and approachThe Metocean measurement campaign at the HKWWFZ aims to provide two sets of continuous meteorological and oceanographic (metocean) data, including wind profiles with excellent quality and high availability.
It is expected the data will allow stakeholders to carry out more accurate calculations of the annual energy yield and improve/validate metocean models that have been made as input for the overall wind farm design. Furthermore, the resulting accurate metocean data will lead to lower uncer-tainty and, therefore, lower cost of capital in the business case for an offshore wind farm.
Two measurement stations (and alternates) in 23 m and 31 m water depth were established at the HKWWFZ site (Table 4.2) and Fugro Seawatch Wind LiDAR Buoys (SWLB) were deployed in February 2019.
The SWLB is a compact multiparameter platform to measure wind profile (speed and direction) from 4 m to a maximum of 250 m height, air pressure, air temperature and humidity, waves, current velocities profile, and sea surface temperature simultaneously on a single point oceanographic mooring system. The LiDAR wind measurement system is an OWA Carbon Trust stage 2 pre-commercial floating LiDAR system validated by DNV.
The buoys are independent of each other but located close to each other to create a redundant system for wind and atmospheric data. They are at different water depths to achieve a full representative overview over the currents and waves in the whole HKWWFZ.
For this campaign, the measurement suite includes: • Wind speed and direction, including turbulence intensity,
inflow angles, and wind shear and veer at 11 heights in the range of 30 – 250 m above MSL with ZephIR ZX300 LiDARs;
• Air temperature, pressure, and humidity at LiDAR level;• Significant wave height, mean and peak wave periods, wave
direction, and wave spectra;
• Current speed and direction at evenly spread depths over the water depth;
• Sea surface temperature;• Water level.
Data measured at each buoy is packed into a digital package that is simultaneously stored on the buoy and transmitted via satellite in near real-time. The latter allows for near real-time operations checks, maintenance scheduling, quality control, and reporting. Offshore operations are performed to service the buoys and instruments at regular intervals. Raw wind, wave, and current data are then recovered.
4.10.2 SupplierThe Metocean measurement campaign is being conducted by the SEAWATCH Centre of Excellence of Fugro Norway. With more than 30 years’ experience, Fugro is a global leader in design, manufacturing, installation, and support services for environmental monitoring, metocean observation, and forecasting systems.
4.10.3 ResultsThe SWLBs are robust and have carried out excellent measurements under harsh environmental conditions, including strong winds, high waves, and strong currents. Throughout the campaign, the systems have performed well and delivered high data availability for all parameters.
Precise measurements record events like storms both above and below the sea surface. Figures 4.26, 4.27, and 4.28 show an example of a high wind period with corresponding wave and current measurements. Changes in wind speed and direction correspond well between the buoys at all heights. Wind sea wave height and wave direction match well between the buoys and can be seen to trail the changes in wind direction, as expected. The current velocity data show a consistent semi-diurnal tidal current pattern.
The measurements are validated on an ongoing basis by Deltares against several surrounding measurement stations in the North Sea and numerical models. The validation confirms the high quality of the collected data.
Station Longitude (E ETRS89)
Latitude (N ETRS89)
Easting (m UTM zone 31N)
Northing(m UTM zone 31N)
Water depth(m MSL)
HKWA 3° 42.937’ 52° 34.211’ 548500 5824700 23
HKWA-2 3° 42.812’ 52° 34.156’ 548360 5824595 23
HKWB 3° 44.264’ 52° 34.203’ 550000 5824700 31
HKWC 3° 44.083’ 52° 33.935’ 549800 5824200 31
Table 4.2 Positions (ETRS89/UTM zone 31N) of the LiDAR buoys at Hollandse Kust (west).

Netherlands Enterprise Agency60 Project and Site Description Hollandse Kust (west) 61
4.10.4 DeliverablesThe results of the Metocean campaign have been published on offshorewind.rvo.nl/windwaterw. The data package includes data, a data report, a data validation report. This strict quality assurance procedure assures the results serve as a high quality reference for wind climate and metocean studies.
For the first year of the campaign (Feb 2019 – Feb 2020), the data is summarised in a 12-month comprehensive dataset with accompanying report. For the second year, monthly data packages have been released approximately two months after completion of a month of measurements. In addition, raw wind, wave, and current data is provided after each service of the SWLB. A final report over 24 months of data (Feb 2019 – Jan 2021), including all processed and raw wind, wave, and current data, will also be made available on offshorewind.rvo.nl/windwaterw in 2021.
Figure 4.26 Wind speed and direction measured by the SWLB LiDAR at the highest and lowest heights from stations HKWA and HKWB during March 2019. Figure 4.27 Wave height and direction from stations HKWA and HKWB during March 2019.
4.10.5 WebinarThe results of the Metocean measuring campaign performed at the HKWWFZ were presented and discussed at a webinar on October 15, 2020. Please refer to offshorewind.rvo.nl/windwaterw for details.
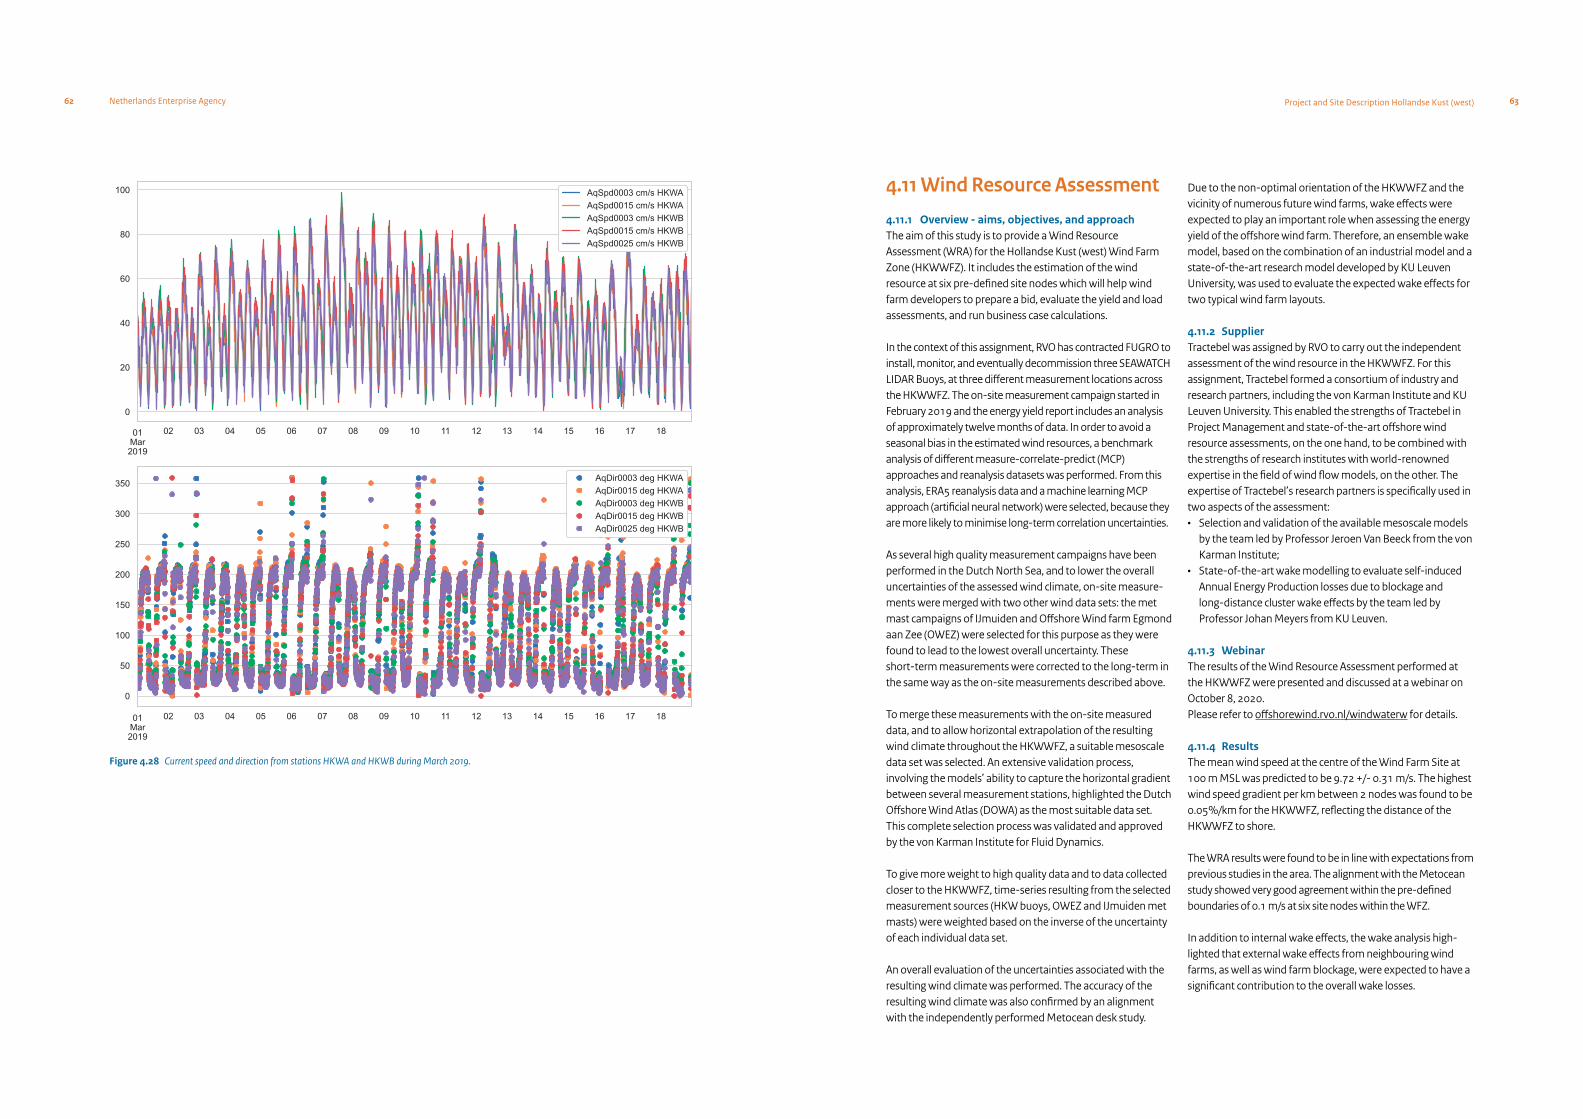
Netherlands Enterprise Agency62 Project and Site Description Hollandse Kust (west) 63
Figure 4.28 Current speed and direction from stations HKWA and HKWB during March 2019.
4.11 Wind Resource Assessment
4.11.1 Overview - aims, objectives, and approachThe aim of this study is to provide a Wind Resource Assessment (WRA) for the Hollandse Kust (west) Wind Farm Zone (HKWWFZ). It includes the estimation of the wind resource at six pre-defined site nodes which will help wind farm developers to prepare a bid, evaluate the yield and load assessments, and run business case calculations.
In the context of this assignment, RVO has contracted FUGRO to install, monitor, and eventually decommission three SEAWATCH LIDAR Buoys, at three different measurement locations across the HKWWFZ. The on-site measurement campaign started in February 2019 and the energy yield report includes an analysis of approximately twelve months of data. In order to avoid a seasonal bias in the estimated wind resources, a benchmark analysis of different measure-correlate-predict (MCP) approaches and reanalysis datasets was performed. From this analysis, ERA5 reanalysis data and a machine learning MCP approach (artificial neural network) were selected, because they are more likely to minimise long-term correlation uncertainties.
As several high quality measurement campaigns have been performed in the Dutch North Sea, and to lower the overall uncertainties of the assessed wind climate, on-site measure-ments were merged with two other wind data sets: the met mast campaigns of IJmuiden and Offshore Wind farm Egmond aan Zee (OWEZ) were selected for this purpose as they were found to lead to the lowest overall uncertainty. These short-term measurements were corrected to the long-term in the same way as the on-site measurements described above.
To merge these measurements with the on-site measured data, and to allow horizontal extrapolation of the resulting wind climate throughout the HKWWFZ, a suitable mesoscale data set was selected. An extensive validation process, involving the models’ ability to capture the horizontal gradient between several measurement stations, highlighted the Dutch Offshore Wind Atlas (DOWA) as the most suitable data set. This complete selection process was validated and approved by the von Karman Institute for Fluid Dynamics.
To give more weight to high quality data and to data collected closer to the HKWWFZ, time-series resulting from the selected measurement sources (HKW buoys, OWEZ and IJmuiden met masts) were weighted based on the inverse of the uncertainty of each individual data set.
An overall evaluation of the uncertainties associated with the resulting wind climate was performed. The accuracy of the resulting wind climate was also confirmed by an alignment with the independently performed Metocean desk study.
Due to the non-optimal orientation of the HKWWFZ and the vicinity of numerous future wind farms, wake effects were expected to play an important role when assessing the energy yield of the offshore wind farm. Therefore, an ensemble wake model, based on the combination of an industrial model and a state-of-the-art research model developed by KU Leuven University, was used to evaluate the expected wake effects for two typical wind farm layouts.
4.11.2 SupplierTractebel was assigned by RVO to carry out the independent assessment of the wind resource in the HKWWFZ. For this assignment, Tractebel formed a consortium of industry and research partners, including the von Karman Institute and KU Leuven University. This enabled the strengths of Tractebel in Project Management and state-of-the-art offshore wind resource assessments, on the one hand, to be combined with the strengths of research institutes with world-renowned expertise in the field of wind flow models, on the other. The expertise of Tractebel’s research partners is specifically used in two aspects of the assessment:• Selection and validation of the available mesoscale models
by the team led by Professor Jeroen Van Beeck from the von Karman Institute;
• State-of-the-art wake modelling to evaluate self-induced Annual Energy Production losses due to blockage and long-distance cluster wake effects by the team led by Professor Johan Meyers from KU Leuven.
4.11.3 WebinarThe results of the Wind Resource Assessment performed at the HKWWFZ were presented and discussed at a webinar on October 8, 2020. Please refer to offshorewind.rvo.nl/windwaterw for details.
4.11.4 ResultsThe mean wind speed at the centre of the Wind Farm Site at 100 m MSL was predicted to be 9.72 +/- 0.31 m/s. The highest wind speed gradient per km between 2 nodes was found to be 0.05%/km for the HKWWFZ, reflecting the distance of the HKWWFZ to shore.
The WRA results were found to be in line with expectations from previous studies in the area. The alignment with the Metocean study showed very good agreement within the pre-defined boundaries of 0.1 m/s at six site nodes within the WFZ.
In addition to internal wake effects, the wake analysis high-lighted that external wake effects from neighbouring wind farms, as well as wind farm blockage, were expected to have a significant contribution to the overall wake losses.

Netherlands Enterprise Agency64 Project and Site Description Hollandse Kust (west) 65
4.11.4 DeliverablesAn energy yield report was delivered, detailing the objectives, methodology, results, and associated uncertainties presented above.
In addition, wind data was delivered at the six selected node locations, including:• Annual mean wind speed for heights of 10, 60, 100, 120,
160, 200, 250, and 300 m MSL;• Annual mean wind speed profile;• Diurnal, monthly, seasonal, and year-to-year variation of
the mean wind speed;
• Omni-directional and directional mean wind speed distribution, including Weibull parameters for heights 10, 60, 100, 120, 160, 200, 250, and 300 m MSL;
• Mean wind speed for different probability levels (P10, P25, P50, P75, and P90);
• Wind roses (mean wind speed vs. wind direction);• Omni-directional and directional turbulence intensity as a
function of wind speed;• Air density, temperature, pressure, and humidity.
A wind speed map was delivered (see Figure 4.29) in GIS formats, in addition to a 100x100 m wind resource grid (WRG format used by the wind industry including average and sector-wise Weibull parameters).
Figure 4.29 Wind Resource map of HKWWFZ at 100 m. Coordinates are in UTM31N, ETRS89.

Netherlands Enterprise Agency66 Project and Site Description Hollandse Kust (west) 67
5.Resources for furtherinformation
5.1 Useful websites to help keep track
• The most up-to-date information on site data, including the results of the HKWWFZ metocean campaign, can be found at offshorewind.rvo.nl/. The site also contains maps, minutes of webinars, a Q&A, and revision log.
• More information on the permit, the Wind Farm Site Decisions and the FAQ can be found at english.rvo.nl/topics/sustainability/offshore-wind-energy and in Dutch at rvo.nl/windenergie-op-zee.
• “Noordzeeloket” provides information on several spatial topics concerning the North Sea, including offshore wind. Please visit windopzee.nl (Dutch only) and noordzeeloket.nl/en/functions-and-use/.
• Information by TSO TenneT, regarding the offshore grid connection, can serve as background information for offshore wind farm developers. Offshore grid documents (English) can be found at offshore-documents.tennet.eu/nl/.
• Interested in connecting with specific businesses or knowledge institutions within our supply chain? Do you have questions for trade organisations or governmental agencies. Please visit wind & water works (windandwater-works.com).
Several websites provide the most up-to-date information and status of all relevant studies, legal framework, and the application process for a subsidy and permit. The most important of these are listed below.

Netherlands Enterprise Agency68
The Netherlands Enterprise Agency has established this publication with support from:Editorial: Gail Rajgor, Editorial Rescue Figures, maps and illustrations: GIS Competence Centre and parties listed in 1.4 Experts and contractors Photography: Mischa Keijser, TenneTDesign: BBK/Door Vriendschap Sterker
Appendices
Appendix A: Applicable Law Appendix B: Summary of Environmental Impact AssessmentAppendix C: Boundaries and Coordinates HKWWFZ
Appendices are available on offshorewind.rvo.nl/generalw

The creative commons license 4.0 apply to this material.
This document contains unofficial translations.They confer no rights and are provided for convenience purposes only. Whilst a great deal of care has been taken in compiling the contents of this document, Netherlands Enterprise Agency (RVO) can not be held liable for any damages resulting from any inaccuracies and/or outdated information.
Contact Netherlands Enterprise Agency (RVO) Croeselaan 15 | 3521 BJ | Utrecht | The Netherlands P.O. box 8242 | 3503 RE | Utrecht | The Netherlands T +31 (0) 88 042 42 42 E [email protected] Research and events: offshorewind.rvo.nl Tenders: rvo.nl/windenergie-op-zee
June 2021
Netherlands Enterprise Agency (RVO) is an agency of the Dutch Ministry of Economic Affairs and Climate Policy. Netherlands Enterprise Agency implements policy for various ministries in the areas of sustainability, agricultural, innovation and international business and cooperation. Netherlands Enterprise Agency is the contact point for businesses, knowledge institutions and government bodies for information and advice, funding, networks and legislation and Regulations.