project design document: a.t. biopower rice husk fuelled
TRANSCRIPT

Project Design Document
for
A.T. Biopower
Rice Husk Power Project
January 2003
Mitsubishi Securities
Clean Energy Finance Committee
Jan 27, 2003 Junji Hatano
<CONTENTS>
1. PROJECT INFORMATION .......................................................................... 1
1.1 Project title 1
1.2 Contact 1
1.3 Project Description 1
1.4 CDM Synopsis 2
1.5 Project Parties 2
1.6 Project Implementation Schedule 3
2. PROJECT PLANS....................................................................................... 4
2.1 Plant Sites 4
2.2 Fuel Supply and Transport 5
2.3 Electricity and Steam Sales 10
2.4 Technology, Equipment and Operation 12
2.5 Financial Plans 12
3. CONTRIBUTION TO SUSTAINABLE DEVELOPMENT IN THE HOST COUNTRY........................................................................................................ 14
3.1 Thailand’s Need for Growth in Electricity Generation 14
3.2 Importance of Biomass Energy for Thailand 14
3.3 Environmental Protection 15
3.4 Socioeconomic Contribution 17
3.5 Public Participation 19

4. CDM PARAMETERS ................................................................................. 20
4.1 Project Flowchart and Boundaries 20
4.2 Baseline and Project Lifetimes 21
4.3 Additionality 21
5. BASELINE AND ASSOCIATED GHG EMISSIONS .................................. 23
5.1 Key Factors Determining Electricity Baseline 23
5.2 Electricity Baseline Emissions 27
5.3 Steam Baseline Emissions 28
5.4 Methane Baseline Emissions from Open-Air Burning of Rice Husk 31
5.5 Baseline Emissions for Cement Replacement by Rice Husk Ash 32
6. PROJECT EMISSIONS ............................................................................. 34
6.1 Direct On-site Emissions 34
6.2 Direct Off-site Emissions 36
6.3 Indirect Emissions Effects (Leakage) 37
7. ESTIMATION OF EMISSION REDUCTION............................................... 39
8. MONITORING AND VERIFICATION PLAN (MVP) ................................... 40
8.1 Overview 40
8.2 Baseline Emissions 40
8.3 Project Emissions 45
8.4 CER Generation and Calculation 49
8.5 Plant Operation and Training 50

8.6 Environmental Protection 52
8.7 Socioeconomic Benefits and Public Participation 53
8.8 Monitoring and Verification Organization 54
8.9 MVP Summary 54
APPENDICES
A Annual Paddy and Husk Production in ATB’s Procurement Area 57
B Letter of Approval of the EIA 58
C Social Contract with Local Community 59
D Summary of Public Participation Meetings (Pichit Site) 62
E Detailed O&M Contractor Mobilization Activity Chart 67
F ATB Organization as Relevant to MVP 68
REFERENCE FILES
RF-I: Environmental Impact Assessment (English Summary)
RF-II: EIA Opinion Survey

- 1 -
1. PROJECT INFORMATION 1.1 Project title AT Biopower Rice Husk Power Project. (The ATB Project or the Project.) 1.2 Contact 1.2.1 Project company
Dr. Thawat Watanatada Chief Executive Officer A.T. Biopower Co. Ltd. (ATB) 719 KPN Tower, 14th Floor Rama 9 Road Bangkok 10320, Thailand Tel: (66 2) 717 0445 to 8 Fax: (66 2 ) 717 0449 E-mail: [email protected] Website: www.atbiopower.co.th
1.2.2 CDM advisor
Junji Hatano Chairman, Clean Energy Finance Committee Mitsubishi Securities Co., Ltd. Mitsubishi Building 2-5-2 Marunouchi, Chiyoda-ku Tokyo 100-0005, Japan Tel: (81 3) 5223 3624 Fax: (81 3) 5223 6312 E-mail: [email protected]
1.3 Project Description The Project is designed to use for power generation rice husk that would otherwise be burned in the open air or left to decay. It involves five rice husk power plants in central Thailand, each having approximately 22 MW gross generating capacity, 20MW net.

- 2 -
Electricity will be sold through 25-year power purchase agreements (PPAs) with the Electricity Generating Authority of Thailand (EGAT). In addition to electricity, the plants will supply steam to industrial and agricultural users in their vicinity. 1.4 CDM Synopsis The Project will assist Thailand’s sustainable growth by providing electricity and steam through biomass power production without relying on fossil fuel combustion. In addition, the Project will assist Thailand with greenhouse gas (GHG) reduction by curbing methane emissions from open-air burning of rice husk and by providing high-quality rice husk ash which can lower requirements for energy-intensive cement manufacturing. ATB’s plants will employ the most advanced technology currently available, minimizing the environmental impacts to the neighboring areas. Extensive public participation, including social contracts with local stakeholders, is a notable feature of the Project. The financial plans for the project do not involve public funding from Annex I countries. The Project will generate approximately 430,000 tonnes of CERs annually, about 3 million tonnes for the entire 7-year initial crediting period. 1.5 Project Parties 1.5.1 A.T. Biopower (ATB) ATB is a project development and finance company that undertakes a comprehensive development and finance responsibility, covering a host of activities that include obtaining all necessary permits, conducting a feasibility study, developing a conceptual plant design, finding low cost sources of plant equipment and construction service, and securing equity and debt financing.
- 3 -
The Project will be managed by a full-time project development and management team of over ten staff at ATB, led by Dr. Thawat Watanatada, CEO. Dr. Watanatada has over 25 years of experience in infrastructure project development and finance, including 18 years at the World Bank in Washington. 1.5.2 Major equity investors Rolls-Royce Power Ventures Ltd. (RRPV) is the industrial investor in the Project and will hold a 50% equity share in ATB. Part of the Rolls-Royce plc network, RRPV focuses on developing independent power projects between 5 MW to 150 MW in selected markets internationally. RRPV is headquartered in London. Al Tayyar Energy Ltd. (ATE) is an energy investment and development company that will be a major investor in ATB. Based in the United Arab Emirates and Washington, DC, ATE focuses on renewable energy and energy efficiency projects in developing and newly industrialized countries. 1.5.3 Engineering partners The Engineering Business Division of the Electricity Generating Authority of Thailand (EGAT EB) combines expertise in the area of power planning, transmission and environmental engineering. It is considered to be the largest power engineering service provider in Thailand. The EGAT EB team working on the Project consists of about 15 professionals, including a project manager, lead engineers in various key disciplines, and contract specialists for EPC and O&M agreements. 1.6 Project Implementation Schedule
• Financial closure: 2nd quarter 2003 • Power purchase agreement: 2nd quarter 2003 • Construction to start: 2nd auarter 2003 • Plant operations to commence:
1st plant: 1st half 2005 2nd plant: 2nd half 2005 3rd plant: 2nd half 2005 4th plant: 2nd half 2005 5th plant: 1st half 2006

- 4 -
2. PROJECT PLANS 2.1 Plant Sites ATB’s plants will be located in:
• Tambon Hor-krai, Ampur Bang-moon-nak, Pichit • Tambon Nam-song, Ampur Payuha-kiri, Nakhon Sawan • Tambon Po-kruam, Ampur Muang, Singburi • Tambon Bang-Ngam, Ampur Sri Prajan, Suphanburi • Tambon Tung Bua, Ampur Kam-pang-saen, Nakhon Pathom
Figure 1: Plant Sites
Each plant will be located on a 30 to 35 hectare site. About half the site will be used for plant buildings, equipment, and storage facilities. The rest will be used as buffer zones and green space.

- 5 -
Figure 2: Image of ATB Plants Sites
2.2 Fuel Supply and Transport 2.2.1 Rice husk availability Rice has always been Thailand’s flagship agricultural product, with Thailand the world’s largest exporter of rice. Production is stable. From 1981 to 1999, the average yearly production was about 20 million metric tons a year. Figure 31 shows a general increase of about 1 to 2% per year. In the 1998-99 crop year, 23.5 million tonnes were produced, and in the record crop of 2000-01, some 26 million tonnes were produced.
Outdoorrice husk storage
Indoor storage
Boiler
Steam turbine generator

- 6 -
Figure 3:Paddy Production in Thailand 1981-99 (millions of metric ton)
0
5
10
15
20
25
1981-82
1983-84
1985-86
1987-88
1989-90
1991-92
1993-94
1995-96
1997-98
Paddy
Central Thailand, the location of ATB’s power plants and fuel supply, is a rich alluvial plain with an extensive network of irrigation canals. Most farmers in the region enjoy three rice harvests a year. ATB considers its fuel supply area to be the 18 provinces2 comprising the five provinces where the plants are located, plus 13 adjacent provinces within an economical transport distance, about 100 km. These provinces have annually produced 8.6 million ~ 10.1 million tonnes of paddy in 1996 to1999, amounting to about 40% of the nation’s total. (Please refer Appendix A for details.) According to a study by Black and Veatch3, rice husk makes up about 23% of the total paddy weight. The rice millers in the 18 provinces therefore should be generating 2.0 ~ 2.3 million tonnes of rice husk annually4. This amount represents more than three times the quantity of rice husk required by the five ATB plants, estimated to be about 715,000 tonnes per year. Please refer to Section 2.2.2 for detail.
1 Statistics from the Office of Agricultural Economics, Ministry of Agriculture and Cooperatives. 2 Thailand has 78 provinces. 3 Black and Vetch (Thailand) Ltd., November 2000. “Thailand Biomass-Based Power Generation and Cogeneration Within Small Rural Industries.” Study commissioned by the National Energy Policy Office. 4 8.6~10.1 million tonnes×23%=2.0~2.3 million tonnes
- 7 -
There is reason to believe that the fuel supply for the ATB plants will be even more abundant. In addition to local supply, rice husk from paddy grown in other provinces is available in ATB’s fuel supply area. This is due to a disproportionately higher concentration of rice mills in central Thailand, for closeness to the population center of Bangkok and its vicinity (for domestic consumption), as well as to the ports (for export). These mills process large amounts of paddy transported from the northern and northeastern provinces. According to the rice millers’ association of Supanburi, one of ATB’s plant sites, the province produces some 1 million tonnes of rice husk annually, even though rice husk from its own paddy averages only at 280,000 tonnes per year in 1996 - 1999. ATB estimates that the amount of rice husk produced in its targeted fuel supply area is more than four times its requirements. Demand for rice husk is low. As a result, the disposal of rice husk is a serious problem for many millers, many of whom must burn or dump it. The most common industrial use for rice husk in rice-growing countries is to produce heat or steam for parboiling or paddy drying. A few of the largest rice mills are able to burn their rice husk to generate mechanical or electrical power, mainly for their own use. However, but for a few exceptions, mills in Thailand are too small to economically generate electricity from rice husk. 2.2.2 Rice husk requirements of ATB plants Laboratory tests conducted by ATB show the following characteristics for the rice husk to be used as fuel:
• Ultimate Analysis Carbon 37.13% Hydrogen 4.12% Oxygen 31.60% Nitrogen 0.36% Sulphur 0.05% Ash 17.75% Moisture 9.00% Total: 100.00%
- 8 -
• Calorific Value: 13,607J/kg → 0.013607Tj/tonne
As described in 2.2.3, ATB expects to produce approximately 730,000MWh of electricity annually, of which 660,000MWh will be exported to EGAT, with the remaining 70,000MWh consumed internally at the plants. In terms of energy5, the amount of electricity produced at ATB’s plants will equal 2,628TJ/year:
730,000MWh/year x 3,600MJ/MWh x (1TJ/1millionMJ) = 2,628TJ/year ATB’s feasibility study indicates that the plants will convert approximately 30% of the heat generated in the boilers to electrical power. Therefore, the boilers need to provide 8,760TJ/year of heat (energy) in order to generate the planned amount of electricity: (2,630TJ/year) / 0.3 = 8,760TJ/year Since the expected efficiency for ATB’s boilers is 90%, the rice husk to be combusted at the ATB plants must contain the following amount of energy: (8,760TJ/year) / (0.9) = 9,733TJ/year Based on the calorific value of 0.013607TJ/tonne for the rice husk to be used as fuel, the quantity of rice husk needed to produce the required amount of energy is approximately 715,000tonnes/year: (9,733TJ/year) / (0.013607TJ/tonne) ≅ 715,000tonnes/year Since the ultimate analysis shows that rice husk contains 17.75% of ash content, the Project will produce approximately 127,000tonnes/year of ash. 715,000tonnes/year X 17.75% ≅ 127,000tonnes/year
5 Energy is measured in joules (J), the SI unit equivalent to watt second. Since 1 hour contains 60 seconds x 60 minutes = 3,600 seconds, 1 watt hour = 3,600J. It follows then that 1 MWh = 3,600MJ.

- 9 -
The relationships are summarized in the following diagram:
Figure 4: Rice Husk Combustion
2.2.3 Fuel supply and transport agreements ATB has entered into 8-year fuel supply agreements with about 100 rice millers, principally within 80 km of the proposed plants. The total quantity of rice husk already contracted to ATB represents most of the fuel needed to generate the planned amount of electricity. Rice husk will be delivered to each power plant primarily by small local truckers operating 10-wheel trucks, the most common truck configuration in Thailand.
Rice huskas fuel
715,000 tonnes/year
Electricity:2,628TJ/
730,000 MWh/year
Rice Husk Ash:127,000 tonnes/year
Other products of rice husk combustion:- Mostly: O2 , N2 , CO2- Small to trace amounts of: NO2, SO2, CH4
Energy8,760TJ/year
0.013607 TJ / tonneAbout30%
EGAT660,000MWh/year
Internal use70,000MWh/year
17.75%

- 10 -
2.3 Electricity and Steam Sales 2.3.1 Electricity Sales The main channel for EGAT’s purchases of renewable energy is the Small Power Producer Program6. Standardized power purchase agreements (PPAs) with EGAT under the SPP Program run from 6 to 25 years. ATB will apply for 25-year firm agreement with a contracted capacity of 20 MW per plant, whereby EGAT guarantees minimum purchase of 80% of the contracted capacity. Given ATB’s plan to operate its plants for 24 hours a day, 346 days a year, the minimum amount of electricity sales to EGAT will be 660,000MWh/year:
5×20MW×24h×346d×80%≅660,000MWh/year It is expected that ATB’s plants will internally consume about 10% of the electricity they produce. Taking this into consideration, exporting the above amount to EGAT requires ATB to generate 730,000MWh/year of electricity:
(660,000MWh/year)/(1 - 0.1) = 730,000MWh/year 2.3.2 Steam Sales ATB plans to sell steam to agricultural and industrial users. Using rice husk as fuel, ATB can generate low pressure steam at a much lower cost than using fuel oil. Thus, selling steam to nearby industrial and agricultural users could result in substantial advantages both environmentally and economically. In addition, the provision of low cost steam for agricultural uses such as paddy drying, for which there is substantial demand, would offer large social and political benefits. The sale of steam will require additional capital investment in the equipment, most significantly a boiler about 20% larger than is necessary for electricity generation alone. The cost of this larger boiler has been included in the Project’s cost estimates.
6 A Small Power Producer (SPP) can be any private, government or state enterprise that generates electricity either (a) from non-conventional sources such as wind, solar and mini-hydro energy or fuels such as waste, residues or biomass, or (b) from conventional sources as well as producing steam through cogeneration.
- 11 -
For industrial sales, the discussions ATB has had with one of the largest paper mill in East Asia, located next to one of ATB’s plant sites, indicate that there is a strong possibility that the paper mill will purchase a significant part of its steam requirements from ATB7. The purchase is expected to be of the order of 24 tonnes an hour, 10 hours a day on 346 days a year (days on which the ATB plant operates ). This brings ATB’s total annual steam supply to 83,000tonnes. ATB will provide the steam at 6 bar. 2.3.3 Sale of Rice Husk Ash to Cement Manufacturer As stated in 2.2.2, rice husk to be used as fuel by the Project will yield about 127,000 tonnes/year of ash. Rice husk ash (RHA) produced in properly-controlled facilities such as ATB’s power plants is a non-crystalline silica ash suitable for mixing with portland cement to make concrete. When RHA is used in lieu of the same amount of portland cement, it would effectively displace GHG emission-intensive cement manufacturing process. Much research has been conducted on RHA’s role as a strengthening admixture for cement, with the following patent showing the practical potential. United States Patenet: “Highly Durable Cement Products Containing Siliceous Ashes” Date: September 13, 1994 Inventor: Mehta, Provinhdar K. (El Cerrito, CA) Assignee: The Regents of California (Oakland, CA) Application Number: 000047 ATB has entered into discussions with well-established Thai cement manufacturers for the sale of approximately 30,000 tonnes/year of RHA8. In the best case, these and other cement manufacturers will buy all of ATB’s RHA expected to amount 127,000 tonnes annually. The purchase agreements to be concluded with cement manufacturers will stipulate that the RHA purchase from ATB is for the purpose of using it as a cement replacement by mixing it with cement. They will also state that the cement manufacturer who buys the
7 The name of the paper mill has been disclosed to the validator under a confidentiality agreement. 8 The names of these cement manufacturers have been disclosed to the validator under a confidentiality agreement.

- 12 -
RHA will not develop a separate CDM project based on GHG emissions reduction in its cement production accomplished with the RHA purchased from ATB. 2.4 Technology, Equipment and Operation The ATB plants will use identical equipment and operating systems based on suspension-fired boilers. Designed to burn ground rice husk in suspension, suspension-fired boilers are arguably the most fuel efficient of the different boiler types that can be used with rice husk. As the first example to use this state-of-the-art technology in Thailand, the Project represents an important case of technology transfer. The ATB plants will be constructed by Electrowatt-Ekono (Thailand) Ltd. (EWE) as EPC contractor with McBurney Corp. (McB) as combustion technology provider. A world-class company will operate the plants under O&M (Operation and Maintenance) contracts. . EWE will be required to guarantee equipment performance, net power output, fuel consumption rates, reliability, availability, and emissions. Under the EPC contract, the construction cost and completion date will be guaranteed on a lump sum, fixed-price, date-certain basis. 2.5 Financial Plans 2.5.1 Financial projections The Project cost is estimated at US$32 million per plant – about US$160 million for the five plants. This includes the cost of an EPC contract as well as the cost of land, interest during construction, project development fees, financing fees, and contingencies. The Project has been granted 5-year subsidies for SPPs from the National Energy Policy Office (NEPO). This subsidy is incorporated into the financial projections. 2.5.2 Financial structure ATB’s financial plan assumes a relatively conservative percentage of 60-15-25 among senior debt, mezzanine financing in the form of subordinated debt, and common equity.

- 13 -
The major equity investors noted in Section 1.3.2 will provide most of the common equity. The interest of these investors in the Project is predicated on the strong expectation that the Project will be designated as a CDM project and generate CERs. For mezzanine and senior debt portions of the financing, ATB expects to reach financial closure in the second quarter of 2003. The financial plans for the Project do not involve public funding from Annex I countries.

- 14 -
3. CONTRIBUTION TO SUSTAINABLE DEVELOPMENT IN THE HOST COUNTRY
3.1 Thailand’s Need for Growth in Electricity Generation According to the Power Development Plan (PDP) by the Electricity Generating Authority of Thailand (EGAT)9, Thailand’s demand for electricity will double from 100,322 GWh in 2001 to 203,778 GWh in 2012. The PDP projects a drop in the nation’s reserve margin below 20% in as early as 2005. The reserve margin represents production capacity minus demand. In Thailand, 20-25% is considered an appropriate level, for maintenance and for safeguard against untoward incidents at some plants and unexpected shortage of water in dams. The secretary-general of National Energy Policy Office (NEPO) gave a dire prediction when he warned in an interview with a leading Thai newspaper10 that the reserve margin was expected to fall to 2.4% by 2007 if environmental controversy further delayed the construction of two coal-fired plants. Against this backdrop, securing steady supply sources of electricity is a matter of vital importance for the Thai economy. 3.2 Importance of Biomass Energy for Thailand Biomass fuels, especially rice husk and bagasse, represent particularly rich energy resources for Thailand. These renewable energy sources currently fuel less than 1% of Thailand’s electricity generation, which is dominated by natural gas, lignite and imported fuel oil. Recognizing the potential contribution of renewable energy to the Thai energy mix, the government has placed great importance on supporting environmentally friendly, indigenous, and renewable sources of energy. It is noteworthy that Thailand’s National CDM Strategy11, released by the Office of Environmental Policy and Planning, places biomass renewable energy at the top of the list of promising CDM project areas for Thailand. In addition to providing renewable energy, the Project will have an added contribution to Thailand’s sustainable development in that it will improve the disposal of a major source of agricultural waste.
9 EGAT Power Development Plan (PDD) 2001, Appendix 8 10 Bangkok Post 12 December, 2001 11 National Clean Development Mechanism Strategy Study for the Kingdom of Thailand 2002, p.7

- 15 -
3.3 Environmental Protection 3.3.1 Environmental Impact Assessments (EIAs) Environmental Impact Assessments are required for the proposed plants. These assessments and mitigation plans for any impacts must be approved by the Office of Environmental Policy and Planning (OEPP) and National Environmental Board (NEB). In September 2001, ATB submitted its first completed EIA, for the Pichit site, whose English summary is attached as Reference File I. The EIA was approved by the National Environmental Board (NEB) on 20 November 2002. The English translation of the signed document of approval is attached as Appendix B. Approval of the Project’s EIA signifies conformity to all the Thai environmental standards specified in the Enhancement and Conservation of the National Environmental Quality Act B.E. 2535. EIAs for three of the other four sites have been submitted in November. Their review process is expected to take only a few months as they are identical to the Pichit plant whose EIA has already been approved. The EIA for the fifth plant, also identical to others, will be submitted subsequently. 3.3.2 Environmental evaluation of the Project The controlled combustion of rice husk burning in a modern facility such as ATB’s eliminates serious environmental consequences that arise from the usual methods of rice husk disposal, i.e. dumping or open-air burning. Figure 5 illustrates the environmental hazard caused by open-air burning of rice husk.

- 16 -
Figure 5 Other points noted for ATB’s plants are as follows:
• SO2 emissions will be minimal. NOx emissions will be kept within the standards prescribed by the Ministry of Science, Technology and Environment and the Ministry of Industry. To ensure observance of the standards, a continuous air emission monitoring system (CEMS) will be installed.
• Particulates and fly ash will be captured in an electrostatic precipitator for
controlled removal. Preliminary air dispersion simulations suggest that the maximum concentrations of solid particulate emitted by the ATB plants will be less than 20% of the national standard.
• Wastewater will not be permitted to leave the plant sites. Instead, it will
be first treated and then evaporated from an evaporating pond.
• Ash will be disposed of safely. If 127,000 tonnes / year RHA expected when all 5 plants are operational cannot be sold, provision has been made

- 17 -
to bury the ash on-site, thereby preventing it from escaping into the atmosphere or entering the local waterways via runoff.
• The large size of the sites combined with tree plantings at each plant will
buffer ambient noise.
• EPC and O&M contractors will be required to guarantee that each plant will follow World Bank environmental guidelines for thermal power plants, in addition to Thailand’s NEB regulations.
3.3.3 Environmental Protection Guarantee Fund ATB is establishing an Environmental Protection Guarantee Fund to ensure that financial resources are available to pay for damages in the unlikely event that environmental degradation occurs as a result of the operations of its plants. During plant operation, the Fund earmarks annually a sum of 1 million baht (about US$23,000) for each site, totaling 5 million baht (about US$115,000) for ATB’s five plants. Please refer Appendix C for detail. 3.4 Socioeconomic Contribution 3.4.1 Socioeconomic benefits ATB intends to make certain that the power plants will substantially contribute to the well-being of the local communities. Many locals have become stakeholders in the ATB Project. Rice millers and truckers, many of whom are residents in communities in the vicinity of the power plant sites, have entered into fuel supply and fuel transport agreements. Other local residents will be involved during plant construction as construction workers and civil work subcontractors, and during plant operation as skilled and unskilled operations and maintenance personnel. In addition, local communities have expressed strong support for ATB’s plans to make low cost steam available for paddy drying, as this helps farmers achieve better margins for their crop. The list of specific local economic development impacts include;

- 18 -
• Creation of construction and power plant operation jobs (All contractors and suppliers to the project are mandated to give preference to local labor.);
• Training and professional development (Training in equipment operation and computers; internet access will also be available for workers.);
• Increased employment opportunities in rural areas (People may choose to
work locally, instead of moving to urban centers for employment.); • Increased economic activity is expected in the local communities at all
plant sites to meet transportation, housing, and catering needs, etc.; • Increased prices for rice paddy (Since the Project requires very large
quantities of rice husk, the newly created market will likely drive up prices paid to rice traders, as well as to farmers.)
3.4.2 Community Development Fund To contribute to the local communities’ social development, ATB is establishing the Community Development Fund in additional to the Environmental Protection Guarantee Fund mentioned above. The fund earmarks for each plant site 1 million baht (about US$ 23,000) annually, totaling 5 million baht (about US$115,000) for ATB’s five plants. The annual endowments are not contingent on the Project’s financial performance. Run by a committee composed of local leaders, ATB representatives and 3rd party advisors, the fund’s mandate will be to design, organize, and run projects focusing on education for the youth, cultural life, and the environment. The fund will positively impact social development at community level, through streamlined, focused activities. Please refer Appendix C for more detail. ATB’s discussions with local communities have revealed some common goals:
• Increase the number of young people continuing onto higher education (high school completion, technical college, etc.) through merit and need-based scholarships;

- 19 -
• Improve education experience at primary and secondary levels through donations and endowments to local schools;
• Increase computer literacy through factory-based and/or school-based
computer facilities and workshops;
• Promote greater awareness and understanding of environmentally sustainable farming and irrigation techniques.
3.5 Public Participation Numerous meetings have been held with local stakeholders at all the plant sites. As an example, Appendix D lists 24 principal meetings held for the Pichit site and the results of these meetings. The EIA for Pichit includes opinion surveys conducted amongst 20 community leaders and 150 villagers. Reference File II provides the results of these opinion surveys, as well as the analysis and methodology. The results were very positive for the Project with as 87% of respondents expressed agreement, while only 2.7% disagreed.

- 20 -
4. CDM PARAMETERS 4.1 Project Flowchart and Boundaries Figure 6
Notes:
(1) The dotted lines indicate the Project’s boundaries.
(2) For the reasons mentioned in Section 6.3.1, this item is viewed as outside the Project boundaries.
(3) For conservatism, these reduction possibilities are not included in the calculation of the Project’s
CERs.
Left to decay
Current uses
Rice husk
(2)
(3)
ATB power plants
Rice husk transportation Electricity
Steam
Electricity to grid
Electricity end
users
Steam to industrial
users
(1)
Steam to agricultural
users
(3)
Open-air burning
Rice husk ash (RHA)
Disposal
Cement end
users
RHA to Cement
manufacturers

- 21 -
4.2 Baseline and Project Lifetimes 4.2.1 Crediting period ATB selects a seven-year crediting period, with potential for renewal for maximum 2 additional periods. The duration of the initial baseline is seven years spanning 2006-2012. The starting year represents the first full-year operation for four of ATB’s five plants. The crediting period may be postponed if plant completion is delayed. 4.2.2 Project lifetime The Project has a lifetime of at least 25 years. As mentioned in Section 2.3.1, ATB plans to enter into 25-year PPAs with EGAT. 4.3 Additionality The Project differs from any of a small number of undertakings hitherto seen in Thailand for rice husk power generation. While other projects rely on one large rice mill for the supply of all or nearly all of the rice husk to be used at their power plants, the Project sources its rice husk from a great number of smaller mills. With few exceptions, rice mills in Thailand are too small to use the rice husk they produce for electricity generation. The Project will collect unused rice husk from these mills to be used as fuel for its power plants. Without the Project, the rice husk at these mills would continue to be either dumped or burned in the open air or in simple incinerators. The absence of a core rice husk supplier increases investors’ perceived risk of the Project, specifically in relation to future availability and prices of rice husk needed to fuel ATB’s plants. This is added to the difficulty which is common to nearly all biomass renewable projects in Thailand: a lower ROE (Return on Equity) than that for investment in conventional power plants such as combined cycle gas12. On a business-as-usual basis, it has not been possible to attract investors to the Project.
12 The Project’s financial projections have been provided to the validator under a confidentiality agreement.

- 22 -
If registered under the CDM, the Project will generate an estimated average of 430,000tCO2/year of CERs, which will significantly assist implementation of the Project. At the current price of about US$5, the CERs will enhance the Project’s ROE by 5.4 %, based on the Project’s financial plans described in Section 2.5.
(1) Common Equity amount: 25% x US$160million = US$40million (2) Annual revenue from CERs: (430,000tCO2/year) x (US$5/tCO2) = US$2,150,000/year (2)/(1): US$2,150,000 / US$40million = 5.4%
This brings the Project’s ROE closer to a level acceptable to investors. An added incentive for investors is the higher status associated with CDM designation. The Project will publicly highlight its participants’ environmental commitment. When registered with the CDM Executive Board, the Project will be one of the first CDM projects in all Southeast Asia, let alone in Thailand. Project participants will also benefit from pioneering the learning experience for the CDM process.

- 23 -
5. BASELINE AND ASSOCIATED GHG EMISSIONS The baseline analysis for the Project involves four components: generation of electricity, generation of steam, methane emissions from open-air burning of rice husk, and replacement of cement by rice husk ash. 5.1 Key Factors Determining Electricity Baseline The Project’s plan to sell to EGAT the electricity it produces makes the Thai national grid its natural baseline. The baseline emissions for the Project represent the volume of GHG that would be emitted to provide the same amount of electricity to the grid without the Project. A careful analysis was conducted as to whether the electricity from the Project will replace the average grid power production or any one particular component of the grid. As noted in Section 5.1.1 below, the currently prevalent mode of electricity generation for the Thai grid is combined-cycle natural gas. This does not necessarily mean that the Project will displace combined-cycle natural gas power generation. Given the government’s aim at curbing oil imports to improve the Thai trade balance, a more likely candidate for displacement is oil-fueled electricity. In fact, in EGAT’s Power Development Plan (PDP) 2001, the oil-fueled component is projected to decrease rapidly in coming years. This scenario would lead to a significantly higher baseline for the Project and accord it almost twice as many CERs in comparison to using the grid’s average for the baseline. Despite its high probability, however, displacement of oil-fueled electricity would not be ascertained as a definite fact. EGAT officials point out that it is often a mistake to see a causal link of displacement between an increase in one component of the grid and a concurrent reduction in another. The emphasis is on the importance of treating the grid as an integral whole. To keep the Project’s baseline conservative, displacement of the oil-fueled component of the grid was rejected in favor of the grid’s average. In the absence of official figures, present and future annual average carbon emission factors (CEFs) for the Thai national grid are estimated in the manner outlined below. In the future, when the baseline and/or CEF for the national grid are officially established, the Project will use the official figures to calculate its CERs.

- 24 -
5.1.1 Grid fuel composition EGAT’s Power Development Plan (PDP) 2001 Appendix 8 provides the actual and projected total energy generation and fuel requirements of the Thai national grid until year 2016. It includes current and future electricity import from Lao PDR13. The relevant parts of this appendix are reproduced below.
Table 1: Forecast of Total Energy Generation in Thailand
13 In addition to electricity import from Lao PDR, the Thai government is negotiating with China on the supply of hydro electricity. This purchase, still inconclusive, has not been incorporated into EGAT’s PDP and as such not reflected in the baseline calculations for the Project. Baseline calculations for the Project will be adjusted if the Chinese hydro deal materializes and is added to EGAT’s PDP.
Type U nit
2000 2006 2007 2008 2009 2010 2011 2012
H ydroelectric G W h 3853 4503 4479 4241 4413 4461 4457 4476
% 3.9 3.2 3.0 2.7 2.6 2.5 2.3 2.2
N atural G as G W h 52500 87007 85836 81518 90443 96000 91408 82703
% 53.7 61.9 57.3 51.3 53.0 53.0 47.6 40.6
H eavy O il G W h 12935 1112 1080 1051 1050 1052 1050 1054
% 13.2 0.8 0.7 0.7 0.6 0.6 0.5 0.5
D iesel O il G W h 63 80 41 0 2 5 2 2
% 0.1 0.1 0.0 0.0 0.0 0.0 0.0 0.0
Lignite G W h 16115 17257 17255 17309 16254 16252 16255 15797
% 16.5 12.3 11.5 10.9 9.5 9.0 8.5 7.8
Im ported C oal G W h 0 13979 23291 25170 25094 25094 25094 25170
% 0 9.9 15.6 15.8 14.7 13.8 13.1 12.4
O ther Purchases ・SPP G W h 9571 13786 14417 14417 14417 14417 14417 14417
% 9.8 9.8 9.6 9.1 8.5 8.0 7.5 7.1
・Lao PD R G W h 2701 2875 3330 15332 18835 18787 18722 18699
% 2.8 2.0 2.2 9.6 11.0 10.4 9.7 9.2
・New IPP G W h 0 0 0 0 0 5190 20742 41460
% 0 0 0 0 0 2.9 10.8 20.2
Sub-total G W h 12293 16661 17747 29749 33252 38394 53881 74576
% 12.6 11.9 11.9 18.7 19.5 21.2 28 36.6
G rand Total G W h 97759 140599 149729 159038 170508 181258 192147 203778

- 25 -
5.1.2 Assumptions related to PDP For the analysis of the Thai grid’s baseline emissions, it is necessary to make the following two assumptions:
1. All natural gas-fueled power stations in Thailand are combined-cycle. 2. Future IPP projects will be 100% combined-cycle natural gas.
The first assumption relates to the extent to which Thailand’s natural gas electricity generation is combined-cycle. In 2000, 53.7% of the Thai grid was fueled by natural gas. How much of this is combined-cycle is a key factor in baseline determination, in view of a significant difference in emission levels between single-cycle and combined-cycle facilities (0.610kgCO2/kWh vs. 0.398kgCO2/kWh as noted in Table 2). A close study of Appendices 3 and 7 of EGAT’s PDP reveals that Thailand’s natural gas power generation capacity is predominantly combined-cycle. Given the difficulty in ascertaining the exact ratio of combined-cycle in the actual amount of electricity generated, this document treats all natural gas-fueled power generation in Thailand as combined-cycle. This approach which results in a slightly lower figure than actual baseline emissions represents conservatism in baseline setting. The second assumption concerns a line item labeled as “Other IPP” in the “Other Purchases” category in Appendix 8 of the PDP. (Please refer to Table 1.) The percentage of this item is zero in 2000 and continues to be zero until 2009. Beginning its rapid growth in 2010, this line item is projected to amount to 20.3% of the entire grid in 2012. It represents unspecified IPP generation facilities to be installed in the future. The PDP classifies all existing and firmly contracted IPP projects in their respective fuel categories. However, future IPP projects are lumped together in a separate line item called “New IPP” since no decision has been made on their fuel composition. Discussion with EGAT officials indicated that while the targeted fuel mix for New IPPs is 70% combined-cycle natural gas and 30% imported coal, the attainment of such ratio was not certain in view of local opposition to coal-fueled plants. In the absence of firm projections, the baseline emissions calculation in this document assumes that “New IPP” under “Other Purchases” will be 100% combined-cycle natural gas. This assumption will be replaced with the actual fuel mix of “New IPPs” given in each new

- 26 -
edition of the PDD. The Project’s CERs will be calculated on the basis of the actual fuel mix for New IPPs. 5.1.3 CEFs by generation type The World Bank EM Model14 provides default CEFs for various types of electricity generation. The relevant figures are reproduced in Table 2 below.
Table 2: Carbon Emission Factors for Electricity Generation
Type CEF in kgCO2/kWh
Hydro 0.000Natural Gas- Single Cycle 0.610Natural Gas- Combined Cycle 0.398Heavy Oil 0.721Diesel Oil 0.717Lignite 0.885Imported Coal 0.930Coal (small scale) 0.988Oil (small scale) 0.613Combined cycle gas (small scale)
0.415
Renewables 0.000
5.1.4 Grid CEFs The estimation of Thai Grid CEFs over the Project’s crediting period starts with the calculation of the CEF for a given year. This is the weighted-average of CEFs for each fuel type of power generation in that year and can be obtained in STEPs 1-3. STEP 1: (1) Weight of fuel type in national grid (%) (Table 1) x (2) CEF for the fuel type (kgCO2/kWh) (Table 2) STEP 2: Repeat STEP 1 for every fuel type in the national grid STEP 3: Add all the products of above calculations for the given year
14 Version 1. Developed by Oeko Institute and University of Kassel, sponsored by the World Bank et.al http://www.worldbank.org/html/fpd/em/model/model.stm
- 27 -
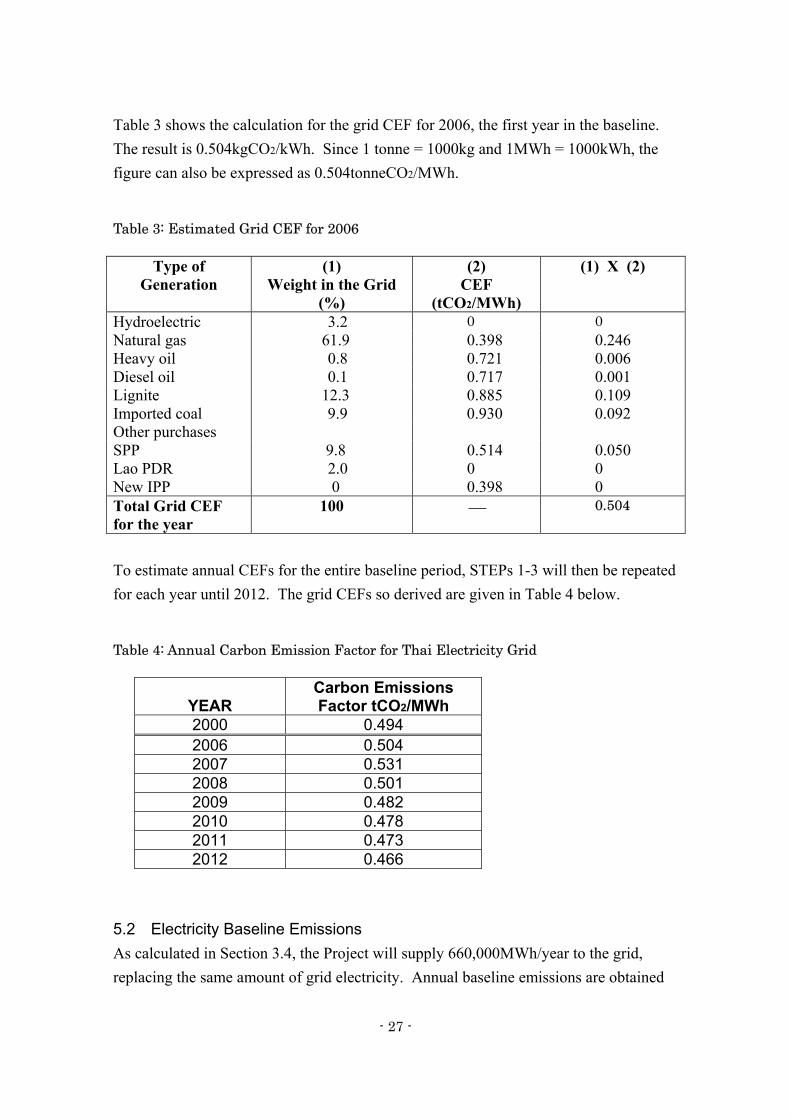
Table 3 shows the calculation for the grid CEF for 2006, the first year in the baseline. The result is 0.504kgCO2/kWh. Since 1 tonne = 1000kg and 1MWh = 1000kWh, the figure can also be expressed as 0.504tonneCO2/MWh.
Table 3: Estimated Grid CEF for 2006
Type of Generation
(1) Weight in the Grid
(%)
(2) CEF
(tCO2/MWh)
(1) X (2)
Hydroelectric 3.2 0 0 Natural gas 61.9 0.398 0.246 Heavy oil 0.8 0.721 0.006 Diesel oil 0.1 0.717 0.001 Lignite 12.3 0.885 0.109 Imported coal 9.9 0.930 0.092 Other purchases SPP 9.8 0.514 0.050 Lao PDR 2.0 0 0 New IPP 0 0.398 0 Total Grid CEF for the year
100
0.504
To estimate annual CEFs for the entire baseline period, STEPs 1-3 will then be repeated for each year until 2012. The grid CEFs so derived are given in Table 4 below.
Table 4: Annual Carbon Emission Factor for Thai Electricity Grid
YEAR Carbon Emissions Factor tCO2/MWh
2000 0.494 2006 0.504 2007 0.531 2008 0.501 2009 0.482 2010 0.478 2011 0.473 2012 0.466
5.2 Electricity Baseline Emissions As calculated in Section 3.4, the Project will supply 660,000MWh/year to the grid, replacing the same amount of grid electricity. Annual baseline emissions are obtained

- 28 -
by multiplying this amount of electricity by the annual grid CEFs obtained in STEP 4. In other words, BASELINE EMISSIONS (tonneCO2/year) = (1) Annual Grid Electricity Replaced by Project (MWh/year) x (2) Annual Grid CEFs (tCO2/MWh) Table 5 summarizes the annual baseline emissions for the Project.
Table 5: Baseline Emissions
Year
(1) Electricity Amount
(2) CEF
(1) X (2) Baseline Emissions
Unit MWh/year tCO2/MWh tCO2/year 2006 660,000 0.504 332,600 2007 660,000 0.531 350,500 2008 660,000 0.501 330,700 2009 660,000 0.482 318,100 2010 660,000 0.478 315,500 2011 660,000 0.473 312,200 2012 660,000 0.466 307,600 Total 4,620,000 -- 2,267,200
5.3 Steam Baseline Emissions 5.3.1 Energy content of the steam As mentioned in Section 2.3.2, ATB intends to supply 83,000 tonnes of steam at 6 bar to a paper mill located next to one of its plant sites. Steam tables show that steam at 6 bar has the energy of 659 kcal/kg. For 83,000 tonnes/year, the total energy of the steam ATB supplies is calculated as:
83,000 tonnes/year x (103kg/tonne) x 659 kcal/kg = 54.7 x 10⁹ kcal/year

- 29 -
In terms of terajoules, the steam ATB supplies to the paper mill will contain
54.7 x 10⁹ kcal/year x 4.18 kJ/kcal x (1 TJ/109 kJ) = 228 TJ/year of energy. 5.3.2 Calculation of steam baseline emissions The paper mill burns bunker oil to produce the steam it requires. Assuming standard energy efficiency of 80% for the paper mill’s boiler, bunker oil combustion in the mill’s boiler needs to supply 285TJ/year of energy to produce the same amount of steam as ATB provides, 83,000tonnes (228TJ) a year.
228TJ/year x (1/0.8) = 285TJ/year Heat value of the Energy efficiency steam ATB supplies at the paper mill’s boiler The IPCC Guidelines15 put the carbon emission factor of bunker oil at 21.1tonne carbon/TJ. For 285TJ/year, the emissions will amount to
285TJ/year x 21.1tC/TJ = 6,013tC/year In terms of CO2 equivalent, this translates to 22,000tCO2e/year: 6,013 tC/year x (3.67 CO2/C) = 22,000tCO2e/year 5.3.3 Possible modification of steam baseline There is a possibility that ATB’s steam supply will substantially exceed the 83,000 tonnes currently projected, either to the same buyer or to others. All of ATB’s plants will be equipped to supply steam to nearby industrial users. The steam baseline for the Project will include these additional steam sales when they displace steam production by bunker oil. It will be derived by using the formulae in the preceding sections in conjunction with the actual amount of steam ATB has supplied.
15 Revised 1996 IPCC Guidelines for National Greenhouse Gas Inventories: Reference Manual, p.1.13

- 30 -
When the steam provided by ATB is of a different pressure from 6 bar, the figure 659 kcal/kg in 5.3.1 will be replaced with an energy content corresponding to the pressure of the steam supplied. Energy content figures are readily be available from steam tables. 5.3.4 Consistency Check Executives of the paper mill indicated that the mill burns approximately 90 liters of bunker oil to produce 1 tonne of its steam. The quantity of bunker oil to be burned for 83,000 tonnes of steam if ATB does not supply the amount will then be
(90 L/tonne) x (83,000 tonnes/year) = 7,470,000 L/year Based on the IPCC Guidelines, it is calculated that in a warm climate, where bunker oil has the density of approximately 0.97kg/liter, bunker oil combustion results in emission of 3.0kgCO2/liter
0.97 kg/L x 40.19 TJ/106kg x 21.1 x 103kgC/TJ x 3.67 = 3.0kgCO2/L Density Calorific value Carbon emission Conversion of bunker of bunker factor of bunker factor oil16 oil17 oil18 (C→ CO2) For 7,470,000L/year mentioned above, the GHG emissions will be about 22,400tCO2/year.
(7,470,000 L/year) x (3.0kgCO2/L) x (1 tonne/1,000 kg) = 22,400 tCO2/year This is the amount of CO2 emissions that will be eliminated when the 83,000 tonnes/year of steam supplied by ATB replaces the combustion of 7,470,000 liters of bunker oil at the paper mill. The figure is very close to the reduction estimate of 22,000
16 Properties of Crude Oils and Oil Products, Bunker C Fuel Oil http: landlytika.free.fr/html/bunker_c_spec.html 17 Revised 1996 IPCC Guidelines for National Greenhouse Gas Inventories: Reference Manual, p.1.23 18 Revised 1996 IPCC Guidelines for National Greenhouse Gas Inventories: Reference Manual, p. 1.13

- 31 -
tCO2e/year, derived in the preceding section, attesting to the validity of the approach and formulae outlined therein. 5.4 Methane Baseline Emissions from Open-Air Burning of Rice Husk In Thailand, low demand for rice husk makes its disposal a serious problem for millers. Most of the time, rice husk is either burned in the open air or left in piles to decay. The Project burns as fuel the rice husk that is otherwise unused. Since open-air burning is the most prevalent disposal method for rice husk in Thailand, this PDD assumes that rice husk would be burned in the open air if not used by the Project. It is noted that this is a conservative assumption. When rice husk is left to decay, it will release more of the carbon it contains as methane than when it is burned in the open air. This results in greater GHG emission given the large global warming potential of methane. By assuming open-air burning of all currently unused rice husk and excluding from the baseline methane emission from decaying rice husk, the Project’s PDD understates baseline emissions and keeps the baseline conservative. In open-air burning, most of the carbon contained in rice husk is released in the form of CO2. However, a small amount is released as methane. Given methane’s potency for global warming, the baseline analysis addresses the amount of carbon released as CH4 in open-air burning. As noted in Section 2.2.2, ATB expects to combust approximately 715,000tonnes of rice husk a year in its boilers. The amount of methane released by open-air burning in the absence of the Project is estimated as follows: Step 1: Rice husk used x Carbon content of = Annual carbon released as fuel rice husk19 tonnes/year tonnes/year (%) 715,000 t /y x 37.13 % = 265,500 t /y
19 Carbon content of rice husk to be used by ATB. See Section 2.1.2

- 32 -
Step 2: Carbon x Carbon x Conversion x Global = Annual released released as Factor warming CH4 in total CH4 in open-air (molecular potency released burning20 weight CH4 of methane21 (tonnesCO2 vs. C) equivalent/year) 265,500 t / y x 0.9% x 16/12 x 23 = 73,200tCO2e/year For carbon released as CH4 in open burning, The IPCC Guidelines give a range of 0.9-1.5%, with 1.2% as the representative figure. The use of 0.9% provides a more conservative estimate for the baseline. 5.5 Baseline Emissions for Cement Replacement by Rice Husk Ash As described in Section 2.3.3, ATB plans to sell 30,000 tonnes a year of rice husk ash (RHA) produced by the Project to well-established Thai cement manufacturers as a cement mixture. RHA used in lieu of the same amount of cement will contribute to GHG emissions reduction by displacing the highly GHG emission-intensive cement manufacturing process. The first source of CO2 emissions in cement production is the calcination process during which calcium carbonate (CaCO3) from limestone, chalk, or other calcium-rich materials is heated to form lime (CaO). The IPCC Guidelines provide a carbon emission factor CEFClinker of 0.5 tCO2 / 1 tonne clinker produced.22 Both the Working Group II Report and IEA Green Report recommend using the same factor.
20 Revised 1996 IPCC Guidelines for National Greenhouse Gas Inventories: Reference Manual, p.5.33 21 For the global warming potential of methane, this PDD uses a new figure contained in the IPCC Working Group I report: “Climate Change 2001: The Scientific Basis” (c.6 Global Warming Potentials) http://www.gridas.no/climate/ipcc_tar/wg1/020.htm The new figure is consistently applied throughout the PDD, both to baseline and project emissions. Please refer to Section 6.1.1 22 Revised 1996 IPCC Guidelines for National Greenhouse Gas Inventories: Reference Manual, Section 2.3.2, p. 2.6.

- 33 -
The second source of CO2 emissions in cement production is from the combustion of fossil fuels to operate the rotary kiln. Different sources offer a range of carbon emission factors for energy use (CEFEnergy) in the production of cement. According to the IPCC Working Group II, approximately 0.75 tCO2 / 1 tonne cement produced is emitted from the combustion of fossil fuels23. While there are lower estimates, an IEA report indicates that for portland cement, which ATB’s high-quality RHA is likely to displace, the CEFEnergy is higher due to the higher ratio of clinker.24 It is deemed appropriate to assume a CEFEnergy of 0.5 tCO2/ 1 tonne cement produced. Combining CEFClinker and CEFEnergy, 1 tonne of cement production produces 1 tonne of CO2. CEFClinker + CEFEnergy = CO2 emission from cement manufacturing 0.5 tCO2/tonne cement + 0.5 tCO2/tonne cement = 1 tCO2/tonne cement One tonne of RHA, when used as a cement mixture, will displace 1 tonne of cement manufacturing. For the Project, the baseline CO2 emission for of cement by RHA is calculated as follows: RHA x CO2 emission = CO2 emissions for cement sold from cement manufacturing to be replaced by RHA 30,000 tonnes/year x 1 tCO2/ tonne cement = 30,000tonnesCO2/year It is important to note that the actual RHA sale to cement manufacturers may be greater or smaller in quantity than the estimated 30,000tonnes a year. The actual amount of RHA sales, monitored by ATB and verified by an independent third party, will be used in the Project’s CER calculation.
23 1995 IPCC Working Group II, Section 20.3.4.1 Cement and Concrete, p. 661 24 IEA Report, p. 5, http://www.ieagreen.org.uk/prghgt42.htm

- 34 -
6. PROJECT EMISSIONS 6.1 Direct On-site Emissions 6.1.1 GHG emissions from rice husk combustion Consistent with IPCC Guidelines25, CO2 emission from rice husk combustion at ATB’s plants, being the release of the CO2 absorbed on a sustainable basis by rice as it grows annually, are not counted as project emissions. The same treatment is not extended to methane emissions. Earlier, Section 5.4 estimated the amount of methane emitted in open-air burning of rice husk. When rice husk is combusted in a well-controlled environment at ATB plants, methane emissions are much less but still not zero. According to the IPCC Guidelines26, methane emissions from wood/wood waste combustion in energy industries is 30kg/TJ. As described in Section 2.2.2, ATB’s boilers will burn approximately 715,000 tonnes of rice husk a year with a calorific value of 9,733TJ. On the basis of the IPCC default factor of 30kg/TJ, the combustion at ATB’s plants will result in methane emissions of: 9,733 TJ/year x 30kg/TJ x 1tonne/1,000kg = 292tonnes/year In terms of CO2 equivalent27, this represents 6,700tCO2e/year: 292tCH4/year x 23 = 6,700tCO2e/year This amount is included as a component of project emissions in this baseline study.
25 Revised 1996 IPCC Guidelines for National Greenhouse Gas Inventories: Reference Manual, p.6.1 Please also see Revised 1996 IPCC Guidelines for National Greenhouse Gas Inventories, Workbook and IPCC Good Practice Guidance and Uncertainty Management in National Greenhouse Gas Inventories, p.5.5 26 IPCC Guidelines, p. 1.35 27 For the GHG potency of methane, this PDD uses the figure released by the IPCC Working Group. Please refer to Section 5.5 and footnote 21.

- 35 -
To increase the accuracy of project methane emissions calculation, actual methane emissions from ATB’s boilers will be measured by spectroscopy when ATB’s plants commence operation. For conservatism, the larger of the default factor and the spectroscopic measurement will be used in computing project methane emissions. In case the spectroscopic measurement is larger, it will replace the default factor of 30kg/TJ in the above formula. 6.1.2 GHG emissions from fuel oil combustion The Project will require fuel oil only rarely and in small quantities. In start-up operations, 500-600 liters of fuel oil will be used several times a year. Assuming conservatively as many as five start-up operations a year, the total fuel oil consumption for this purpose will amount to about 3,000 liters per year per plant. For the five plants, the total will be 15,000 liters a year. As we noted in Section 5.3.4, combustion of 1 liter of bunker oil in a warm climate results in 3.0kg of CO2. For 15,000 liters, CO2 emissions will amount to 45tCO2/year for all the five plants.
15,000 L/y x 3.0 kgCO2/L x (1 tonne/1,000 kg) = 45tonnes/year While GHG emission from this source is expected to be minimal in size, it is included in the calculations of project emissions. Fuel oil is also required to increase the efficiency of combustion when rice husk is extremely wet in the rainy season. However, with the precaution to cover rice husk with tarpaulin, such occasions are expected to be infrequent and short. Fossil fuel used for this purpose, heavily dependent of the weather, cannot be projected in advance. At current prices, fossil fuel is several times more expensive than rice husk as fuel. There are strong economic disincentives to use fossil fuel except when absolutely necessary. For this reason, the Project expects its use of fuel oil to be small in quantity. However, the Project’s fuel oil usage, be it for start-up, in the rainy season, or for any other purpose, will be accurately monitored and incorporated in the CER calculation as project emissions. The following formula will gauge GHG emissions resulting from the actual amount of fuel oil consumption.
Fuel oil GHG emissions (tCO2)

- 36 -
= Fuel oil combusted at the Project’s boilers (liter) x
3.0 kgCO2/liter x
(1 tonne/1,000kg)
6.1.3 GHG emissions from transporting rice husk within plant sites
Within each plant site, diesel-fueled dump trucks and bulldozers will transport rice husk to the boilers. ATB estimates that the total distance to be traveled at the 5 plants will be approximately 28,000 km per year. Using the IPCC guideline28 of 1.097kgCO2/km, this will result in emissions of about 30tCO2/year.
28,000km/y x 1.097kgCO2/km = 30tCO2/year
This emission, despite its small size, is included in the calculations of project emissions. 6.2 Direct Off-site Emissions 6.2.1 Transportation of rice husk to ATB plants Transporting rice husk from rice mills to ATB’s plants by trucks results in direct off-site emissions. Calculated in the following steps, the amount of GHG emissions from this source is estimated at 6,300tCO2/year. Table 6: Data/estimates
(1) Rice husk supply needed29 (2) Approximate load for 1 trip30 (3) Average distance between supplying
mills and ATB plants30 (4) Emission factor for heavy truck
transportation28
715,000tonnes/year for the 5 plants 15 tonnes/truck 60 km
1.097 kgCO2/km
28 IPCC Guidelines P.1.75 The IPCC Guidelines provide several carbon emission factors for large trucks. For conservatism, this PDD uses the highest of them all, the one for US heavy duty uncontrolled diesel vehicles. 29 Section 2.1.2 30 ATB data

- 37 -
Table 7: Calculations (5) Number of trips needed for the
5 plants (6) Total distance traveled31 (7) Total transport emissions
(1)÷(2) (3)×(5)×2 (4)×(6) ×(1tonne/1000kg)
48,000 trips/year 5,760,000 km/year ≅ 6,300 tCO2/year
6.2.2 Transportation of rice husk ash from ATB plants to cement manufacturers Transporting rice husk ash from ATB’s plants to cement manufacturers by trucks also results in direct off-site emissions. Calculated in the following steps, the amount of GHG emission from this source is estimated at approximately 900tCO2/year. Table 8: Data/estimates
(1) Rice husk ash to be sold and delivered32 (2) Approximate load for 1 trip33 (8) Average distance between ATB plant and
cement manufacturers33 (9) Emission factor for heavy truck
transportation28
30,000tonnes/year 15 tonnes/truck
200 km
1.097 kgCO2/km
Table 9: Calculations
(10) Number of trips needed to deliver RHA
(11) Total distance traveled31 (12) Total transport emissions
(1)÷(2) (3)×(5)×2 (4)×(6)÷1000
2,000 trips/year 800,000 km/year ≅ 900 tCO2/year
6.3 Indirect Emissions Effects (Leakage) No leakage of significance is anticipated for the reasons delineated below. 6.3.1 Evaluation of leakage risk One factor which needs close examination with regard to leakage is whether the Project displaces current use of rice husk as fuel. If this occurs and drives current users of rice husk to resort to more carbon-intensive fuels, the amount of such fuel switch must be deducted from the Project’s emissions reduction benefits.
31 For conservatism, it is assumed that trucks need to make return journeys without picking up other loads. 32 Section 2.2.3 33 ATB data

- 38 -
There are four primary areas in the current use of rice husk as fuel:
• Power generation at rice mills for internal use • Sold to nearby factories for fuel • Burning rice husk to produce steam for paddy drying and • Use of rice husk as a domestic fuel source
6.3.2 Results of analysis The following observations indicate that the potential displacement is not likely to occur.
• Only a small portion of rice husk is currently used for any purpose. Rough estimates based on anecdotal information are:
1-2% sold for bedding in chicken coops 1-2% sold for brick making 25% burned for fuel 70% unused - dumped or burned (approximately 25% dumped, remaining 75% burned in the open or in simple incinerators).
• ATB’s requirements represent less than 1/4 of the estimated amount of rice husk produced in the provinces where ATB plans to procure its fuel. (For details, please refer to Section 2.2.1.)
• ATB’s procurement will be based on long-term contracts, with steady
purchase amounts that will be known well in advance. This arrangement will allow rice millers to plan ahead to meet both the current users’ demand and ATB’s requirements.
- 39 -
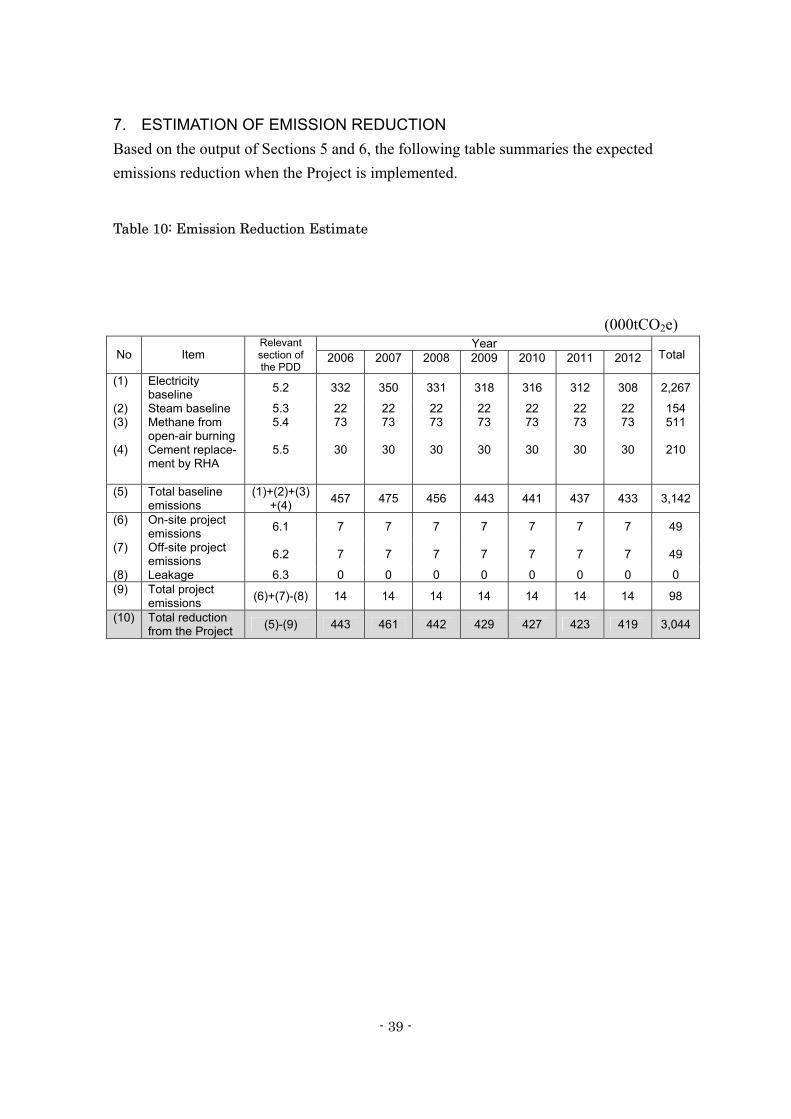
7. ESTIMATION OF EMISSION REDUCTION Based on the output of Sections 5 and 6, the following table summaries the expected emissions reduction when the Project is implemented.
Table 10: Emission Reduction Estimate
(000tCO2e) Year
No Item Relevant section of the PDD
2006 2007 2008 2009 2010 2011 2012 Total
(1) Electricity baseline 5.2 332 350 331 318 316 312 308 2,267
(2) (3) (4)
Steam baseline Methane from open-air burning Cement replace-ment by RHA
5.3 5.4
5.5
22 73
30
22 73
30
22 73
30
22 73
30
22 73
30
22 73
30
22 73
30
154 511
210
(5) Total baseline emissions
(1)+(2)+(3)+(4) 457 475 456 443 441 437 433 3,142
(6) On-site project emissions 6.1 7 7 7 7 7 7 7 49
(7) Off-site project emissions 6.2 7 7 7 7 7 7 7 49
(8) Leakage 6.3 0 0 0 0 0 0 0 0 (9) Total project
emissions (6)+(7)-(8) 14 14 14 14 14 14 14 98
(10) Total reduction from the Project (5)-(9) 443 461 442 429 427 423 419 3,044

- 40 -
8. MONITORING AND VERIFICATION PLAN (MVP) 8.1 Overview 8.1.1 Purpose The MVP for the Project will set out the process and procedures to collect pertinent data in a systematic and reliable way, monitor them regularly, and present them for verification as stipulated in the CDM modalities. 8.1.2 Coverage The MVP for the Project will cover the following seven areas:
• Baseline emissions (Section 8.2) • Project emissions (Section 8.3) • CERs from the Project (Section 8.4) • Plant operation and training (Section 8.5) • Environmental protection (Section 8.6) • Socioeconomic contribution and public participation (Section 8.7) • Monitoring and verification organization (Section 8.8)
8.1.3 Use of Commercial Records Monitoring and verification for the Project has an advantage in that many key factors determining the emissions reduction amount are associated with normal business practices. The use of commercial records in the MVP is encouraged. It will streamline the monitoring and verification process by making use of the data that have already been checked by independent outside parties in the course of regular business. 8.2 Baseline Emissions 8.2.1 Grid replacement amount Every month, each of ATB’s plant will send an invoice to EGAT for the electricity it has exported to the national grid. The invoice will be based on meter readings at the plant. Copies of both monthly invoices and corresponding meter reading records will be kept in a file for verification. EGAT will be on the other side of this process. It will check the invoices it receives against the amounts of electricity supplied by ATB’s plants. Payment will be made only after EGAT is satisfied with the consistency between them.

- 41 -
Records of EGAT’s payment are important in the MVP. They show that the semi-governmental organization has accepted the accuracy of ATB’s invoices to EGAT, increasing the legitimacy of using the invoiced electricity quantity as the amount of grid replacement by the Project. 8.2.2 Grid CEF ATB will regularly monitor the fuel mix data of the Thai national electricity pool. Currently, they are available as part of EGAT’s Power Development Plan (PDP) and renewed when the PDP is updated. EGAT normally prepares a new edition of the PDP once a year. However, it sometimes updates the PDP sooner when there is a drastic change of circumstances. While ATB will check on a quarterly basis whether a new edition of the PDP has been issued, it will re-calculate the grid CEF only when the fuel mix data in the PDP are updated. Once the grid’s new fuel mix is known, grid CEFs and corresponding electricity baseline will be re-calculated using the steps outlined in Sections 5.1.4 and 5.2. 8.2.3 Electricity baseline emissions On the basis of the figures obtained in 8.2.1 and 8.2.2, electricity baseline emissions for the Project is calculated by the following formula.
Grid Grid Electricity replacement x CEF (tCO2/MWh) = baseline
amount (MWh/year) emissions (tCO2/year) (Section 8.2.1) (Section 8.2.2)
8.2.4 Steam replacement The monitoring and verification process for steam, to be sold on a long-term contract, will be similar to that for electricity generation. ATB will issue monthly invoices based on steam meter readings. Payment records from the users serves as confirmation of the amount of steam purchased from ATB. ATB will keep records of steam readings, invoices, and payments from users for verification.

- 42 -
When the actual amount of steam provided by ATB is known, it will be applied to the steps discussed in Sections 5.3.1 and 5.3.2 to calculate steam baseline emissions. Should the steam pressure level required by the users differ from 6 bar, the figure 659kcal/kg used in 5.3.1 will be replaced with the energy content corresponding to the required pressure level. 8.2.5 Methane emissions from open-burning of rice husk The actual amount of rice husk combustion, obtained and double-checked in a manner described in 8.3.1.1, will be used for estimating baseline methane emissions from the open-air burning of the equivalent amount of rice husk. Calculations will follow the steps described in Section 5.4. 8.2.6 Cement Replacement by RHA Monitoring and verification for rice husk ash (RHA) replacement of cement will first ensure that ATB and RHA purchasers have entered into agreements as described in 2.3.3. The two requisites are:
• The agreement stipulate that the RHA purchase from ATB is for the purpose of using it as cement replacement by mixing it with cement and
• The agreement states that the cement manufacturer who buys the RHA will not develop a separate CDM project based on GHG emissions reduction in its cement production accomplished with the RHA purchased from ATB.
In order to ensure the purchaser’s adherence to the second stipulation, ATB will regularly monitor published information for CDM projects in Thailand. Photocopies of signed contracts satisfying the conditions above will be kept in a MVP file and submitted to the verifier. ATB will issue invoices which state the actual amount of RHA sold and delivered to the purchasing cement manufacturer in accordance with the agreement. Payment is confirmation of the amount of RHA delivered by ATB. ATB will keep records of RHA sales and payments received for verification.

- 43 -
On the basis of the delivery data and the analysis of carbon intensity of cement manufacturing outlined in Section 5.5, baseline emissions for cement displacement is calculated as follows: RHA delivery for cement x 1tCO2/tonne = Cement displacement displacement baseline emissions (tCO2/year) (tonne/year)
- 44 -
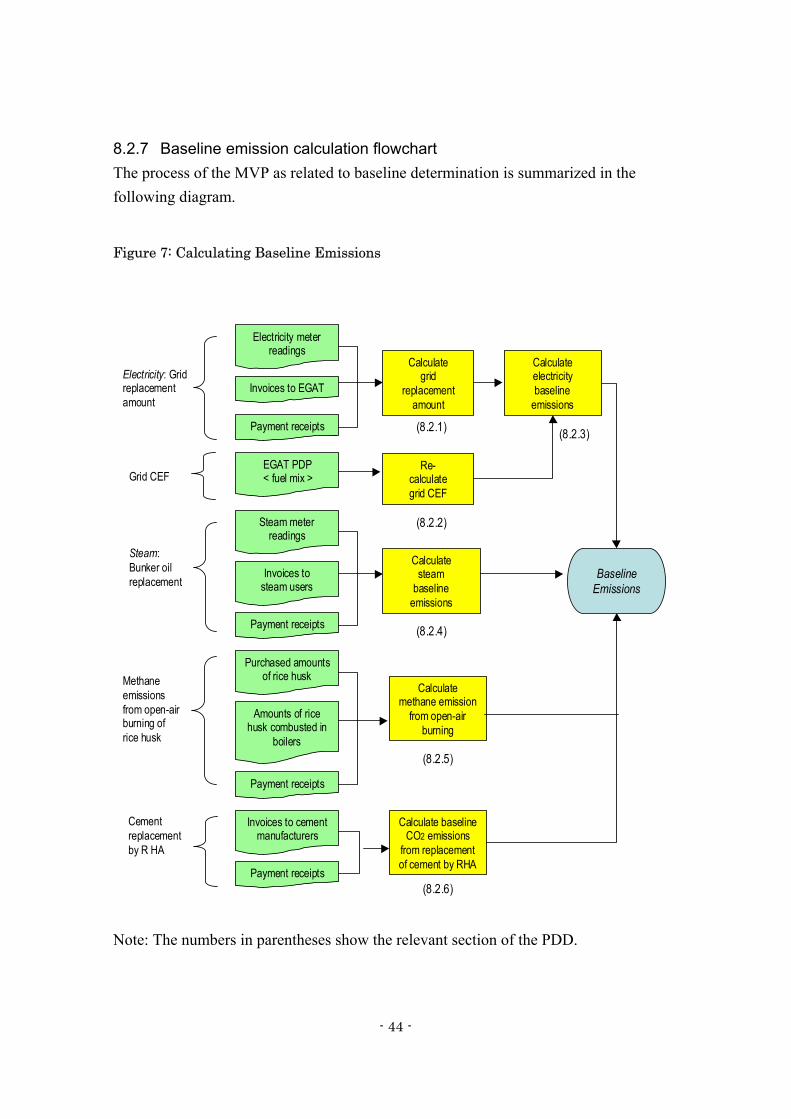
8.2.7 Baseline emission calculation flowchart The process of the MVP as related to baseline determination is summarized in the following diagram.
Figure 7: Calculating Baseline Emissions
Note: The numbers in parentheses show the relevant section of the PDD.
BaselineEmissions
Grid CEFEGAT PDP < fuel mix >
Re-calculategrid CEF
Electricity meterreadings
Invoices to EGAT
Payment receipts
Electricity: Gridreplacementamount
Calculategrid
replacementamount
Calculateelectricitybaseline
emissions
Methaneemissionsfrom open-airburning ofrice husk
Purchased amountsof rice husk
Amounts of ricehusk combusted in
boilers
Steam meterreadings
Invoices tosteam users
Steam:Bunker oilreplacement
Calculatesteam
baselineemissions
Invoices to cementmanufacturers
Payment receipts
Cementreplacementby R HA
Calculatemethane emission
from open-airburning
Calculate baselineCO2 emissions
from replacementof cement by RHA
Payment receipts
Payment receipts
(8.2.1)
(8.2.2)
(8.2.4)
(8.2.5)
(8.2.6)
(8.2.3)
- 45 -
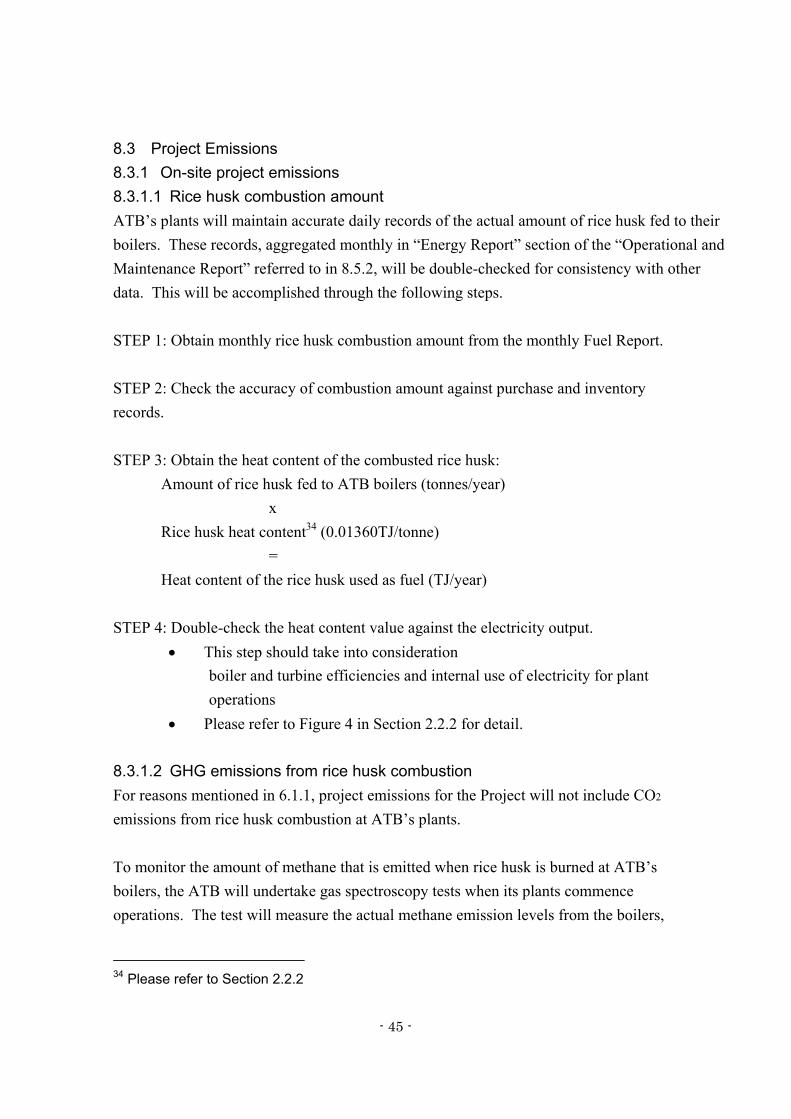
8.3 Project Emissions 8.3.1 On-site project emissions 8.3.1.1 Rice husk combustion amount ATB’s plants will maintain accurate daily records of the actual amount of rice husk fed to their boilers. These records, aggregated monthly in “Energy Report” section of the “Operational and Maintenance Report” referred to in 8.5.2, will be double-checked for consistency with other data. This will be accomplished through the following steps. STEP 1: Obtain monthly rice husk combustion amount from the monthly Fuel Report. STEP 2: Check the accuracy of combustion amount against purchase and inventory records. STEP 3: Obtain the heat content of the combusted rice husk: Amount of rice husk fed to ATB boilers (tonnes/year) x Rice husk heat content34 (0.01360TJ/tonne) = Heat content of the rice husk used as fuel (TJ/year) STEP 4: Double-check the heat content value against the electricity output.
• This step should take into consideration boiler and turbine efficiencies and internal use of electricity for plant operations
• Please refer to Figure 4 in Section 2.2.2 for detail. 8.3.1.2 GHG emissions from rice husk combustion For reasons mentioned in 6.1.1, project emissions for the Project will not include CO2 emissions from rice husk combustion at ATB’s plants. To monitor the amount of methane that is emitted when rice husk is burned at ATB’s boilers, the ATB will undertake gas spectroscopy tests when its plants commence operations. The test will measure the actual methane emission levels from the boilers,
34 Please refer to Section 2.2.2

- 46 -
which then will be compared to the IPCC default factor of 30kgCH4/TJ. For conservatism, the larger of the two will be used in the following calculation of methane emissions from rice husk combustion at ATB’s boilers. Methane emissions from ATB boilers =
Energy supplied by combusted rice husk (as obtained in STEP 3 in Section 8.3.1.1 above) (TJ/year) x Methane emission factor
(larger of the default factor or spectroscopic test results) (kgCH4/TJ) 8.3.1.3 Emissions from fossil fuel use for boilers The Project’s plan is a 100% biomass operation except for short start-up periods and special occasions during the rainy season. While the infrequent use of fuel oil is not expected to produce significant levels of GHG emissions, ATB will carefully monitor the quantities of fossil fuel used at its boilers and incorporate associated GHG emissions into project emissions. This process will be conducted through the following steps each month. STEP 1: Obtain monthly fossil fuel consumption data from monthly Fuel Report referred to in Section 8.5.2. STEP 2: Double-check the consumption data accuracy against purchase and inventory records. STEP 3: Calculate associated GHG emissions: Amount of fossil fuel consumed x 3.0 kgCO2/liter35
35 Bunker oil carbon emission factor derived in Section 5.3.4.

- 47 -
8.3.1.4 Emissions from rice husk transportation within plant site ATB will monitor the actual distances traveled by trucks and bulldozers transporting rice husk from the storage area to the plants’ boilers. This can be accomplished with relative ease, as the trucks and bulldozers will be used exclusively for ATB plants. When the actual distances traveled at the 5 plants are aggregated, the associated GHG emissions will be calculated by the following formulae. On-site transportation emissions (tCO2/year) = Aggregate distance traveled (km/year) x 1.097kgCO2/km36 x 1 tonne/1000kg 8.3.2 Off-site Project Emission 8.3.2.1 Emissions from rice husk transportation ATB’s payments to truckers transporting rice husk from rice mills to the plant sites are based on actual distances traveled. Accurate records will be kept on how much distance trucks have traveled to transport rice husk to ATB’s plants. Using the method described in Section 6.2.1, ATB will use actual transportation data to calculate CO2 emissions associated with the delivery of the power plants’ rice husk fuel. 8.3.2.2 Emissions from rice husk ash transportation Similarly, ATB’s payments to truckers transporting the rice husk ash, from the ATB plant sites to the purchasing cement manufacturers, are based on actual distances traveled. Accurate records will be kept on how much distance trucks have traveled to deliver rice husk ash to the cement manufacturers. Using the method described in Section 6.2.2, ATB will use actual transportation data to calculate the amount of CO2 emissions associated with the delivery of rice husk ash sold.
36 IPCC Guidelines p.1.75. Please see footnote 28 in Section 6.1.3
- 48 -
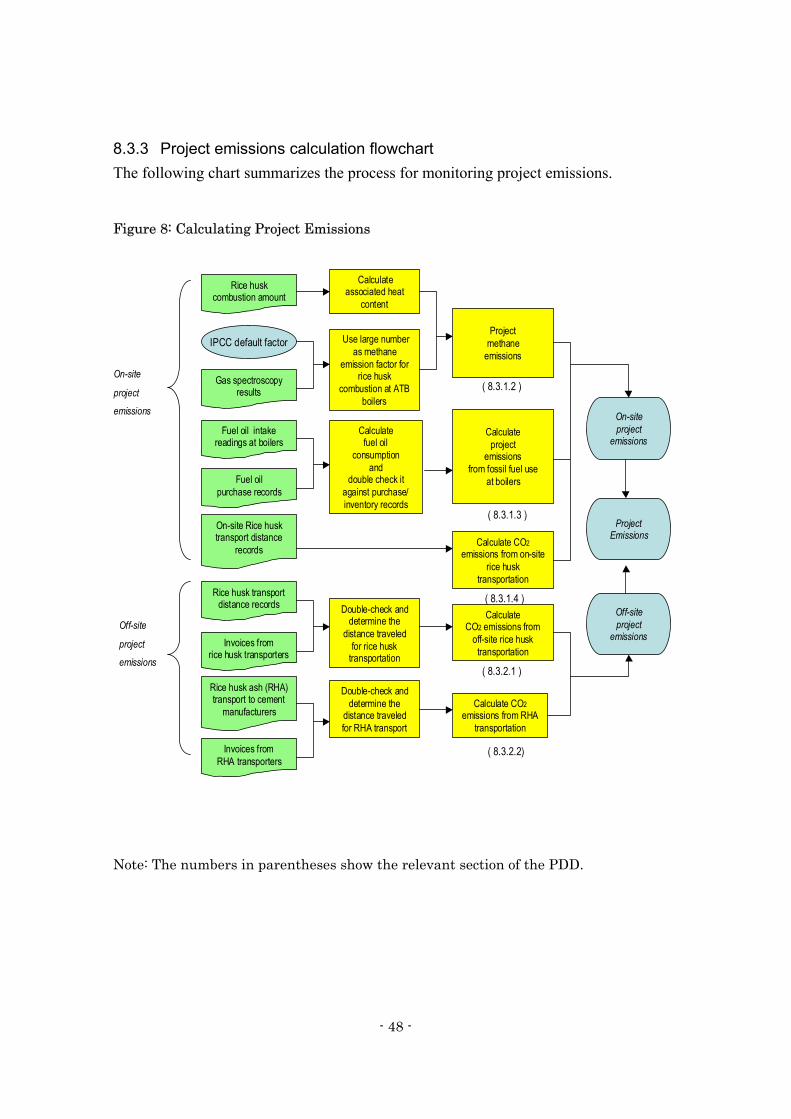
8.3.3 Project emissions calculation flowchart The following chart summarizes the process for monitoring project emissions.
Figure 8: Calculating Project Emissions
Note: The numbers in parentheses show the relevant section of the PDD.
Rice huskcombustion amount
Projectmethane
emissions
Calculateassociated heat
content
On-site
project
emissions
ProjectEmissions
Off-site
project
emissions
Double-check anddetermine the
distance traveledfor rice husk
transportation
CalculateCO2 emissions from
off-site rice husktransportation
Rice husk transportdistance records
Invoices fromrice husk transporters
On-site Rice husktransport distance
records
Rice husk ash (RHA)transport to cement
manufacturersCalculate CO2
emissions from RHAtransportation
Double-check anddetermine the
distance traveledfor RHA transport
Calculate CO2emissions from on-site
rice husktransportation
Fuel oil intakereadings at boilers
Fuel oilpurchase records
Calculatefuel oil
consumptionand
double check itagainst purchase/inventory records
Calculateproject
emissionsfrom fossil fuel use
at boilers
IPCC default factor
Gas spectroscopyresults
Use large numberas methane
emission factor forrice husk
combustion at ATBboilers
Invoices fromRHA transporters
On-siteproject
emissions
Off-siteproject
emissions
( 8.3.1.2 )
( 8.3.1.3 )
( 8.3.1.4 )
( 8.3.2.1 )
( 8.3.2.2)

- 49 -
8.4 CER Generation and Calculation On the basis of the data obtained in 8.2 and 8.3 above, CERs generated by the Project will be calculated each month. These figures, together with their supporting documents, will be kept in a specified file and presented for verification. ATB will also maintain records of sales of CERs and transaction agreements. The following chart summarizes the process for CER generation and transaction. Figure 9: CER Generation and Transaction
Projectemissions
Baselineemissions
CER recordsstorage
EIA complianceSocioeconomiccontribution
Plant operationand training
CER transaction
CalculateCERs
Verification ofCERs by an
independent thirdparty

- 50 -
8.5 Plant Operation and Training 8.5.1 Operation and maintenance logs Daily O&M logs will be maintained by each shift leader on a real time basis. They will provide detailed on-the-spot information about the operations at each of ATB’s plants. The O&M contractor will be instructed to immediately report to the ATB management, should an event of significance occur. 8.5.2 Operation and Maintenance Report This report will be developed by the O&M contractor each month and presented to ATB’s CEO and board of directors. The report will include the following topics:
• Summary • Accidents and malfunctions • Safety and environment • Plant performance and availability • Meter records • Fuel report • Personnel changes
Data relevant to the MVP will be selected and stored in MVP files. 8.5.3 Procedures for calibration of equipment EWE will be responsible for developing an “Equipment Calibration Procedures” booklet, which will delineate the frequency and detail of each equipment calibration. The O&M contractor will be responsible for ensuring that equipment calibration be carried out as specified. It is important to note that ATB will be required to install and maintain all electricity metering equipment and associated transformers conforming to specifications set by EGAT. This consists of primary watt-hour metering equipment and back-up watt-hour metering equipment. The metering equipment is to be sealed in the presence of both EGAT and ATB representatives. The seals can only be broken only in the presence of both EGAT and ATB representatives for inspection, testing, or calibration. 8.5.4 Staff training Under ATB’s general guidance, the O&M contractor will staff each power plant with Thai staff (including the Site Manager), contributing to technology transfer of this state-of-the-art combustion and power generation technology. Whenever possible,
- 51 -
preference will be given to recruiting suitably qualified staff from local communities. This will greatly enhance the well-being of the communities surrounding the power plant. ATB places particular emphasis on staff training, providing all staff members with basic training consisting of :
• Basic safety • Basic plant knowledge • Basic rice husk fuel fired technology • Environmental awareness • Supervisory training (where applicable)
In addition, classroom sessions will be held on job-specific subjects. This training will cover the following areas:
• Plant and steam cycle overview • Boiler design and operation • Turbine design and operation • Fuel handling equipment and operation • Ash handling equipment and operation • Water treatment and water chemistry • Power plant HV reticulation • Power plant control philosophy
The most important training will be on-the-job training. This will include:
• Start up • Shut down • Emergency Response
All the training will be supplemented by comprehensive Operations and Maintenance Manuals that will be supplied by EWE. Staff members will also be trained through work instructions for all key activities. These work instructions will be developed during the mobilization phase, the period of time running up to power plant commissioning and the start of operation. Please refer to Appendix E for detail.

- 52 -
8.6 Environmental Protection 8.6.1 Environmental Impact Assessment (EIA) compliance The Project’s EIA includes a detailed monitoring plan for environmental protection and EIA compliance. Please refer to Reference File I. 8.6.2 Semi-annual reports to OEPP As part of EIA compliance, ATB will submit to the OEPP regular semi-annual EIA reports, which will include the following:
• Results of continuous monitoring of air emission from the stack • Ambient air quality • Noise level at monitoring points in the neighborhood • Water quality at the holding pond • Occupational health and safety • Record of accidents
8.6.3 Environmental Protection Fund The MVP will monitor and maintain records of Environmental Protection Fund meetings, actions taken, and public participation proceedings. These records will be available for inspection. Performance Evaluation for:
Documentation Comments:
Environmental well-being & compliance
- Meeting minutes of Fund Committee meetings
Committee meetings will be held on a regularly scheduled basis, with details to be finalized at the start of construction.
Environmental well-being & compliance
- Independent 3rd
party assessments Technical expert assessments by an independent third party will support the Committee’s work in monitoring environmental impact.
Environmental well-being & compliance
- Fund’s bank statements
If local communities are compensated for environmental non-compliance, the Fund’s bank will record draw-downs from the Fund.
Community resident satisfaction
- Resident comment logs
Residents within the community will be encouraged to voice concerns with the local government, who will be responsible for bringing them to the Committee. The Committee will maintain a record of residents’ comments.

- 53 -
8.7 Socioeconomic Benefits and Public Participation From the beginning of the Project’s construction and throughout the Project’s life, ATB’s Social Contract with the local communities, where the power plants are to be located, will provide the mechanisms for continuous partnerships in social and economic development and environmental protection. Activities will be thoroughly documented. Economic Benefits Area Measured by Documentation Employment Number of
construction jobs: Unskilled, semi- Skilled, skilled Labour
EWE human resources data
Employment Number of operation jobs: Unskilled, semi- skilled, skilled labour
O&M contractor human resources data
Training and professional development
Descriptive O&M contractor training manuals, employee performance assessments, human resources data
Training and professional development
Descriptive O&M contractor training manuals, employee performance assessments, human resources data
Social Development Community Development and Environmental Fund Activity Description ATB Community Development Program annual summary
ATB’s Community Development Program will be the ‘umbrella’ program, which will map out long-term goals in all the areas it aims to develop, from education to local projects.
ATB Education & Scholarships Program annual summary
ATB, with local schools, aims to make significant contributions to education, with long-term sustainable development in mind. Curriculum designs, scholarship competitions, job skills programs will all be documented.

- 54 -
Local Project Development
With support from ATB, local communities will have a chance to conceive, design and execute their own projects, from new roads to upgrading irrigation systems. The Committee responsible for these projects, which will include representatives from ATB, will continuously document all stages of project development.
Other activities ATB’s Community Development Program is open to a multitude of activities and projects, conceived and developed by the communities themselves, all of which will be appropriately documented.
8.8 Monitoring and Verification Organization ATB will be responsible for the execution of the MVP. Based on the modern information technology it intends to use for control and reporting, ATB will collect and store relevant data in a systematic and reliable way, evaluate them regularly, generate reports, and ensure the availability of pertinent information for verification. To facilitate this task, ATB will require the O&M contractor to continuously transmit to it the operations data generated by the power plants’ operational monitoring system. Please see Appendix F for ATB’s organization chart for monitoring and verification activities. To ensure the quality of these activities, ATB will appoint Jackrit Watanatada, Assistant to CEO, as the executive to oversee the entire monitoring process. While Mr. Jackrit Watanatada will perform only a few monitoring functions directly and rely mostly on the work to be performed by the ATB and O&M contractor staff, he will have over-all responsibility for the accuracy and consistency of MVP implementation. 8.9 MVP Summary The following table summarizes the MVP.
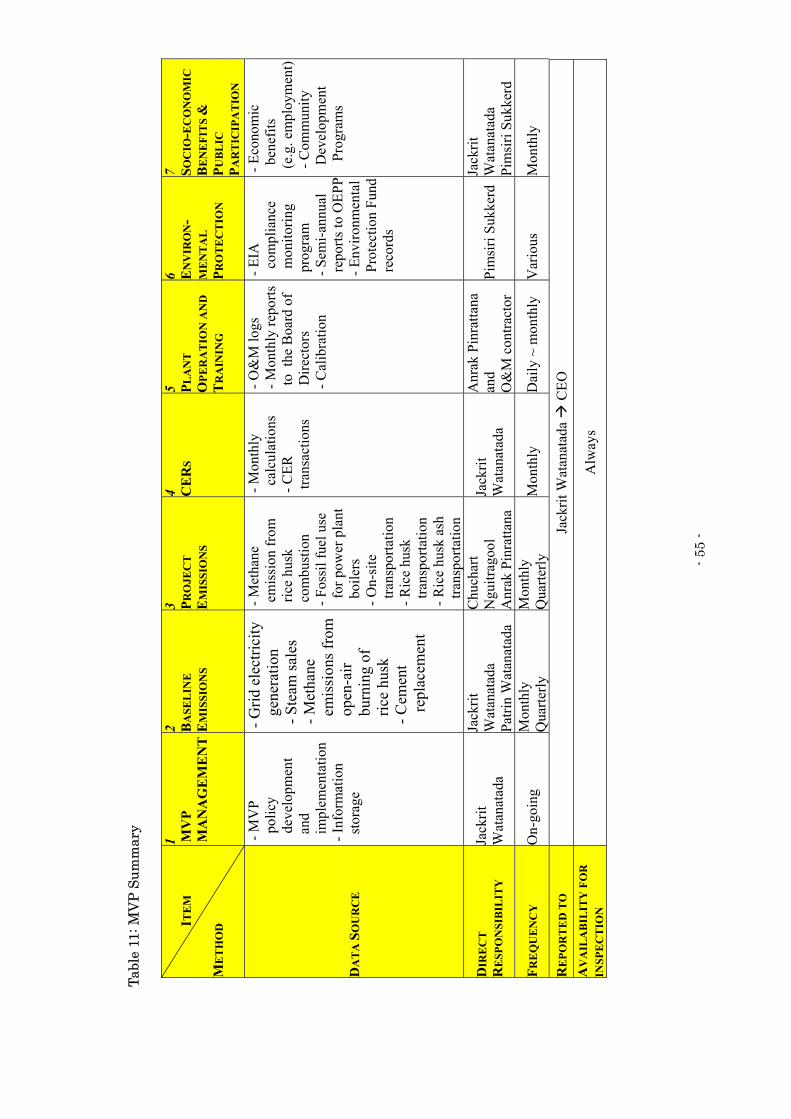
- 55
- Ta
ble
11: M
VP
Sum
mar
y
ITE
M
ME
TH
OD
1 MV
P M
AN
AG
EM
EN
T
2 BA
SEL
INE
E
MIS
SIO
NS
3 PRO
JEC
T
EM
ISSI
ON
S
4 CE
RS
5 PLA
NT
O
PER
AT
ION
AN
D
TR
AIN
ING
6 EN
VIR
ON
- M
EN
TA
L
PRO
TE
CT
ION
7 SOC
IO-E
CO
NO
MIC
B
EN
EFI
TS
&
PUB
LIC
PA
RT
ICIP
AT
ION
DA
TA
SO
UR
CE
- MV
P
pol
icy
d
evel
opm
ent
an
d
impl
emen
tatio
n -
Info
rmat
ion
stor
age
-G
rid e
lect
ricity
gen
erat
ion
- S
team
sale
s -
Met
hane
em
issi
ons f
rom
ope
n-ai
r
bur
ning
of
ri
ce h
usk
- C
emen
t
rep
lace
men
t
- M
etha
ne
em
issi
on fr
om
ric
e hu
sk
com
bust
ion
- Fo
ssil
fuel
use
for p
ower
pla
nt
bo
ilers
-
On-
site
trans
porta
tion
- R
ice
husk
tra
nspo
rtatio
n -
Ric
e hu
sk a
sh
tra
nspo
rtatio
n
- M
onth
ly
ca
lcul
atio
ns
- C
ER
tra
nsac
tions
- O
&M
logs
-
Mon
thly
repo
rts
to
the
Boa
rd o
f
Dire
ctor
s -
Cal
ibra
tion
- EI
A
co
mpl
ianc
e
m
onito
ring
p
rogr
am
- Se
mi-a
nnua
l r
epor
ts to
OEP
P -
Envi
ronm
enta
l P
rote
ctio
n Fu
nd r
ecor
ds
- Ec
onom
ic
be
nefit
s (
e.g.
em
ploy
men
t) -
Com
mun
ity
Dev
elop
men
t
Pro
gram
s
DIR
EC
T
RE
SPO
NSI
BIL
ITY
Ja
ckrit
W
atan
atad
a
Jack
rit
Wat
anat
ada
Patri
n W
atan
atad
a
Chu
char
t N
guitr
agoo
l A
nrak
Pin
ratta
na
Jack
rit
Wat
anat
ada
Anr
ak P
inra
ttana
an
d O
&M
con
tract
or
Pim
siri
Sukk
erd
Jack
rit
Wat
anat
ada
Pim
siri
Sukk
erd
FRE
QU
EN
CY
O
n-go
ing
Mon
thly
Q
uarte
rly
Mon
thly
Q
uarte
rly
Mon
thly
D
aily
~ m
onth
ly
Var
ious
M
onth
ly
RE
POR
TE
D T
O
Jack
rit W
atan
atad
a C
EO
AV
AIL
AB
ILIT
Y F
OR
IN
SPE
CT
ION
A
lway
s

- -
56
APPENDICES
A Annual Paddy and Husk Production in ATB’s Procurement Area 57
B Letter of Approval of the EIA
C Social Contract with Local Community 5
D Summary of Public Participation Meetings (Pichit Site) 62
E Detailed O&M Contractor Mobilization Activity Chart 67
F ATB Organization as Relevant to MVP 6

- -
57
Appendix A: Annual Paddy and Husk Production in ATB’s Procurement Area.
(Note) Some parts of large provinces included in the table, such as Kamphaeng Phet, Ratchaburi, Kanchanaburi and Petchabun, fall outside the ATB fuel supply area (within 100km from its plants). However, these provinces are also quite mountainous and it is the mountainous parts that fall outside the ATB fuel supply area, not the regions for rice growing and milling. Therefore, the paddy data for those provinces can be taken to represent ATB’s potential fuel supply.
1996 1997 1998 1999Whole Kingdom 22,015,481 22,331,638 23,580,080 23,607,542Nakhon Pathom 407,467 402,884 431,723 504,070Nakhon Sawan 839,923 1,002,609 1,043,495 1,118,469Pichit 750,621 843,081 1,056,038 1,120,248Singburi 296,716 337,558 348,164 301,053Supanburi 1,098,773 1,111,543 1,227,739 1,384,110Petchabun 517,748 504,850 469,986 463,390Uthai Thani 162,958 226,428 206,016 235,393Kamphaeng Phet 792,824 635,162 641,995 781,485Phitsanulok 695,004 833,686 1,025,424 1,035,947Lopburi 411,744 454,994 410,129 367,388Saraburi 191,610 190,412 181,765 178,689Chainat 954,868 827,530 878,719 710,379Nonthaburi 193,457 183,032 186,425 172,030Pathum Thani 341,142 381,498 365,495 389,535Ayutthaya 369,756 551,277 490,951 590,412Ang Thong 245,583 257,483 295,018 229,776Kanchanaburi 166,324 156,809 197,676 213,806Ratchaburi 237,292 234,212 246,414 305,391ATB Vicinity - Annual Paddy 8,673,810 9,135,048 9,703,172 10,101,571ATB Vicinity - Annual Husk (approx.) 1,994,976 2,101,061 2,231,730 2,323,361Source: Office of Agricultural Economics
Paddy weight x 0.23 = Approximate rice husk weight
Production (metric tons)
Annual Paddy Production Near ATB Sites

- -
58
Appendix B: Letter of Approval of the EIA To be submitted. (Now being translated into English.)

- -
59
Appendix C: Social Contract with Local Community ATB recognizes the importance of healthy relations with the local communities that surround its power plant sites. To achieve a peaceful coexistence and to become part of the community, ATB’s staff frequently visits the local communities, to introduce its project and talk to local government officials, villagers, schoolteachers, educators, and business leaders, and to give them the opportunity to ask a variety of questions, which may be of technical, economic, and environmental nature. ATB’s community relations goals are:
(a) To promote awareness of the ATB project’s environment and social benefits;
(b) To foster local understanding of renewable energy and energy conservation; and
(c) To make a positive contribution to the local community and society. ATB is committed to entering into a social contract with the tambon (subdistrict) where each of its power plants will be located, under which two types of community-based funds will be set up:
(a) Community Development and Environment Fund, which aims to foster the
welfare of the people in the tambon, as well as to protect and enhance the
environment of the area in general; and
(b) Environmental Protection Guarantee Fund, which aims to guarantee that ATB
will be responsible for possible damages caused by its power plants that may
occur to individuals, local communities, and the environment.
ATB has begun discussions on the social contract and the two funds with the leaders of the local communities where the power plants will be located. The aim is to conclude the social contract for each plant site in a few months following completion of the environmental impact assessments for the power plants in question. Community Development and Environment Fund. This fund sets aside a sum of 1 million baht during the construction phase and 1 million baht per year during the

- -
60
operation phase of each power plant. The construction phase starts when the project’s financial closure is achieved and ends when the power plant in question begins to operate. The funds are intended to support activities that contribute to the well-being of people in the local area such as programs that relate to physical and mental health, job skills improvement, education, sports, local customs, and religious festivities, as well as school programs that promote awareness of the need to keep the environment clean. To administer the Community Development and Environment Fund, an executive committee will be established, consisting of ATB representatives, village heads, members of the Tambon Administrative Organization (TAO), and government officials. According to the Fund’s policies, rules, and criteria to be spelled out, the committee will consider requests for support from proponents within the tambon, and make collective decisions on which requests will be granted, the conditions under which funding is granted, etc. The key criteria for activities or projects to be supported by the Fund are intended to include development and welfare impact, cost sharing, innovative solutions, and sustainability after the activity or project financed is completed. Environmental Protection Guarantee Fund. This fund earmarks a sum of 1 million baht during plant construction, and 5 million baht per year during plant operation to cover the following potential damages that may result from construction and operation of the power plant:
(a) Transportation of construction materials and rice husk into the power plant premises and
transportation of rice husk ash out of the premises: ATB will be responsible for damages, to
private or public properties that are caused by these activities. Provided that the damages
are clearly proven, ATB will pay the damaged party and cover expenses for the cleanup or
work required to restore these properties to their original condition.
(b) Stockpiling of rice husk and rice husk ash: ATB will be responsible for damages to private or
public properties caused by wind blowing rice husk or rice husk ash on to the properties.
Provided that the damages are clearly proven, ATB will pay the damaged party and cover

- -
61
expenses for the cleanup or work required to restore these properties to their original
condition.
(c) Particulate emissions from the stack: ATB will guarantee that the average rate of emissions
of particulates from the stack will not exceed 120 mg/”normal” cubic meter, or mg/Nm3 on
any day of plant operation. Should this limit be breached, ATB will transfer a sum of [5,000]
baht/day from its bank to the tambon’s Community Development and Environment Fund
bank account.
(d) Power plant wastewater: ATB has adopted a zero wastewater discharge design for its power
plants. Nonetheless, to provide the local community with further assurance, should it be
proven that ATB has indeed discharged power plant wastewater from its premises, and that
the wastewater has damaged local flora and fauna, ATB will be responsible for paying the
damaged party.
To administer the Environmental Protection Guarantee Fund, an executive committee will be established, consisting of ATB representatives, village heads, members of the TAO, and government officials. According to the Fund’s policies, rules, and criteria to be spelled out, the committee will consider claims for damages submitted to the tambon, make sure that the claims are legitimate, and make a collective decision whether to pay for the damages out of the Fund’s annual budget. The executive committee will also be responsible for making sure that potential environmental impacts caused by the power plant are monitored effectively and in an equitable manner.

App
endi
x D
: Su
mm
ary
of P
ublic
Par
ticip
atio
n M
eetin
gs (P
ichi
t Site
) Da
te
Even
t / M
eetin
g / A
ctivi
ty
Desc
riptio
n of
Eve
nt / M
eetin
g / A
ctivi
ty
Basis
, ana
lysis,
resu
lt Fu
rther
Co
mm
ents
- -
62
May
9, 2000
ATB
and C
lean T
echn
ology
(EIA
co
nsult
ing co
mpan
y) or
ganiz
ed a
meeti
ng at
Wat
Kai N
ao, H
orkra
i with
Na
i Amp
ur (D
istric
t Chie
f), m
embe
rs of
Horkr
ai’s T
ambo
n Adm
inistr
ative
Or
ganiz
ation
(TAO
), Ho
rkrai
Villa
ge
Head
s, an
d the
area
resid
ents
of Mu
1,
2, an
d 4
The
purp
ose
was
to
in
trod
uce
ATB
pro
ject
, its
mis
sion
and
sco
pe o
f w
ork
in g
ener
al to
Hor
krai
res
iden
ts
and
auth
oriti
es.
The
envi
ronm
enta
l ex
pert
s, e
ngin
eers
, an
d AT
B s
taff
mem
bers
wer
e on
han
d to
exp
lain
an
d an
swer
ed
ques
tions
to
th
e au
dien
ce
rega
rdin
g en
viro
nmen
tal
issu
es a
nd w
hate
ver
conc
erns
the
y m
ay h
ave.
At th
e end
of th
e mee
ting,
audie
nce a
gree
d to
acce
pt AT
B’s p
ropo
sal to
build
a ric
e hu
sk fu
elled
powe
r plan
t ther
e. It
was
noted
that
ATB
must
strict
ly fol
lowed
the
envir
onme
nt gu
idelin
es as
prop
osed
in th
e me
eting
so as
not to
caus
e any
poll
ution
pr
oblem
s to t
he co
mmun
ity.
June
, 20
00
Meeti
ngs w
ith H
orkra
i land
-own
ers
wher
e ATB
plan
t site
is to
be lo
cated
To
furth
er ne
gotia
te an
d wra
p up l
and s
ales
agre
emen
ts.
Land
sales
agre
emen
ts sig
ned a
nd
depo
sits m
ade t
o the
land
owne
rs.
July,
20
00
ATB
staff p
aid a
visit t
o Kam
nan
(Sub
-Dist
rict H
ead)
of T
ambo
n Ho
rkrai
Met w
ith K
amna
n and
later
joine
d by a
co
uple
of vil
lage h
eads
to ta
lk ab
out A
TB
powe
r plan
t, foll
owed
by Q
&A
perio
d.
Very
few pe
ople
had h
eard
of ric
e hus
k fue
lled p
ower
plan
t and
had t
he fe
eling
that
all po
wer p
lants
are t
he sa
me re
gard
less o
f fue
l use
d.
Aug,
2000
Vi
siting
Hor
krai v
illage
s to m
eet w
ith
villag
e hea
ds an
d are
a res
idents
Sm
all gr
oup m
eetin
gs w
ere o
rgan
ized i
n or
der t
o disc
uss t
he pr
oject
in de
tail w
ith
vario
us gr
oups
of pe
ople.
Pro
ject
infor
matio
n and
relat
ed m
ateria
ls we
re
hand
ed ou
t.
Area
resid
ents
bega
n to l
earn
mor
e abo
ut pr
oject
bit by
bit a
lthou
gh th
ere’r
e still
so
me co
ncer
ned i
ndivi
duals
voici
ng th
eir
opini
ons n
ow a
nd th
en.
Oct,
2000
AT
B re
pres
entat
ives m
ade r
egula
r co
ntacts
with
Hor
krai re
siden
ts AT
B trie
d to r
each
the c
ore l
eade
rs tha
t we
re ab
sent
in ea
rlier m
eetin
gs, o
r mad
e re
peate
d visi
ts to
those
who
still
had d
oubts
ab
out th
e pro
ject.
One o
n one
or ve
ry sm
all gr
oup m
eetin
g pr
ovide
d opp
ortun
ities t
o disc
uss a
ny
conc
erns
or w
orrie
s eve
ry on
e migh
t hav
e ha
d.

App
endi
x D
: Su
mm
ary
of P
ublic
Par
ticip
atio
n M
eetin
gs (P
ichi
t Site
) Da
te
Even
t / M
eetin
g / A
ctivi
ty
Desc
riptio
n of
Eve
nt / M
eetin
g / A
ctivi
ty
Basis
, ana
lysis,
resu
lt Fu
rther
Co
mm
ents
- -
63
Nov 6
, 20
00
Meeti
ng w
ith K
amna
n (Su
b-Di
strict
He
ad of
Tam
bon)
and 2
nd m
eetin
g wi
th me
mber
s of H
orka
i’s T
ambo
n Ad
minis
trativ
e Org
aniza
tion (
TAO)
Intro
duce
d com
pany
, gav
e pro
ject’s
detai
ls,
answ
ered
ques
tions
, pro
vided
un
derst
andin
g abo
ut the
proje
ct to
TAO
memb
ers a
t their
mon
thly m
eetin
g.
Befor
e mee
ting,
locals
wer
e wor
ried a
bout
pollu
tion.
After
the m
eetin
g, the
villa
gers
felt m
uch b
etter
that
the pr
oject
will n
ot be
po
llutin
g, an
d tha
t the c
ommu
nity w
ill be
nefit
from
the pr
oject.
Dec
15,
2000
Meeti
ng w
ith H
orkra
i’s T
ambo
n Ad
minis
trativ
e Org
aniza
tion (
TAO)
Di
splay
ed in
forma
tion w
ith ex
hibitio
n bo
ards
, dist
ribute
d pro
ject d
ocum
entat
ion to
TA
O
TAO
has a
deep
er un
derst
andin
g of th
e pr
oject
conc
ept a
nd va
rious
detai
ls.
Jan
13,
2001
- Jo
ined C
hildr
en’s
Day
activ
ities a
t Bam
rung
raj
Witta
yakh
om
- Ma
de do
natio
ns to
Klon
g Ka
i Nao
Tem
ple
Child
ren’s
day a
ctivit
ies in
clude
d org
anizi
ng
stage
actin
g, ga
mes,
give a
way g
ifts, a
nd
book
s, sp
onso
red l
unch
.
Intro
duce
d pro
ject to
grou
ps of
teac
hers,
stu
dents
and p
aren
ts
Feb
19,
2001
Invite
d TAO
to se
e ren
ewab
le en
ergy
an
d clea
n tec
hnolo
gy in
use a
t Ind
oram
a fac
ility i
n Sar
abur
i
Met T
AO of
ficial
s to s
elect
repr
esen
tative
s to
visit I
ndor
ama.
Outlin
ed ob
jectiv
es of
visit
ing In
dora
ma,
and i
n par
ticula
r, its
simi
laritie
s with
clea
n tec
hnolo
gy to
be us
ed in
ATB
plan
ts.
Mar 5
, 20
01
Stud
y trip
to In
dora
ma
ATB
comm
unity
relat
ions s
taff a
nd
engin
eers
took H
orkra
i TAO
repr
esen
tative
s to
see c
lean t
echn
ology
at In
dora
ma pl
ant in
Am
pur K
angk
oi, S
arab
uri. T
he pl
ant
gene
rates
elec
tricity
using
a mi
xture
of
corn
cobs
and r
ice hu
sk as
fuel.
The
main
ob
jectiv
e for
this
study
trip
is to
unde
rstan
d em
ission
s con
trol te
chno
logy,
and t
o see
tha
t flue
gas p
asse
s thr
ough
the E
lectro
-sta
tic P
recip
itator
(ESP
), sim
ilar t
o wha
t will
Grou
p lea
ders
and v
illage
rs no
ted
Indor
ama’s
effic
ient te
chno
logy,
gree
n en
viron
ment,
and l
ow le
vels
of am
bient
noise
.
Incre
ased
co
nfide
nce i
n the
AT
B pr
oject.

App
endi
x D
: Su
mm
ary
of P
ublic
Par
ticip
atio
n M
eetin
gs (P
ichi
t Site
) Da
te
Even
t / M
eetin
g / A
ctivi
ty
Desc
riptio
n of
Eve
nt / M
eetin
g / A
ctivi
ty
Basis
, ana
lysis,
resu
lt Fu
rther
Co
mm
ents
- -
64
be us
ed in
ATB
plan
ts.
April
5, 2001
Met w
ith T
AO an
d villa
gers
to fol
low
up th
eir re
actio
ns af
ter vi
siting
the
Indor
ama p
lant.
ATB
staff i
ntervi
ewed
villa
gers,
surve
ying
opini
ons o
f the I
ndor
ama p
lant.
Most
villag
ers w
ere s
atisfi
ed w
ith th
eir vi
sit
to the
Indo
rama
plan
t, and
appr
eciat
ed its
sim
ilariti
es w
ith A
TB pl
ants.
April
9, 2001
Appo
inted
mee
ting w
ith vi
llage
rs Mo
o 7 a
nd 8.
Me
eting
with
villa
gers.
Intro
duce
d pro
ject to
vil
lager
s, so
licite
d the
area
s’ ge
nera
l pub
lic
opini
on.
The v
illage
rs we
re w
orrie
d abo
ut po
llutio
n an
d tha
t ATB
migh
t not
keep
its pr
omise
s on
pollu
tion i
ssue
s. Ex
plaini
ng th
at va
rious
co
ntrac
ts, in
cludin
g a so
cial c
ontra
ct, w
ould
mitig
ate ag
ainst
pollu
tion a
nd gu
aran
tee
ATB’
s pro
mise
s.
April
10,
2001
Meeti
ng w
ith vi
llage
rs Mo
o 3 an
d 5.
Meeti
ng w
ith vi
llage
rs. In
trodu
ced p
rojec
t to
villag
ers,
solic
ited t
he ar
eas’
gene
ral p
ublic
op
inion
.
More
envir
onme
ntal is
sues
, in pa
rticula
r, if
they w
ould
be al
lowed
to in
spec
t the A
TB
plant.
Villa
gers
unde
rstoo
d tha
t und
er
ATB’
s con
tract
with
the T
AO, th
ey w
ould
alway
s be a
llowe
d to i
nspe
ct the
ATB
plan
t.
April
14,
2001
Joine
d Son
gkar
n fes
tival
at Mo
o 5,
Tamb
on H
orka
i Jo
ined t
he fe
stiva
l set
up by
the v
illage
, do
nated
gifts
for r
affle
draw
. The
pres
ident
of TA
O (M
r. Ch
atcha
i Jea
rmsri
) was
also
pr
esen
t.
Mr. C
hatch
ai ga
ve a
posit
ive sp
eech
abou
t the
ATB
proje
ct. In
his s
peec
h, he
inc
reas
ed co
nfide
nce t
hat th
e pro
ject w
ill no
t be p
olluti
ng, b
y noti
ng th
at AT
B wo
uld
need
to ha
ve an
appr
oved
EIA
.
April
18,
2001
Meeti
ng w
ith vi
llage
rs Mo
o 6
Meeti
ng w
ith vi
llage
rs. In
trodu
ced p
rojec
t to
villag
ers,
solic
ited t
he ar
eas’
gene
ral p
ublic
op
inion
.
Villa
gers
were
wor
ried a
bout
dust
and
emiss
ions.
ATB
engin
eers
expla
ined t
he
mitig
ation
mea
sure
s, su
ch as
nettin
g and
tre
es ar
ound
the s
torag
e yar
d. Mo
st we
re

App
endi
x D
: Su
mm
ary
of P
ublic
Par
ticip
atio
n M
eetin
gs (P
ichi
t Site
) Da
te
Even
t / M
eetin
g / A
ctivi
ty
Desc
riptio
n of
Eve
nt / M
eetin
g / A
ctivi
ty
Basis
, ana
lysis,
resu
lt Fu
rther
Co
mm
ents
- -
65
satis
fied w
ith w
hat th
ey ha
d lea
rned
.
April
19,
2001
Meeti
ng w
ith vi
llage
rs Mo
o 1,2,
4 Me
eting
with
villa
gers.
Intro
duce
d pro
ject to
vil
lager
s, so
licite
d the
area
s’ ge
nera
l pub
lic
opini
on.
Villa
gers
were
wor
ried a
bout
gene
ral
pollu
tion p
roble
ms; A
TB st
aff an
d eng
ineer
s ex
plaine
d mitig
ation
mea
sure
s. Th
ey w
ere
also w
orrie
d tha
t the p
lant m
ight in
terfer
e wi
th pu
blic w
aterw
ays a
nd lo
cal ir
rigati
on.
ATB
staff d
isplay
ed th
e pow
er pl
ant m
odel,
an
d also
remi
nded
them
of de
tails
in AT
B’s
socia
l con
tract
that w
ould
prote
ct the
loca
l co
mmun
ities.
May
14,
2001
Joine
d in a
ctivit
ies at
Tam
bon
Horkr
ai’s S
ports
Day
. AT
B co
-spon
sore
d the
day’s
activ
ities,
staff
joine
d in g
ames
.
Stre
ngthe
n gen
eral
relat
ions w
ith A
TB
staff.
June
21
, 20
01
Joine
d 2nd
mee
ting w
ith vi
llage
rs Mo
o 1,2,
4, inc
luding
the D
irecto
r of
Educ
ation
for M
oo 4.
ATB
anno
unce
d tha
t rep
rese
ntativ
es fr
om
villag
es an
d sch
ools
would
be in
vited
to vi
sit
Indor
ama p
lant. D
iscus
sions
on gi
ving
finan
cial s
uppo
rt for
scho
ols’ m
ateria
ls.
The m
eetin
g atte
ndee
s inte
reste
d in j
oining
the
visit
to In
dora
ma. S
choo
ls ac
cepte
d fin
ancia
l sup
port
from
comp
any f
or sc
hool
unifo
rms,
mater
ials,
book
s, sp
ortin
g eq
uipme
nt, et
c.
July
9, 20
01
Meeti
ng w
ith T
AO H
okra
i to di
scus
s the
Soc
ial C
ontra
ct.
Infor
med T
AO to
elec
t rep
rese
ntativ
es to
joi
n com
mitte
es re
spon
sible
for
Envir
onme
ntal G
uara
ntee F
und a
nd S
ocial
De
velop
ment
Fund
.
TAO
ackn
owled
ged.
TAO
unde
rstoo
d tha
t A.T
. Biop
ower
is
serio
us ab
out
back
ing its
int
entio
ns w
ith le
gal
contr
acts
and f
unds
for
the
comm
unitie
s’

App
endi
x D
: Su
mm
ary
of P
ublic
Par
ticip
atio
n M
eetin
gs (P
ichi
t Site
) Da
te
Even
t / M
eetin
g / A
ctivi
ty
Desc
riptio
n of
Eve
nt / M
eetin
g / A
ctivi
ty
Basis
, ana
lysis,
resu
lt Fu
rther
Co
mm
ents
- -
66
bene
fit.
Oct 2
, 20
01
Imple
mente
d pro
gram
to do
nate
book
s, un
iform
s and
scho
ol ma
terial
s to
scho
ols in
Bam
rung
raj
Witta
yako
rm, W
at Ho
rkai, K
longK
are
and W
at Pr
ugsa
wara
ram
scho
ols
ATB
learn
ed of
a sh
ortag
e of m
ateria
ls in
the ar
ea’s
scho
ols, a
nd w
anted
to su
ppor
t loc
al ed
ucati
on w
ith do
natio
ns. B
ooks
and
mater
ials c
once
rning
socia
l dev
elopm
ent,
envir
onme
ntal re
spon
sibilit
y and
ener
gy
cons
erva
tion w
ere i
nclud
ed as
well
.
Nov 5
, 20
01
Meeti
ng w
ith T
AO to
disc
uss S
ocial
Co
ntrac
t. Me
eting
with
TAO
, hea
d of v
illage
rs (a
bout
50 pe
rsons
) to d
iscus
s the
proc
ess o
f dr
afting
the c
ontra
ct.
Over
5 ho
urs,
ATB
and l
ocal
leade
rs dis
cuss
ed th
e two
fund
s; En
viron
ment
Prote
ction
Fun
d, an
d Soc
ial D
evelo
pmen
t Fu
nd.
Most
villag
ers f
elt
posit
ive to
ward
s the
pr
oject,
and w
illing
to
have
plan
t in
their a
rea.
Dec 7
, 20
01
New
Year
gift-
giving
with
Hok
rai
leade
rs.
ATB
pres
ented
New
Yea
r gifts
to H
orkra
i Le
ader
s (TA
O, H
ead o
f Tam
bon,
Villa
ge
Head
s)
Jan
10,
2002
Gave
gifts
and b
ooks
to st
uden
ts on
Ch
ildre
n’s D
ay at
4 sc
hools
in H
orkra
i ar
ea.
ATB
orga
nized
a Ch
ildre
n’s D
ay ev
ent,
invitin
g Bam
rung
raj W
ittaya
korm
, Wat
Horka
i, Klon
gKar
e and
Wat
Prug
sawa
rara
m sc
hools
, with
lunc
h and
activ
ities.
April
5, 2002
Song
kran g
ift-giv
ing w
ith H
okra
i lea
ders.
AT
B pr
esen
ted gi
fts to
loca
l lead
ers a
t So
ngka
rn fe
stiva
l. Lea
ders
includ
ed
memb
ers o
f TAO
, Hea
d of T
ambo
n, loc
al do
ctors
and n
urse
s.

App
endi
x E
: Det
aile
d O
&M
Ope
rato
r M
obili
zatio
n A
ctiv
ity C
hart
TAS
K
34
56
78
910
1112
1314
1516
1718
1920
2122
1D
evel
op F
acili
ty P
olic
ies
and
P
roce
dure
sx
xx
xx
1aS
afet
y an
d E
mer
g R
espo
nse
x
1bIn
vent
ory
Sto
rage
and
Mon
itorin
g P
roce
dure
sx
1cC
hem
Han
dlin
g an
d D
ispo
sal
Pro
cedu
res
x
1dA
dmin
istra
tive
Pro
cedu
res
x
1eIn
cide
nt R
epor
ting
and
Man
agem
ent
Pro
cedu
res
x
1fLo
ckou
t/Tag
out P
roce
dure
sx
1gS
ecur
ity P
roce
dure
sx
1hP
erfo
rman
ce M
onito
ring
and
Rep
ortin
g P
roce
dure
sx
1iP
lann
ing
Mai
nten
ance
Sch
edul
es
1jFi
rst A
id P
roce
dure
sx
1kFi
re F
ight
ing
x
1lE
nviro
nmen
tal M
onito
ring
and
Rep
ortin
gx
1mN
atur
al D
isas
ter P
roce
dure
sx
2Li
st o
f equ
ipm
ent,
mat
eria
ls, a
nd
supp
lies
requ
ired
for O
p/M
aint
x
3P
rocu
re in
itial
inve
ntor
y of
spa
re p
arts
xx
x
4O
pera
tor T
rain
ing
by O
pera
ting
Com
pany
x
x
5O
pera
tor T
rain
ing
by C
onst
ruct
ion
Con
tract
or
xx
xx
6S
tartu
p/P
erfo
rman
ce T
ests
and
C
omm
issi
onin
gx
xx
x
7M
onito
ring
Per
form
ance
Tes
ting
xx
8P
repa
ratio
n of
Pun
ch L
ist I
tem
sx
xx
x
9R
evie
w a
nd c
omm
ent o
n dr
aft
Ope
ratio
nal M
anua
lsx
x
10A
dmin
iste
r O&
M re
late
d co
ntra
cts
xx
xx
xx
x
11P
rocu
rem
ent a
nd In
stal
latio
n of
Mai
nt
Man
agem
ent s
yste
mx
xx
x Com
mis
sion
ing
CO
D
MO
NTH

68
App
endi
x F:
AT
B O
rgan
izat
ion
as R
elev
ant t
o M
VP
EGAT
SPP
Pur
chas
ing D
ept.
Indus
trial S
team
User
Mr. J
ackri
t Wata
natad
aAs
sistan
t to C
EO
EGAT
Eco
nomi
c Poli
cy &
Plan
ning D
ept.
Ms. P
atrin
Wata
natad
aAs
sistan
t to C
EO
O&M
Oper
ator
Mr. A
nura
k Pinr
attan
aEn
ginee
ring M
anag
er
Rice
Hus
k Tra
nspo
rter 1
Rice
Hus
k Tra
nspo
rter 2
Mr. C
huch
art N
guitra
gool
Gene
ral M
anag
er
Tam
bon L
ocal
Gove
rnme
nt
Comm
unity
Dev
elopm
ent &
Env
ironm
ental
Fun
d Com
mit
Envir
onme
ntal P
rotec
tion F
und
Ms. P
imsir
i Suk
kerd
Publi
c Affa
irs M
anag
er
Dr. T
hawa
t Wata
natad
aCh
ief E
xecu
tive O
fficer

69