project healthy schools research overvie · project healthy schools research overview as of fall...
TRANSCRIPT

ProjectHealthySchoolsResearchOverview
AsofFall2015

PHSEnrollment
0
10
20
30
40
50
60
70
0
1000
2000
3000
4000
5000
6000
7000
8000
9000
10000
2004 2005 2006 2007 2008 2009 2010 2011 2012 2013 2014 2015
#ofSchoo
ls
#ofStude
nts
NumberofStudentsandSchoolsBenefi6ngfromPHSCurriculumbyYear
#ofStudents
#ofSchools
41,000studentstodate

PHSEnrollment
0
10
20
30
40
50
60
70
0
5000
10000
15000
20000
25000
30000
35000
2004 2005 2006 2007 2008 2009 2010 2011 2012 2013 2014 2015
#ofSchoo
ls
#ofStude
nts
NumberofStudentsandSchoolsBenefi6ngfromPHSEnvironmentalProgramsbyYear
#ofStudents
#ofSchools
33,000studentsthisyearalone

41,000studentsfrom68schoolhavebenefiKedfromPHS
• ClagueMiddleSchool• ForsytheMiddleSchool• SlausonMiddleSchool• ScarleKMiddleSchool• TappanMiddleSchool• AnnArborOpenSchool• YpsilanRCommunityMiddleSchool• CorunnaMiddleSchool• OwossoMiddleSchool• St.PaulCatholicSchool• Ovid-ElsieMiddleSchool• PerryMiddleSchool• LaingsburgMiddleSchool• UniversityPreparatoryAcademy• UniversityPreparatoryScienceandMath• WillowRunIntermediateLearningCenter• HenryFordAcademy• DetroitLeadershipAcademy
• RoyalOakMiddleSchool• LincolnMiddleSchool• TyroneElementarySchool• DetroitInternaRonalAcademy• GrandBlancEastMiddleSchool• GrandBlancWestMiddleSchool• InternaRonalPreparatoryAcademy• PierceMiddleSchool-GrossePoint• MarshallMiddleSchool• SchulzeElementary-MiddleSchool• ChesaningMiddleSchool• MorriceMiddleSchool• ByronMiddleSchool• DurandMiddleSchool• TLHandyMiddleSchool• BryantMiddleSchool• BriKon-DeerfieldMiddleSchool• NobleElementarySchool
• Carman-AinsworthMiddleSchool• RomulusMiddleSchool• SummitAcademyNorth• LarsonMiddleSchool• MasonMiddleSchool• YpsilanRCommunityMiddleSchool• StThomastheApostleCatholicSchool• AllendaleMiddleSchool• ColumbiaMiddleSchool• Delton-KelloggMiddleSchool• DixonEducaRonalLearningAcademy• JohnsonUpperElementarySchool• PierceMiddleSchool-Waterford• SwartzCreekMiddleSchool• WhitePineMiddleSchool• ClarencevilleMiddleSchool• FatherMarqueKeMiddleSchool• ManisRqueMiddleSchool• MichiganTechnicalAcademy• VistaCharterAcademy
• EstabrookElementarySchool• WashtenawInt’lMiddleAcademy• PowellMiddleSchool• EFRiKmuellerMiddleSchool• St.MaryCatholicSchool• IshpemingMiddleSchool
• NewberryMiddleSchool• KalkaskaMiddleSchool• NewBranchesCharterAcademy• PiKsfordMiddleSchool• TuckerMiddleSchool• St.JohnVianneyMiddleSchool
12moreschoolshavebeenaddedthisyear!

PHSSchoolLocaRons2005-2015

ResearchComponent• AsofSpring2015:o 15,685studentshavecompletedabaselineandatleastonefollow-upHealthBehaviorQuesRonnaire(HBQ)
o 2,970studentshaveparRcipatedinawellnessscreening
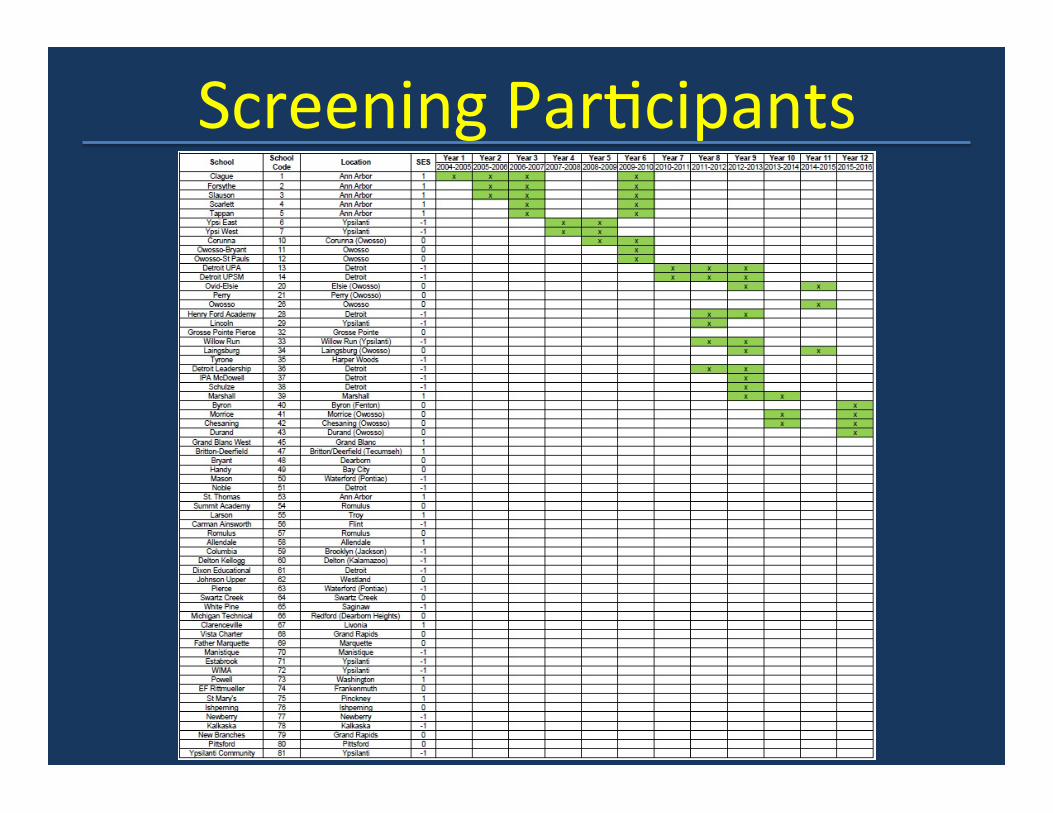
ScreeningParRcipants

HBQParRcipants

PublicaRonstoDate• 14publishedmanuscripts
o AmericanJournalofPubicHealtho AmericanJournalofMedicineo PediatricCardiologyo Pediatricso WorldMedicalandHealthPolicyo ChildhoodObesityo AmericanHeartJournalo PublicHealtho ClinicalEpidemiologyo AgroFoodIndustryHighTechJournalo (AmericanJournalofPublicHealth)
• 1moremanuscripthasbeenacceptedforpublicaRonandiscurrentlyinproducRon

PresentaRonstoDate• 47abstractspresentedatnaRonalconferences
o NaRonalPrevenRonSummito NaRonalObesityForumo ObesitySocietyo AmericanPublicHealthAssociaRono AmericanDieteRcAssociaRono MichiganMetabolomicandObesityCentero ArtandScienceofHealthPromoRono SocietyofPublicHealthEducaRono ConferenceonAdolescentHealtho AmericanSchoolHealthAssociaRono AmericanCollegeofCardiologyScienRficSessionso NaRonalIniRaRveforChildren’sHealthCareQualityo AmericanHeartAssociaRon:QualityofCareandOutcomesResearcho AmericanHeartAssociaRonScienRficSessionso AmericanDieteRcAssociaRon:FoodandNutriRonConferenceandExposiRono MichiganInsRtuteforClinicalandHealthResearcho AmericanHeartAssociaRon:EpidemiologyandPrevenRon,NutriRon,PhysicalAcRvityandMetabolismo WeightoftheNaRon:CDC’sConferenceonObesityPrevenRonandControl

ProjectHealthySchoolsResearchSummary
2005–2015“PHS:10Yearsin10Minutes”
Presentedby:EvaKline-RogersMS,RNonbehalfofPHS

10YearsofPHS:WhatHaveWeLearned?
• 5Goals• BehavioralChanges:screenRme,sports,food/drinkchoices
• PhysiologicChanges:lipids,glucose,BMI,HR,BP• InfluenceofEconomics:HouseholdIncomeandPHS
• DifferencesbyGenderandRace• ParentalInfluence

5Goals

PrevalenceofHighHealth-HabitAchieversAmongMiddleSchoolChildrenandAssociatedMeasuresof
CardiovascularHealth
• StudyObjecBve:Reporttheprevalenceof“highhealth-habitachievers”(HHHA)andcomparecardiovascularhealthparametersbetweenHHHAandtheirpeers.
HHHA Criteria
Screen Time ≤ 2 Hours / Day
Exercise ≥ 5 Sessions of Moderate (30 min) and/or Vigorous (20 min) Activity / Week
Unhealthy Beverages ≤ 1 High Sugar Beverage / Day
Fried, Fatty and Sweet Foods ≤ 1 Fried, Fatty, or Sweet Food / Day
Fruits and Vegetables ≥ 5 Servings / Day
Mustmeet4of5HHHACriteria
AHAQCOR2013 AshleyStasiak

Other2687 (67%)
3/5 Goals897 (23%)
HHHA4/5 Goals415 (10%)
HHHA1312 (33%)
Baseline Percentage of PHS Students Achieving at Least 3/5 Goals vs. Students Who Did Not Achieve These Goals
PrevalenceofHighHealth-HabitAchieversAmongMiddleSchoolChildrenandAssociatedMeasuresof
CardiovascularHealth
AHAQCOR2013 AshleyStasiak
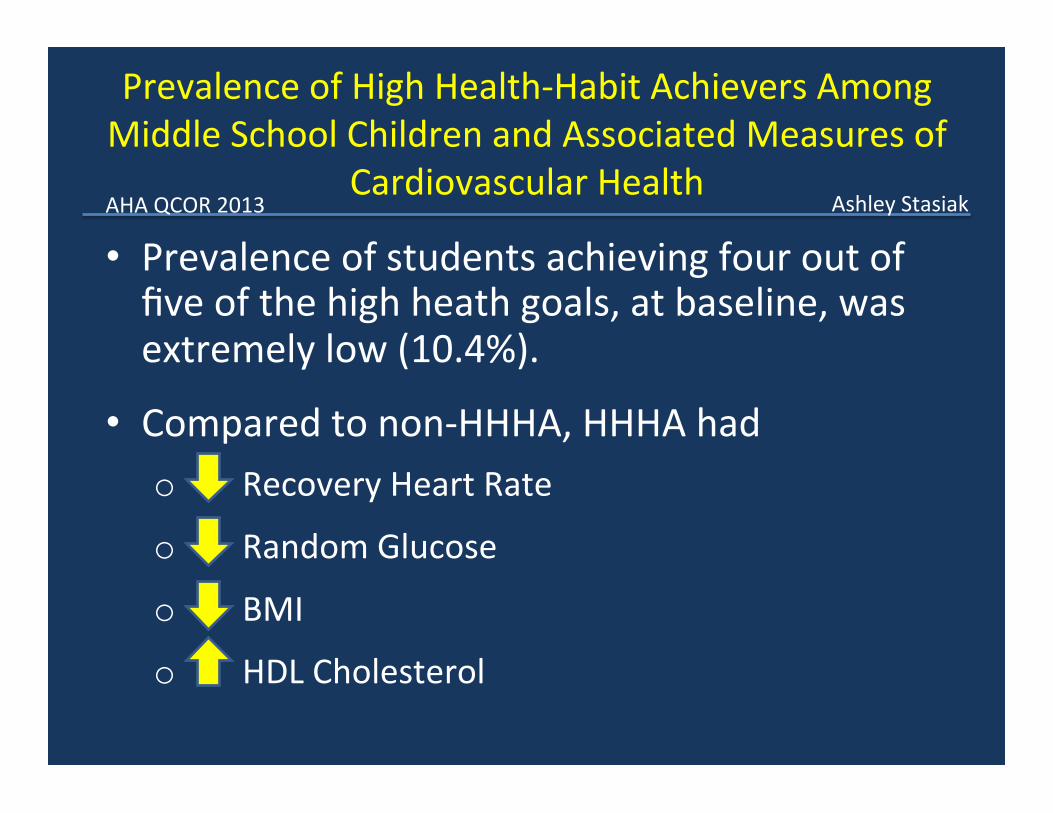
• Prevalenceofstudentsachievingfouroutoffiveofthehighheathgoals,atbaseline,wasextremelylow(10.4%).
• Comparedtonon-HHHA,HHHAhado RecoveryHeartRateo RandomGlucose
o BMI
o HDLCholesterol
PrevalenceofHighHealth-HabitAchieversAmongMiddleSchoolChildrenandAssociatedMeasuresof
CardiovascularHealth
AHAQCOR2013 AshleyStasiak

BehavioralFactorsasPredictorsofPoorCardiovascularHealthinMiddle-SchoolStudents
• StudyObjecBve:Reporttheprevalenceof“lowhealth-habitachievers”(LHHA)andcomparecardiovascularhealthparametersbetweenLHHAandtheirpeers.
LHHA Criteria
Screen Time ≥ 5 Hours / Day
Exercise 0-1 Sessions of Moderate (30 min) and/or Vigorous (20 min) Activity / Week
Unhealthy Beverages ≥ 2 High Sugar Beverage / Day
Fried, Fatty and Sweet Foods ≥ 2 Fried, Fatty, or Sweet Food / Day
Fruits and Vegetables 0-1 Servings / Day
MustmeetALL5LHHACriteria
AHAQCOR2013 MichelleMarch

• Low Health-Habit Achievers were more likely to be: o Male o African American or Hispanic o Enrolled in a lower income school district.
• Low Health-Habit Achievers had:
o RecoveryHeartRate
o TotalCholesterol
o LDLCholesterol
BehavioralFactorsasPredictorsofPoorCardiovascularHealthinMiddle-SchoolStudents
AHAQCOR2013 MichelleMarch

BehavioralChanges


HighMobileDeviceUsageAssociatedwithSedentaryBehaviorsand
LessPhysicalAcRvityin6thGradeStudents
• StudyObjecBve:Determinetheprevalenceofmobiledeviceusein6thgradersandexaminetherelaRonshipbetweenmobiledeviceusage,physicalacRvity,andothersedentaryscreenRmehabits
Hours of Screen Time Low Mobile Device Users (LMD) ≤2 hours High Mobile Device Users (HMD) >2 hours
AHAEPI2015 LaurenGordon

• Ahighpercentage(20.7%)ofmiddleschoolstudentsspentmoreRmeonmobiledevicesthanrecommendedbytheAAP
• Highmobiledeviceusersweremoreorenfemale
• Highmobiledeviceusersreported:– ExerciseTime
– SportsTeamParRcipaRon
– SedentaryHabits
HighMobileDeviceUsageAssociatedwithSedentaryBehaviorsand
LessPhysicalAcRvityin6thGradeStudentsAHAEPI2015 LaurenGordon

Passive Screen Time Associated with Unhealthy Dietary Consumption and
Physiological Characteristics
• StudyObjecBve:TocomparephysiologicalmeasuresandratesofunhealthysnackconsumpRonbetweenstudentsthatparRcipatein“passive”(i.e.TV)or“acRve”(i.e.computerorvideogame)screenRme
ACC2014 BelindaVuong
HoursofScreenTime NumberofStudents
HighTV 2-6hoursTVRme 477
HighComputer/VideoGames 2-6hoursComp/VGRme 296
LowScreenTime 0-0.5hourstotalscreenRme 230
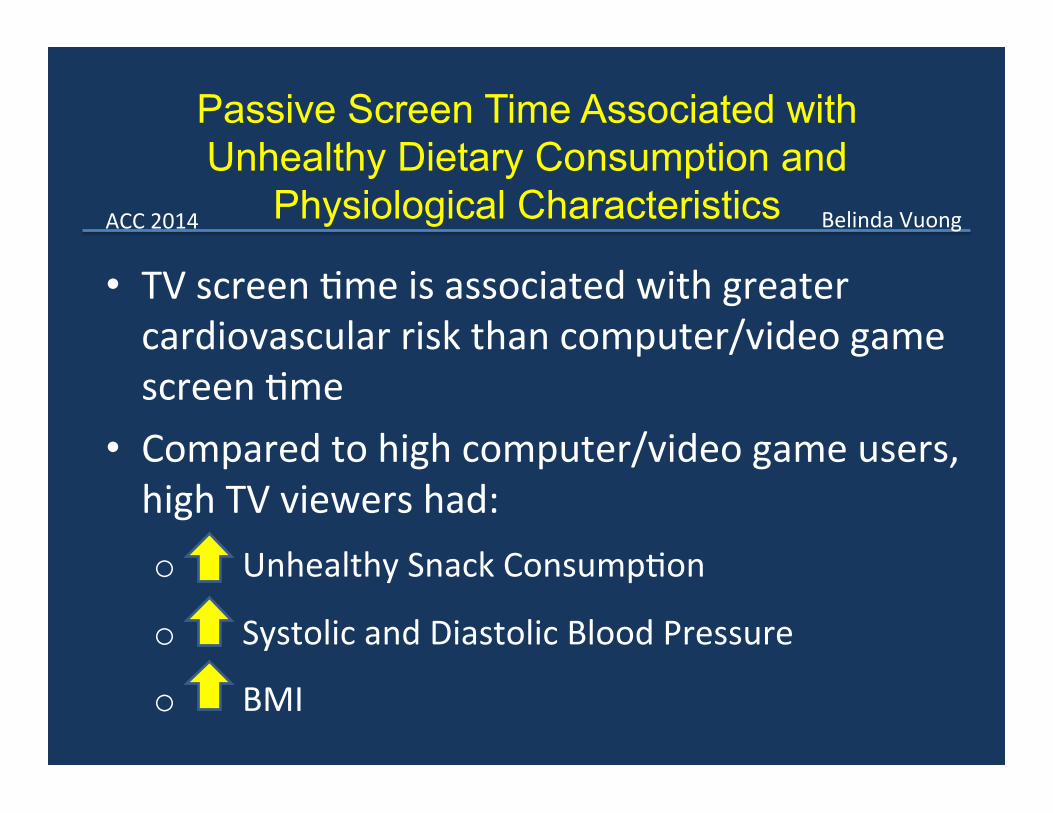
• TVscreenRmeisassociatedwithgreatercardiovascularriskthancomputer/videogamescreenRme
• Comparedtohighcomputer/videogameusers,highTVviewershad:o UnhealthySnackConsumpRon
o SystolicandDiastolicBloodPressureo BMI
Passive Screen Time Associated with Unhealthy Dietary Consumption and
Physiological CharacteristicsACC2014 BelindaVuong

PhysiologicChanges


HealthStatusandBehaviorAmongMiddle-SchoolChildreninaMidwestCommunity:WhataretheUnderpinningsofChildhoodObesity?
•InAnnArbor/YpsilanR,15%of6thgradestudentsareobese(BMI≥95thpercenRle).•Obesestudentshavelessfavorablehealthasassessedbylipidprofile,bloodpressure,fitness,andbloodsugar.•ObesestudentshavelessfavorabledietaryandacRvitypaKerns.
InternalMedicineResearchDay2011 TaylorEagle

PHSIntervenRonandtheReducRonofCardiovascularRisk
• Overweightandobesestatusispresentinnearly1/3ofSEMI6thgradestudents.• Post-PHSintervenRon,studentsshowed:
o TVandvideogameRme,BP,totalcholesterol,LDLcholesterol,triglycerides,andrandomglucose
o intramuralsports,moderateexercise,andfruit/vegetableconsumpRon
ACC/AHAQCOR2012 TaylorEagle

Schoolv.HomeLunchesSubmiKedtoAHAEPI2016 RosadeVisser
3.4
3.6
3.8
4
4.2
4.4
4.6
4.8
LowSES HighSES
Sessions/W
eek
VigorousPhysicalAcBvity
HomeLunch
SchoolLunch
*
**
0
0.5
1
1.5
2
2.5
3
3.5
Fruits/Vegetables (Fried)Meat SugaryBeverages
Servings/D
ay
DietaryHabits
LowSESHomeLunch
LosSESSchoolLunch
HighSESHomeLunch
HighSESSchoolLunch
*
**
****
****
0
0.5
1
1.5
2
2.5
3
LowSES HighSES
Hours/Da
y
TVandVideoGameScreenTime
HomeLunch
SchoolLunch
**
**
*p<0.05**p<0.001
Students(inbothlowandhighSESregions)whoateschoollunchesdemonstratedsignificantlyworsehealthbehaviorsthanstudentswhoatelunchesbroughtfromhome.

Schoolv.HomeLunchesSubmiKedtoAHAEPI2016 RosadeVisser
0%
5%
10%
15%
20%
25%
30%
35%
40%
LowSES HighSES
PercentageofOverweight/Obese
HomeLunch
SchoolLunch**
106.0
106.5
107.0
107.5
108.0
108.5
109.0
109.5
LowSES HighSES
mmHg
SystolicBloodPressure
HomeLunch
SchoolLunch
*
95
100
105
110
115
LowSES HighSES
Beats/Minute
RecoveryHeartRate
HomeLunch
SchoolLunch*
*p<0.05**p<0.001
StudentsinhighSESregionswhoateschoolluncheshadsignificantlyworsephysiologicalmeasuresthanstudentswhoatelunchesbroughtfromhome.

BreakfastHabitsandCardiovascularDiseaseRiskFactorsinMiddle-SchoolChildren
• StudyObjecBve:Tocomparephysiological,
nutriRonal,andhealth-relatedbehavioralmeasuresinstudentswhoeatanddonoteatbreakfast
(n=1410)85%
(n=241)15%
BreakfastEaters
Non-BreakfastEaters
AHAQCOR2013 AnneJones
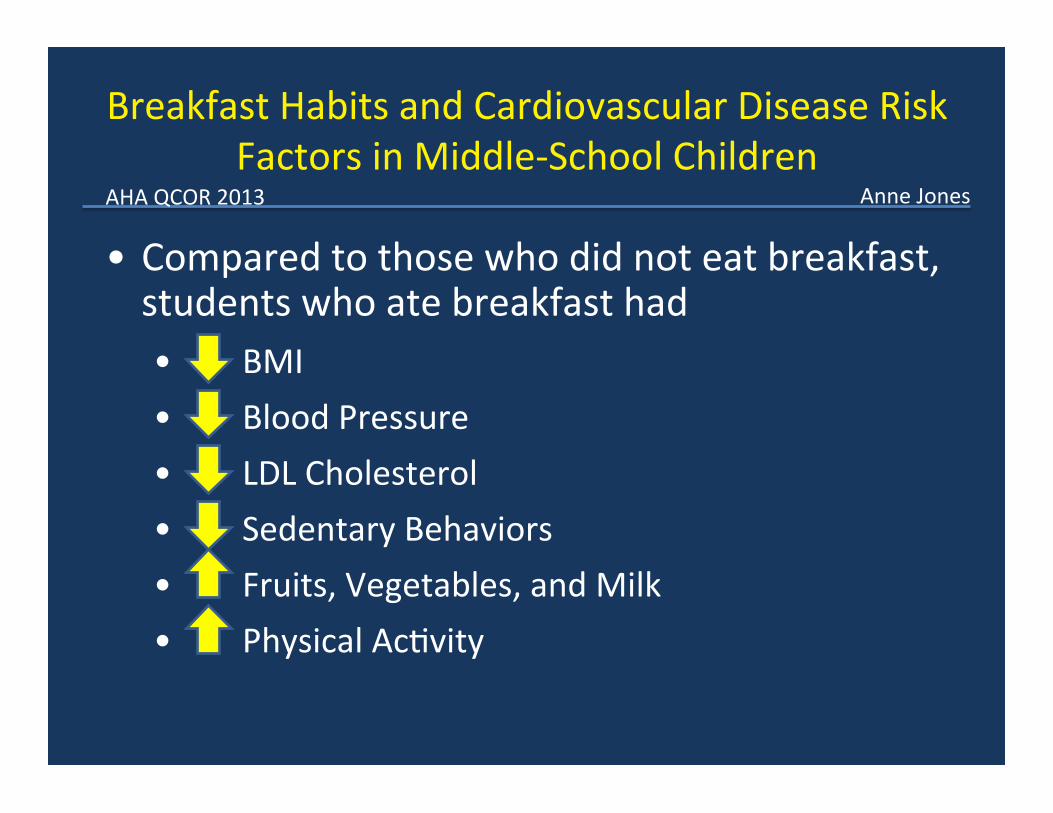
• Comparedtothosewhodidnoteatbreakfast,studentswhoatebreakfasthad• BMI• BloodPressure• LDLCholesterol• SedentaryBehaviors• Fruits,Vegetables,andMilk• PhysicalAcRvity
BreakfastHabitsandCardiovascularDiseaseRiskFactorsinMiddle-SchoolChildren
AHAQCOR2013 AnneJones

HeartRateRecoveryasaFitnessIndicator
ACC2011 DanielSimhaee
Higher heart rate recovery levels were associated with a less favorable lipid profile.
HDL*
48 50 52 54 56 58
Quartiles of HRR
Triglycerides*
Cholesterol**
80 84 88 92 96
Quartiles of HRR
LDL**
100 110 120 130 140
Quartiles of HRR
156 160 164 168 172
Quartiles of HRR
1Q2Q3Q4Q

DecreasedHDL-CandCardiovascularRiskFactors
60.24 55.7 50.1 45.2
0
50
100
Underweight Overweight
Mean HDL-C by BMI Percentile
HD
L-C
(mg/
dL) %
P-value for trend = 0.001
AhighprevalenceoflowHDL-CwasfoundinthepopulaRon,whichtendedtoclusterwithinacRve,overweight,lessfitgirlswithhightriglyceridesandhigherbloodpressure.
Variable N HDL-C ≤ 40mg/dL
HDL-C > 40mg/dL
P Value
N(%) 1104 177 (16.03)
927 (83.97)
BMI (kg/m2)-mean 1099 22.93 ±5.05
19.54 ±3.70 0.001
BMI>85th percentile (%) 1090 105
(60.3) 264
(28.8) 0.001
Systolic BP (mmHg)-mean 1101 110.88
±11.47 107.98 ±11.16 0.002
Diastolic BP (mmHg)-mean 1101 66.01
±8.90 63.67 ±7.74 0.001
Resting HR (beats/min)- mean 1101 84.34
±11.30 80.22 ±10.81 0.001
Recovery HR (beats/min)-mean 1040 110.72
±18.13 103.39 ±17.38 0.001
Triglycerides (mg/dL)-mean 1064 175.01
±102 111.88 ±67.16 0.001
Low density lipoprotein cholesterol (mg/dL)-mean
1000 93.53 ±27.32
87.90 ±24.72 0.009
# days strenuous exercise/week-mean
1025 4.02 ±2.13
4.53 ±2.01 0.004
# days moderate exercise/week-mean
1029 2.99 ±2.39
3.41 ±2.29 0.019
ACC2011 ShannonFlynn
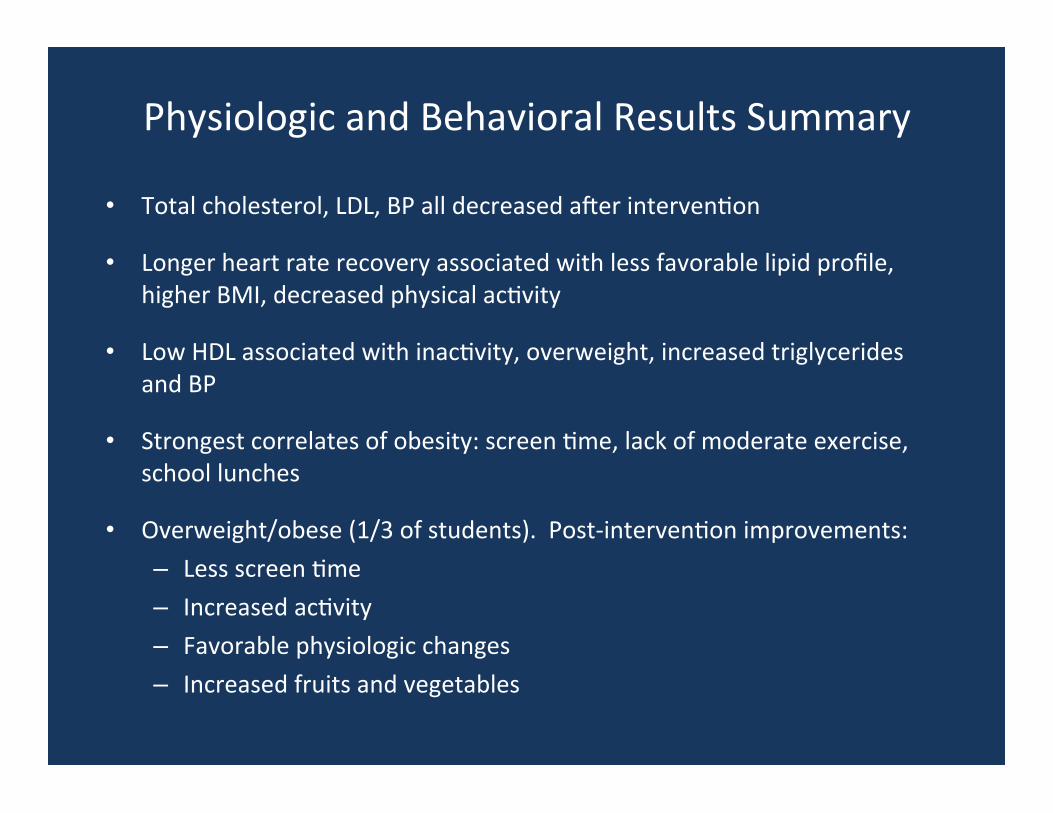
PhysiologicandBehavioralResultsSummary
• Totalcholesterol,LDL,BPalldecreasedarerintervenRon
• Longerheartraterecoveryassociatedwithlessfavorablelipidprofile,higherBMI,decreasedphysicalacRvity
• LowHDLassociatedwithinacRvity,overweight,increasedtriglyceridesandBP
• Strongestcorrelatesofobesity:screenRme,lackofmoderateexercise,schoollunches
• Overweight/obese(1/3ofstudents).Post-intervenRonimprovements:– LessscreenRme– IncreasedacRvity– Favorablephysiologicchanges– Increasedfruitsandvegetables

InfluenceofEconomics

ResponsetoaSchool-basedHealthIntervenRoninHigh-andLow-IncomeCommuniRes
• StudyObjecBve:Tocomparetheefficacyofschool-basedintervenRonsinhigh-andlow-incomecommuniRes
Community MedianFamilyIncome
HighSES(n=1840) AnnArbor $53,377
LowSES(n=1307) YpsilanR;Detroit $33,699;$27,862
AHAEPI2014 RobertRogers

ChildhoodObesityinTwoCommuniRes:RelaRontoHealthHabitsandResources
AcBvityCharacterisBcs AnnArbor,MI YpsilanB,MI p-value
Inthepast7days
ExerciseRme≥20min/dayfor≥5days 292(53.3) 64(48.1) 0.17
ExerciseRme≥30min/dayfor≥5days 200(36.4) 46(34.6) 0.18
NumberofPEclasses(≥1perweek) 499(89.7) 78(58.6) <0.001
SchoolSportTeams(≥1teams) 346(62.8) 46(34.6) <0.001
OrganizedSportsTeams(outsideschool,≥1teams) 362(65.2) 78(58.6) 0.16
Inthepast24hours
TVwatching(≥2hours) 230(41.7) 97(72.9) <0.001
ComputerBme(≥2hours) 122(22.0) 54(40.6) <0.001
Playingvideogames(≥2hours) 83(15.0) 52(39.1) <0.001
• Weobservedamarkeddifferenceindiet,physicalacBvityhabits,andcardiovascularparametersamongchildrenfromtwoneighboringcommuniBeswithvaryingresources.
• Webelievethattheincreasedriskofobesityinonecommunitycorrelatesdirectlywiththatcommunity’saccesstohealthyfoodandfaciliBesandprogramswhichpromotephysicalfitness.
AHA2008 TaylorEagle

ComparisonofAnnArborandYpsilanRPopulaRons
3. Did anything in your life change because of something you learned from Project Healthy
Schools classroom activities?
11.8%
30.5%
31.0%
44.4%
47.6%
55.1%
0% 10% 20% 30% 40% 50% 60%
No Changes
Less Screen Time
Healthier Drinks
Less Fast Food
More PA Minutes
More Fruit & Veggies
3. Did anything in your life change because of something you learned from Project Healthy
Schools classroom activities?
22.0%
26.5%
27.2%
37.4%
39.7%
39.8%
0% 10% 20% 30% 40% 50% 60%
No Changes
Less Screen Time
Healthier Drinks
More PA Minutes
Less Fast Food
More Fruit & Veggies
YPSILANTI ANNARBOR
YpsilanRschoolshadgreaterself-reportedbehavioralimprovementspost-PHSintervenRonthanAnnArborschools.
APHA2008 JeanDuRussel-Weston
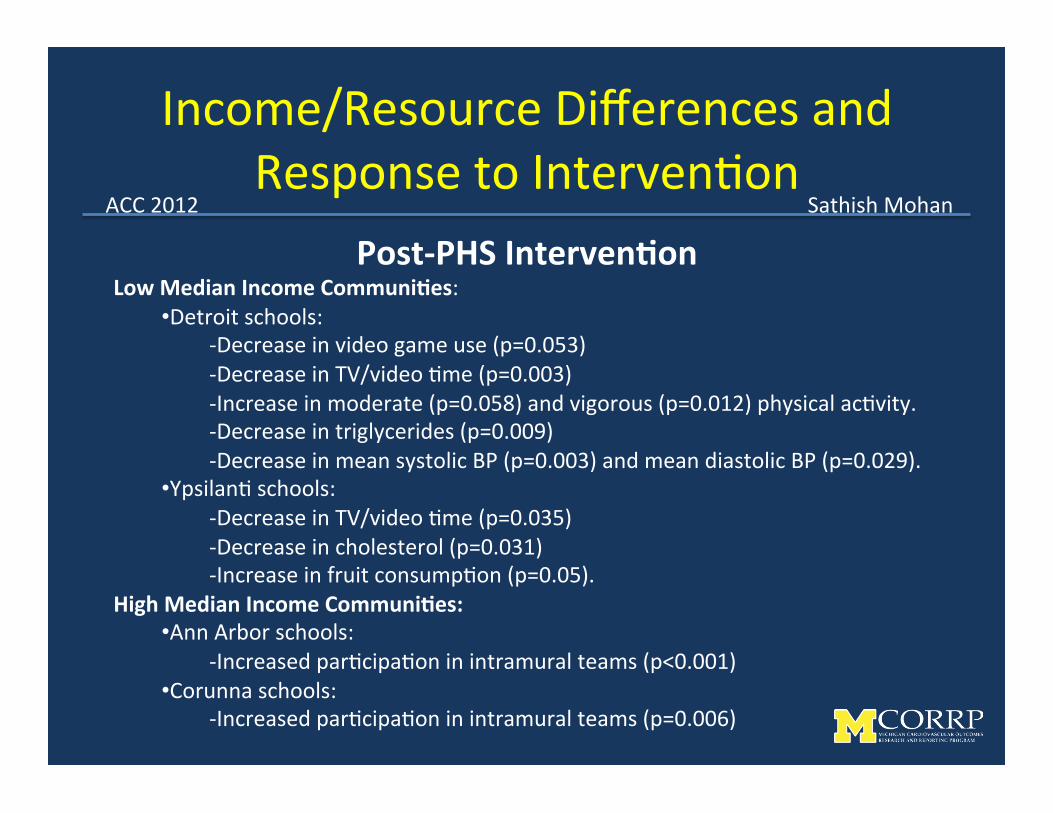
Income/ResourceDifferencesandResponsetoIntervenRon
ACC2012 SathishMohan
Post-PHSIntervenBonLowMedianIncomeCommuniBes:
• Detroitschools:-Decreaseinvideogameuse(p=0.053)-DecreaseinTV/videoRme(p=0.003)-Increaseinmoderate(p=0.058)andvigorous(p=0.012)physicalacRvity.-Decreaseintriglycerides(p=0.009)-DecreaseinmeansystolicBP(p=0.003)andmeandiastolicBP(p=0.029).
• YpsilanRschools:-DecreaseinTV/videoRme(p=0.035)-Decreaseincholesterol(p=0.031)-IncreaseinfruitconsumpRon(p=0.05).
HighMedianIncomeCommuniBes:• AnnArborschools:
-IncreasedparRcipaRoninintramuralteams(p<0.001)• Corunnaschools:
-IncreasedparRcipaRoninintramuralteams(p=0.006)

TrendsinBMIBasedonSocioeconomicStatus
• StudyObjecBve:ReporttrendsinBMIfor6thgradestudentsovertenyearsandcomparedifferencesbetweenstudentsofvarioussocioeconomicstatuses(SES)
SocioeconomicStatus MedianHouseholdIncome Low <$35,000
Middle $35,000-$50,000 High >$50,000
AHAQCOR2015 AlexisCoolidge

• ThemeanBMIofhighSES6thgradersremainedconsistentlylowerthanthatofmiddleandlowSES6thgradersovertenyears.
• In2007,themeanBMIoflowincomestudentswas21.24.By2012,themeanBMIofthisgroupofstudentshadincreasedto22.85.
TrendsinBMIBasedonSocioeconomicStatusAHAQCOR2015 AlexisCoolidge

DifferencesbyGenderandRace

Gender Differences in Physiologic Markers and Behavior Predictors of Obesity
• RegularlyeaRngschoollunchesandwatching>2hoursofTV/daycorrelatedwithobesityinbothgirlsandboys
• PhysicalacRvityappearsprotecRveagainstobesityinboys
• MilkconsumpRonappearsprotecRveagainstobesityingirls
AHAQCOR2012 MorgenGovindan

RacialDifferencesinPhysiologicalandBehavioralResponsetoSchoolBasedWellnessProgram:AnInsightfromProjectHealthySchools
• Atbaseline,blackstudentshadhigherHDLandlowertriglycerides,buthadhigherHRRandahigher%ofobesestudents
• TheyalsohavelowerconsumpBonoffruitsandvegetables,lowerparBcipaBoninphysicalacBvityandmoresedentarybehavior.
• Atfollow-up,blackstudentsdecreasedcholesterol,LDL,andHRRthemost.Non-blackstudents(highertriglyceridesatbaseline)decreasedtriglyceridesthemost.
• Thisdatasuggestsmorebenefitisseeninthegroupwiththemostroomforimprovement.Atbaseline,blackstudentsaremoreoheninthesegroups.
AHAQCOR2012 TaylorJamerson
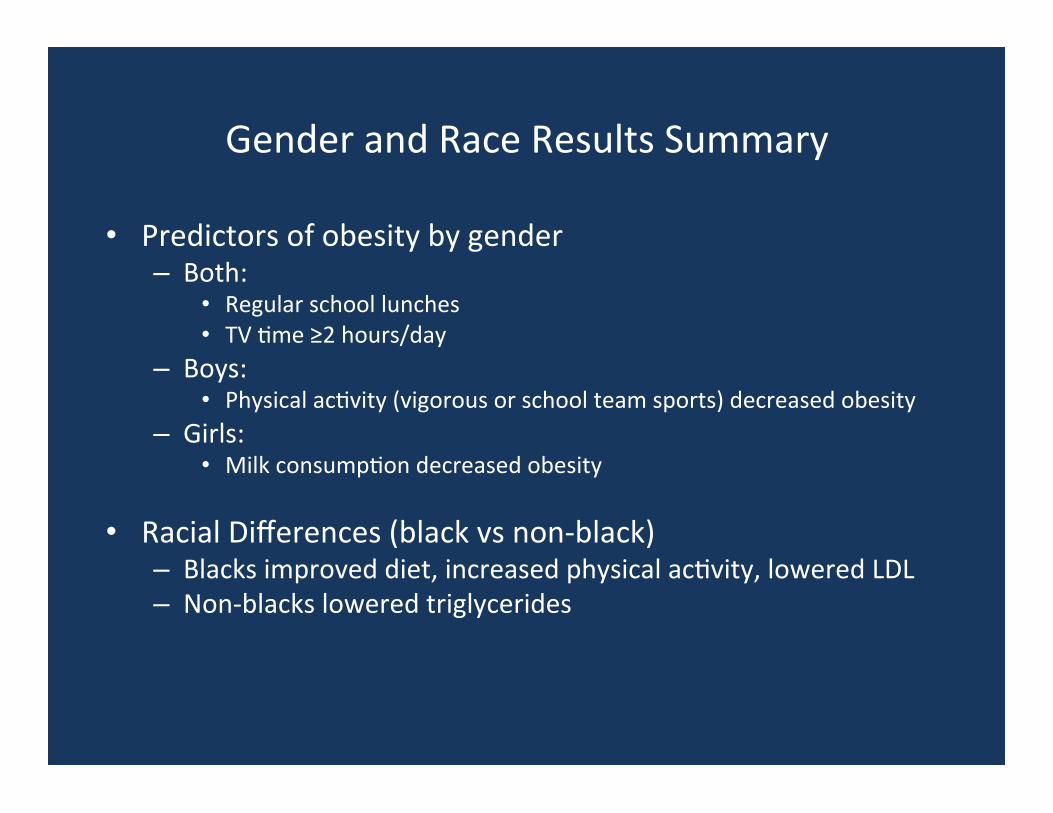
GenderandRaceResultsSummary
• Predictorsofobesitybygender– Both:
• Regularschoollunches• TVRme≥2hours/day
– Boys:• PhysicalacRvity(vigorousorschoolteamsports)decreasedobesity
– Girls:• MilkconsumpRondecreasedobesity
• RacialDifferences(blackvsnon-black)– Blacksimproveddiet,increasedphysicalacRvity,loweredLDL– Non-blacksloweredtriglycerides

ParentalInfluence
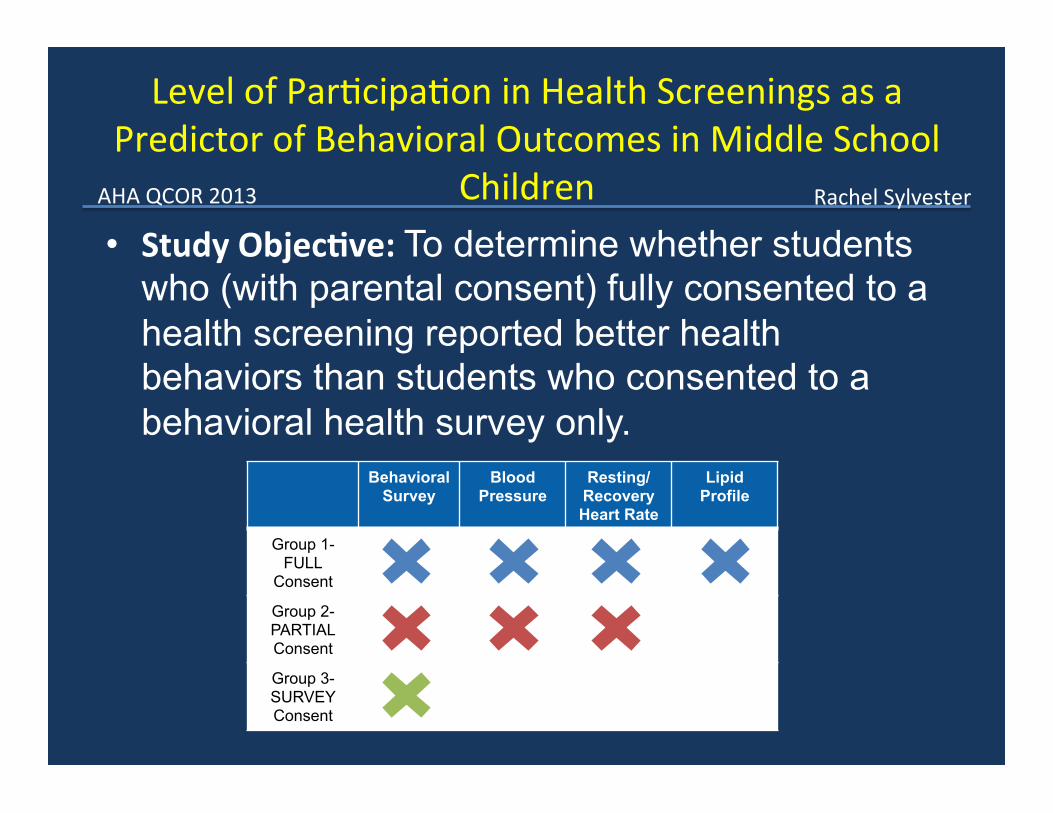
LevelofParRcipaRoninHealthScreeningsasaPredictorofBehavioralOutcomesinMiddleSchool
Children• StudyObjecBve:To determine whether students
who (with parental consent) fully consented to a health screening reported better health behaviors than students who consented to a behavioral health survey only.
Behavioral Survey
Blood Pressure
Resting/ Recovery Heart Rate
Lipid Profile
Group 1- FULL
Consent
Group 2- PARTIAL Consent
Group 3- SURVEY Consent
AHAQCOR2013 RachelSylvester

• Group1studentswithconsent(bothstudentandparent)toafullhealthscreeningreported:
• vegetables
• parRcipaRoninschoolsports
• high-sugar(non-soda)beverages
• screenRme(TV,computer,videogames)• Group3studentsreportedthegreatestimprovementin:
• SodaconsumpRon• ScreenRme
LevelofParRcipaRoninHealthScreeningsasaPredictorofBehavioralOutcomesinMiddleSchool
ChildrenAHAQCOR2013 RachelSylvester

InfluenceofParentalEducaRononNutriRonalandLifestyleChoicesofProjectHealthySchools
StudentsSubmiKedtoAHAQCOR2016 RyanRogers
• StudyObjecBve:To determine whether parental education level influences the dietary and lifestyle behaviors of 6th grade students.
Group LevelofEducaBon
MoreEducated Atleastoneparentcompletedacollegedegree
LessEducated Neitherparentcompletedacollegedegree

InfluenceofParentalEducaRononNutriRonalandLifestyleChoicesofProjectHealthySchools
StudentsSubmiKedtoAHAQCOR2016 RyanRogers
0
0.2
0.4
0.6
0.8
1
1.2
1.4
1.6
Vegetables Fruit RegularSoda
ChocolateDesserts
Servings/D
ay
DietaryHabits
LessEducated
MoreEducated*
**
****
00.51
1.52
2.53
3.54
4.55
VigorousExercise
ModerateExercise
WeightTraining
Sessions/W
eek
PhysicalAcBvity
LessEducated
MoreEducated
**
**
*
0
0.5
1
1.5
2
2.5
TV Computer VideoGame MobileDevice
Hours/Da
y
ScreenTime
LessEducated
MoreEducated
*
*
**
*p<0.05**p<0.001
• StudentswithmoreeducatedparentsreportedeaRngmorefruitsandvegetables,exercisingmorefrequently,andspendinglessRmeinfrontofascreen
• TheywerealsomorelikelytoeatbreakfastandlesslikelytoeatschoollunchandhaveaTVintheirbedroom.

School-basedIntervenRonLeadstoSustainedBenefitoverTime:FourYearFollow-UpReportfromProjectHealthySchools
• FouryearsarertheiniRalintervenRon,PHSstudentsconRnuedtoshowimprovementinthegoalareasevaluated.
• ThesechildrenareeffecRvelydecreasing
theirriskofCVdiseaseanddiabetes.
AHA2011 NicoleCorriveau