project leader: author(s): science group: © crown ... · 3.3 data logger ... two rmd ‘super...
TRANSCRIPT

Harpur Hill, Buxton Derbyshire, SK17 9JN T: +44 (0)1298 218000 F: +44 (0)1298 218590 W: www.hsl.gov.uk
© Crown copyright (2007)
Impact Effects on Scaffold from Safety Harness Attachments
HSL/2007/46
Project Leader: Chris J Atkin
Author(s): Chris J Atkin BEng(Hons)
Science Group: Hazard Reduction

CONTENTS
1 INTRODUCTION......................................................................................... 11.1 Background ............................................................................................. 11.2 Project Objectives.................................................................................... 1
2 DESIGN OF SCAFFOLD............................................................................ 22.1 Support Structure .................................................................................... 22.2 Lifting Mechanism.................................................................................... 22.3 Experimental Structure ............................................................................ 32.4 Loading Mechanism................................................................................. 6
3 INSTRUMENTATION.................................................................................. 93.1 Base and Tieback Loadcells.................................................................... 93.2 Lanyard Loadcell ..................................................................................... 93.3 Data Logger............................................................................................. 9
4 TEST RESULTS ....................................................................................... 104.1 First Lift.................................................................................................. 104.2 Second Lift............................................................................................. 114.3 Third Lift................................................................................................. 134.4 Fourth Lift .............................................................................................. 15
5 DISCUSSION AND CONCLUSION .......................................................... 17
6 APPENDIX A – AVERAGE RATIO VALUES ........................................... 18
7 APPENDIX B – BASE FORCES .............................................................. 19
ii

EXECUTIVE SUMMARY
Objectives
To determine what the consequences would be to the scaffold structure, when a scaffolder falls
off during construction. To investigate forces on a lanyard during a simulated fall, and the
effects this would have on the scaffold structure itself.
To make measurements of resultant forces in ties and at the base of the structure, compared to
the applied force in the lanyard would give an indication of the consequences if such an event
happened.
Main Findings
At low lift count the energy of a fall is more likely to produce damage to the structure rather
than pull out ties.
Unified tie pull out forces are generally higher for upper ledger attachments than lower ledger
attachments.
For a given location on any lift, the unified tie pull out force is generally independent of the lift.
iii

1 INTRODUCTION
1.1 BACKGROUND
During the construction of scaffold structures, scaffolders are protected from the consequences
of a fall by wearing safety harnesses secured at suitable attachment points. There may be times
when the required number of ties required to the parent structure will not be correct, i.e. just
before installation of the ties, it is at this point when a fall may cause most force in the existing
ties.
Mr. Martin Holden of the Construction Division Technology Unit, HSE asked the Health and
Safety Laboratory, Field Engineering Section, to determine what the consequences to a scaffold
structure, would be of a scaffolder falling off. HSL were asked to investigate forces on the
lanyard during a simulated fall, and the effect the fall would have on the scaffold structure itself.
Measurements of resultant forces in ties and at the base of the structure, compared to the applied
force in the lanyard would give an indication of the consequences if such an event happened.
1.2 PROJECT OBJECTIVES
The main objectives of the project were as follows:
To determine the loading effect on a partially built scaffold structure by a
mass of 100kg to simulate a 95th percentile adult male falling from the
scaffold,
To measure the dynamic force in the attachment lanyard during the fall,
To achieve 6kN1 and 10kN2 dynamic force in the lanyard.
To measure the resultant dynamic forces at the base of the structure and the
tie back to the support structure,
Drop tests to be conducted at a number of locations,
To assess visible effects on the scaffold.
1 6kN is the maximum permitted load allowed in a lanyard, defined in section 4.4 of BS EN 355
2 Generating a load of 10kN in the lanyard meant that the ledgers and standards were subjected
to excessive and damaging loads. This objective was eventually omitted.
1
2 DESIGN OF SCAFFOLD
2.1 SUPPORT STRUCTURE
The structure to which the experimental scaffold was tied back, consisted of two RMD towers
bolted onto a large concrete test pad. The towers were 12m high and spaced 4m apart as shown
in Figure 4. The right hand tower had an internal scaffold structure constructed to facilitate
access to the experimental scaffold and lifting mechanism.
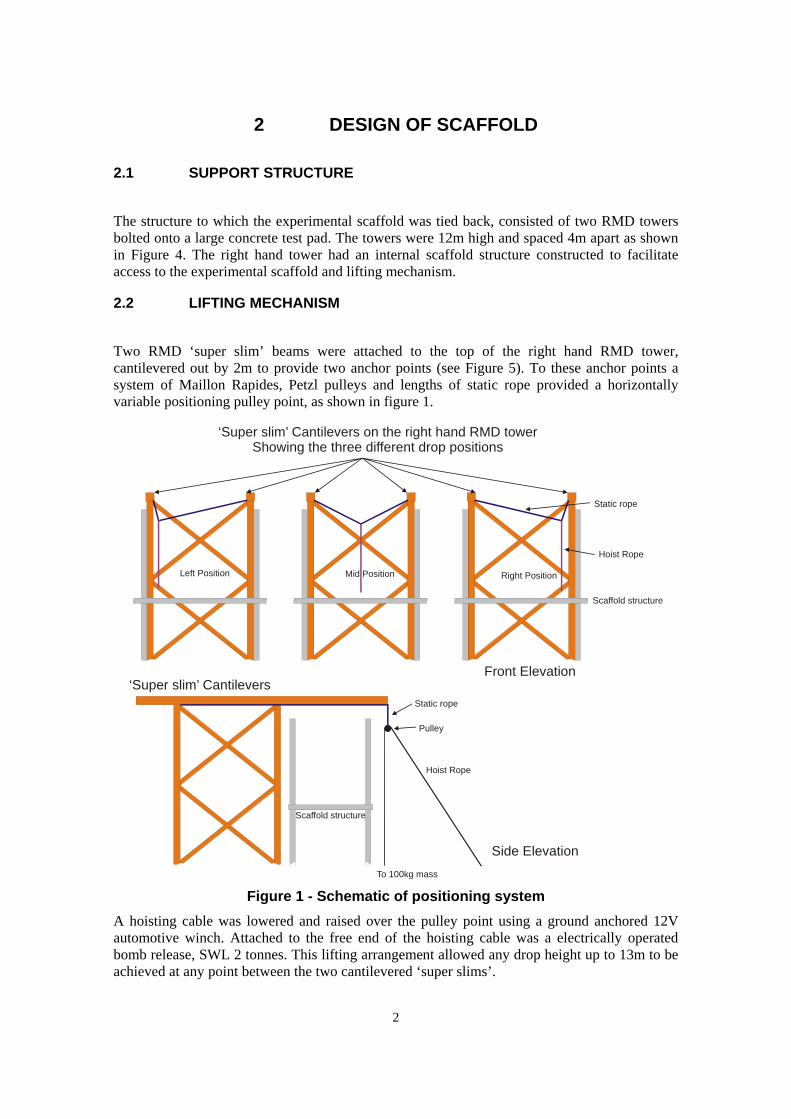
2.2 LIFTING MECHANISM
Two RMD ‘super slim’ beams were attached to the top of the right hand RMD tower,
cantilevered out by 2m to provide two anchor points (see Figure 5). To these anchor points a
system of Maillon Rapides, Petzl pulleys and lengths of static rope provided a horizontally
variable positioning pulley point, as shown in figure 1.
‘Super slim’ Cantilevers on the right hand RMD towerShowing the three different drop positions
‘Super slim’ Cantilevers
Static rope
Pulley
Scaffold structure
Scaffold structure
Static rope
Left Position Right PositionMid Position
Hoist Rope
To 100kg mass
Hoist Rope
Front Elevation
Side Elevation
Figure 1 - Schematic of positioning system
A hoisting cable was lowered and raised over the pulley point using a ground anchored 12V
automotive winch. Attached to the free end of the hoisting cable was a electrically operated
bomb release, SWL 2 tonnes. This lifting arrangement allowed any drop height up to 13m to be
achieved at any point between the two cantilevered ‘super slims’.
2

2.3 EXPERIMENTAL STRUCTURE
The experimental structure initially consisted of a single lift of scaffold, four bays wide. The
right hand RMD tower facilitated access to the 2nd bay from the right. Each lift was built to a
partial finish, front and rear upper ledgers were installed, however, toe boards, handrails and
intermediate handrails were not fitted.
A scaffold contract company was recruited to install each lift using their usual method of
construction.
The preceding lift was finished with toe boards, handrails and intermediate handrails.
Each upright had a 2 tonne shear beam loadcell located at the base to record the vertical reactive
force upon the concrete test pad as shown in Figures 2 and 3.
Figure 2 - Showing Base Loadcells
01 02 03 04 05
06 07 08 09 10
Test Bay
Front of Experimental Structure
Standards with Ties at Second Lift
Figure 3 - Location of Base Loadcells
As each stage progressed a further lift was added to simulate a structure being constructed. At
the second lift, two box ties were installed back to the supporting RMD towers. One of the box
ties was replaced by an instrumented loadcell system to record the horizontal force experienced
by the tie. All tests were conducted in the bays (increasing lifts) immediately to the left of the
instrumented tie, see Figure 4 (note Figure 4 is a schematic and to avoid complexity, bracing
handrails and hoisting mechanism are not shown). Figure 5 shows the test facility in its final
stage. Figure 6 shows the original rear box tie between the scaffold and the right hand RMD
tower. Figure 7 shows how this was modified to provide an instrumented tie.
3

Figure 4 - Schematic of Experimental Rig and Support Structure (Front Elevation)
4

Figure 5 - Completed Experimental scaffold
5

Figure 6 - As installed Box Tie
Figure 7 - Modified Instrumented Tie
2.4 LOADING MECHANISM
To achieve the dynamic force of a 95th percentile adult male falling, a canvas bag was filled
with dry builders sand to a mass of 100 kg. The bag was not to a specific standard as its
requirement was to achieve the desired impact forces. A sand bag was chosen so that if the mass
was to swing into the scaffold structure after the drop, the shock would not be as severe as say a
steel mass. To produce as consistent a dynamic force as possible, and to remove as many
variables as possible to the loading mechanism, it was decided to use a webbing lanyard with
the shock absorber removed. Each end of the lanyard had sewn loop terminations, which held
6

karabiners. One end of the lanyard was attached to the scaffold at predetermined attachment
points by a scaffold karabiner. To the other end of the lanyard, a screw gate karabiner was
connected to a loadcell via an eyebolt. This loadcell was connected, in series, to the canvas bag
using an eyebolt and a Maillon Rapide. The arrangement is shown as a schematic in Figure 8.
Scaffold Karabiner
2m Lanyard
Sewn loop termination
Sewn loop termination
Screwgate karabiner
Eyebolt
‘S’ beam loadcell
Eyebolt
Maillon Rapide
100kg Canvas bag
Figure 8 - Schematic of loading system
The six predetermined attachment points on the experimental scaffold were: (all attachment
points at rear ledgers)
Elevation Rear Face
Mid Bay
Upper
Ledger
Lower
Ledger
Left of Bay (furthest from
instrumented tie)
Upper
Ledger
Lower
Ledger
Right of Bay (closest to
instrumented tie)
Upper
Ledger
Lower
Ledger
7

Figure 9 shows a schematic side elevation of the experimental rig, detailing the path the lanyard
follows during loading.
Initial position of bag and lanyard
Attachment at upper rear ledger
Attachment at lower rear ledger
DropHeight
Final position of bag and lanyard
Figure 9 - Loading mechanism (Side Elevation)
8

3 INSTRUMENTATION
3.1 BASE AND TIEBACK LOADCELLS
The ten base loadcells and the tieback loadcell were 20kN EMS type 5300 shear beam. During
the course of the project it was found that two of the base loadcells (Foot05 and Foot06) had
failed and a number of others started to show levels of noise (Foot01 and Foot 04). Due to the
construction of the rig, it was too complex a procedure to replace these loadcells. These
loadcells were calibrated in a Denison Mayes test machine.
3.2 LANYARD LOADCELL
The lanyard loadcell was a 20kN Tedea-Huntleigh ‘S’ Beam loadcell, with eyebolt fittings at
each end. This loadcella was calibrated in a Denison Mayes test machine.
3.3 DATA LOGGER
Flying leads from all 12 loadcells were laid into an instrumentation hut adjacent to the
experimental scaffold on the test pad. The data logger was an Intercole VHS Spectra configured
for transducer input. The acquisition rate was 2000 samples per second. Logging was started
and ceased manually. Files were recorded to a PC for subsequent data analysis. The data logger
was calibrated with a Time Voltage calibrator.
9

4 TEST RESULTS
4.1 FIRST LIFT
Figure 10 - Attachment points for Lift 1
Commissioning tests on as unstable at low force the first lift showed that the scaffold structure w
levels (base loadcells indicated that the two standards had lifted from the ground) and had a
tendency to bend the ledger at the attachment point. It was decided to progress to the second lift
and fit ties back to the supporting structure, as shown in Figures 6 & 7.
10

4.2 SECOND LIFT
Figure 11 - Attachment points for Lift 2
The second lift was insta
ermine the dynamic force in the
nyard, shown in Table 1
Correlation
lled and the test programme resumed.
Commissioning tests at various drop heights were used to det
la
Table 1 – Height to Force
Drop Height (mm) Peak Dynamic Lanyard Force (kN)
700 4.2
1000 5.6
1100 5.7
1700 6.9
1700 6.6
2100 7.4
2600 9.2
It was noticed that attemp gher force levels of 10kN in the lanyard was
roducing detrimental effects to the scaffold. These included bent ledgers and standards. It was
ting to achieve the hi
p
agreed with the customer to limit the test programme to a dynamic force in the lanyard of
approximately 6kN.
11

Table 2 shows the results for the drop tests on the second lift. The data includes test number,
drop height, forces in the tie and lanyard, ratios of tie force to lanyard force and position of
e.g. a ratio of 0.25 with a
nyard force of 6kN would indicate a tie force of 1.5kN
e force seen by the tie, i.e. into the
upporting structure, when the drop mass swings into the structure after being arrested by the
Table Lift Forces (kN)
attachment. ‘Relative’ indicates dynamic forces not including any static offset. ‘Absolute’
indicates the total force including any static offset. Components of the static offset include the
horizontal force caused by the mass of the experimental scaffold and force caused by the slight
deflection in the supporting structure when the drop mass is hoisted.
The ratio value shows the relationship of tie force to lanyard force
la
The minimum values in the tie reflect the compressiv
s
lanyard.
2. Second
Tieback
Relative Absolute Lanyard Ratio: Tieback:Lanyard
Test Height
Drop
Min M n Max M x
Position
(m) ax Mi in Ma Relative Absolute
T01 1.5 -1.76 1.78 -1 -0.03 .47 2.07 6.38 0.28 0.32 E
T02 1.5 -1.37 1.44 -1.14 1.66 -0.02 6.73 0.21 0.25 E
T03 1.4 -1.28 1.33 -1.03 1.58 -0.02 6.92 0.19 0.23 E
T04 1.1 -1.14 1.34 -0.89 1.59 -0.02 5.85 0.23 0.27 E
T05 1.1 -0.97 1.38 -0.72 1.62 -0.01 5.73 0.24 0.28 E
T06 2.3 -1.99 2.01 -1.72 2.28 -0.03 9.24 0.22 0.25 E
T07 2.4 -2.42 2.45 -2.24 2.63 -0.02 9.25 0.27 0.28 E
T08 2.4 -1.23 1.48 -1.14 1.57 -0.01 10.41 0.14 0.15 E
T09 1.4 -1.89 2.71 -1.73 2.87 -0.03 6.56 0.41 0.44 B
T10 1.3 -2.27 2.83 -2.04 3.06 -0.03 7.00 0.40 0.44 B
T11 1.1 -2.21 2.91 -1.96 3.16 -0.01 7.04 0.41 0.45 B
T12 1.0 -2.11 2.11 -1.85 2.36 -0.02 6.17 0.34 0.38 B
T13 2.0 -2.43 3.74 -2.21 3.96 -0.04 8.20 0.46 0.48 B
T14 1.4 -1.85 1.76 -1.62 1.99 -0.01 7.78 0.23 0.26 F
T15 1.5 -1.85 1.76 -1.47 2.14 -0.01 7.78 0.23 0.27 F
T16 1.5 -1.88 1.80 -1.45 2.23 -0.01 8.08 0.22 0.28 F
T17 1.5 -2.95 3.22 -2.51 3.66 -0.01 6.71 0.48 0.55 C
T18 1.4 -3.07 4.17 -2.96 4.28 -0.02 7.34 0.57 0.58 C
T19 1.4 -3.28 3.81 -3.09 4.00 -0.05 6.52 0.58 0.61 C
T20 1.4 V t oid Tes D
T21 1.3 -2.81 2.28 -2.60 2.49 -0.03 8.01 0.28 0.31 D
T22 1.3 Void Test D
T23 1.3 -2.17 1.79 -1.99 1.97 -0.02 7.47 0.24 0.26 D
T24 1.2 -1.76 1.52 -1.60 1.68 -0.02 6.97 0.22 0.24 D
T25 1.0 -2.56 1.95 -2.39 2.13 -0.02 6.25 0.31 0.34 A
T26 1.0 -2.94 1.85 -2.69 2.11 -0.02 6.37 0.29 0.33 A
T27 1.0 -3.05 2.14 -2.85 2.33 -0.02 6.42 0.33 0.36 A
Base force am r 6 o Ap ix Cs and s ple g aph T1 are sh wn in pend
12

4.3 THIRD LIFT
Figure 12 - Attachment points for Lift 3
During construction of the third lift, it was reported back by the scaffold contractors that the rig
had suffered cumulative damage by the previous testing and required a substantial rebuild.
Ledgers and standards had been bent and needed to be replaced. Transoms had slipped through
couplers and were reset and the couplers re-tightened.
Table 3. Third Lift Forces (kN)
Tieback
Relative Absolute Lanyard Ratio Tieback:Lanyard
Test
Drop
Height
(mm) Min Max Min Max Min Max Relative Absolute
Position
T28 1.1 -2.20 1.47 -1.99 1.68 -0.02 7.15 0.21 0.24 E
T29 1.1 -2.42 1.56 -2.14 1.85 -0.03 7.34 0.21 0.25 E
T30 1.0 -2.52 1.41 -2.15 1.78 -0.02 7.34 0.19 0.24 E
T31 1.0 -2.33 2.33 -1.99 2.68 -0.02 6.02 0.39 0.44 B
13

T32 1.0 -2.39 2.37 -2.22 2.54 -0.01 6.72 0.35 0.38 B
T33 1.0 -2.47 2.46 -2.41 2.52 -0.01 5.86 0.42 0.43 B
T34 1.0 -2.60 1.92 -2.47 2.05 -0.01 5.16 0.37 0.40 A
T35 1.1 -2.52 1.74 -2.33 1.94 -0.02 5.39 0.32 0.36 A
T36 1.1 -2.48 2.00 -2.31 2.17 -0.01 6.07 0.33 0.36 A
T37 1.1 -2.24 1.54 -2.16 1.62 -0.02 5.82 0.27 0.28 D
T38 1.1 -2.05 1.33 -1.83 1.55 -0.03 6.51 0.20 0.24 D
T39 1.1 -2.36 1.50 -2.20 1.66 -0.01 6.36 0.24 0.26 D
T40 1.1 -2.65 1.47 -2.49 1.63 -0.02 5.61 0.26 0.29 F
T41 1.1 -2.87 1.57 -2.64 1.80 -0.03 6.32 0.25 0.28 F
T42 1.1 -3.04 1.48 -2.67 1.85 -0.02 6.35 0.23 0.29 F
T43 1.1 -2.56 2.39 -2.04 2.91 -0.01 4.93 0.49 0.59 C
T44 1.1 -2.15 2.91 -2.00 3.06 -0.01 5.75 0.51 0.53 C
T45 1.1 -2.15 2.78 -2.13 2.80 -0.02 5.49 0.51 0.51 C
Base forces and sample graph T39 are shown in Appendix C
14

4.4 FOURTH LIFT
Figure 13 - Attachment points for Lift 4
No remedial work was required during the fourth lift construction. Little cumulative damage
was noted.
Table 4. Fourth Lift Forces (kN)
Tieback
Relative Absolute Lanyard Ratio Tieback:Lanyard
Test
Drop
Height
(mm) Min Max Min Max Min Max Relative Absolute
Postion
T46 1.1 -1.09 2.03 -1.11 2.01 -0.01 4.53 0.45 0.44 E
T47 1.1 -1.65 1.46 -1.67 1.44 -0.01 6.01 0.24 0.24 E
T48 1.1 -1.58 1.44 -1.55 1.47 -0.01 5.66 0.25 0.26 E
T49 1.1 Test Void E
T50 1.1 -1.50 1.36 -1.54 1.32 -0.06 0.06 0.31 0.30 E
T51 1.2 -1.43 1.49 -1.43 1.49 0.00 6.68 0.22 0.22 E
15

T52 1.2 -1.85 1.90 -1.82 1.94 -0.01 5.50 0.35 0.35 B
T53 1.2 -2.07 2.68 -2.23 2.52 -0.01 6.58 0.41 0.38 B
T54 1.2 -2.04 2.76 -2.23 2.57 -0.02 6.42 0.43 0.40 B
T55 1.2 Test Void C
T56 1.2 -2.11 2.53 -2.31 2.33 -0.02 5.23 0.48 0.45 C
T57 1.2 -2.15 2.70 -2.33 2.52 -0.02 5.35 0.50 0.47 C
T58 1.3 -2.10 2.77 -2.33 2.53 -0.02 5.43 0.51 0.47 C
T59 1.3 -1.69 2.31 -1.95 2.04 -0.02 6.20 0.37 0.33 F
T60 1.3 -1.61 2.27 -1.86 2.02 -0.02 7.27 0.31 0.28 F
T61 1.3 -1.63 2.19 -1.86 1.95 -0.02 7.12 0.31 0.27 F
T62 1.3 -1.69 1.58 -1.97 1.30 -0.01 4.92 0.32 0.26 D
T63 1.4 -1.71 1.65 -1.95 1.42 -0.01 5.73 0.29 0.25 D
T64 1.4 -1.61 1.74 -1.87 1.47 -0.01 5.88 0.30 0.25 D
T65 1.5 -1.78 1.80 -2.05 1.53 -0.02 5.66 0.32 0.27 D
T66 1.3 -1.78 1.61 -1.95 1.44 -0.01 4.99 0.32 0.29 A
T67 1.4 -2.03 2.04 -2.29 1.77 -0.01 5.68 0.36 0.31 A
T68 1.5 -2.09 1.90 -2.28 1.71 0.00 6.04 0.31 0.28 A
Minor damage was noted at the end of the fourth lift testing. There was a slight bend in the top
ledger.
Base forces and sample graph T68 are shown in Appendix C
16

5 DISCUSSION AND CONCLUSION
From Table 1 it is shown that the relationship between drop height and resultant lanyard force is
not accurately reproducible. Many variables contribute to this effect including friction between
the lanyard and scaffold boards, atmospheric conditions (humidity and temperature effects on
the lanyard), and the cumulative effects of loading the scaffold structure. Because of this it
proved difficult to produce a uniform dynamic force for each test.
However, to simplify results and remove the variance of the simulated load, the ratio of tieback
load to lanyard force was used to provide a dimensionless figure.
It can be seen from Tables 2, 3 and 4 that for each lift, tie force to lanyard force ratios are
greater for upper ledger than lower ledger attachment.
Table 5 in Appendix A shows average values of the tie force to lanyard force ratios for each of
the eighteen test locations.
Appendix B shows a comparison of the force recorded in the base loadcells to the lanyard force.
Appendix C shows three sample graphs, one for each lift, out of the 68 in total.
The tie force to lanyard force ratios for a given location remain similar independent of the lift
tested, this could be explained by the force being spread out over the structure as it gets larger.
At low lift count the energy of a fall is more likely to produce damage to the structure rather
than pull out ties.
Severe damage to the scaffold structure was evident during the early stages of the programme,
whereas in the later stages, very little damaged was noted. It is likely that stiffer structures, such
as a single, or double lift are more prone to experience plastic deformation. Larger structures
have more capacity to absorb the energy as elastic deformation, and show less gross damage.
17

6A
PP
EN
DIX
A –
AV
ER
AG
E R
AT
IO V
AL
UE
S
Tab
le 5
– A
ver
age
Rat
io V
alu
es
2nd L
ift
3rd
Lif
t 4
th L
ift
Po
siti
on
Rel
ativ
eA
bso
lute
Rel
ativ
eA
bso
lute
Rel
ativ
eA
bso
lute
0.2
31
0.2
71
0.2
0
0.2
4
0.3
0
0.2
9
0.4
1
0.4
4
0.3
9
0.4
2
0.3
9
0.3
8
0.2
3
0.2
7
0.2
5
0.2
9
0.3
3
0.2
9
0.5
4
0.5
8
0.5
0
0.5
4
0.5
0
0.4
6
0.2
5
0.2
7
0.2
3
0.2
6
0.3
1
0.2
6
0.3
1
0.3
4
0.3
4
0.3
7
0.3
3
0.2
9
Note
1:
The
tie
forc
e fr
om
tes
t num
ber
T08
has
bee
n e
xcl
uded
fro
m t
he
aver
agin
g,
as t
he
val
ue
reco
rded
was
subst
anti
ally
low
er f
rom
the
oth
er v
alu
es.
As
this
tes
t w
as
the
mo
st s
ever
e it
is
poss
ible
that
fo
rces
fro
m t
he
imp
act
wer
e tr
ansl
ated
in
to p
last
ic d
efo
rmat
ion
and
th
e ti
e d
id n
ot
exp
erie
nce
the
full
forc
e.
18

7A
PP
EN
DIX
B –
BA
SE
FO
RC
ES
(K
N)
Foot0
1F
oot0
2F
oot0
4F
oot0
3F
oot0
7F
oot0
8F
oot0
9F
oot1
0T
est
Lan
yar
dM
in
Max
M
in
Max
M
in
Max
M
in
Max
M
in
Max
M
in
Max
M
in
Max
M
in
Max
P
osi
tion
T0
1
-0.0
3
6.3
8
-0.0
8
0.3
1
-0.2
9
0.2
1
-0.5
4
1.2
9
-0.7
8
3.3
5
-0.4
2
0.1
3
-3.2
3
4.6
8
-0.3
6
2.3
0
-0.9
8
1.0
4
T0
2
-0.0
2
6.7
3
-0.2
5
0.2
1
-0.2
0
0.1
8
-0.2
9
1.3
9
-0.6
8
3.0
0
-0.4
2
0.1
0
-3.3
7
4.7
9
-0.6
0
2.5
7
-0.7
6
0.6
5
T0
3
-0.0
2
6.9
2
-0.1
7
0.2
0
-0.1
7
0.1
8
-0.2
2
1.4
7
-0.6
3
2.7
2
-0.3
9
0.0
6
-3.3
7
4.7
1
-0.6
9
2.6
3
-0.6
0
0.7
4
T0
4
-0.0
2
5.8
5
-0.1
6
0.1
8
-0.1
7
0.1
6
-0.2
8
1.4
2
-0.5
5
2.9
8
-0.3
0
0.1
2
-3.0
3
3.9
9
-0.2
4
2.2
2
-0.6
0
0.7
0
T0
5
-0.0
1
5.7
3
-0.1
6
0.2
1
-0.1
7
0.1
5
-0.2
5
1.5
2
-0.5
3
2.9
9
-0.3
1
0.0
8
-2.8
8
3.9
1
-0.2
4
2.4
2
-0.7
5
0.9
7
T0
6
-0.0
3
9.2
4
-0.2
7
0.3
3
-0.3
3
0.2
6
-0.4
3
1.3
7
-0.8
2
3.2
0
-0.6
8
0.1
6
-3.3
5
6.2
0
-0.6
2
3.9
6
-0.7
5
0.9
7
T0
7
-0.0
2
9.2
5
-0.2
0
0.3
3
-0.4
7
0.2
3
-0.4
1
1.4
5
-0.6
2
3.6
1
-0.6
7
0.1
9
-3.5
1
6.1
1
-0.6
1
3.8
2
-0.8
1
1.3
2
T0
8
-0.0
1
10
.41
-0
.16
0
.37
-0
.20
0
.21
-0
.35
1
.32
-0
.47
2
.37
-0
.72
0
.15
-3
.49
7
.08
-1
.68
4
.94
-0
.39
0
.59
T0
9
-0.0
3
6.5
6
-0.4
5
0.5
7
-0.7
4
0.3
2
-0.5
2
2.8
9
-0.6
7
4.2
4
-0.4
2
0.4
7
-3.4
9
2.2
4
-0.8
0
1.1
9
-1.7
3
1.3
0
T1
0
-0.0
3
7.0
0
-0.5
7
0.3
9
-0.6
5
0.2
8
-0.6
6
2.3
5
-1.4
3
3.1
8
-0.8
3
0.3
9
-2.1
4
2.4
7
-1.0
9
1.2
6
-2.2
5
0.4
7
T1
1
-0.0
1
7.0
4
-0.6
6
0.3
2
-0.6
7
0.2
6
-0.6
1
2.9
8
-1.4
5
3.0
2
-0.6
1
0.4
1
-2.1
1
2.4
9
-1.4
1
1.0
0
-2.3
1
0.4
1
T1
2
-0.0
2
6.1
7
-0.5
2
0.3
1
-0.6
3
0.2
5
-0.5
1
2.7
9
-1.4
2
2.7
3
-0.6
2
0.3
5
-1.7
9
2.8
4
-1.1
2
1.2
1
-2.1
8
0.8
1
T1
3
-0.0
4
8.2
0
-0.7
3
0.7
3
-0.8
0
0.1
7
-0.6
9
2.5
6
-1.4
8
3.2
4
-1.1
0
0.4
7
-1.6
3
2.6
7
-1.5
8
0.9
7
-2.3
6
0.8
0
T1
4
-0.0
1
7.7
8
-0.3
2
0.2
2
-0.1
2
0.0
8
-0.1
8
0.1
9
-0.1
6
0.4
3
-0.2
1
0.1
4
-0.9
1
1.3
5
-0.8
9
6.4
8
-1.2
4
1.4
0
T1
5
-0.0
1
7.7
8
-0.3
2
0.2
2
-0.1
2
0.0
8
-0.1
8
0.1
9
-0.1
6
0.4
3
-0.2
1
0.1
4
-0.9
1
1.3
5
-0.8
9
6.4
8
-1.2
4
1.4
0
T1
6
-0.0
1
8.0
8
-0.2
7
0.2
2
-0.1
3
0.0
9
-0.1
7
0.1
9
-0.2
3
0.3
4
-0.2
4
0.1
2
-0.6
3
1.4
0
-1.0
6
6.7
4
-1.0
8
1.2
3
T1
7
-0.0
1
6.7
1
-0.6
4
0.7
0
-0.4
8
0.4
4
-0.7
6
3.0
9
-0.9
3
1.8
7
-0.4
1
0.5
3
-2.2
1
1.8
0
-1.4
7
1.7
8
-1.7
4
2.1
4
T1
8
-0.0
2
7.3
4
-0.4
7
0.9
4
-0.6
7
0.4
6
-0.8
9
3.3
4
-1.2
8
1.9
7
-0.3
2
0.5
1
-2.2
9
2.5
9
-1.4
9
1.4
6
-2.7
4
0.9
0
T1
9
-0.0
5
6.5
2
-0.4
0
0.7
4
-0.7
2
0.3
5
-1.0
4
2.8
9
-1.5
1
1.6
5
-0.2
8
0.4
1
-1.9
9
2.7
7
-1.4
5
1.6
6
-2.6
5
0.5
7
T2
0T
est
Vo
id
T2
1
-0.0
3
8.0
1
-0.4
4
0.3
5
-0.3
1
0.2
6
-0.1
9
0.1
7
-1.3
1
1.1
3
-0.3
4
0.3
5
-1.8
5
6.9
1
-0.3
2
1.0
4
-1.6
7
1.1
5
T2
2T
est
Void
T2
3
-0.0
2
7.4
7
-0.4
3
0.2
4
-0.2
6
0.2
9
-0.1
5
0.1
8
-1.1
0
0.8
2
-0.3
0
0.2
9
-1.9
8
6.4
2
-0.3
6
0.5
7
-1.3
0
0.9
5
T2
4
-0.0
2
6.9
7
-0.5
0
0.1
3
-0.2
3
0.2
3
-0.1
1
0.1
8
-0.9
5
0.7
3
-0.2
4
0.2
6
-1.7
9
6.2
1
-0.4
1
0.5
9
-1.1
7
1.0
0
T2
5
-0.0
2
6.2
5
-0.7
9
0.3
0
-0.4
4
0.4
1
-0.4
7
0.6
5
-1.3
2
3.3
0
-0.4
1
0.6
1
-1.4
8
3.2
8
-0.8
5
1.1
0
-1.7
1
0.7
3
T2
6
-0.0
2
6.3
7
-0.9
3
0.3
1
-0.4
5
0.3
8
-0.3
1
0.6
9
-1.3
8
2.9
1
-0.3
8
0.5
5
-1.6
9
3.8
8
-0.7
4
0.7
6
-1.4
8
1.3
4
T2
7
-0.0
2
6.4
2
-0.7
5
0.5
5
-0.5
6
0.2
8
-0.5
0
0.7
4
-1.5
2
3.1
7
-0.3
3
0.6
6
-1.6
7
3.8
1
-0.6
9
1.0
7
-1.6
2
0.7
7
19
Lan
yar
d
Fo
ot0
1
Fo
ot0
2
Foot0
4
Foot0
3
Foot0
7
Foot0
8
Foot0
9
Foot1
0
Tes
tM
in
Max
M
in
Max
M
in
Max
M
in
Max
M
in
Max
M
in
Max
M
in
Max
M
in
Max
M
in
Max
P
osi
tion
T28
-0
.02
7
.15
-0
.44
0
.26
-0
.26
0
.32
-0
.64
0
.49
-1
.37
2
.58
-0
.74
0
.40
-2
.54
4
.77
-1
.12
3
.46
-1
.73
1
.41
T29
-0
.03
7
.34
-0
.40
0
.27
-0
.33
0
.30
-0
.49
0
.67
-1
.35
2
.85
-0
.71
0
.46
-2
.94
4
.73
-0
.96
3
.57
-1
.48
1
.71
T30
-0
.02
7
.34
-0
.49
0
.18
-0
.29
0
.28
-0
.32
0
.67
-1
.41
2
.67
-0
.65
0
.40
-2
.79
4
.50
-1
.00
4
.21
-1
.56
1
.73
T31
-0
.02
6
.02
-0
.52
0
.30
-0
.81
0
.24
-0
.66
3
.00
-1
.83
3
.23
-0
.63
0
.53
-3
.03
5
.42
-0
.90
1
.08
-2
.21
1
.77
T32
-0
.01
6
.72
-0
.92
0
.21
-0
.88
0
.28
-0
.89
3
.19
-1
.94
2
.97
-0
.67
0
.50
-3
.07
6
.09
-1
.27
1
.29
-2
.66
1
.54
T33
-0
.01
5
.86
-0
.78
0
.21
-0
.78
0
.29
-1
.18
2
.89
-1
.95
3
.20
-0
.69
0
.41
-3
.13
5
.29
-1
.53
1
.68
-3
.02
1
.20
T34
-0
.01
5
.16
-0
.72
0
.22
-0
.53
0
.36
-0
.75
1
.81
-2
.01
3
.11
-0
.67
0
.36
-2
.76
5
.56
-0
.52
1
.77
-2
.33
1
.13
T35
-0
.02
5
.39
-0
.67
0
.18
-0
.58
0
.23
-0
.90
1
.35
-2
.14
2
.71
-0
.72
0
.37
-2
.67
5
.62
-0
.55
1
.39
-2
.49
1
.47
T36
-0
.01
6
.07
-0
.74
0
.35
-0
.76
0
.27
-0
.86
1
.62
-2
.13
2
.56
-0
.66
0
.33
-2
.14
6
.32
-0
.84
1
.14
-2
.60
1
.46
T37
-0
.02
5
.82
-0
.67
0
.14
-0
.21
0
.39
-0
.48
1
.02
-1
.72
2
.28
-0
.60
0
.33
-2
.20
4
.61
-0
.64
1
.37
-1
.78
1
.06
T38
-0
.03
6
.51
-0
.81
0
.35
-0
.25
0
.25
-0
.36
1
.04
-1
.57
2
.27
-0
.52
0
.48
-2
.50
5
.14
-0
.41
1
.21
-1
.74
1
.28
T39
-0
.01
6
.36
-0
.66
0
.68
-0
.23
0
.29
-0
.44
0
.89
-1
.67
2
.06
-0
.37
0
.49
-1
.71
5
.27
-0
.40
0
.90
-1
.09
1
.65
T40
-0
.02
5
.61
-0
.43
0
.28
-0
.22
0
.23
-0
.51
0
.79
-1
.46
2
.10
-0
.42
0
.33
-2
.03
1
.91
-0
.33
5
.18
-1
.44
1
.30
T41
-0
.03
6
.32
-0
.40
0
.36
-0
.22
0
.24
-0
.42
0
.95
-1
.38
2
.19
-0
.42
0
.37
-2
.17
1
.72
-0
.49
5
.61
-1
.65
1
.32
T42
-0
.02
6
.35
-0
.45
0
.27
-0
.19
0
.20
-0
.46
0
.78
-1
.21
2
.12
-0
.52
0
.25
-2
.21
1
.71
-0
.55
5
.69
-1
.00
1
.40
T43
-0
.01
4
.93
-0
.81
0
.15
-0
.80
0
.23
-0
.91
3
.83
-2
.01
1
.99
-0
.54
0
.35
-2
.41
3
.68
-1
.69
2
.06
-2
.43
2
.04
T44
-0
.01
5
.75
-0
.80
0
.27
-0
.80
0
.32
-1
.26
4
.19
-1
.80
2
.38
-0
.51
0
.40
-2
.70
3
.66
-1
.85
2
.29
-3
.19
1
.44
T45
-0
.02
5
.49
-0
.71
0
.26
-0
.72
0
.28
-1
.30
3
.25
-1
.83
2
.62
-0
.54
0
.46
-2
.82
4
.47
-1
.81
1
.82
-3
.35
1
.07
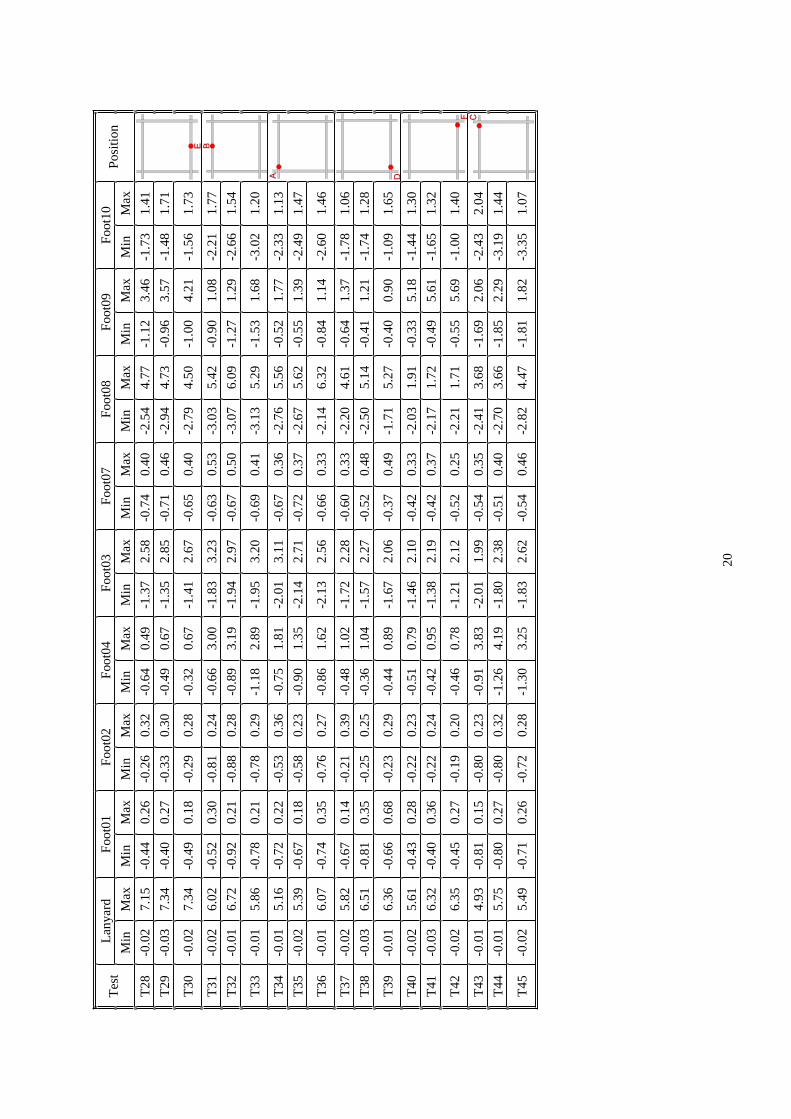
20

Lan
yar
d
Fo
ot0
1
Fo
ot0
2
Foot0
4
Foot0
3
Foot0
7
Foot0
8
Foot0
9
Foot1
0
Tes
tM
in
Max
M
in
Max
M
in
Max
M
in
Max
M
in
Max
M
in
Max
M
in
Max
M
in
Max
M
in
Max
P
osi
tion
T46
-0
.01
4
.53
-1
.48
0
.44
-0
.52
0
.24
-0
.91
1
.13
-2
.84
0
.79
-1
.14
0
.63
-0
.86
4
.71
-0
.91
2
.62
-3
.34
2
.18
T47
-0
.01
6
.01
-0
.81
0
.79
-0
.27
0
.18
-0
.80
1
.35
-1
.34
1
.31
-0
.60
0
.43
-0
.90
4
.27
-0
.94
2
.45
-3
.03
2
.63
T48
-0
.01
5
.66
-0
.92
1
.03
-0
.18
0
.29
-0
.95
1
.19
-1
.19
1
.21
-0
.71
0
.41
-0
.91
4
.30
-1
.12
2
.44
-3
.22
2
.29
T4
9T
est
Vo
id
T50
-0
.06
0
.06
-0
.52
0
.10
-0
.18
0
.25
-0
.74
0
.17
-1
.55
1
.42
-0
.74
0
.33
-1
.80
3
.40
-0
.84
2
.44
-2
.93
1
.36
T51
0
.00
6
.68
-0
.58
0
.23
-0
.21
0
.25
-0
.84
0
.18
-1
.70
1
.68
-0
.83
0
.48
-2
.46
4
.55
-1
.49
3
.74
-3
.15
1
.59
T52
-0
.01
5
.50
-1
.08
0
.30
-0
.62
0
.33
-0
.65
1
.26
-2
.09
4
.40
-0
.96
0
.48
-3
.91
3
.70
-1
.67
2
.13
-4
.25
1
.38
T53
-0
.01
6
.58
-1
.17
0
.34
-0
.79
0
.35
-1
.03
1
.69
-3
.20
3
.93
-1
.07
0
.73
-3
.42
5
.97
-2
.66
2
.40
-5
.21
0
.89
T54
-0
.02
6
.42
-0
.91
0
.57
-0
.75
0
.38
-1
.11
1
.53
-3
.16
3
.76
-1
.20
0
.63
-3
.37
5
.95
-2
.79
2
.59
-5
.63
0
.62
T5
5T
est
Vo
id
T56
-0
.02
5
.23
-0
.75
0
.44
-0
.42
0
.37
-1
.16
1
.63
-3
.29
3
.36
-0
.95
0
.49
-3
.32
4
.44
-2
.68
2
.40
-5
.60
0
.42
T57
-0
.02
5
.35
-0
.89
0
.31
-0
.46
0
.34
-1
.29
1
.62
-3
.39
3
.34
-0
.92
0
.51
-3
.42
4
.57
-2
.72
2
.40
-5
.58
0
.58
T58
-0
.02
5
.43
-1
.10
0
.36
-0
.46
0
.32
-1
.27
1
.66
-3
.35
3
.32
-0
.88
0
.54
-3
.38
4
.51
-2
.93
2
.46
-5
.50
0
.61
T59
-0
.02
6
.20
-0
.77
0
.23
-0
.27
0
.34
-1
.16
0
.60
-2
.67
3
.61
-1
.04
0
.44
-3
.29
3
.27
-2
.29
5
.16
-5
.48
0
.40
T60
-0
.02
7
.27
-0
.64
0
.31
-0
.24
0
.37
-1
.01
0
.54
-2
.59
3
.51
-0
.98
0
.47
-3
.29
3
.25
-2
.56
5
.90
-5
.30
0
.74
T61
-0
.02
7
.12
-0
.68
0
.35
-0
.26
0
.35
-0
.98
0
.43
-2
.55
3
.53
-0
.95
0
.42
-3
.29
3
.23
-2
.73
6
.03
-5
.18
0
.70
T62
-0
.01
4
.92
-0
.82
0
.25
-0
.25
0
.31
-0
.80
0
.33
-1
.49
3
.33
-0
.92
0
.44
-2
.54
5
.07
-1
.39
2
.10
-4
.66
1
.11
T63
-0
.01
5
.73
-0
.83
0
.30
-0
.25
0
.36
-0
.90
0
.41
-1
.52
3
.39
-1
.04
0
.44
-2
.72
5
.57
-1
.46
1
.72
-4
.66
0
.66
T64
-0
.01
5
.88
-0
.86
0
.30
-0
.28
0
.35
-0
.91
0
.43
-1
.74
3
.15
-1
.03
0
.44
-2
.78
5
.74
-1
.29
1
.90
-4
.74
0
.95
T65
-0
.02
5
.66
-1
.11
0
.34
-0
.29
0
.40
-1
.01
0
.48
-1
.65
3
.85
-1
.14
0
.47
-2
.99
5
.44
-1
.67
2
.06
-4
.78
1
.73
T66
-0
.01
4
.99
-0
.85
0
.57
-0
.41
0
.31
-0
.83
0
.48
-1
.62
3
.54
-0
.84
0
.62
-3
.03
4
.60
-1
.41
1
.97
-4
.48
1
.49
T67
-0
.01
5
.68
-1
.32
0
.63
-0
.38
0
.42
-1
.00
0
.65
-2
.43
3
.77
-1
.19
0
.57
-3
.26
5
.74
-1
.79
2
.60
-5
.22
0
.96
T68
0
.00
6
.04
-1
.52
0
.37
-0
.43
0
.42
-1
.03
0
.62
-2
.54
3
.84
-1
.27
0
.62
-3
.18
5
.99
-1
.81
2
.36
-5
.17
1
.30
21

22

8A
PP
EN
DIX
C –
SA
MP
LE
GR
AP
HS
23
Fo
ot0
1
Force (kN)
-20246F
oo
t02
Fo
ot0
3F
oo
t04
Fo
ot0
5
Fo
ot0
6
Force (kN)
-20246F
oo
t07
Fo
ot0
8F
oo
t09
Fo
ot1
0
Lan
yard
& T
ie
-202468
10
Te
st
T1
6
2n
dL
ift
Rig
ht
Lo
we
r L
ed
ge
r
Force (kN)
0.0
0.5
1.0
1.5
2.0

24
Fo
ot0
1Force (kN)
-20246F
oo
t02
Fo
ot0
3F
oo
t04
Foo
t05
Fo
ot0
6
Force (kN)
-20246F
oo
t07
Fo
ot0
8F
oo
t09
Fo
ot1
0
La
nya
rd &
Tie
0.0
0.5
1.0
1.5
2.0
Force (kN)
-202468
10
Te
st
T3
9
3n
dL
ift
Le
ft L
ow
er
Le
dg
er

Fo
ot0
1Force (kN)
-20246F
oo
t02
Fo
ot0
3F
oo
t04
Foo
t05
Fo
ot0
6
Force (kN)
-20246F
oo
t07
Fo
ot0
8F
oo
t09
Fo
ot1
0
La
nya
rd &
Tie
0.0
0.5
1.0
1.5
2.0
Force (kN)
-202468
10
Te
st
T6
8
4th
Lif
tU
pp
er
Le
ft L
ed
ge
r
25