project - loan proposal - capex - 2009
TRANSCRIPT

M a n i s h B a l l a l ( 1 9 )
N i r a j K o t h a w a d e ( 2 4 )
R a j e e v T i w a r i ( 2 8 )
S a i r a m I y e r ( 3 4 )
S a n d e e p V a d n e r e ( 3 6 )
CAPEX Project :Proposal for Term Loan

INTRODUCTION ....................................................................................................................................................................... 3
PROMOTER PROFILE AND COMPANY MANAGEMENT ............................................................................................................... 3
KEY BUSINESS ACTIVITIES OF THE COMPANY ............................................................................................................................ 3
MODEL 1 ............................................................................................................................................................................................ 3 MODEL 2 ............................................................................................................................................................................................ 4
CLIENTS : ................................................................................................................................................................................. 4
ASSETS OWNED : ..................................................................................................................................................................... 4
ABOUT XLRI : ...................................................................................................................................................................................... 5 ABOUT GMP : ..................................................................................................................................................................................... 5 SCOPE OF BUSINESS: .............................................................................................................................................................................. 5
RESOURCE REQUIREMENT ....................................................................................................................................................... 5
CLASSROOMS: ...................................................................................................................................................................................... 5 FACULTY: ............................................................................................................................................................................................ 5 STUDY MATERIAL & ADMINISTRATIVE RESOURCES: ...................................................................................................................................... 6
ASSUMPTIONS ......................................................................................................................................................................... 6
STATEMENT OF INTEGRITY AND FINANCIAL HEALTH OF PROMOTERS ....................................................................................... 6
OLD FINANCIAL STATEMENTS .................................................................................................................................................. 6
OLD Operations P&L .................................................................................................................................................................... 6 OLD Cash Flow Statement ........................................................................................................................................................... 8 OLD Balance Sheet ...................................................................................................................................................................... 9
DCF VALUATION ...................................................................................................................................................................... 9
LOAN AMOUNT, AMORTIZATION SCHEDULE & FINAL PAYMENT SCHEDULE ............................................................................ 10
NEW FINANCIAL STATEMENT PROJECTIONS ........................................................................................................................... 12
NEW P&L STATEMENT PROJECTION ....................................................................................................................................................... 12 NEW CASH FLOW STATEMENT PROJECTION ............................................................................................................................................. 17 NEW BALANCE SHEET PROJECTION ........................................................................................................................................................ 19
STATEMENT OF FINANCIAL RATIOS ANALYSIS ........................................................................................................................ 21
DSCR .......................................................................................................................................................................................... 21 ISCR ............................................................................................................................................................................................ 21
CONCLUSION ......................................................................................................................................................................... 24

Introduction
Modern Facility Management Ltd. Headquartered in Mumbai is a company specializing in facilities management of international standards. The company has experience of more than 15 years in the facilities domain. With more than permanent 150 employees working across India on various projects and, MFM has achieved a considerable recognition in the market as a trusted partner in the facilities management domain. The company’s core competence lies in handling big facilities management projects at a high operational efficiency. The company boasts of a list of many satisfied clientele including premiere Management and Engineering Institutes in India.
Promoter Profile and company management
Our organization is privately held and promoted and managed jointly by 5 individuals. The promoters have a significant amount of work experience and are considered as experts in their respective areas. With a proven track record of excellent performance and value delivery to stakeholders, our organization is building a roadmap to stretch the existing business model across South East Asia. A brief about their background and the positions held by each of the promoters in the organisation is as given below
1. Sandeep Vadnere is the CFO of the company with nearly 10 years of experience in the finance domain. He has worked with African Development Bank in Tunisia and has been actively involved in funding developmental projects in the African Continent. He has a post graduate degree in Economics from Delhi School of Economics.
2. Manish Ballal is the CMO of the company. He has nearly 8 years of marketing experience in Coke and he also handles the Public Relations and Communications portfolio.
3. Niraj Kothawade is the CEO of the organisation. Prior to promoting the company,Niraj has worked extensively as a management consultant in Risk Management Domain. Niraj is an alumnus of XLRI’s Executive Program in General Management.
4. Sairam Iyer is the COO of the company. He has nearly 15 years of experience in service delivery and customer support.
5. Rajeev Tiwari is the CIO of the company and is responsible for the technology strategy. He is instrumental in driving the technological transformation in the company.
Key business activities of the company
Modern Facility Management is primarily engaged in facilities management for academic institutes. The company follows two business models. The characteristics of the model are given below:
Model 1
• The company does not own the assets, i.e classrooms which are effectively owned by the institute. • The ownership of operational expenses i.e, maintenance and housekeeping lies with the institute.

Model 2
• The company acquires the assets i.e classrooms from the institute and has full control over the cash inflows and outflows.
• The company needs to bear the maintenance and operational expenses.
Clients :
Some of the clients with whom we have been working during the last year are as follows:
NIT Jamshedpur : Facilities Management of Classrooms
IIT Guwahati : Management of Sports Complex and Classrooms.
Anna University : Facilities Management of BE III and IV ( Computer Science ) which resulted in 15% cost savings for the institute.
NIFT Hyderabad : Facilities Management of the Fashion Design Course.
Assets owned :
The company has many assets owned at prominent locations. Few of them are as below :
Assets Asset Location Asset Description Mozart and Beethoven(classrooms)
NIFT Hyderabad Two classrooms of capacity 65 each
BE II and BE III Classrooms RKNEC , Nagpur Two classrooms of capacity 100 each
Academic Centre Indira Institute of Plant Research and Microbiology,Pune
Academic centre with capacity of 150 in the heart of the city
Proposal:
To operate GMP course at XLRI Jamshedpur based on model 2
Our organization has achieved a competence in handling facilities management projects in academic institutes. Because of our learning curve in this domain , we have been able to create a win – win situation for our partners.The best example is the Anna University’s facilities management project which resulted in a 15% cost savings for the university which made them make the cash available for other productivity and value drivers.

About XLRI :
XLRI is one of the most reputed management institutes in India offering Post Graduate Diploma Courses in Management. It is recognized as one of the top most B‐Schools in Asia for Business and Human Resources.
About GMP :
This is one year full‐time residential program. Candidates applying for One Year General Management programme must hold a minimum of three years Bachelor's Degree from a recognized University in India/abroad in any discipline, be employed in a full‐time job, must have at least five years of relevant managerial experience.
The programme consists of Core & Optional courses specially designed for fast track executives with work experience. The curriculum lays the foundation for a conceptual and analytical understanding of Indian and international business. XLRI's GMP programme is designed to closely integrate current management theory and practice. The course imparts knowledge and fosters attitudes essential for the growth of students into competent, responsible managers. The course has an evolving programme content and is constantly updated to be in tune with the emerging trends. They provide the essentials of management education with the flexibility of individual exploration in their chosen area of interest. Currently the core courses are categorized into seven major areas, Finance & Accounts, Marketing, Production & Operation, Information Systems, Human Resource Management & Organizational Behaviour, Economics, and Strategy, providing not only the essentials of management but also the core functional skills.Successful completion of the core courses makes the way for the elective courses, chosen by the participants, helping them to further their areas of interest.
Scope of business:
Scope of business is restricted to the operation of GMP course. Selection, admission and registration of the participant shall be done on the part of XLRI. There after XYZ educations pvt ltd. shall take over. Placements of the participation shall be the responsibility of XLRI administration and XYZ shall have no say/responsibility regarding the process.
Resource requirement
Classrooms:
Classrooms (2 in nos.) equipped with latest facilities shall be required. XYZ educations pvt. ltd. proposes to purchase LH‐4 & LH‐8 from XLRI in this regard.
Faculty:
Modern Facility Management ltd. proposes to undergo legal contract agreement with M/s XLRI to provide for faculty from XLRI faculty pool. Mutual consensus between both the parties has been arrived in this regard.

Study material & Administrative resources:
Modern Facility Management ltd. shall use the available infrastructure at XLRI for preparation of study material and other administrative purposes.
Assumptions
1. DCF Valuation comes to about Rs. 694872020.3 2. Promoter’s Share Capital assumed to be Rs. 138974404.1 3. Rate of increase of Faculty Remuneration = 20% per annum 4. Number of courses assumed to be 28 in term 1 & 2 and 40 in term 3 & 4. 5. Repairs and maintenance expenses and Office expenses are shared for all programs. Hence
for GMP we are assuming it to be one‐third. 6. Repairs and Maintenance and Office expenses assumed to increase @ 10% annually. 7. Depreciation for building assumed 1000000 per year 8. Interest rate on term loan = 12%annually 9. Placement and international immersion is out of scope 10. Tuition and other fees assumed to increase @ 20% per year 11. Number of students is 100 for Yr‐0 to Yr‐2,110 for Yr‐3 & Yr‐4 & 120 for Yr‐5 & Yr‐6. Finally
from Yr‐7 onwards the student intake is taken as 130 12. For breakeven analysis, we are assuming faculty renumeration as variable cost. Building cost,
Repairs and maintainance, Office expenses and interest on loan payments are taken as fixed costs.
13. Hurdle rate assumed to be 15% 14. Admission process will be taken care by XLRI
Statement of Integrity and Financial health of promoters
We, the promoters declare that the above mentioned details are true to the best of our knowledge. We also agree to the fact, that any information found otherwise can be held against us and lead to the cancellation of the loan application.
The promoters are of sound financial health and we would stand as a personal guarantor for the loan amount requested by Modern Facility Management ltd.
Old Financial Statements
OLD Operations P&L
2009‐10 2010‐11 2011‐12 2012‐13 2013‐14 Turnover
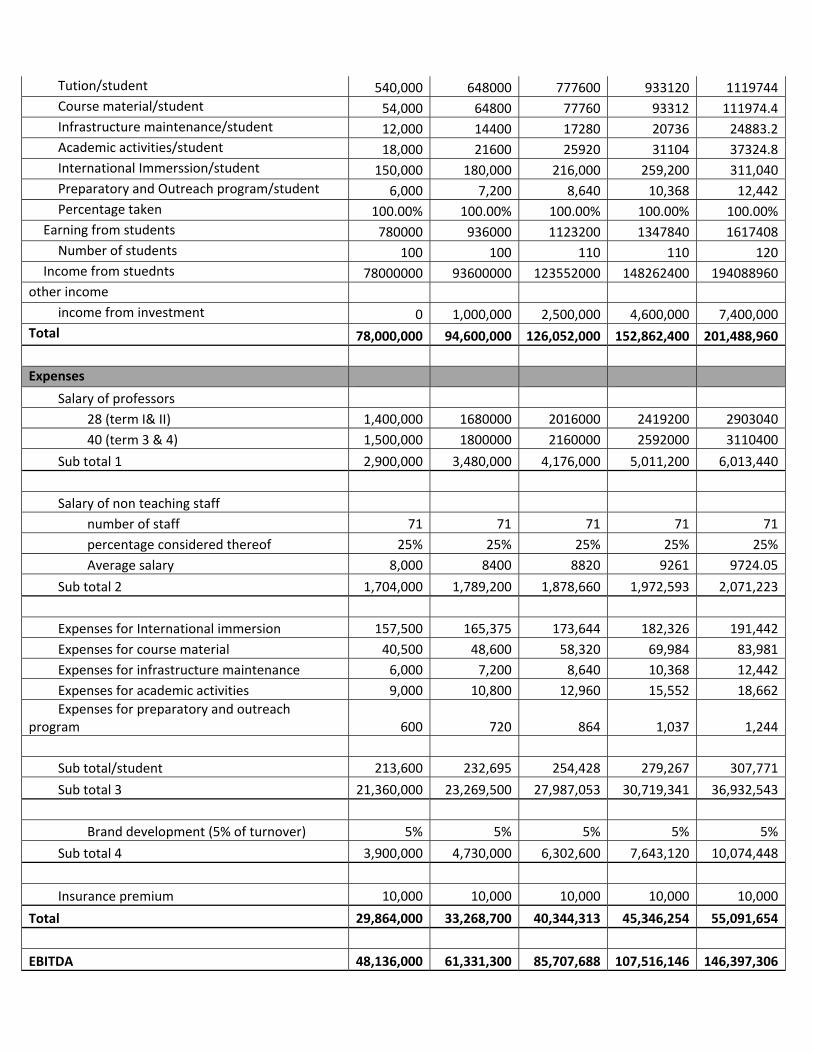
Tution/student 540,000 648000 777600 933120 1119744Course material/student 54,000 64800 77760 93312 111974.4Infrastructure maintenance/student 12,000 14400 17280 20736 24883.2Academic activities/student 18,000 21600 25920 31104 37324.8International Immerssion/student 150,000 180,000 216,000 259,200 311,040Preparatory and Outreach program/student 6,000 7,200 8,640 10,368 12,442Percentage taken 100.00% 100.00% 100.00% 100.00% 100.00%
Earning from students 780000 936000 1123200 1347840 1617408Number of students 100 100 110 110 120
Income from stuednts 78000000 93600000 123552000 148262400 194088960other income
income from investment 0 1,000,000 2,500,000 4,600,000 7,400,000Total 78,000,000 94,600,000 126,052,000 152,862,400 201,488,960
Expenses
Salary of professors 28 (term I& II) 1,400,000 1680000 2016000 2419200 290304040 (term 3 & 4) 1,500,000 1800000 2160000 2592000 3110400
Sub total 1 2,900,000 3,480,000 4,176,000 5,011,200 6,013,440
Salary of non teaching staff
number of staff 71 71 71 71 71percentage considered thereof 25% 25% 25% 25% 25%Average salary 8,000 8400 8820 9261 9724.05
Sub total 2 1,704,000 1,789,200 1,878,660 1,972,593 2,071,223
Expenses for International immersion 157,500 165,375 173,644 182,326 191,442Expenses for course material 40,500 48,600 58,320 69,984 83,981Expenses for infrastructure maintenance 6,000 7,200 8,640 10,368 12,442Expenses for academic activities 9,000 10,800 12,960 15,552 18,662Expenses for preparatory and outreach
program 600 720 864 1,037 1,244 Sub total/student 213,600 232,695 254,428 279,267 307,771
Sub total 3 21,360,000 23,269,500 27,987,053 30,719,341 36,932,543
Brand development (5% of turnover) 5% 5% 5% 5% 5%
Sub total 4 3,900,000 4,730,000 6,302,600 7,643,120 10,074,448
Insurance premium 10,000 10,000 10,000 10,000 10,000
Total 29,864,000 33,268,700 40,344,313 45,346,254 55,091,654
EBITDA 48,136,000 61,331,300 85,707,688 107,516,146 146,397,306

Depreciation for FA 1,000,000 1,000,000 1,000,000 1,000,000 1,000,000 Preliminary expenses written off Interest
PBT 47,136,000 60,331,300 84,707,688 106,516,146 145,397,306
Tax @ 33.66% 15,865,978 20,307,516 28,512,608 35,853,335 48,940,733 PAT 31,270,022 40,023,784 56,195,080 70,662,811 96,456,573 Dividend payout ratio 0% 0% 0% 0% 0% Dividend 0 0 0 0 0 Retained earnings 31,270,022 40,023,784 56,195,080 70,662,811 96,456,573
Reserves and surplus 31,270,022 71,293,807 127,488,887 198,151,698 294,608,271
OLD Cash Flow Statement
2009‐10 2010‐11 2011‐12 2012‐13 2013‐14 Inflows EBITDA 48,136,000 61,331,300 85,707,688 107,516,146 146,397,306Issue of equity 0 0 0 0 0Debt 0 0 0 0 0
TOTAL 48,136,000 61,331,300 85,707,688 107,516,146 146,397,306
outflows Investment of FA 0 Purchase of investment 0 5,000,000 7,500,000 10,500,000 14,000,000Repayment of loan 0 0 0 0 0Prepaid expenses 0 Interest on bank borrowings 0 0 0 0 0Tax payed 15,865,978 20,307,516 28,512,608 35,853,335 48,940,733Dividend 0 0 0 0 0
TOTAL 15,865,978 25,307,516 36,012,608 46,353,335 62,940,733
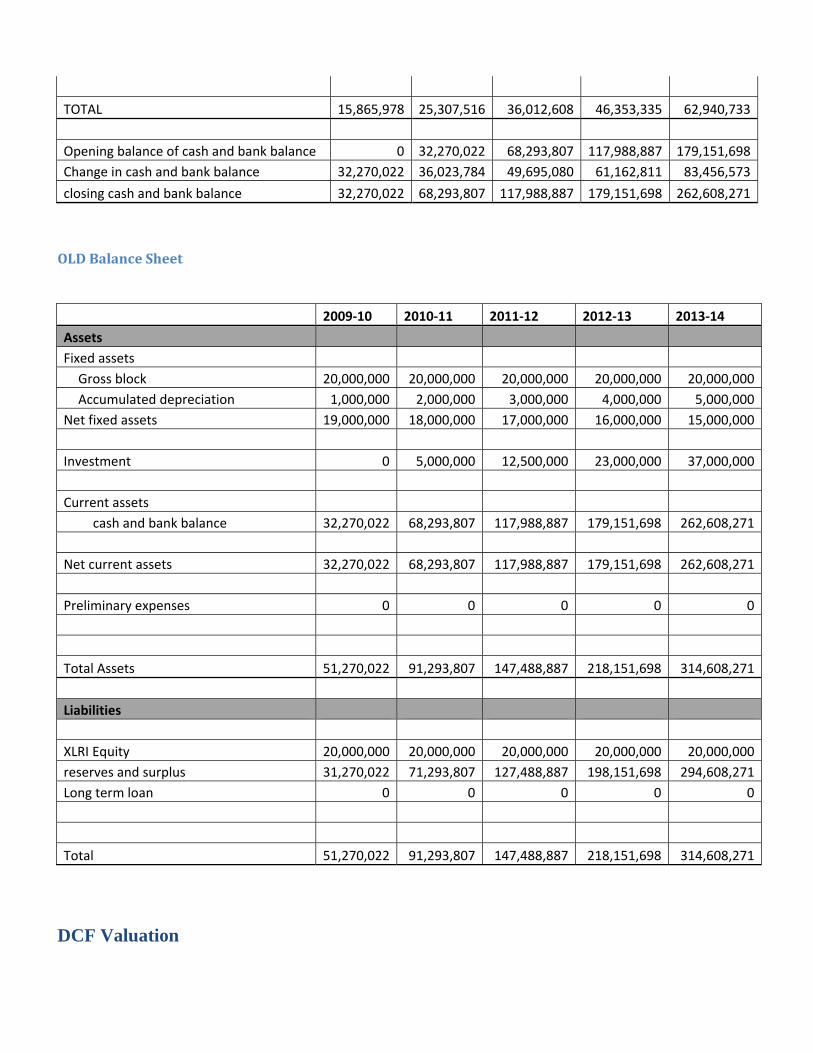
Opening balance of cash and bank balance 0 32,270,022 68,293,807 117,988,887 179,151,698Change in cash and bank balance 32,270,022 36,023,784 49,695,080 61,162,811 83,456,573
closing cash and bank balance 32,270,022 68,293,807 117,988,887 179,151,698 262,608,271
OLD Balance Sheet
2009‐10 2010‐11 2011‐12 2012‐13 2013‐14
Assets Fixed assets Gross block 20,000,000 20,000,000 20,000,000 20,000,000 20,000,000Accumulated depreciation 1,000,000 2,000,000 3,000,000 4,000,000 5,000,000
Net fixed assets 19,000,000 18,000,000 17,000,000 16,000,000 15,000,000 Investment 0 5,000,000 12,500,000 23,000,000 37,000,000 Current assets
cash and bank balance 32,270,022 68,293,807 117,988,887 179,151,698 262,608,271
Net current assets 32,270,022 68,293,807 117,988,887 179,151,698 262,608,271 Preliminary expenses 0 0 0 0 0
Total Assets 51,270,022 91,293,807 147,488,887 218,151,698 314,608,271
Liabilities XLRI Equity 20,000,000 20,000,000 20,000,000 20,000,000 20,000,000reserves and surplus 31,270,022 71,293,807 127,488,887 198,151,698 294,608,271Long term loan 0 0 0 0 0
Total 51,270,022 91,293,807 147,488,887 218,151,698 314,608,271
DCF Valuation

1 2 3 4 5
2009‐10 2010‐11 2011‐12 2012‐13 2013‐14
Cash Inflow (PAT + Dep) 32,270,022 41,023,784 57,195,080 71,662,811 97,456,573 DF ‐ 15% 0.8695652 0.7561437 0.6575162 0.5717532 0.49717674
Value of all cash flows from year 5 onwards 1023294015 Present Value 28060889 31019875 37606693 40973445 557211118
Total Present Value 694872020
6 7 8 9 10
2014‐15 2015‐16 2016‐17 2017‐18 2018‐19
Cash Inflow (PAT + Dep) 102329401 107445871.5 112818165.1 118459073.4 124382027
Assumptions: 1) 20% growth assumed for 5 years and 5% growth assumed after 5 years. 2) Discount factor assumed to be 15%
Total Present Value 694872020.3 Equity 138974404.1 Debt 555897616.2 Bank Loan ‐12% 166769284.9
Pending amount 389128331.4
Upfront payment to XLRI 305743688.9
Pending amount after 5 years 782676066.1
Loan Amount, Amortization Schedule & Final Payment Schedule

Yearly Payment of Bank Loan 29,515,522.49 Yearly Payment of XL payments 138,521,269.37
BANK LOAN AMORTIZATION SCHEDULE Year Interest Principal Total amount Pending Balance
1 20012314.18 9,503,208.31 29,515,522.49 157,266,076.56 2 18871929.19 10,643,593.30 29,515,522.49 146,622,483.26 3 17594697.99 11,920,824.50 29,515,522.49 134,701,658.76 4 16164199.05 13,351,323.44 29,515,522.49 121,350,335.32 5 14562040.24 14,953,482.25 29,515,522.49 106,396,853.07 6 12767622.37 16,747,900.12 29,515,522.49 89,648,952.95 7 10757874.35 18,757,648.14 29,515,522.49 70,891,304.81 8 8506956.578 21,008,565.91 29,515,522.49 49,882,738.90 9 5985928.668 23,529,593.82 29,515,522.49 26,353,145.08
10 3162377.41 26,353,145.08 29,515,522.49 0.00
FINAL PAYMENT SCHEDULE
Year Cash Inflow Bank Loan Payment Payment to XL Final Cash flow for equity shareholders
1 32,270,022 29,515,522.49 0 2,754,499.910069952 41,023,784 29,515,522.49 0 11,508,261.930069903 57,195,080 29,515,522.49 0 27,679,557.397570004 71,662,811 29,515,522.49 0 42,147,288.683544905 97,456,573 29,515,522.49 67,941,050.32705500
6 102329401.5 29,515,522.49 138,521,269.37 ‐
65,707,390.40561940
7 107445871.5 29,515,522.49 138,521,269.37 ‐
60,590,920.33272770
8 112818165.1 29,515,522.49 138,521,269.37 ‐
55,218,626.75619140
9 118459073.4 29,515,522.49 138,521,269.37 ‐
49,577,718.50082830
10 124382027 29,515,522.49 138,521,269.37 ‐
43,654,764.8326970011 130601128.4 0 138,521,269.37 ‐7,920,140.9912291212 137131184.8 0 138,521,269.37 ‐1,390,084.5721143813 143987744 0 138,521,269.37 5,466,474.6679560814 151187131.2 0 138,521,269.37 12,665,861.8700301015 158746487.8 0 138,521,269.37 20,225,218.43220780

New Financial Statement Projections
New P&L Statement Projection Year No 1 2 3 4 5Year 2009‐10 2010‐11 2011‐12 2012‐13 2013‐14 Turnover
Tution/student 540,000 675000 843750 1054687.5 1318359.38Course material/student 54,000 67500 81000 97200 116640Infrastructure maintenance/student 12,000 15000 18000 21600 25920Academic activities/student 18,000 22500 27000 32400 38880International Immerssion/student 150,000 187,500 225,000 270,000 324,000Preparatory and Outreach
program/student 6,000 7,500 9,000 10,800 12,960Percentage taken 100.00% 100.00% 100.00% 100.00% 100.00%
Earning from students 780000 975000 1203750 1486688 1836759Number of students 100 100 110 110 120
Income from stuednts 78000000 97500000 132412500 163535625 220411125other income
income from investment 0 1,250,000 3,125,000 5,750,000 9,250,000Total 78,000,000 98,750,000 135,537,500 169,285,625 229,661,125
Expenses
Salary of professors 28 (term I& II) 1,400,000 1680000 2016000 2419200 290304040 (term 3 & 4) 1,500,000 1800000 2160000 2592000 3110400
Sub total 1 2,900,000 3,480,000 4,176,000 5,011,200 6,013,440
Salary of non teaching staff
number of staff 71 71 71 71 71percentage considered thereof 5% 5% 5% 5% 5%Average salary 8,000 8400 8820 9261 9724.05
Sub total 2 340,800 357,840 375,732 394,519 414,245
Expenses for International immersion 100,000 105,000 110,250 115,763 121,551Expenses for course material 32,400 40,500 48,600 58,320 69,984Expenses for infrastructure maintenance 6,000 7,500 9,000 10,800 12,960Expenses for academic activities 9,000 11,250 13,500 16,200 19,440Expenses for preparatory and outreach
program 600 750 900 1,080 1,296 Sub total/student 148,000 165,000 182,250 202,163 225,231

Sub total 3 14,800,000 16,500,000 20,047,500 22,237,875 27,027,675
Brand development (5% of turnover) 5% 5% 5% 5% 5%
Sub total 4 3,900,000 4,937,500 6,776,875 8,464,281 11,483,056
Insurance premium 10,000 10,000 10,000 10,000 10,000 Salary to ourselves 20,500,000 20,500,000 20,500,000 20,500,000 20,500,000
Total 21,950,800 25,285,340 31,386,107 36,117,875 44,948,416
EBITDA 56,049,200 73,464,660 104,151,393 133,167,750 184,712,709
Depreciation for FA 1,000,000 1,000,000 1,000,000 1,000,000 1,000,000 Preliminary expenses written off Interest 20,012,314 18,871,929 17,594,698 16,164,199 14,562,040
PBT 35,036,886 53,592,731 85,556,695 116,003,551 169,150,669
Tax @ 33.66% 11,793,416 18,039,313 28,798,384 39,046,795 56,936,115
PAT 23,243,470 35,553,418 56,758,311 76,956,756 112,214,554
Bank Loan ‐ Principal paid 9,503,208 10,643,593 11,920,824 13,351,323 14,953,482 Dividend payout ratio 0% 0% 0% 0% 0% Dividend 0 0 0 0 0 Retained earnings 14,740,262 25,909,824 45,837,487 64,605,432 98,261,072
Reserves and surplus 14,740,262 40,650,086 86,487,573 151,093,005 249,354,077
Year No 6 7 8 9 10Year 2014‐15 2015‐16 2016‐17 2017‐18 2018‐19 Turnover
Tution/student 1647949.219 2059936.523 2574920.654 3218650.818 4023313.522Course material/student 139968 167961.6 201553.92 241864.704 290237.6448Infrastructure maintenance/student 31104 37324.8 44789.76 53747.712 64497.2544

Academic activities/student 46656 55987.2 67184.64 80621.568 96745.8816International Immerssion/student 388,800 466,560 559,872 671,846 806,216Preparatory and Outreach
program/student 15,552 18,662 22,395 26,874 32,249Percentage taken 100.00% 100.00% 100.00% 100.00% 100.00%
Earning from students 2270029 2806433 3470716 4293605 5313259Number of students 120 130 130 130 130
Income from stuednts 272403506 364836228 451193061 558168658 690723619other income
income from investment 13,625,000 19,093,750 25,929,688 34,474,609 45,155,762Total 286,028,506 383,929,978 477,122,749 592,643,267 735,879,381
Expenses
Salary of professors 28 (term I& II) 3483648 4180377.6 5016453.12 6019743.744 7223692.49340 (term 3 & 4) 3732480 4478976 5374771.2 6449725.44 7739670.528
Sub total 1 7,216,128 8,659,354 10,391,224 12,469,469 14,963,363
Salary of non teaching staff
number of staff 71 71 71 71 71percentage considered thereof 5% 5% 5% 5% 5%Average salary 10210.2525 10720.76513 11256.80338 11819.64355 12410.62573
Sub total 2 434,957 456,705 479,540 503,517 528,693
Expenses for International immersion 127,628 134,010 140,710 147,746 155,133Expenses for course material 83,981 100,777 120,932 145,119 174,143Expenses for infrastructure maintenance 15,552 18,662 22,395 26,874 32,249Expenses for academic activities 23,328 27,994 33,592 40,311 48,373Expenses for preparatory and outreach
program 1,555 1,866 2,239 2,687 3,225 Sub total/student 252,044 283,309 319,869 362,736 413,122
Sub total 3 30,245,299 36,830,139 41,582,981 47,155,731 53,705,839
Brand development (5% of turnover) 5% 5% 5% 5% 5%
Sub total 4 14,301,425 19,196,499 23,856,137 29,632,163 36,793,969
Insurance premium 10,001 10,002 10,003 10,004 10,005 Salary to ourselves 20,500,000 20,500,000 20,500,000 20,500,000 20,500,000
Total 52,207,810 65,152,698 76,319,885 89,770,884 106,001,869

EBITDA 233,820,696 318,777,280 400,802,863 502,872,383 629,877,512
Depreciation for FA 1,000,000 1,000,000 1,000,000 1,000,000 1,000,000 Preliminary expenses written off Interest 12,767,622 10,757,874 8,506,957 5,985,929 3,162,377
PBT 220,053,074 307,019,405 391,295,907 495,886,454 625,715,135
Tax @ 33.66% 74,069,865 103,342,732 131,710,202 166,915,380 210,615,714
PAT 145,983,209 203,676,673 259,585,705 328,971,074 415,099,420
Bank Loan ‐ Principal paid 16,747,900 18,757,648 21,008,566 23,529,594 26,353,145 Dividend payout ratio 0% 0% 0% 0% 0% Dividend 0 0 0 0 0 Retained earnings 130,235,309 185,919,025 239,577,139 306,441,480 389,746,275
Reserves and surplus 379,589,386 565,508,411 805,085,550 1,111,527,030 1,501,273,305
Year No 11 12 13 14 15Year 2019‐2020 2020‐21 2021‐22 2022‐23 2023‐24 Turnover
Tution/student 5029141.903 6286427.379 7858034.223 9822542.779 12278178.47Course material/student 348285.1738 417942.2085 501530.6502 601836.7803 722204.1363Infrastructure maintenance/student 77396.70528 92876.04634 111451.2556 133741.5067 160489.8081Academic activities/student 116095.0579 139314.0695 167176.8834 200612.2601 240734.7121International Immerssion/student 967,459 1,160,951 1,393,141 1,671,769 2,006,123Preparatory and Outreach
program/student 38,698 46,438 55,726 66,871 80,245Percentage taken 100.00% 100.00% 100.00% 100.00% 100.00%
Earning from students 6577076 8143948 10087059 12497373 15487975Number of students 130 130 130 130 130
Income from stuednts 855019881 1058713280 1311317714 1624658479 2013436703other income
income from investment 58,507,202 75,196,503 96,058,128 122,135,160 154,731,451Total 913,527,083 1,133,909,782 1,407,375,842 1,746,793,639 2,168,168,153

Expenses
Salary of professors 28 (term I& II) 8668430.991 10402117.19 12482540.63 14979048.75 17974858.540 (term 3 & 4) 9287604.634 11145125.56 13374150.67 16048980.81 19258776.97
Sub total 1 17,956,036 21,547,243 25,856,691 31,028,030 37,233,635
Salary of non teaching staff
number of staff 71 71 71 71 71percentage considered thereof 5% 5% 5% 5% 5%Average salary 13031.15701 13682.71486 14366.85061 15085.19314 15839.4528
Sub total 2 555,127 582,884 612,028 642,629 674,761
Expenses for International immersion 162,889 171,034 179,586 188,565 197,993Expenses for course material 208,971 250,765 300,918 361,102 433,322Expenses for infrastructure
maintenance 38,698 46,438 55,726 66,871 80,245Expenses for academic activities 58,048 69,657 83,588 100,306 120,367Expenses for preparatory and outreach
program 3,870 4,644 5,573 6,687 8,024 Sub total/student 472,476 542,538 625,391 723,531 839,952
Sub total 3 61,421,917 70,529,956 81,300,785 94,059,022 109,193,811
Brand development (5% of
turnover) 5% 5% 5% 5% 5%
Sub total 4 45,676,354 56,695,489 70,368,792 87,339,682 108,408,408
Insurance premium 10,006 10,007 10,008 10,009 10,010 Salary to ourselves 20,500,000 20,500,000 20,500,000 20,500,000 20,500,000
Total 125,619,440 149,365,578 178,148,304 213,079,372 255,520,625
EBITDA 787,907,643 984,544,204 1,229,227,538 1,533,714,267 1,912,647,528
Depreciation for FA 1,000,000 1,000,000 1,000,000 1,000,000 1,000,000 Preliminary expenses written off Interest 0 0 0 0 0
PBT 786,907,643 983,544,204 1,228,227,538 1,532,714,267 1,911,647,528

Tax @ 33.66% 264,873,113 331,060,979 413,421,389 515,911,622 643,460,558
PAT 522,034,531 652,483,225 814,806,148 1,016,802,645 1,268,186,970
Bank Loan ‐ Principal paid 0 0 0 0 0 Dividend payout ratio 0% 0% 0% 0% 0% Dividend 0 0 0 0 0 Retained earnings 523,034,531 653,483,225 815,806,148 1,017,802,645 1,269,186,970
Reserves and surplus 2,024,307,836 2,677,791,061 3,493,597,209 4,511,399,854 5,780,586,824
New Cash Flow Statement Projection
Year No 1 2 3 4 5
Year 2009‐10 2010‐11 2011‐12 2012‐13 2013‐14
Inflows EBITDA 56,049,200 73,464,660 104,151,393 133,167,750 184,712,709
TOTAL 56,049,200 73,464,660 104,151,393 133,167,750 184,712,709
outflows Investment of FA 0 Purchase of investment 5,000,000 7,500,000 10,500,000 14,000,000Repayment of loan 9,503,208 10,643,593 11,920,824 13,351,323 14,953,482Payment to XLRI 0 0 0 0 0Interest on bank borrowings 20,012,314 18,871,929 17,594,698 16,164,199 14,562,040Tax payed 11,793,416 18,039,313 28,798,384 39,046,795 56,936,115Dividend 0 0 0 0 0
TOTAL 41,308,938 52,554,836 65,813,906 79,062,318 100,451,638
Opening balance of cash and bank balance 0 14,740,262 35,650,086 73,987,573 128,093,005Change in cash and bank balance 14,740,262 20,909,824 38,337,487 54,105,432 84,261,072

closing cash and bank balance 14,740,262 35,650,086 73,987,573 128,093,005 212,354,077
Year No 6 7 8 9 10
Year 2014‐15 2015‐16 2016‐17 2017‐18 2018‐19
Inflows EBITDA 233,820,696 318,777,280 400,802,863 502,872,383 629,877,512
TOTAL 233,820,696 318,777,280 400,802,863 502,872,383 629,877,512
outflows Investment of FA Purchase of investment 17500000 21875000 27343750 34179687.5 42724609.4Repayment of loan 16,747,900 18,757,648 21,008,566 23,529,594 26,353,145Payment to XLRI 138521269 138521269 138521269 138521269 138521269Interest on bank borrowings 12,767,622 10,757,874 8,506,957 5,985,929 3,162,377Tax payed 74,069,865 103,342,732 131,710,202 166,915,380 210,615,714Dividend
TOTAL 259,606,657 293,254,524 327,090,744 369,131,860 421,377,116
Opening balance of cash and bank balance 212,354,077 186,568,117 212,090,873 285,802,992 419,543,515Change in cash and bank balance ‐25,785,960 25,522,756 73,712,119 133,740,523 208,500,397
closing cash and bank balance 186,568,117 212,090,873 285,802,992 419,543,515 628,043,911
Year No 11 12 13 14 15
Year 2019‐2020 2020‐21 2021‐22 2022‐23 2023‐24
Inflows EBITDA 787,907,643 984,544,204 1,229,227,538 1,533,714,267 1,912,647,528
TOTAL 787,907,643 984,544,204 1,229,227,538 1,533,714,267 1,912,647,528
outflows

Investment of FA Purchase of investment 53405761.7 66757202.15 83446502.69 104308128.4 130385160.4Repayment of loan 0 0 0 0 0Payment to XLRI 138521269 138521269.4 138521269.4 138521269.4 138521269.4Interest on bank borrowings 0 0 0 0 0Tax payed 264,873,113 331,060,979 413,421,389 515,911,622 643,460,558Dividend
TOTAL 456,800,144 536,339,451 635,389,161 758,741,020 912,366,988
Opening balance of cash and bank balance 628,043,911 959,151,411 1,407,356,164 2,001,194,541 2,776,167,788Change in cash and bank balance 331,107,499 448,204,753 593,838,376 774,973,247 1,000,280,540
closing cash and bank balance 959,151,411 1,407,356,164 2,001,194,541 2,776,167,788 3,776,448,328
New Balance Sheet Projection
1 2 3 4 5
2009‐10 2010‐11 2011‐12 2012‐13 2013‐14
Assets Fixed assets Gross block 20,000,000 20,000,000 20,000,000 20,000,000 20,000,000Accumulated depreciation 1,000,000 2,000,000 3,000,000 4,000,000 5,000,000
Net fixed assets 19,000,000 18,000,000 17,000,000 16,000,000 15,000,000 Investment 0 5,000,000 12,500,000 23,000,000 37,000,000 Current assets
cash and bank balance 14,740,262 35,650,086 73,987,573 128,093,005 212,354,077
Net current assets 14,740,262 35,650,086 73,987,573 128,093,005 212,354,077 Goodwill/XL Apparatus/Intangibles 277,240,481 267,596,887 256,676,063 244,324,739 230,371,257
Total Assets 310,980,742 326,246,973 360,163,636 411,417,745 494,725,334
Liabilities equity 138,974,404 138,974,404 138,974,404 138,974,404 138,974,404

reserves and surplus 14,740,262 40,650,086 86,487,573 151,093,005 249,354,077Long term loan 157,266,077 146,622,483 134,701,659 121,350,335 106,396,853
Total 310,980,742 326,246,973 360,163,636 411,417,745 494,725,334
6 7 8 9 10
2014‐15 2015‐16 2016‐17 2017‐18 2018‐19
Assets Fixed assets Gross block 20,000,000 20,000,000 20,000,000 20,000,000 20,000,000Accumulated depreciation 6,000,000 7,000,000 8,000,000 9,000,000 10,000,000
Net fixed assets 14,000,000 13,000,000 12,000,000 11,000,000 10,000,000 Investment 54,500,000 76,375,000 103,718,750 137,898,438 180,623,047 Current assets
cash and bank balance 186,568,117 212,090,873 285,802,992 419,543,515 628,043,911
Net current assets 186,568,117 212,090,873 285,802,992 419,543,515 628,043,911 Goodwill/XL Apparatus/Intangibles 353,144,626 473,908,248 592,420,951 708,412,627 821,580,751
Total Assets 608,212,743 775,374,120 993,942,693 1,276,854,579 1,640,247,709
Liabilities equity 138,974,404 138,974,404 138,974,404 138,974,404 138,974,404reserves and surplus 379,589,386 565,508,411 805,085,550 1,111,527,030 1,501,273,305Long term loan 89,648,953 70,891,305 49,882,739 26,353,145 0
Total 608,212,743 775,374,120 993,942,693 1,276,854,579 1,640,247,709
11 12 13 14 15
2019‐2020 2020‐21 2021‐22 2022‐23 2023‐24
Assets Fixed assets Gross block 20,000,000 20,000,000 20,000,000 20,000,000 20,000,000

Accumulated depreciation 11,000,000 12,000,000 13,000,000 14,000,000 15,000,000Net fixed assets 9,000,000 8,000,000 7,000,000 6,000,000 5,000,000 Investment 234,028,809 300,786,011 384,232,513 488,540,642 618,925,802 Current assets
cash and bank balance 959,151,411 1,407,356,164 2,001,194,541 2,776,167,788 3,776,448,328
Net current assets 959,151,411 1,407,356,164 2,001,194,541 2,776,167,788 3,776,448,328 Goodwill/XL Apparatus/Intangibles 961,102,020 1,100,623,290 1,240,144,559 1,379,665,828 1,519,187,098
Total Assets 2,163,282,240 2,816,765,465 3,632,571,613 4,650,374,258 5,919,561,228
Liabilities equity 138,974,404 138,974,404 138,974,404 138,974,404 138,974,404reserves and surplus 2,024,307,836 2,677,791,061 3,493,597,209 4,511,399,854 5,780,586,824Long term loan 0 0 0 0 0
Total 2,163,282,240 2,816,765,465 3,632,571,613 4,650,374,258 5,919,561,228
Statement of Financial Ratios Analysis
DSCR The DSCR is a healthy 1.9 and keeps on increasing over the years.
ISCR The ISCR is 2.8 for Yr 1 and keeps on climbing over the years.
Year No 1 2 3 4 5
Year 2009‐10 2010‐11 2011‐12 2012‐13 2013‐14
Profitability Ratios Profitability Ratios GPR Gross profit/Cost of goods sold 2.55 2.91 3.32 3.69 4.11
Operating Ratio (ROI) (EBIT or PBIT or Operating Profit / Capital Employed) *100 0.19 0.26 0.38 0.51 0.75
Net Profitability Ratio (NPR) Net Profit / Turnover 0.30 0.36 0.42 0.45 0.49ROE PAT / Equity 0.17 0.26 0.41 0.55 0.81Return on Asset (ROA) PAT / Capital employed 0.08 0.12 0.21 0.30 0.46

Turnover Ratios Activity Ratios FATO Turnover/ Gross Fixed Asset 3.90 4.94 6.78 8.46 11.48WCTO Turnover/ Net Current Asset 5.29 2.77 1.83 1.32 1.08TOCE Turnover/Capital Employed 0.26 0.35 0.50 0.65 0.94Structural Ratios Financial Strength Debt Equity Ratio DER Debt/Equity 1.13 1.06 0.97 0.87 0.77Solvency Equity/Total Outside Liabilities 0.88 0.95 1.03 1.15 1.31Proprietary Equity/Capital Employed 0.47 0.49 0.51 0.53 0.57Debt Capitalization or Leevarage Ratio Debt/Capital Employed 0.53 0.51 0.49 0.47 0.43
DSCR
(PBT + Interest on term loans and Depreciation)/Interest and Installments 1.90 2.49 3.53 4.51 6.26
Interest Coverage Ratio (ISCR) (PBT + Interest on term loans and Depreciation)/Interest 2.80 3.89 5.92 8.24 12.68
Liquidity Ratio Short term commitments Current Ratio Current Assets/Current Liabilities Liquidity Ratio Liquid Asset / Current Liabilities Solvency Ratios Long Term Solvency Position Net worth to TA Net Worth/Total Assets 0.49 0.55 0.63 0.71 0.78Fixed Assets/Fixed liabilities Fixed Assets/Fixed liabilities 0.12 0.12 0.13 0.13 0.14
Year No 6 7 8 9 10 Year 2014‐15 2015‐16 2016‐17 2017‐18 2018‐19 Profitability Ratios Profitability Ratios
GPR Gross profit/Cost of goods sold 4.48 4.89 5.25 5.60 5.94
Operating Ratio (ROI)
(EBIT or PBIT or Operating Profit / Capital Employed) *100 1.02 1.52 2.12 3.04 4.53
Net Profitability Ratio (NPR) Net Profit / Turnover 0.51 0.53 0.54 0.56 0.56ROE PAT / Equity 1.05 1.47 1.87 2.37 2.99
Return on Asset (ROA) PAT / Capital employed 0.64 0.97 1.37 1.99 2.99
Turnover Ratios Activity Ratios
FATO Turnover/ Gross Fixed Asset 14.30 19.20 23.86 29.63 36.79
WCTO Turnover/ Net Current Asset 1.53 1.81 1.67 1.41 1.17
TOCE Turnover/Capital Employed 1.25 1.83 2.53 3.58 5.30
Structural Ratios Financial Strength

Debt Equity Ratio DER Debt/Equity 0.65 0.51 0.36 0.19 0.00
Solvency Equity/Total Outside Liabilities 1.55 1.96 2.79 5.27 532937964647431.00
Proprietary Equity/Capital Employed 0.61 0.66 0.74 0.84 1.00
Debt Capitalization or Leevarage Ratio
Debt/Capital Employed 0.39 0.34 0.26 0.16 0.00
DSCR
(PBT + Interest on term loans and Depreciation)/Interest and Installments 7.92 10.80 13.58 17.04 21.34
Interest Coverage Ratio (ISCR)
(PBT + Interest on term loans and Depreciation)/Interest 18.31 29.63 47.11 84.01 199.18
Liquidity Ratio Short term commitments
Current Ratio
Current Assets/Current Liabilities
Liquidity Ratio Liquid Asset / Current Liabilities
Solvency Ratios Long Term Solvency Position
Net worth to TA Net Worth/Total Assets 0.85 0.91 0.95 0.98 1.00
Fixed Assets/Fixed liabilities Fixed Assets/Fixed liabilities 0.16 0.18 0.24 0.42 38347922285714.30
Year No 11 12 13 14 15
Year 2019‐2020 2020‐21 2021‐22 2022‐23 2023‐24
Profitability Ratios Profitability Ratios
GPR Gross profit/Cost of goods sold 6.27 6.59 6.90 7.20 7.49
Operating Ratio (ROI)
(EBIT or PBIT or Operating Profit / Capital Employed) *100 5.67 7.08 8.84 11.04 13.76
Net Profitability Ratio (NPR) Net Profit / Turnover 0.57 0.58 0.58 0.58 0.58ROE PAT / Equity 3.76 4.69 5.86 7.32 9.13
Return on Asset (ROA) PAT / Capital employed 3.76 4.69 5.86 7.32 9.13
Turnover Ratios Activity Ratios
FATO Turnover/ Gross Fixed Asset 45.68 56.70 70.37 87.34 108.41
WCTO Turnover/ Net Current 0.95 0.81 0.70 0.63 0.57

Asset
TOCE Turnover/Capital Employed 6.57 8.16 10.13 12.57 15.60
Structural Ratios Financial Strength Debt Equity Ratio DER Debt/Equity 0.00 0.00 0.00 0.00 0.00
Solvency Equity/Total Outside Liabilities NA NA NA NA NA
Proprietary Equity/Capital Employed 1.00 1.00 1.00 1.00 1.00
Debt Capitalization or Leevarage Ratio
Debt/Capital Employed 0.00 0.00 0.00 0.00 0.00
DSCR
(PBT + Interest on term loans and Depreciation)/Interest and Installments NA NA NA NA NA
Interest Coverage Ratio (ISCR)
(PBT + Interest on term loans and Depreciation)/Interest NA NA NA NA NA
Liquidity Ratio Short term commitments
Current Ratio
Current Assets/Current Liabilities
Liquidity Ratio Liquid Asset / Current Liabilities
Solvency Ratios Long Term Solvency Position
Net worth to TA Net Worth/Total Assets 1.00 1.00 1.00 1.00 1.00
Fixed Assets/Fixed liabilities Fixed Assets/Fixed liabilities NA NA NA NA NA
Conclusion
We hereby submit this project report as an application for requisition of the proposed loan amount of Rs. 555897616.2 in the proposed structure.