project operation and resource utilization · valve as part of the design, ... and a closely spaced...
TRANSCRIPT

EXHIBIT B
PROJECT OPERATION AND RESOURCE UTILIZATION

Public Utility District No. 1 of Okanogan County Final License Application
EXHIBIT B — PROJECT OPERATION AND RESOURCE UTILIZATION
B.1 ALTERNATIVE SITES CONSIDERED
In developing the proposed configuration of the Project the following alternative sites and development options were considered:
• Rehabilitation of the existing project facilities on the west bank of the river.
• Development of power facilities on the east bank of the river, with the following two options.
Of the two main options, redevelopment on the east bank of the river was found to be the most economically attractive while also offering environmental benefits.
In general, the attractiveness of rehabilitating an existing facility is in potential cost savings and fewer environmental impacts due to reuse of existing facilities. However, because the existing plant is over 80 years old and has been subjected to both vandalism and corrosion since its decommissioning almost 50 years ago, little of the remaining structure could be cost-effectively reused with the exception of the intake structure at the dam, surge tanks (which need extensive rehabilitation), and the powerhouse excavation. Much of the remaining facility would have to be demolished and removed prior to constructing a new plant. Other issues including hydraulic limitations due to the waterway length/head ratio, limited intake capacity and difficult construction access issues also reduced the attractiveness of the rehabilitation option.
The main advantage of the redevelopment option on the east bank is that this site is suitable for a higher capacity powerplant that makes better use of the hydropower potential at Enloe Dam. From a constructability standpoint, the east bank also has better road access and better topography for gaining road access to the powerplant site.
From an environmental perspective, the redevelopment option involves additional land disturbance but provides benefit to the river environment by moving the powerhouse tailrace exit about 460 feet upstream to the pool at the base of Similkameen Falls.
Further evaluation of the redevelopment options on the east bank considered two potential powerplant sites:
• Upstream of Similkameen Falls with a tailrace channel below the falls. This is the Project as proposed in this license application.
• Downstream of Similkameen Falls.
Enloe Hydroelectric Project Exhibit B – Project Operation and Resource Utilization FERC Project # 12569 B-1 August 2008

Public Utility District No. 1 of Okanogan County Final License Application
The advantages of the upstream powerplant location are:
• Reduces length, hydraulic head losses and cost of the headworks.
• Reduces length of penstock, which affects head loss, hydraulic stability and transient pressures and obviates the need for surge tank or synchronous bypass valve.
• Improves construction access and constructability of the powerhouse sub-structure which is affected by proximity to the river channel.
• Improves construction access and constructability of the tailrace.
• Avoids congested area of river valley at the old Similkameen powerhouse.
• Maintains road access to the river bank downstream of the falls.
The advantages of the downstream location are:
• Utilizes disturbed site of the original (1905) powerhouse location.
• Reduces the length of the deep tailrace channel required for the upstream location.
• Reduces tailwater level which increases gross hydraulic head.
• Avoids disturbance to the east side of the falls for the new tailrace.
These and other issues are discussed in the following section.
COMPARISON OF UPSTREAM AND DOWNSTREAM SITES
The upstream powerhouse site offers better potential road access for both construction and operations. The narrowness of the east bank between the river channel and the steep cliffs of the river canyon restricts the space available for both a penstock and an access road. In order to install both, there is a need to either cut into the steep slope or construct a retaining wall on the downslope side.
The upstream site with the longer tailrace channel also offers the potential for gaining vehicle access into the powerhouse excavation via a road excavated into the side of the tailrace channel.
Overall the upstream option offers the most cost effective waterway configuration. The main reason that the waterways for the upstream option would be less expensive than those for the downstream option is that the estimated unit cost of tailrace channel excavated in rock is less than half that of a steel penstock, including the excavation and supports required.
Enloe Hydroelectric Project Exhibit B – Project Operation and Resource Utilization FERC Project # 12569 B-2 August 2008

Public Utility District No. 1 of Okanogan County Final License Application
Hydraulic transient considerations in the penstocks also favor the upstream site. The longer penstock for the downstream option would probably require a synchronous bypass valve as was proposed in 1991 to help control hydraulic transients in the pipeline. Since few manufacturers of standardized turbine generator units offer such a valve as part of the design, it would have to be a custom-designed ancillary facility.
The penstocks for the upper option are short enough to not require a synchronous bypass valve. A double penstock configuration is also proposed for this option whereby each turbine has its own penstock and intake gate, which removes the need for a penstock bifurcation and turbine shutoff valves.
The proposed downstream option would take advantage of an existing excavation adjacent to foundations of the old Similkameen powerplant. However, the narrowness of the valley, steepness of the side slopes, and close proximity to the river channel pose construction challenges that would be difficult and potentially costly to solve. It would also be very difficult to gain vehicle access into the proposed powerhouse excavation. The downstream powerhouse site would not be accessible by road and would probably have to be accessed by crane the area of the old powerhouse, at considerable additional cost.
Risks associated with dewatering and construction at the downstream site are perceived to be higher than the upstream option. Construction of the downstream powerhouse option would require the erection of a temporary cofferdam between the river and the proposed powerhouse site. It is expected that the riverbed at this location would consist of bedrock outcroppings and, therefore, would not be amenable to any form of driven piling. The cofferdam would have to be supported by cantilever piers drilled into rock, by an arched cofferdam, or by a braced cofferdam, which is supported by horizontal bracing that spans the powerhouse site.
The tailrace excavation required for the downstream option is shorter than that required for the upstream option since the downstream side is immediately adjacent to the river channel. For the upstream alternative, the location for the outlet of the tailrace channel relative to the downstream powerhouse site may decrease the gross hydraulic head available at the upstream site. On the other hand, the hydraulic head losses in the waterways for the upstream option are expected to be slightly less than those of the downstream option due to the shorter penstock combined with reduced hydraulic loss in an open channel versus a closed pipeline. Therefore, for the purposes of comparison the hydraulic head and estimated average annual power generation is assumed to be the same.
In summary, engineering design, constructability and economics issues favor the upstream powerhouse location.
Enloe Hydroelectric Project Exhibit B – Project Operation and Resource Utilization FERC Project # 12569 B-3 August 2008

Public Utility District No. 1 of Okanogan County Final License Application
ENVIRONMENTAL EFFECTS OF THE ALTERNATIVE SITES
The environmental effects of the alternatives are discussed in Exhibit E.10. The primary potential environmental effects of the powerhouse are on recreation, fish, and water quality. In each case, the upstream powerhouse location would have fewer impacts on these resources. The downstream location would have somewhat lower visual effects. Both locations would have similar (and avoidable) cultural resources effects.
From an economics standpoint, the power generation benefits from each configuration would be similar. However from a cost standpoint, the upstream location appears to be more cost effective due to savings in the overall cost of water conveyance structures, better construction access and better constructability.
B.2 ALTERNATIVE FACILITY DESIGNS, PROCESSES AND OPERATIONS CONSIDERED
The following alternative facility designs were considered:
1. Intake design – Intake designs involving a full fish screen designed to current WDFW screen standards, no screening of the intake, a higher velocity inclined screen, and a closely spaced trashrack with velocity limits to exclude adult resident fish were considered. The use of a single closely spaced trashrack in the existing penstock was selected based on the limited resident fish population and the differential survivability of fish entrained in the turbine flow. The design excludes larger fish from the intake, as they experience substantially greater mortality when passing through turbines. Smaller fish in the size range that would pass through the trashrack would experience a substantially greater survivability when passed through turbines, therefore the design does not propose to exclude them from the project intake.
2. Number of penstocks – A single penstock and dual penstocks were considered. Dual penstocks were selected due to the short length and cost savings in bifurcations and butterfly valves needed for a single penstock.
3. Type of generating units – Kaplan, Francis and double runner Francis units were considered. Kaplan units were selected because they have the advantages of higher generating efficiency over a wide range of flows and higher survivability for small fish passing through the turbine.
4. Number of generating units – A single unit powerhouse and a two unit powerhouse were considered. The two unit powerhouse was selected as it provides better efficiency over a wider range of flows and also provides some redundancy in the event of a unit outage. The proposed design allows operations closer to maximum turbine capacity at lower river flows, which is safer for fish passing through the turbine. It also maintains higher velocities in
Enloe Hydroelectric Project Exhibit B – Project Operation and Resource Utilization FERC Project # 12569 B-4 August 2008

Public Utility District No. 1 of Okanogan County Final License Application
the draft tube, thereby preventing adult fish in the tailrace from reaching the turbine.
B.3 PLANT OPERATION
The estimated gross average annual plant factor, before generation losses, is 58 percent.
The plant would operate automatically in run-of-river mode, regardless of water year type (whether wet, dry or average). In run-of-river operation, the flow through and energy output of the hydropower plant is regulated according to amount of flow in the river. Therefore outflow from Enloe Reservoir to the lower Similkameen River released through the powerplant and spillway would vary in response to natural inflow from the Similkameen River into the reservoir.
The annual spring freshet on the Similkameen River typically starts in March or April and ends between June and August. During this high-flow period, the inflow to Enloe Reservoir would exceed the hydraulic capacity of the powerplant (1600 cfs). At these times the powerplant would normally operate at full capacity and surplus flow would be released downstream via the spillway. As inflow increases to spring flood levels (normally in April or May) the spillway crest gates would slowly be lowered to maintain a constant water level on the reservoir. In normal and dry years inflow seldom exceeds the combined hydraulic capacity of the spillway crest gates and powerplant, so the spillway gates would maintain a constant reservoir water level. The reservoir would not be drawn down to serve generation; only available inflows would be used to generate (run-of-river operation). In wet years, inflow exceeds the combined hydraulic capacity of the spillway crest gates and powerplant, so at these times the gates would be fully lowered and the reservoir elevation would be controlled by the rating curve of the spillway crest, as it is now.
For the remainder of the year (mid-summer through the next spring, except during an early winter storm or occasional warm winter storm) flows in the river are typically less than the hydraulic capacity of the powerplant. Throughout this period, the spillway crest gates would be fully raised to maintain water levels within an operating range of within 1 foot of the top of the gates (El 1049.3 feet). This is similar to the way the decommissioned Enloe Powerplant was operated through fall and winter, with flashboards installed on the crest of the dam. During these times, outflow from the reservoir would normally be through the powerplant and would be regulated to match inflow to the reservoir. In the unlikely event that the crest gates freeze in place, flows would cease until the gates are overtopped. Occasional short duration warm storms during winter may require a short period of spill over the spillway crest gates until flows recede below the flow capacity of the powerplant.
Enloe Hydroelectric Project Exhibit B – Project Operation and Resource Utilization FERC Project # 12569 B-5 August 2008
Public Utility District No. 1 of Okanogan County Final License Application
Regardless of the water year type, the reservoir water level would always be maintained at or above the elevation set by the crest gates. If the natural river flows cause water surface elevation to rise above the level controlled by the crest gates, the gates would be lowered, but they would always be raised again to maintain that target elevation. Therefore, operation of the crest gates would only temporarily affect river flows downstream when the reservoir is first filled to the new higher level, and the area behind the dam that is inundated by the higher reservoir level maintained by the crest gates would be permanently inundated.
Under normal run of river operations, inflow to the reservoir will equal outflow below the Project tailrace. That outflow represents the sum of flow through the Project tailrace and flow over the spillway. During an outage of one of the two units, downstream flow would be maintained by a combination of flow through the other unit and releases from the reservoir via the spillway crest gates. During planned or unplanned outages of both units, outflow from the reservoir to the Similkameen River would be maintained by automatic operation of the spillway crest gates to release water over the spillway. When the plant returns to service, the crest gates would be slowly raised, balancing increased flows through the powerhouse by reducing flows over the spillway. .
B.4 DEPENDABLE CAPACITY AND ENERGY GENERATION
The estimated dependable capacity of the Project is based on the lowest monthly average power output occurring during winter since this is the critical peak electrical load period in the Northwest United States. The critical stream flow used to determine dependable capacity occurred in January 1930, when the monthly average flow was 215 cfs. The dependable capacity at 215 cfs is about 1140 kW.
The estimated gross average annual energy generation (excluding losses) based on flow data from October 1, 1928 through September 30, 2006 is 47.3 GWh annually. The estimated net average annual generation including a 5 percent allowance for station service, unscheduled outages, and transformer losses is 45.0 GWh annually.
STREAMFLOW DATA
The Similkameen River joins the Okanogan River in Oroville in north central Washington, approximately 8 miles south of the Canadian border. Enloe Dam is located on the Similkameen River, about 9 miles upstream from the confluence with the Okanogan River. The majority of both river basins are located in British Columbia. At their confluence, the Okanogan and Similkameen River basins are similar in size (3,150 mi2 and 3,592 mi2, respectively) but the mean annual flow of the Similkameen River is, on average, more than 3.3 times the mean annual flow of the Okanogan. The Similkameen is also a more variable river: although its median daily flow is only 1.3 times as high as that of the Okanogan, peak flows on the Similkameen River are on average more than 8 times as high.
Enloe Hydroelectric Project Exhibit B – Project Operation and Resource Utilization FERC Project # 12569 B-6 August 2008

Public Utility District No. 1 of Okanogan County Final License Application
The Similkameen River basin drains the eastern side of the Cascade Mountains in Washington and British Columbia and the Thompson (or Interior) Plateau of British Columbia (see Figure B-1). The river is fed by three main tributaries, which include the Pasayten River near Manning Park, BC (most of which is in northern Washington), the Tulameen River at Princeton, BC and the Ashnola River near Keremos, BC. Downstream of the international border at Chopaka, WA the Similkameen River receives almost all of its incremental flow within Washington from the Palmer Lake/Sinlahekin Creek watershed. Flows at high stages are regulated somewhat by a natural diversion into and release from Palmer Lake.
Enloe Hydroelectric Project Exhibit B – Project Operation and Resource Utilization FERC Project # 12569 B-7 August 2008

Public Utility District No. 1 of Okanogan County Final License Application
Enloe Hydroelectric Project Exhibit B – Project Operation and Resource Utilization FERC Project # 12569 B-8 August 2008
This page is left intentionally blank.


Public Utility District No. 1 of Okanogan County Final License Application
Enloe Hydroelectric Project Exhibit B – Project Operation and Resource Utilization FERC Project # 12569 B-11 August 2008
Much of the watershed is rugged with high relief, especially along the southern and western boundaries, where elevations range upwards from 7,000 to 8,600 feet along the western divide. The major river valley bottoms range from about 2,300 feet at Princeton, BC to 900 feet at Oroville. From Princeton, BC to Palmer Lake, WA (at 1,160 feet), the Similkameen River flows through a predominately wide, flat-bottomed, low-gradient (dropping approximately two feet per thousand) U-shaped valley reflecting geologically recent glaciation. Downstream of Palmer Lake, the river takes an abrupt northward turn into a narrow, steep valley, then descends at a gradient of about 2.4 feet per thousand to Shanker’s Bend, at the upstream end of the Enloe impoundment. At this point the river channel turns southeastward toward Enloe Dam and continues on towards Oroville, WA. Prior to dam construction, the river channel narrowed and steepened considerably to a gradient of approximately 7 feet per thousand (including the drop over Similkameen Falls). As a consequence, the resulting impoundment is very narrow, long and sinuous. Below Similkameen Falls, the river descends at a gradient of about 2.8 feet per thousand over the lower 8.7 river miles into Oroville.
Continuous daily flows in the Similkameen River have been recorded by the USGS since 1911. From 1911 to 1928 USGS gauging stations 12443500 and 12443600 were located downstream of the Similkameen Falls at various locations near Oroville. Since then, the USGS gauging station 12442500 has been located at river mile 15.8, about 3 miles downstream from Nighthawk and 7 miles upstream from Enloe Dam. More recently (since October 1996), the Washington State Department of Ecology (Ecology) has recorded continuous daily flows in the Similkameen at station 49B070 in Oroville at river mile 5.0. The additional drainage area between the Nighthawk gauge and the dam is only 25 square miles, adding only 0.7 percent to the total. Because this small area adds an insignificant flow to the river flow at the dam, the long-term gauge data at Nighthawk provides the best representation of historical flows at Enloe Dam.
From hydrologic years 1929-2006, mean annual flows have ranged from 1,038 cfs in 2001 to 4,831 cfs in 1972, with an overall average of 2,290 cfs. Average monthly flows have been lowest in September (592 cfs) and relatively low from August through March, ranging up to 910 cfs. Flows have increased substantially during the spring runoff period beginning in April and peaking in May (7,830 cfs) or June (8,570 cfs). The maximum average monthly flow was 24,900 cfs in June 1972, while the minimum average monthly flow was 191 cfs in September 2003. Figure B-2 depicts the mean monthly hydrograph from 1929-2006, while Figure B-3 shows the variation in recorded mean, minimum, and maximum daily mean flows within each month. Annual flood and daily mean flow exceedence curves are shown in Figure B-4. Individual monthly exceedence charts are provided in Appendix B.1.

Public Utility District No. 1 of Okanogan County Final License Application
Enloe Hydroelectric Project Exhibit B – Project Operation and Resource Utilization FERC Project # 12569 B-12 August 2008
Figure B-2: Mean Monthly Flows (cfs) for the Similkameen River at Nighthawk (1929-2006)
Mean Monthly Flows (cfs) for the Similkameen River at Nighthawk (1929-2006)
0
1000
2000
3000
4000
5000
6000
7000
8000
9000
Jan Feb Mar Apr May Jun Jul Aug Sep Oct Nov Dec
Figure B-3
Intra-Annual Variation in Daily Mean Flow at Nighthawk (1929-2006)
Similkameen River at NighthawkAnnual Pattern of Variability in Daily Mean Flow
100
1,000
10,000
100,000
Jan Feb Mar Apr May Jun Jul Aug Sep Oct Nov Dec
Month
Flow
(cfs
)
minimum mean maximum

Public Utility District No. 1 of Okanogan County Final License Application
Figure B-4: Annual Peak and Daily Mean Flow Exceedence at Enloe Dam (1911-2005)
Annual Peak and Daily Mean Flow Exceedence at Nighthawk 1911-2005
0
10,000
20,000
30,000
40,000
50,000
60,000
0% 20% 40% 60% 80% 100%
Percent Higher
Flow
[cfs
]
Annual Peak Flow Daily Mean Flow
The minimum, maximum and mean instantaneous and daily average flows recorded at the USGS gauge 12442500 at Nighthawk during the period October 1, 1928 through September 30, 2006 are shown in Table B-1.
Table B-1: Characteristic Similkameen River Flows at Nighthawk
FLOW CFS Maximum Average Daily Flow (06/01/1972) (cfs) 44,800
Maximum Instantaneous Flow (06/01/1972) (cfs) 45,800
Minimum Average Daily Flow (01/04/1988 and 12/04/1994) (cfs) 120
Minimum Instantaneous Flow (01/03/1974) (cfs) 65
Mean Daily Flow (10/01/1928 to 09/30/2006) (cfs) 2290
Enloe Hydroelectric Project Exhibit B – Project Operation and Resource Utilization FERC Project # 12569 B-13 August 2008

Public Utility District No. 1 of Okanogan County Final License Application
Enloe Hydroelectric Project Exhibit B – Project Operation and Resource Utilization FERC Project # 12569 B-14 August 2008
The median annual 7-day low flow over the period of record (1929-2005) is 300 cfs, and has ranged from 141 cfs in 1974 to 601 in 1964 (Figure B-5 and Figure B-6). Since 1974, however, the mean and median annual 7-day low flows have been significantly (14 percent and 22 percent, respectively) lower (Table B-2).
Table B-2: Comparison of Annual 7-Day Low Flows for Pre and Post 1974
Mean Median Max Min 1929-2005 317 300 601 141
1929-1973 334 319 601 170
1974-2005 292 262 595 141
Figure B-5: Similkameen River at Nighthawk Annual 7-Day Low (1929-2005)
Similkameen River at NighthawkAnnual 7-Day Low (1929-2005)
100
1000
1929
1933
1937
1941
1945
1949
1953
1957
1961
1965
1969
1973
1977
1981
1985
1989
1993
1997
2001
2005
Flow
(cfs
)

Public Utility District No. 1 of Okanogan County Final License Application
Figure B-6: Similkameen River at Nighthawk Annual 7-Day Low Flow Exceedence (1929-2005)
Enloe Hydroelectric Project Exhibit B – Project Operation and Resource Utilization FERC Project # 12569 B-15 August 2008

Public Utility District No. 1 of Okanogan County Final License Application
A monthly flow duration curve compiled from USGS gauge data at Nighthawk in the period October, 1928 through September 2006 is shown on Figure B-7.
Figure B-7: Monthly Flow Duration Curve
0
5000
10000
15000
20000
25000
30000
0% 10% 20% 30% 40% 50% 60% 70% 80% 90% 100%
Exceedence (% time)
Mon
thly
Ave
rage
Flo
w (c
fs)
STORAGE CAPACITY AND RULE CURVE
Enloe Reservoir provides the headworks for the hydroelectric development. Gross storage capacity of the impoundment is shown in Figure B-8.
As previously described in Section B.3, the proposed plant would be operated in run-of-river mode so the storage capacity of the existing reservoir would not be operated for power generation. The District proposes to replace the 5 foot high flashboards that were previously installed on the spillway crest with 5 foot high flap-type crest gates. The purpose of the crest gates is to raise the normal operating water level of the reservoir and the hydraulic head available for hydropower generation.
At present, the reservoir surface water level is controlled by stream flow, the hydraulic rating curve of the spillway crest, and the backwater curve extending upstream from the impoundment. The current minimum water-surface elevation is set by the hydraulic rating curve of Enloe Spillway and existing spillway crest elevation of Enloe Dam which is at El. 1044.3 feet.
Enloe Hydroelectric Project Exhibit B – Project Operation and Resource Utilization FERC Project # 12569 B-16 August 2008

Public Utility District No. 1 of Okanogan County Final License Application
The top of the proposed crest gates would be at El. 1049.3 feet. With the proposed crest gates in place, the normal minimum operating water level of the reservoir would maintained within an operating range of between 1048.3 and 1049.3 El. by regulating outflow from the reservoir through the proposed powerplant to match inflow. As river flow increases beyond the hydraulic capacity of the powerplant, water-surface elevation would be maintained at or below El.1050.3 feet (one foot below the spillway crest elevation) by lowering the crest gates. During peak flood flows, the crest gates would be completely lowered and the water-surface elevation on the reservoir would be determined by the flow in the river and the spillway rating curve as it is now.
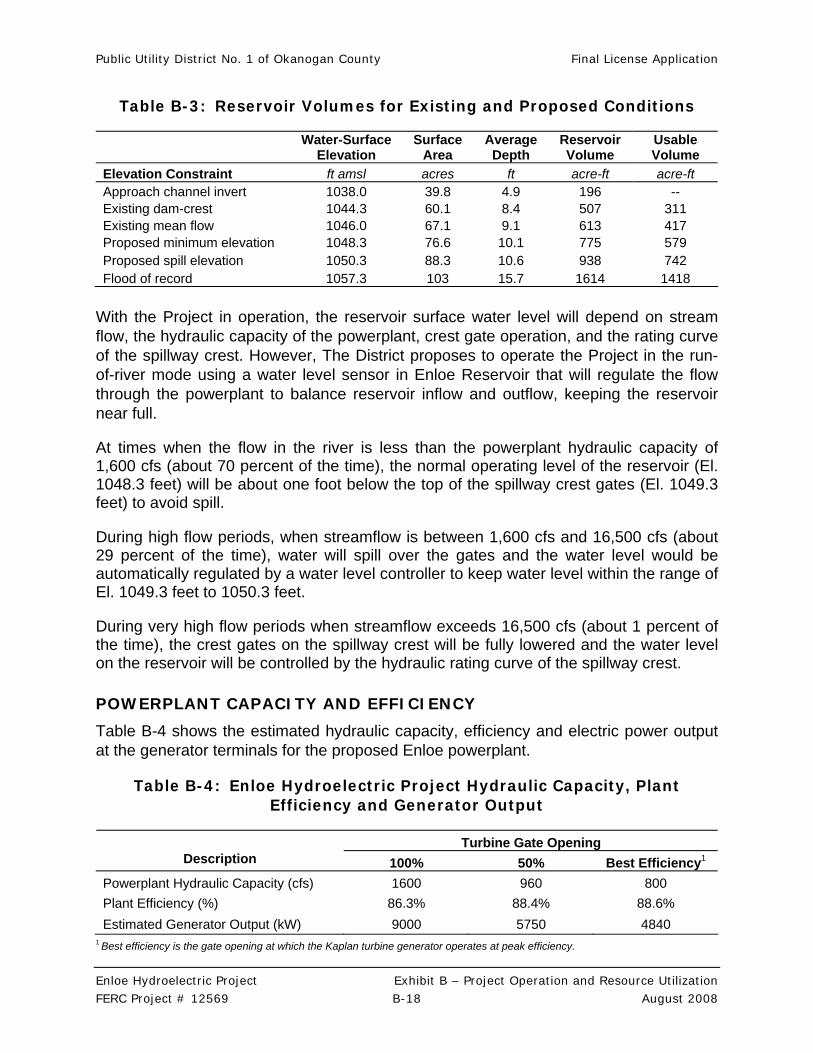
Figure B-8 shows the relationship between impoundment volume and water-surface elevation for water-surface elevations between El. 1044.3 (existing spillway crest) and El. 1057.3 (flood of record). Table B-3 lists the reservoir and usable storage volumes for the proposed operation.
Figure B-8: Enloe Reservoir Storage Capacity
Proposed Enloe Impoundment Volume vs. Water-Surface Elevation
1,030
1,035
1,040
1,045
1,050
1,055
1,060
0 200 400 600 800 1,000 1,200 1,400 1,600 1,800 2,000
Volume (acre-ft)
Elev
atio
n (ft
msl
)
existing spillway crest elevation
proposed minimum operating level
flood of record
Enloe Hydroelectric Project Exhibit B – Project Operation and Resource Utilization FERC Project # 12569 B-17 August 2008
Public Utility District No. 1 of Okanogan County Final License Application
Table B-3: Reservoir Volumes for Existing and Proposed Conditions
Water-Surface
Elevation Surface
Area Average
Depth Reservoir Volume
Usable Volume
Elevation Constraint ft amsl acres ft acre-ft acre-ft Approach channel invert 1038.0 39.8 4.9 196 -- Existing dam-crest 1044.3 60.1 8.4 507 311 Existing mean flow 1046.0 67.1 9.1 613 417 Proposed minimum elevation 1048.3 76.6 10.1 775 579 Proposed spill elevation 1050.3 88.3 10.6 938 742 Flood of record 1057.3 103 15.7 1614 1418
With the Project in operation, the reservoir surface water level will depend on stream flow, the hydraulic capacity of the powerplant, crest gate operation, and the rating curve of the spillway crest. However, The District proposes to operate the Project in the run-of-river mode using a water level sensor in Enloe Reservoir that will regulate the flow through the powerplant to balance reservoir inflow and outflow, keeping the reservoir near full.
At times when the flow in the river is less than the powerplant hydraulic capacity of 1,600 cfs (about 70 percent of the time), the normal operating level of the reservoir (El. 1048.3 feet) will be about one foot below the top of the spillway crest gates (El. 1049.3 feet) to avoid spill.
During high flow periods, when streamflow is between 1,600 cfs and 16,500 cfs (about 29 percent of the time), water will spill over the gates and the water level would be automatically regulated by a water level controller to keep water level within the range of El. 1049.3 feet to 1050.3 feet.
During very high flow periods when streamflow exceeds 16,500 cfs (about 1 percent of the time), the crest gates on the spillway crest will be fully lowered and the water level on the reservoir will be controlled by the hydraulic rating curve of the spillway crest.
POWERPLANT CAPACITY AND EFFICIENCY
Table B-4 shows the estimated hydraulic capacity, efficiency and electric power output at the generator terminals for the proposed Enloe powerplant.
Table B-4: Enloe Hydroelectric Project Hydraulic Capacity, Plant Efficiency and Generator Output
Turbine Gate Opening Description 100% 50% Best Efficiency1
Powerplant Hydraulic Capacity (cfs) 1600 960 800 Plant Efficiency (%) 86.3% 88.4% 88.6% Estimated Generator Output (kW) 9000 5750 4840
1 Best efficiency is the gate opening at which the Kaplan turbine generator operates at peak efficiency.
Enloe Hydroelectric Project Exhibit B – Project Operation and Resource Utilization FERC Project # 12569 B-18 August 2008

Public Utility District No. 1 of Okanogan County Final License Application
TAILWATER RATING CURVE
The estimated tailwater rating curve at the exit of the tailrace channel is shown on Figure B-9. The rating curve has been developed from a series of tailwater elevations taken in the location of the proposed tailrace exit below Similkameen Falls in the period June through August 2007.
Figure B-9: Tailwater Rating Curve
964
965
966
967
968
969
970
971
972
973
974
975
976
977
978
979
0 1,000 2,000 3,000 4,000 5,000 6,000 7,000 8,000 9,000 10,000 11,000 12,000
Flow (cfs)
Riv
er S
tage
(ft)
POWERPLANT CAPABILITY
The maximum powerplant output capability versus net hydraulic head is shown on Figure B-10.
The hydraulic head is controlled by fluctuations in headwater and tailwater levels upstream and downstream of Enloe Dam. Net head at the plant was estimated based on mathematical modeling of plant operations using daily average flow data from the upstream gauge (No. 12442500 Similkameen River near Nighthawk) from Water Year 1928 to Water Year 2006.
The maximum net head of 82.6 feet occurred on January 6, 1930 when the crest gates were raised and daily average flow through the powerhouse was 150 cfs. The estimated
Enloe Hydroelectric Project Exhibit B – Project Operation and Resource Utilization FERC Project # 12569 B-19 August 2008

Public Utility District No. 1 of Okanogan County Final License Application
Enloe Hydroelectric Project Exhibit B – Project Operation and Resource Utilization FERC Project # 12569 B-20 August 2008
minimum net head is 64 feet which occurred during flood flows on June 6, 1972. The normal net head (based on the median of the data) is 80.7 feet.
Figure B-10: Maximum Powerplant Output Capability Versus Net Hydraulic Head
0
10
20
30
40
50
60
70
80
90
7000 7500 8000 8500 9000 9500
Power Plant Output (kW)
Net
Hea
d (f
t)
B.5 SYSTEM AND REGIONAL POWER NEEDS
The District is a Bonneville Power Administration (BPA) customer and as such receives approximately two thirds of its power resource needs from the BPA. As a BPA customer, new 20 year contracts will be signed in the near future that will go into effect in 2012. The amount of power resource the District will receive from the BPA under the new contract will be capped at the District’s 2010 High Water Mark (HWM) for the 20 years of the contract. The HWM is defined as the actual power received from the BPA in 2010. Any power resource need beyond that HWM must come from other resources.
Power generated by the Project is necessary for the District to fully serve its customers. A need exists in the region for the Project power, as the community is steadily growing, and the District can use the power generated by the Project to displace power it currently purchases from other suppliers, such as the BPA, and in the power market. The greatest increase in power needs in the region is occurring in the residential sector.

Public Utility District No. 1 of Okanogan County Final License Application
Enloe Hydroelectric Project Exhibit B – Project Operation and Resource Utilization FERC Project # 12569 B-21 August 2008
There also has been some commercial growth, but very little industrial load growth. The District has experienced a 3.4 percent average annual growth rate overall for power resource needs over the past 3 years. The District’s peak load comes during the cold winter months and it is already resource-short during a portion of that time, which requires the District to go out on the open market to fill resource needs. That demand for power resources will increase as load growth continues.
The Districts’ largest load is currently the sawmill, operated by the Colville Tribe (Colville Indian Precision Division), comprising approximately 10 percent of the total District load.
The District’s transmission system has constraints on the north end of the electrical system. The Enloe Dam project is on the north end of the District’s system so this run-of-river project producing renewable energy is beneficial to the District not only for power production, but as a power resource that would be used in the local area relieving constraints on the transmission system and reducing line losses.
LOAD INFORMATION
Historical and projected average monthly loads are depicted in Table B-5 and Table B-6, respectively, as well as in Figure B-11. Projected loads are based both on historical load growth and on anticipated growth in the District’s service area. Consistent with recent load growth, the projected growth is expected to occur primarily in residential and commercial use, with the potential of some future industrial growth.
Table B-5: Historical District Load (aMW)
1989 1990 1991 1992 1993 1994 1995 1996 1997 1998 1999 2000 2001 2002 2003 2004 2005 2006 2007
Jan 74.9 77.7 90.9 78.3 107.3 81.9 91.1 100.1 109.0 100.3 93.9 97.2 96.5 85.7 75.5 91.1 100.1 87.0 107.0
Feb 83.4 77.4 66.1 66.4 92.2 83.4 80.3 92.0 95.7 81.1 87.7 89.4 91.9 80.5 68.8 80.1 81.5 87.6 86.6
Mar 61.5 58.2 62.3 56.7 74.7 62.8 69.6 68.4 79.7 67.3 73.9 72.7 67.1 75.0 57.2 58.8 61.3 72.8 67.6
Apr 47.6 51.5 53.9 63.8 60.5 51.7 62.9 57.8 63.6 60.3 64.4 59.8 52.7 55.9 48.6 56.3 57.0 57.8 61.0
May 53.4 51.3 55.5 67.3 64.6 57.4 59.3 63.3 61.4 62.8 68.2 67.1 56.9 58.4 49.0 52.6 53.0 59.1 62.0
June 64.7 53.8 56.9 71.1 62.7 62.0 66.1 61.0 55.4 64.5 71.2 72.4 61.1 66.6 56.7 60.1 54.6 62.2 58.8
July 68.3 65.3 66.4 60.4 59.2 79.5 73.0 73.6 70.7 78.8 77.2 78.8 73.0 73.5 69.6 70.1 65.2 73.3 76.6
Aug 62.0 64.3 65.8 71.6 65.6 73.3 66.9 71.8 71.3 78.7 78.2 80.6 76.2 70.4 63.6 66.5 71.3 67.4 77.1
Sept 63.0 63.7 64.3 66.8 65.0 73.2 67.8 65.1 64.1 72.9 70.3 68.6 68.7 61.2 58.2 59.4 61.5 58.6 64.4
Oct 67.0 58.1 67.3 60.8 64.4 70.2 63.8 72.6 68.0 68.7 73.0 70.0 65.3 60.1 57.7 61.0 58.3 62.1 64.2
Nov 64.4 65.6 69.5 69.3 85.4 83.4 75.3 85.0 76.1 74.3 72.2 88.5 70.0 67.3 79.7 76.1 80.9 82.3 82.7
Dec 74.1 92.1 73.0 96.5 89.1 91.2 90.1 111.1 91.2 99.5 87.5 106.0 86.5 73.4 86.6 88.0 102.4 99.2 100.6
Ave* 65.4 64.9 66.0 69.1 74.2 72.5 72.2 76.8 75.5 75.8 76.5 79.3 72.2 69.0 64.5 68.3 70.6 72.4 75.7
* Annual Average

Public Utility District No. 1 of Okanogan County Final License Application
Table B-6: Projected District Load (aMW)
2008 2009 2010 2011 2012 2013 2014 2015 2016 2017 2018
January 111.4 105.8 109.4 113.1 116.9 120.9 125.0 129.3 133.7 138.2 142.9
February 88.0 94.3 97.5 100.8 100.6 107.7 111.4 115.2 115.0 123.2 127.3
March 70.7 73.1 75.6 78.1 80.8 83.5 86.4 89.3 92.3 95.5 98.7
April 62.4 64.6 66.8 69.0 71.4 73.8 76.3 78.9 81.6 84.4 87.2
May 61.3 63.4 65.5 67.7 70.1 72.4 74.9 77.4 80.1 82.8 85.6
June 65.2 67.4 69.7 72.1 74.6 77.1 79.7 82.4 85.2 88.1 91.1
July 79.1 81.8 84.5 87.4 90.4 93.5 96.6 99.9 103.3 106.8 110.5
August 77.0 79.6 82.3 85.1 88.0 91.0 94.1 97.3 100.6 104.0 107.6
September 67.4 69.7 72.0 74.5 77.0 79.6 82.3 85.1 88.0 91.0 94.1
October 67.6 69.9 72.3 74.7 77.3 79.9 82.6 85.4 88.3 91.3 94.4
November 89.6 92.7 95.8 99.1 102.5 106.0 109.6 113.3 117.1 121.1 125.2
December 106.1 109.7 113.5 117.3 121.3 125.4 129.7 134.1 138.7 143.4 148.3
Annual Average 78.1 81.0 83.7 86.6 89.3 92.5 95.7 98.9 102.0 105.8 109.4
Figure B-11: The District’s Average Monthly Load
020406080
100120140160
Jan Feb Mar Apr May Jun Jul Aug Sep Oct Nov Dec
aMW
2005 2006 2007 2008 2018
CONSERVATION PROGRAMS
The District has an active conservation program, which continues to save more than 1,000 MWh each year. The goals and objectives of the Conservation Department include maximizing conservation, minimizing the impact on rates, and offering programs to all the rate classes, without concentrating on any one group of customers.
The program saved more than 5,000 MWh in 2004, as shown in Figure B-12, much of that through the loan program. In 2007, the loan amount was even greater. The
Enloe Hydroelectric Project Exhibit B – Project Operation and Resource Utilization FERC Project # 12569 B-22 August 2008

Public Utility District No. 1 of Okanogan County Final License Application
District’s conservation program includes conservation loans to encourage the use of energy-efficient products and services, such as insulation, Energy Star heat pumps and windows, and air-sealing. It also includes rebates to customers who purchase energy-efficient appliances and manufactured homes, as well as free home energy audits, compact fluorescent light (CFL) bulbs, and numerous other new programs. In 1996, the total Conservation Department budget was $312,300. By 2008, this budget had grown to $497,300 plus and additional $500,000 for the loan program.
The District is a BPA Conservation Rate Credit (CRC) Program participant. The CRC program includes rebates for commercial lighting CFL bulbs, Energy Star manufactured homes, appliance rebates, refrigerator/freezer decommissioning, weatherization program (windows/insulation), low-income weatherization program, and commercial and industrial projects.
The District’s energy audits offer educational information and can lead to lower energy usage, as approximately 25 percent of customers requesting audits end up participating in the loan program.
Figure B-12: Megawatt Hours Saved
-
1,000
2,000
3,000
4,000
5,000
6,000
1997 1998 1999 2000 2001 2002 2003 2004 2005 2006
Figure B-12 clearly shows there have been times of growth and decline over the past decade, but there has been energy saved through implementation of the District’s conservation programs. Although the annual energy savings realized from these programs will vary, they will continue to reduce system loads into the future.
As the District moves forward with the Conservation Program, there are issues and, at times, obstacles to manage. These include:
• Conservation must be cost effective
• Barriers to participation must be removed
Enloe Hydroelectric Project Exhibit B – Project Operation and Resource Utilization FERC Project # 12569 B-23 August 2008
Public Utility District No. 1 of Okanogan County Final License Application
Enloe Hydroelectric Project Exhibit B – Project Operation and Resource Utilization FERC Project # 12569 B-24 August 2008
• CRC elements must meet BPA requirements
• Limited District labor and financial resources
• System allocation
• Cost sharing
• Incentives
• Credits
SALE OF POWER
Annual net generation is expected to average 44,150 MWh which corresponds to an average power output of just over 5 MW. The Project does not produce any ancillary services. Of the gross power generated, 1 percent would be required for station service, equivalent to approximately 465 MWh annually. Another 4 percent (1,859 MWh) is planned as an allowance for plant outages and bus/transformer losses. The remainder would be used entirely to serve the District’s customer load.
B.6 DISTRICT’S PLANS FOR FUTURE DEVELOPMENT OF THE PROJECT
The District has no plans for future development at the Enloe Project Site beyond the proposal put forward in the License Application.
The Columbia River Water Resources Program Policy Advisory Group, coordinated by Ecology, is implementing a program to receive applications and screen potential water storage projects. Early consideration was given to several projects, including a multi-purpose (water storage, flood control, hydroelectric) project upstream of the Enloe Hydroelectric Project on the Similkameen River, at Shanker’s Bend (FERC No. 12804-000). The site offers potential regional water storage benefits, hydroelectric generation, and flood control, as well as the potential to improve fish habitat in the Okanogan Basin.
In June 2007, the State of Washington announced funding of an “appraisal study” to review the site. The size and configuration of a Shanker’s Bend project is undetermined, pending completion of that study. The District has filed an application with the Federal Energy Regulatory Commission for a Preliminary Permit under Section 4(f) of the Federal Power Act (FPA). If the State’s appraisal study of the Shanker’s Bend site is positive the District would consider whether to proceed with seeking a license for the hydroelectric capability of the project from FERC. The District anticipates that its examination of the Shanker’s Bend project would include an analysis of potential impacts on the Enloe Hydroelectric Project: however, at this time it does not appear that the two projects are incompatible.