project performance evaluation report for … · project performance evaluation report for ......
TRANSCRIPT
ASIAN DEVELOPMENT BANK Operations Evaluation Department
PROJECT PERFORMANCE EVALUATION REPORT
FOR
INDIA
In this electronic file, the report is followed by the Management response.
Performance Evaluation Report
Operations Evaluation Department
Project Number: PPE: IND 29701 Investment Number: 7122-IND December 2005
IND: SBI DFHI Limited

CURRENCY EQUIVALENTS
Currency Unit – Indian rupee/s (Re/Rs)
At Appraisal At Project Completion At Operations Evaluation (November 1995) (July 2001) (September 2005) Re1.00 = $0.02970 $0.02136 $0.02273 $1.00 = Rs33.660 Rs46.820 Rs43.990
ABBREVIATIONS
ADB – Asian Development Bank CCIL – Clearing Corporation of India Limited DFHI – Discount Finance House of India Limited FY – fiscal year GDP – gross domestic product IPO – initial public offering FIRR – financial internal rate of return NDS – negotiated dealing system OEM – Operations Evaluation Mission PCR – project completion report PPER – project performance evaluation report PSOD – Private Sector Operations Department RBI – Reserve Bank of India RRP – report and recommendation of the President SBI – State Bank of India SBIGL – SBI Gilts Limited SBICAP – SBI Capital Markets Limited SBI DFHI – SBI DFHI Limited T-bill – treasury bill
NOTES (i) The fiscal year (FY) of the Government ends on 31 March. FY before a calendar year
denotes the year in which the fiscal year ends, for example, FY2000 ends on 31 March 2000.
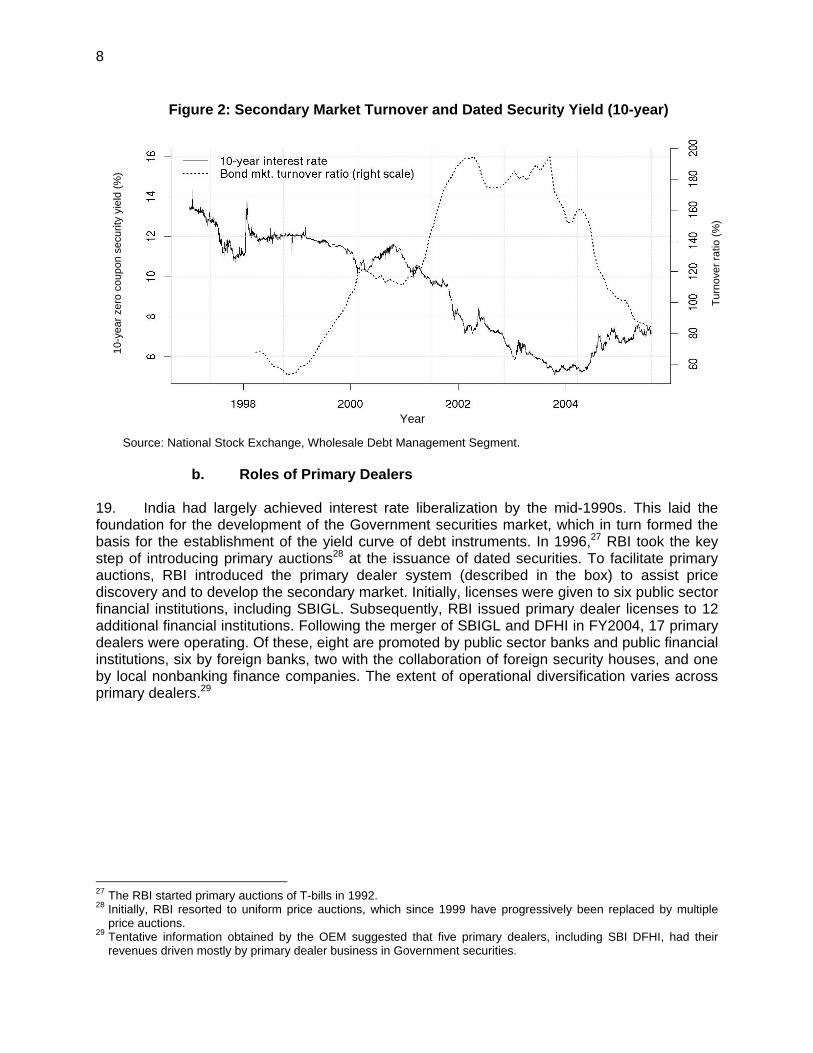
(ii) In this report, “$” refers to US dollars.
Director General : B. Murray, Operations Evaluation Department (OED) Director : D. Edwards, Operations Evaluation Division 2, OED Team Leader : T. Ito, Evaluation Specialist, Operations Evaluation Division 2, OED Team Members : V. Ramos, Evaluation Officer, Operations Evaluation Division 2, OED R. Perez, Senior Operations Evaluation Assistant, Operations Evaluation Division 2, OED
Operations Evaluation Department, PE-675
CONTENTS
Page
BASIC DATA ii EXECUTIVE SUMMARY iii I. INTRODUCTION 1 II. PROJECT DESCRIPTION 1
A. Background 1 B. Rationale 2 C. Deal Processing 2 D. Expected Outcomes 3 E. Progress Highlights 3
III. EVALUATION 4
A. Development Outcome 5 B. Investment Outcome 13 C. ADB’s Effectiveness 14 D. Overall Rating 16
IV. ISSUES, LESSONS AND FOLLOW-UP ACTIONS 16
A. Issues 16 B. Lessons Learned 17 C. Follow-Up Actions 18
APPENDIXES 1. Evaluation Standards 19 2. Statistical Data 22 3. Chronology of Government Securities Market Reforms 26 4. Key Infrastructure for the Government Securities Market 28 5. Summary of Financial Statements of SBI Gilts Limited and SBI DFHI Limited 30 6. Financial Internal Rate of Return on the Asian Development Bank’s Investment in SBI DFHI Limited 32 Attachment: Management response
The guidelines formally adopted by the Operations Evaluation Department on avoiding conflict of interest in its independent evaluations were observed in the preparation of this report. The fieldwork was undertaken by Susan Thomas (international consultant, debt market specialist) and Renuka Sane (research assistant) under the guidance of the mission leader. To the knowledge of the management of the Operations Evaluation Department, there were no conflicts of interest of the persons preparing, reviewing, or approving this report.

BASIC DATA
Investment No. 7122-IND: SBI DFHI Limited (formerly SBI Gilts Limited)
Key Investment Data ($ million equivalent) As per ADB
Document Actual
Amount Approved 4.50 Amount Disbursed 4.19 Terms of Equity Investment: - No. of Shares 15,000,000 15,000,000a - Par Value per Share Rs10.00 Rs10.00b - Dividends Cash Cash - Divestment Mechanism Sale Sale Key Dates Expected Actual Fact-Finding 24–31 Mar 1995Appraisal 24 Jul–4 Aug 1995Investment Negotiations 19–20 Oct 1995Board Approval 19 Dec 1995Subscription Agreement 29 Oct 1996Letter Agreement 29 Oct 1996Disbursement 5 Mar 1997 Key Performance Indicators (%): Appraisal PCR PPER Financial Internal Rate of Return 12.0 Not computed 18.3c
Borrower SBI DFHI Limited Country India Type of Business Primary dealer in Government securities Project Title Investments in Debt Market Securities Mission Data No. of Missions No. of Person-Days Fact-Finding 1 24 Consultation 1 2 Appraisal 1 15 Negotiations 2 22 Investment Review 4 14 Operations Evaluation 1 28
ADB = Asian Development Bank, DFHI = Discount Finance House of India Limited, PCR = project completion report,
PPER= project performance evaluation report, SBI = State Bank of India. a Since the merger of SBI Gilts Limited with DFHI Limited in FY2004, ADB has held 1,363,266 shares of SBI DFHI
Limited. b Since the merger of SBI Gilts Limited with DFHI Limited in FY2004, the par value per share has been set at Rs100. c The assumptions in this calculation include (i) ADB’s divestment on 31 March 2006, (ii) no increase in net worth
and no dividend paid to ADB in FY2006, and (iii) the 30 June 2005 exchange rate of Rs43.52 = $1.00.
EXECUTIVE SUMMARY
On 19 December 1995, the Asian Development Bank (ADB) approved an equity investment of Rs150 million ($4.5 million equivalent) in SBI Gilts Limited (SBIGL) (the Project), together with equity investments of Rs715 million ($21.2 million equivalent) in SBI Capital Markets Limited (SBICAP) and Rs145 million ($4.3 million equivalent) in SBICAP Securities Limited. SBIGL, the main focus of this project performance evaluation report, was incorporated on 7 March 1996 and became operational on 1 July 1996. ADB subscribed Rs150 million ($4.19 million equivalent at disbursement) on 5 March 1997. SBIGL’s total paid-up capital was Rs1,000 million, of which 85% was contributed by the State Bank of India (SBI) and its affiliated institutions and 15% by ADB. The purpose of the Project was to support the formation of an accredited primary dealers network that would provide an impetus for active trading in Government securities. The expectation was that SBI would (i) reduce its shareholding in SBIGL to less than 50% within 4 years of the date of incorporation of SBIGL; and (ii) arrange for the divestment of ADB’s shareholding at the same price at which SBI sold it shares. SBIGL was also to make a public offering of its shares within 4 years of the date of incorporation. At the time of investment approval, ADB assumed that the divestment of its shares would take place within 6 years of the date of incorporation. The financial internal rate of return on the ADB investment in SBIGL was estimated at 16.5% in rupee terms and 12.0% in dollar terms. The main project developments are as follows. First, the Government securities market grew steadily during fiscal year (FY) 1997–FY2004, but experienced a setback in FY2005. Second, SBIGL was profitable during FY1997–FY2003. Third, SBIGL merged with the Discount and Finance House of India Limited (DFHI) in FY2004 and was renamed SBI DFHI Limited (SBI DFHI). Following the merger, ADB owned 4.69% of SBI DFHI’s total shares. Fourth, SBI DFHI was profitable in FY2004, but recorded a net loss in FY2005. Fifth, ADB received dividends every year throughout the investment period except FY2005. Sixth, divestment of SBI’s and ADB’s shareholdings and SBI DFHI’s initial public offering (IPO) have not yet materialized. This report rates the development outcome of the Project as satisfactory for two main reasons. First, the investee company contributed to establishing and maintaining the primary dealer system, which in turn served the development of the Government securities market as originally envisaged. Second, without the presence of SBIGL and SBI DFHI, the absorption of primary dealers in the primary market, especially at the initial stage and during the FY2005 market downturn, would have been insufficient. This report rates the investment outcome of the Project as satisfactory. The Operations Evaluation Mission estimated the financial internal rate of return of this investment to be 18.3% in dollar terms, compared with the 12.0% estimated at appraisal, assuming that ADB would divest on 31 March 2006. As this estimate suggests, the investment return has been highly satisfactory. However, effective measures to mitigate the market risk and the exit risk are not in place, and thus the final investment outcome remains uncertain. This report rates ADB’s effectiveness as partly satisfactory because even though ADB’s investment was timely and complemented its public sector operations, the quality of ADB’s work in terms of processing and monitoring fell short of expectations. ADB’s demonstration role also appears to be diminishing. On the basis of the foregoing, the overall rating of this Project is satisfactory.
iv
This report identifies four key lessons as follows:
(i) ADB equity investments require a workable and viable exit mechanism. Planned IPOs are often not a workable mechanism, because they depend on the nature of the investee, on a sponsor, and on industry and market conditions. ADB cannot rely solely on IPOs, and therefore needs to pursue a put option incorporated in a letter agreement or shareholders agreements. To make such an option enforceable, the method of revaluating an investee at ADB’s divestment should be carefully discussed during processing and stated in the agreements.
(ii) If an investee company proposes a merger or acquisition, both the Private Sector Operations Department and the Office of the General Counsel should carefully examine the implications of such a proposal and give prompt feedback to the investee. ADB may need to pursue a put option if it cannot agree to the proposal. To increase clarity and predictability, the subscription agreement should contain a clause specifying the necessary procedures if the investee decides to pursue a merger or acquisition.
(iii) The quarterly private sector investment management note should elaborate and update the status of projects that deviate significantly from their original scope and plan. Extra attention should be paid to monitoring such projects. In the case of this Project, the reluctance of the sponsor to divest its shareholding and of the investee company to undertake an IPO are major deviations.
(iv) ADB approved this Project in conjunction with the investment in SBICAP, but the investment in SBICAP was monitored and evaluated separately. ADB headquarters administered this Project, whereas the India Resident Mission administered the investment in SBICAP, and a project completion report was prepared only for this Project. An assessment of the complementarity of the two investments is beyond the scope of this project performance evaluation report. To the extent possible the monitoring and evaluation of closely related projects sharing the same sponsor should come under the purview of one investment officer and a project completion report and project performance evaluation report should be prepared that cover all associated projects.
Considering the diminishing demonstration effect of this Project, the accumulated net worth of SBI DFHI, the investment returns to date, and the limited prospects for privatizing SBI DFHI, ADB should develop an exit strategy from this investment taking market conditions into account. SBI, as the sponsor of this Project, can be a possible counterpart for sales of SBI DFHI shares held by ADB. Bruce Murray Director General Operations Evaluation Department
I. INTRODUCTION
1. This project performance evaluation report (PPER) assesses the Asian Development Bank’s (ADB’s) equity investment in SBI DFHI Limited (SBI DFHI, the Project), formerly SBI Gilts Limited (SBIGL).1 In line with the good practice standards identified by the Evaluation Coordination Group of Multilateral Development Banks on Private Sector Operations,2 this PPER focuses on three project dimensions: development outcome, investment outcome, and ADB’s effectiveness. 2. An Operations Evaluation Mission (OEM) visited India from 8 to 20 September 2005. The OEM met with representatives of the Ministry of Finance, the Reserve Bank of India (RBI), the State Bank of India (SBI), SBI DFHI and other financial institutions participating in the Government securities3 market, the International Monetary Fund, and the International Finance Corporation. This PPER incorporates the OEM’s findings, the observations of relevant ADB staff, and a review of reports and documents related to this Project. The draft PPER was circulated to SBI DFHI and within ADB. Comments received were considered when finalizing the PPER.
II. PROJECT DESCRIPTION A. Background 3. In the early 1990s, the Government of India initiated a comprehensive economic reform program that ADB supported through its Financial Sector Program4 and Capital Market Development Program.5 One of the aims of these programs was to develop the Government securities market. The Financial Sector Program supported the introduction of a treasury bill (T-bill) auction, whereas the Capital Market Development Program supported the introduction of a primary dealer system for T-bills and dated securities. Primary dealers were expected to ensure the orderly primary distribution of new issues of Government securities, to be market makers for Government securities that would increase liquidity in the secondary market, and to serve as conduits for RBI’s open market operations. In November 1995, RBI licensed six primary dealers,6 including SBI.
1 ADB. 1995. Report and Recommendation of the President to the Board of Directors on Proposed Investments in
Debt Market Institutions in the Republic of India. Manila. (Investment 7122: SBI Gilts Limited, approved on 19 December 1995, for Rs150 million [$4.5 million equivalent at approval].)
2 Evaluation Coordination Group of Multilateral Development Banks on Private Sector Operations, Working Group on Private Sector Evaluation. 2001. MDB-ECG Good-Practice Standards for Evaluation of Private Sector Operations.; Walter I. Cohen and Associates, LLC. 2005. Second Benchmarking Review of ECG Members’ Evaluation Practices for the Private Sector Investment Operations Against Their Agreed Good Practice Standards. Preparation of ADB’s evaluation guidelines on private sector operations is under way.
3 Government securities in this report refer to securities issued only by the central Government. 4 ADB. 1992. Report and Recommendation of the President to the Board of Directors on a Proposed Loan to India
for the Financial Sector Program. Manila. (Loan 1208-IND, approved on 15 December 1992, for $300 million.) 5 ADB. 1993. Report and Recommendation of the President to the Board of Directors on a Proposed Loan to India
for the Capital Market Development Program. Manila. (Loan 1408-IND, approved on 23 November 1993, for $250 million.)
6 The initial six primary dealers were Securities and Trading Corporation of India Limited, Discount and Finance House of India Limited, SBIGL, ICICI Securities Limited, PNB Gilts Limited, and Gilts Securities Trading Corporation Limited.

2
4. ADB’s policy dialogue on improving the efficiency of Government-owned banks focused on SBI,7 its associate banks, and other affiliates, which are collectively referred to as the SBI group—India’s largest financial conglomerate. In response to a changing policy environment, the SBI group formulated a restructuring plan. To reorient securities businesses under the plan, SBI Capital Markets Limited (SBICAP)8 was to spin off its brokerage activities to a new subsidiary, SBICAP Securities Limited. SBI planned to set up SBIGL as a primary dealer of Government securities. B. Rationale 5. SBI recognized the need to sponsor a primary dealer for Government securities not only for its investment banking interests, but also to support RBI’s efforts to establish a Government securities market. A primary dealer was necessary to achieve integrated, full-service investment banking operations within the SBI group, complementing both SBICAP and SBICAP Securities Limited. The SBI group requested ADB to support its restructuring process through equity investments in SBICAP, SBICAP Securities Limited, and SBIGL. ADB agreed because (i) the proposed investments in the three institutions were in line with ADB’s strategy and policy dialogue with the Indian authorities to develop India’s capital markets, (ii) the participation of ADB would provide an impetus to the SBI group’s privatization program, (iii) the backing SBI provided to these institutions would be solid, (iv) the SBI group had good management teams and a large pool of trained professionals in banking and financial services, (v) the proposed investments were expected to have a positive impact and a significant demonstration effect on other public sector financial institutions in India, and (vi) the management of SBI supported capital market reforms. Overall, this Project is a good example of ADB’s private sector operations supporting broader policy dialogue undertaken by the public sector side of ADB. In addition to supporting the Government’s reform program, the activities of the public sector side of ADB helped develop a better enabling environment for the private sector in the Government securities market. C. Deal Processing 6. Subsequent to the concept clearance in March 1995, ADB fielded processing missions between April and August 1995. On 19 December 1995, ADB approved its equity investment of Rs150 million (about $4.5 million equivalent) in SBIGL, together with equity investments of Rs715 million (about $21.2 million equivalent) in SBICAP9 and Rs145 million (about $4.3 million equivalent) in SBICAP Securities Limited.10
7 Since the 1980s, the Government has gradually sold SBI shares to individuals and institutions. As of 30 September
2005, RBI held 59.73% of SBI’s shares. The other major shareholders included foreign institutional investors (11.86%); American Depository Receipts and Shares, and Global Depository Receipts (7.88%); Indian individuals (5.68%); Indian banks and other financial institutions (5.34%); and Indian corporate bodies, trusts, or partnerships (1.73%).
8 SBICAP was incorporated in 1986 as a wholly-owned merchant banking subsidiary of SBI. 9 ADB’s equity investment in SBICAP was disbursed in January 1997, and this equity investment is still in ADB’s
portfolio. The quarterly report on private sector operations for the quarter ended 30 September 2005 gave this investment an RR-5 (substandard) risk rating and assessed its operational status as “problems in full operation stage.” A project completion report on SBICAP has yet to be prepared.
10 Even though SBI incorporated SBICAP Securities Limited in 1998, no securities trading took place because of the declining Indian economy. SBICAP, which was already overcapitalized at that time, took over instead and incorporated the originally proposed securities trading business into its existing legal structure and business operations. Eventually, ADB’s equity investment in SBICAP Securities Limited was canceled on 17 September 1999.

3
7. SBIGL, which is the main focus of this PPER, was incorporated on 7 March 1996 and became operational on 1 July 1996. ADB finalized the Subscription Agreement with SBIGL and the Letter Agreement with SBI on 29 October 1996. Upon fulfillment of predisbursement conditions, for example, the adoption of an operating policy statement, the appointment of an independent external auditor, and the submission of relevant legal documents, ADB subscribed Rs150 million ($4.19 million at disbursement) on 5 March 1997. SBIGL’s total paid-up capital was Rs1,000 million, of which 85% was contributed by SBI and its associate banks and subsidiaries and 15% was contributed by ADB. D. Expected Outcomes 8. The purpose of ADB’s investment in SBIGL, as stated in the report and recommendation of the President (RRP) (footnote 1), was to support the formation of an accredited primary dealers network to facilitate active trading in Government securities. ADB considered its support to the Government securities market as beneficial to the debt market, because the yield curve for Government securities would serve as a benchmark for pricing debt instruments in other risk categories. The OEM concurs with this view. 9. The Letter Agreement stipulates that SBI will (i) reduce its shareholding in SBIGL to less than 50% within 4 years of the date of incorporation of SBIGL, and (ii) arrange for the divestment of ADB’s shareholding at the same price at which SBI divests it shares. The subscription agreement stipulates that SBIGL will make a public offering of its shares within 4 years of the date of incorporation. At the time of investment approval, the divestment of ADB’s shares from SBIGL was expected to take place 6 years from the date of incorporation. The financial internal rate of return (FIRR) on ADB’s investment in SBIGL was estimated at 16.5% in rupee terms and 12.0% in dollar terms, based on a price-earning ratio11 of 9 and the projected earning per share of Rs2.77 in the sixth year.12 This calculation assumed that SBIGL would not pay any dividends to ADB during the entire investment period.13 E. Progress Highlights 10. A project completion report (PCR) on the equity investment in SBIGL was circulated in July 2001.14 The PCR assessed project implementation as successful for several reasons. First, SBIGL maintained its business scope as originally envisaged, and its performance was satisfactory in terms of financial position, profitability, quality of management, and risk control systems. Second, SBIGL remained an active player in both the primary and secondary markets for Government securities. Third, ADB received dividends totaling $1.12 million from Fiscal Year (FY) 199715 through FY2000. The PCR considered that calculating the FIRR of this investment would be premature and provided limited information on its development outcomes, especially the performance of the Government securities market. 11. The PCR highlighted two outstanding issues. First, the reduction of SBI’s shareholding to less than 50% and the listing of SBIGL’s shares on the stock exchange within 4 years of the date of incorporation of SBIGL had not materialized. The PCR stated that ADB would enter into
11 The RRP did not indicate the basis of this price-earning ratio. 12 The RRP did not discuss the reason for this 2-year discrepancy between the company’s initial public offering and
ADB’s divestment. 13 The RRP did not indicate the basis of the zero dividend scenario throughout the investment period despite the
projected steady increase in profits. 14 ADB. 2001. Project Completion Report on the Equity Investment in SBI Gilts Limited in India. Manila. 15 SBI DFHI’s financial year corresponds to that of the Government.

4
discussions with SBIGL’s management to develop a strategy for listing SBIGL in the next 2 years. Second, ADB had not discussed the divestment of ADB shares in SBIGL with SBI and SBIGL. The PCR recommended that ADB monitor and actively seek divestments in the coming years. 12. The OEM largely verified the PCR’s findings. The Project’s outcome can be summarized as follows. First, the Government securities market steadily grew during FY1997–FY2004 but experienced a setback in FY2005. Second, SBIGL was profitable during FY1997–FY2003. Third, SBIGL merged with the Discount and Finance House of India Limited (DFHI) in FY2004 and was renamed SBI DFHI. Fourth, SBI DFHI was profitable in FY2004, but recorded a net loss in FY2005. Fifth, ADB received dividends every year throughout the investment period except FY2005. Sixth, the two issues highlighted in the PCR remain unresolved, and the Project remains in ADB’s portfolio.
III. EVALUATION 13. The method of deriving performance ratings drew on the good practice standards (footnote 2). Table 1 shows the performance ratings for the three key dimensions and underlying indicators for the Project.16 Appendix 1 defines the dimensions, indicators, and 4-point ratings scale referred to in Table 1. This chapter elaborates on the OEM’s findings as the bases of the performance ratings for each dimension and indicator. The last section of this chapter provides the overall project rating.
Table 1: Evaluation of Investment 7122-IND: SBI DFHI Limited
Item UnsatisfactoryPartly
Satisfactory Satisfactory Excellent Development Outcome √ Capital Market Development √ Business Success √ Private Sector Development √ Investment Outcome (return on equity) √ ADB’s Effectiveness √ Screening, Appraisal, and Structuring √ Supervision and Administration √ Role and Contribution √ ADB = Asian Development Bank, SBI DFHI = SBI DFHI Limited. Source: Operations Evaluation Mission.
16 The good practice standards suggest that the synthesis ratings for the three dimensions (development outcomes,
investment outcomes, and ADB’s effectiveness) reflect summary qualitative performance judgments based on the underlying indicator ratings. The standards assume that the synthesis ratings for the three dimensions are not a simple average of the indicator ratings.
5
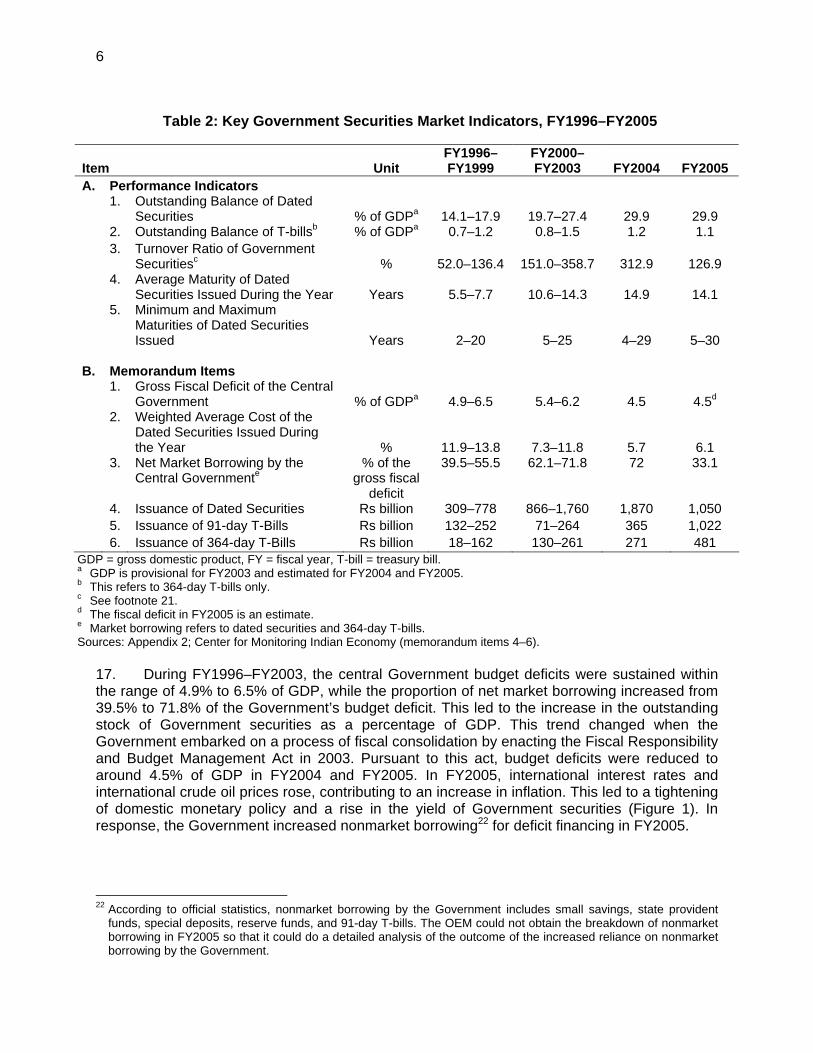
A. Development Outcome 14. The good practice standards suggest that the rating of the development outcome of financial market operations be based on a project’s (i) contributions to the development of the country’s private sector and/or the development of efficient capital markets, (ii) contributions to the company’s business success, (ii) economic viability, (iii) contributions to the country’s living standards, and (iv) environmental sustainability. For this Project, the OEM identified the Project’s contributions to capital market development17 and private sector development and the investee’s business success as the underlying indicators for the development outcome. The assessments of the Project’s economic viability18 and the contribution to the country’s living standards19 are integral to the assessments of capital market development in this evaluation. The OEM did not consider environmental sustainability to be relevant to this Project. 1. Capital Market Development 15. The OEM rated the Project’s contribution to capital market development as satisfactory based on the assessments in paras. 16–21. a. Performance of the Government Securities Market 16. Table 2 shows the key performance indicators of the Government securities market, extracted from Appendix 2. The assessment of these indicators can be summarized as follows: (i) the outstanding stock of Government securities20 steadily increased from 15% of gross domestic product (GDP) as of the end of FY1996 to more than 30% as of the end of FY2005; (ii) the average maturity of dated securities issued during FY2002–FY2005 was more than 14 years, compared with less than 6 years in FY1996; (iii) the maximum maturity of the securities reached 30 years, compared with 10 years in FY1996; and (iv) the market turnover of Government securities21 increased from 52% of the outstanding stock of securities from FY1996 to 359% in FY2003, but dropped to 127% in FY2005. These performance indicators suggest largely satisfactory progress in achieving the Project’s purpose with some reservations about the market setback in FY2005. This setback reflected the reversal in interest rates trends, which had constantly fallen during FY1996–FY2004. The ensuing paragraphs further assess these indicators and other relevant information.
17 This PPER assesses the Project’s contribution to capital market development separately from its contribution to
private sector development for the following reasons. First, development of the Government securities market, the primary purpose of this Project, might not immediately enhance private sector activities given the predominance of state-owned financial intermediaries and institutional investors in India. Second, the Government securities market might not immediately lead to a better corporate debt market. Third, privatization of SBI, a secondary purpose of this Project, could be considered as a separate issue from market development.
18 The good practice standards suggest that the economic viability of financial sector operations should be rated on (i) whether the subprojects financed are economically viable; (ii) whether the project has led to the use of economic viability criteria, or economic internal rate of return, in the intermediary’s investment decisions; and (iii) whether the project has resulted in benefits to the economy. The first and second criteria are not relevant to this Project. The third criterion is covered in this evaluation under the assessment of capital market development.
19 The good practice standards suggest that a project’s contribution to the country’s living standards should be rated based on the project’s economic benefits and costs to those who are neither its owners nor its financiers. This subject is covered in this report under the assessment of capital market development.
20 Government securities in India comprise T-bills and dated securities. Dated securities are issued at maturities greater than 1 year. Most dated securities bear coupons. T-bills are short-term instruments typically with a maturity of 92 days and 364 days. In the past, the Government also issued 14-day and 182-day T-bills. The OEM could not obtain consistent year-end data on the outstanding balance of 91-day T-bills, therefore Government securities here refer only to dated securities and 364-day T-bills.
21 Government securities here include all dated securities and T-bills with different maturities in circulation.
6
Table 2: Key Government Securities Market Indicators, FY1996–FY2005
Item Unit FY1996–FY1999
FY2000–FY2003 FY2004 FY2005
A. Performance Indicators 1. Outstanding Balance of Dated
Securities
% of GDPa
14.1–17.9
19.7–27.4
29.9
29.9 2. Outstanding Balance of T-billsb % of GDPa 0.7–1.2 0.8–1.5 1.2 1.1 3. Turnover Ratio of Government
Securitiesc
%
52.0–136.4
151.0–358.7
312.9
126.9 4. Average Maturity of Dated
Securities Issued During the Year
Years
5.5–7.7
10.6–14.3
14.9
14.1 5. Minimum and Maximum
Maturities of Dated Securities Issued
Years
2–20
5–25
4–29
5–30 B.
Memorandum Items
1. Gross Fiscal Deficit of the Central Government
% of GDPa
4.9–6.5
5.4–6.2
4.5
4.5d
2. Weighted Average Cost of the Dated Securities Issued During the Year
%
11.9–13.8
7.3–11.8
5.7
6.1 3. Net Market Borrowing by the
Central Governmente % of the
gross fiscal deficit
39.5–55.5 62.1–71.8 72 33.1
4. Issuance of Dated Securities Rs billion 309–778 866–1,760 1,870 1,050 5. Issuance of 91-day T-Bills Rs billion 132–252 71–264 365 1,022 6. Issuance of 364-day T-Bills Rs billion 18–162 130–261 271 481
GDP = gross domestic product, FY = fiscal year, T-bill = treasury bill. a GDP is provisional for FY2003 and estimated for FY2004 and FY2005. b This refers to 364-day T-bills only. c See footnote 21. d The fiscal deficit in FY2005 is an estimate. e Market borrowing refers to dated securities and 364-day T-bills. Sources: Appendix 2; Center for Monitoring Indian Economy (memorandum items 4–6).
17. During FY1996–FY2003, the central Government budget deficits were sustained within the range of 4.9% to 6.5% of GDP, while the proportion of net market borrowing increased from 39.5% to 71.8% of the Government’s budget deficit. This led to the increase in the outstanding stock of Government securities as a percentage of GDP. This trend changed when the Government embarked on a process of fiscal consolidation by enacting the Fiscal Responsibility and Budget Management Act in 2003. Pursuant to this act, budget deficits were reduced to around 4.5% of GDP in FY2004 and FY2005. In FY2005, international interest rates and international crude oil prices rose, contributing to an increase in inflation. This led to a tightening of domestic monetary policy and a rise in the yield of Government securities (Figure 1). In response, the Government increased nonmarket borrowing22 for deficit financing in FY2005.
22 According to official statistics, nonmarket borrowing by the Government includes small savings, state provident
funds, special deposits, reserve funds, and 91-day T-bills. The OEM could not obtain the breakdown of nonmarket borrowing in FY2005 so that it could do a detailed analysis of the outcome of the increased reliance on nonmarket borrowing by the Government.

7
18. The significant increase in liquidity of Government securities during FY1996–FY200323 helped price discovery as reflected in the finer bidding patterns emerging in auctions and the narrow spreads in the secondary market. The increased primary issues and secondary market transactions of Government securities, complemented by the diversification of debt instruments24 (Appendix 3), led to the entry of additional private sector primary dealers (para. 19). However, the rise in interest rates during FY2005 resulted in a drop in the turnover ratio from 313% in FY2004 to 127% in FY2005 (Figure 2). This suggests that the development of a secondary market in Government securities remains below its potential.25 The inadequate depth and breadth of the market relates to (i) the commercial banks’ and Life Insurance Corporation of India’s ownership of the majority of dated securities in circulation; and (ii) the large portion of the holdings of dated securities by commercial banks and the Life Insurance Corporation of India being statutorily mandated investments.26 Recently, cooperative banks, regional rural banks, mutual funds, and nonbank finance companies have entered the Government securities market, but their trading activities remain limited. 23 This partly reflected mutual funds’ active participation in the secondary market during this period in conjunction with
the launching of fixed income schemes. 24 These included floating rate bonds introduced in 1995, capital indexed bonds introduced in 1997, and interest rate
futures introduced in 2003. 25 In contrast, liquidity in the stock market remained largely consistent across episodes of much higher fluctuations in
the index price. 26 For this reason, a large portion of the market trading volume typically ends once the securities are placed with
commercial banks and the Life Insurance Corporation of India. Consequently, of 140 to 170 dated securities in circulation, only 10 to 20 have significant liquidity. Little liquidity is available for dated securities that are more than 3 years old.
Figure 1: The Zero Coupon Yield Curve as on 1 March (1998-2005)
Source: National Stock Exchange, Wholesale Debt Management Segment.
Yie
ld (%
)
Maturity (Years)
8
b. Roles of Primary Dealers 19. India had largely achieved interest rate liberalization by the mid-1990s. This laid the foundation for the development of the Government securities market, which in turn formed the basis for the establishment of the yield curve of debt instruments. In 1996,27 RBI took the key step of introducing primary auctions28 at the issuance of dated securities. To facilitate primary auctions, RBI introduced the primary dealer system (described in the box) to assist price discovery and to develop the secondary market. Initially, licenses were given to six public sector financial institutions, including SBIGL. Subsequently, RBI issued primary dealer licenses to 12 additional financial institutions. Following the merger of SBIGL and DFHI in FY2004, 17 primary dealers were operating. Of these, eight are promoted by public sector banks and public financial institutions, six by foreign banks, two with the collaboration of foreign security houses, and one by local nonbanking finance companies. The extent of operational diversification varies across primary dealers.29
27 The RBI started primary auctions of T-bills in 1992. 28 Initially, RBI resorted to uniform price auctions, which since 1999 have progressively been replaced by multiple
price auctions. 29 Tentative information obtained by the OEM suggested that five primary dealers, including SBI DFHI, had their
revenues driven mostly by primary dealer business in Government securities.
Figure 2: Secondary Market Turnover and Dated Security Yield (10-year)
Source: National Stock Exchange, Wholesale Debt Management Segment.
10-y
ear z
ero
coup
on s
ecur
ity y
ield
(%)
Turn
over
ratio
(%)
Year

9
Box 1: Primary Dealer System
Primary dealers are responsible for ensuring the success of primary auctions of dated securities through a system of annual bidding commitments, annual success ratios, and underwriting of the auctions. RBI sets the annual requirement for bidding commitments for primary dealers based mainly on their capital size. The underwriting commitments, as the exclusive opportunity given to primary dealers, are decided separately prior to the actual auction for primary issuance. Primary dealers bid to underwrite various amounts at various commission rates. RBI decides on the actual allotment of the underwriting commitment by primary dealers after considering the commission sought, the amount that succeeded in the primary auction, and the permitted range for devolvement and RBI’s underwriting. Primary dealers also bid in the primary issue auction and must fulfill their annual commitment across all the primary auctions conducted during the year. To ensure that bidding is not too defensive, RBI mandates a 40% success ratio. Unlike the underwriting auction, primary dealers compete with other auction participants, mainly RBI-registered financial entities, in the primary bidding auction.a Primary dealers are given access to the RBI repo market, the call money market, and the RBI liquidity adjustment facility for their funding and liquidity management. There is no underwriting procedure for T-bills, and for primary dealers, bidding commitments are fixed at a flat percentage of the notified amount for each auction (determined at the beginning of the year). a To enable small investors to participate in the primary auction, RBI introduced a scheme for noncompetitive bidding
in January 2002. The scheme provides for the allocation of 5% of a notified amount at the weighted average of accredited bids.
20. Most people interviewed by the OEM acknowledged the contribution of the primary dealer system, complemented by other relevant reforms and market infrastructure development30 (Appendixes 3 and 4), to the development of the Government securities market during the past decade. During FY2001–FY2004, primary dealers continuously absorbed more than half the Government securities issued in the primary market. Their turnover represented more than 20% of secondary market transactions. However, the primary dealers’ absorption of Government securities at primary auctions dropped to 28.5% in FY2005, reflecting their reluctance to hold securities in an environment of rising interest rates. As a result, primary dealers’ turnover of Government securities in the secondary market dropped to 17.7% in FY2005. The contracted activities of primary dealers are closely related to the accounting norm, requiring mark-to-market reevaluation of all securities in hand on primary dealers financial statements.31 The lack of interest rate hedging instruments also explained the primary dealers’ prudent stance during the adverse market conditions.32 According to OEM interviewees, most primary dealers, especially those specializing in Government securities trading, recorded financial losses in FY2005.
30 The major achievement in this area included the negotiated dealing system and the Clearing Corporation of India
Limited, both operationalized for Government securities transactions in February 2002. The commencement of Government securities trading on the three stock exchanges (the National Stock Exchange, the Bombay Stock Exchange, and the Over-the-Counter Exchange of India) as of January 2003 was another major achievement.
31 A different accounting standard is applied to commercial banks in the revaluation of Government securities categorized as held to maturity.
32 Reflecting the volatility in interest rates, over-the-counter markets have emerged for interest rate swaps and forward rate agreements. Given the short-term nature of these instruments, the risks associated with holding Government securities can only be partially hedged.
10
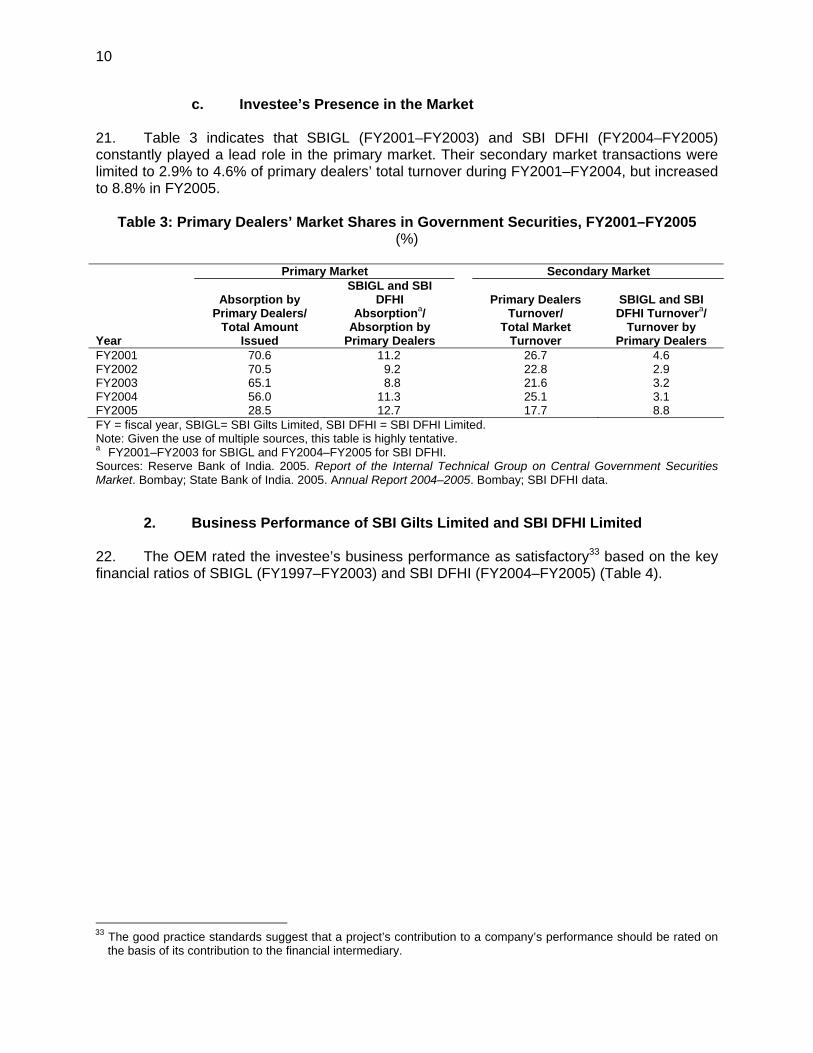
c. Investee’s Presence in the Market 21. Table 3 indicates that SBIGL (FY2001–FY2003) and SBI DFHI (FY2004–FY2005) constantly played a lead role in the primary market. Their secondary market transactions were limited to 2.9% to 4.6% of primary dealers’ total turnover during FY2001–FY2004, but increased to 8.8% in FY2005.
Table 3: Primary Dealers’ Market Shares in Government Securities, FY2001–FY2005 (%)
Primary Market Secondary Market
Year
Absorption by Primary Dealers/
Total Amount Issued
SBIGL and SBI DFHI
Absorptiona/ Absorption by
Primary Dealers
Primary Dealers Turnover/
Total Market Turnover
SBIGL and SBI DFHI Turnovera/
Turnover by Primary Dealers
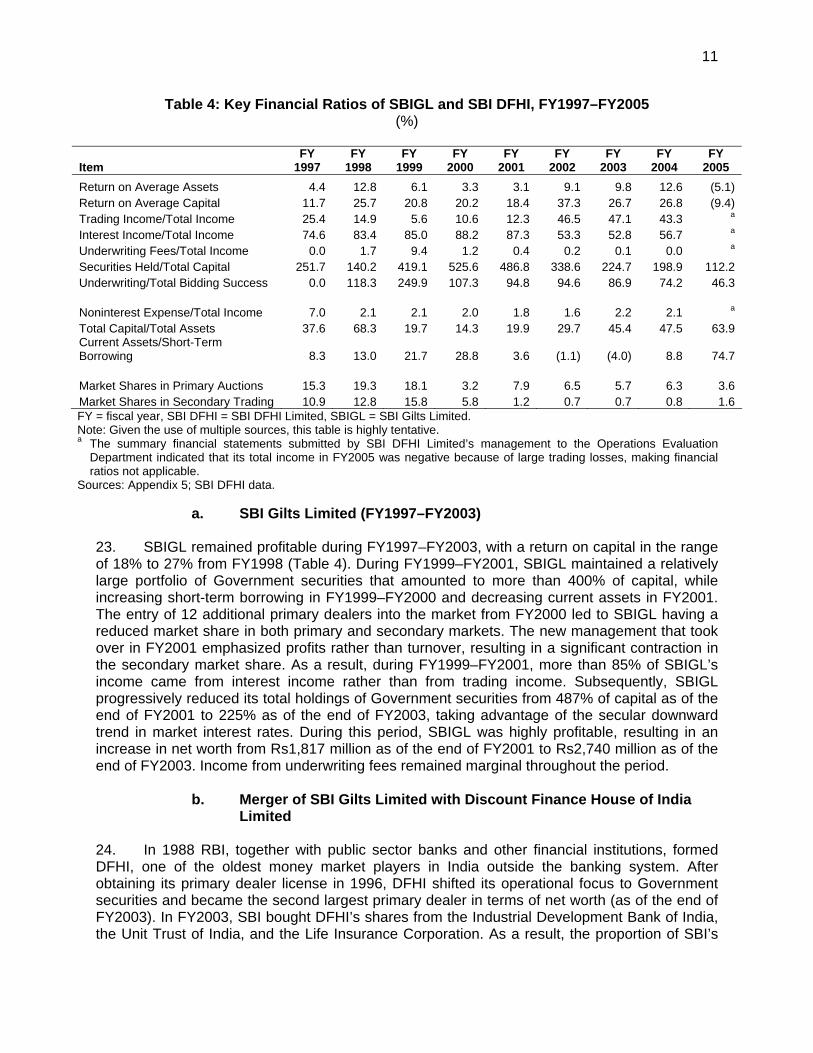
FY2001 70.6 11.2 26.7 4.6 FY2002 70.5 9.2 22.8 2.9 FY2003 65.1 8.8 21.6 3.2 FY2004 56.0 11.3 25.1 3.1 FY2005 28.5 12.7 17.7 8.8 FY = fiscal year, SBIGL= SBI Gilts Limited, SBI DFHI = SBI DFHI Limited. Note: Given the use of multiple sources, this table is highly tentative. a FY2001–FY2003 for SBIGL and FY2004–FY2005 for SBI DFHI. Sources: Reserve Bank of India. 2005. Report of the Internal Technical Group on Central Government Securities Market. Bombay; State Bank of India. 2005. Annual Report 2004–2005. Bombay; SBI DFHI data. 2. Business Performance of SBI Gilts Limited and SBI DFHI Limited 22. The OEM rated the investee’s business performance as satisfactory33 based on the key financial ratios of SBIGL (FY1997–FY2003) and SBI DFHI (FY2004–FY2005) (Table 4).
33 The good practice standards suggest that a project’s contribution to a company’s performance should be rated on
the basis of its contribution to the financial intermediary.
11
Table 4: Key Financial Ratios of SBIGL and SBI DFHI, FY1997–FY2005 (%)
Item FY
1997 FY
1998 FY
1999 FY
2000 FY
2001 FY
2002 FY
2003 FY
2004 FY
2005 Return on Average Assets 4.4 12.8 6.1 3.3 3.1 9.1 9.8 12.6 (5.1) Return on Average Capital 11.7 25.7 20.8 20.2 18.4 37.3 26.7 26.8 (9.4) Trading Income/Total Income 25.4 14.9 5.6 10.6 12.3 46.5 47.1 43.3 a Interest Income/Total Income 74.6 83.4 85.0 88.2 87.3 53.3 52.8 56.7 a Underwriting Fees/Total Income 0.0 1.7 9.4 1.2 0.4 0.2 0.1 0.0 a Securities Held/Total Capital 251.7 140.2 419.1 525.6 486.8 338.6 224.7 198.9 112.2 Underwriting/Total Bidding Success 0.0 118.3 249.9 107.3 94.8 94.6 86.9 74.2 46.3 Noninterest Expense/Total Income 7.0 2.1 2.1 2.0 1.8 1.6 2.2 2.1 a Total Capital/Total Assets 37.6 68.3 19.7 14.3 19.9 29.7 45.4 47.5 63.9 Current Assets/Short-Term Borrowing 8.3 13.0 21.7 28.8 3.6 (1.1) (4.0) 8.8 74.7 Market Shares in Primary Auctions 15.3 19.3 18.1 3.2 7.9 6.5 5.7 6.3 3.6 Market Shares in Secondary Trading 10.9 12.8 15.8 5.8 1.2 0.7 0.7 0.8 1.6 FY = fiscal year, SBI DFHI = SBI DFHI Limited, SBIGL = SBI Gilts Limited. Note: Given the use of multiple sources, this table is highly tentative. a The summary financial statements submitted by SBI DFHI Limited’s management to the Operations Evaluation
Department indicated that its total income in FY2005 was negative because of large trading losses, making financial ratios not applicable.
Sources: Appendix 5; SBI DFHI data.
a. SBI Gilts Limited (FY1997–FY2003) 23. SBIGL remained profitable during FY1997–FY2003, with a return on capital in the range of 18% to 27% from FY1998 (Table 4). During FY1999–FY2001, SBIGL maintained a relatively large portfolio of Government securities that amounted to more than 400% of capital, while increasing short-term borrowing in FY1999–FY2000 and decreasing current assets in FY2001. The entry of 12 additional primary dealers into the market from FY2000 led to SBIGL having a reduced market share in both primary and secondary markets. The new management that took over in FY2001 emphasized profits rather than turnover, resulting in a significant contraction in the secondary market share. As a result, during FY1999–FY2001, more than 85% of SBIGL’s income came from interest income rather than from trading income. Subsequently, SBIGL progressively reduced its total holdings of Government securities from 487% of capital as of the end of FY2001 to 225% as of the end of FY2003, taking advantage of the secular downward trend in market interest rates. During this period, SBIGL was highly profitable, resulting in an increase in net worth from Rs1,817 million as of the end of FY2001 to Rs2,740 million as of the end of FY2003. Income from underwriting fees remained marginal throughout the period. b. Merger of SBI Gilts Limited with Discount Finance House of India Limited 24. In 1988 RBI, together with public sector banks and other financial institutions, formed DFHI, one of the oldest money market players in India outside the banking system. After obtaining its primary dealer license in 1996, DFHI shifted its operational focus to Government securities and became the second largest primary dealer in terms of net worth (as of the end of FY2003). In FY2003, SBI bought DFHI’s shares from the Industrial Development Bank of India, the Unit Trust of India, and the Life Insurance Corporation. As a result, the proportion of SBI’s
12
shareholding in DFHI increased from 29.05% as of the end of FY2002 to 55.13% as of the end of FY2003. The merger of SBIGL with DFHI was a strategic decision by SBI as the sponsor of the two primary dealers. The High Court of Judicature in Bombay sanctioned the proposed amalgamation of SBIGL with DFHI in July 2003. The effective date of the merger was 23 April 2004. The shareholders of SBIGL were issued 1 share of Rs100 of DFHI for every 11 shares of Rs10 each that they held. This swap ratio was determined based on the independent valuation of shares conducted by two external auditing firms. By the end of March 2005, SBI owned 67.01% of the total of 29,090,906 shares, ADB owned 4.69%,34 and other banks and financial institutions owned the rest. c. SBI DFHI Limited (FY2004 to date) 25. In FY2004, SBI DFHI recorded profits of 12.6% of average total assets, reflecting the downtrend in yields of Government securities. SBIGL’s and SBI DFHI’s operational data indicate that the merger resulted in an increased market share in the primary market, but not in the secondary market, in FY2004. The operational efficiency of SBI DFHI in FY2004, measured by the ratio of noninterest expense to total income, was comparable to that of SBIGL prior to the merger. As of the end of FY2004, SBI DFHI’s total capital (as a percentage of total assets) was also at the same level as that of SBIGL as of the end of FY2003. The rise in interest rates in FY2005 resulted in a substantial trading loss of Rs1,795 million and a net loss of Rs940 million (equivalent to 5.1% of average total assets). During FY2005, SBI DFHI, like many other primary dealers, reduced its market share in the primary market. The information submitted by SBI DFHI indicated that other public sector primary dealers35 recorded equivalent losses in FY2005. The management of SBI DFHI explained that the loss in FY2005 was a natural consequence of the drop in prices of Government securities, given that SBI DFHI had to fulfill a significant bidding commitment and achieve the success ratio required by RBI. The management expected improved performance in the first half of FY2006 compared with the same period in FY2005. 3. Private Sector Development 26. The OEM rated the Project’s contribution to private sector development as partly satisfactory. While the Project and ADB’s overall policy dialogue in the financial sector contributed to the entry of 12 private sector primary dealers, little progress has been made in privatizing the SBI group companies, including SBIGL and SBI DFHI. 27. During appraisal, ADB considered that equity participation would provide an impetus to the SBI group’s privatization program, as stated in the RRP. The letter agreement and the subscription agreement stipulated as follows:
Within 4 years from the date of incorporation of the Company, or at a later date as the Bank may otherwise agree, the Sponsor shall reduce its shareholding in the Company to less than 50%, and ensure that the combined share ownership in the Company of the Sponsor’s majority-owned subsidiaries is reduced to less than 50% (which form of reduction in ownership may include divestment by the Sponsor and issue of new Shares in the Company) subject to obtaining all applicable governmental and other approval. (Paragraph 1 [e], Letter Agreement)
34 The Subscription Agreement ensures ADB’s representation on the board of SBIGL as long as ADB holds 5% or
more of the issued share capital of the company. With lower ADB shares after the merger, and no revisions initiated on the Subscription Agreement, ADB’s representation on the SBI-DFHI’s board is no longer ensured.
35 These included Securities Trading Corporation of India Limited, PNB Gilts Limited, and Gilt Securities Trading Corporation Limited. These primary dealers are similar to SBI DFHI in terms of operational scope.
13
The Company shall undertake, in consultation with the Bank, to make a Public Offering of its Shares at a price of not less than Rs10 for each share within 4 years from the date of the Company’s incorporation or by a later date as the Bank shall otherwise agree. (Section 3.07. [a], Subscription Agreement)
28. Notwithstanding the foregoing, SBI’s management informed the OEM that it did not intend to reduce its shareholding in SBI DFHI to less than 50%, as a reduction in shareholding of subsidiaries through an initial public offering (IPO) is not in accordance with SBI’s current corporate policy. Given that SBI DFHI is unlikely to require any additional capital in view of its high net worth, SBI DFHI’s management understandably does not consider an IPO to be necessary at this juncture. 29. SBI has undertaken a gradual process of organizational reforms since the mid-1990s following the recommendations of an international consulting firm. As a result, the organization became flatter, forming specialized business units for each market segment, namely, small and medium enterprises, microcredit, rural credit, and so on. This has improved efficiency and expedited decision making. However, little progress has been made in privatizing SBI and its group companies. In view of market imperfections and the remaining weaknesses in the current primary dealer system that surfaced during the market setback in FY2005, the OEM justified continued public sector ownership in some primary dealers, including SBI DFHI, at least as a transitional measure. Assessing the justification for continued public sector ownership in SBI and other group companies is beyond the scope of this PPER (para. 45). 30. The entry of 12 primary dealers sponsored by private sector financial institutions as of FY2000 promoted competition in the Government securities market and contributed to the increased liquidity during FY2000–FY2004. People interviewed by OEM suspected that sophisticated risk management skills introduced by primary dealers sponsored by foreign financial institutions might have had some spillover effects on the local financial industry, possibly contributing to a reduction of systemic risks in the market. B. Investment Outcome 31. The OEM rated the investment outcome as satisfactory.36 If effective measures to mitigate market risk and exit risk had been in place, the investment outcome could have been assessed as excellent. 32. The OEM used the net asset value method37 to estimate the FIRR of the investment based on the following: (i) ADB received dividends every year during FY1998–FY2004 that totaled Rs184,909,000 (equivalent to about $4.0 million) and no dividend in FY2005; and (ii) SBI DFHI’s net asset value was Rs9,581 million as of the end of FY2005. If ADB had divested all of its shares at the end of FY2005, the FIRR would be 24.4% in rupees and 20.0% in dollars (Appendix 6, tables A6.1 and A6.2). Using the same method and assuming that ADB would divest on 31 March 2006, the FIRR would be 18.3% in dollar terms (Appendix 6, Table A6.3). The assumptions in this calculation include no increase in net worth and no dividends paid to
36 The good practice standards suggest that the investment outcome should be rated based on “the investment’s
gross contribution in relation to the corresponding at-approval standards for minimally satisfactory expected performance.”
37 The net asset value method is based on the book value of the company’s net worth.

14
ADB during FY2006 and that the 30 June 2005 exchange rate of Rs43.52 per $1 remains constant. As the figures suggest, the investment return has been highly satisfactory and exceeds the 12% FIRR in dollar terms estimated at appraisal. 33. The OEM initially planned to calculate FIRR projections also using the price-earning ratio with reference to the industry average. However, the OEM subsequently discarded this methodology for two reasons. First, the OEM could not obtain financial projections for SBI DFHI. Second, because the earnings of primary dealers have been volatile in recent years, the price-earning ratio is not a suitable indicator for making a valuation of primary dealers. Also only one primary dealer is listed on the stock exchange, which significantly limits the availability of the data required to implement this methodology. 34. The significant drop in liquidity of Government securities and the deterioration of primary dealers’ performance in FY2005 suggest that this investment is exposed to considerable market risk. Given the unlikely prospect of an IPO by SBI DFHI in the foreseeable future, a potential difficulty in divestment is another risk associated with this investment. Representatives of SBI and SBI DFHI indicated to the OEM their expectation of continued shareholding by ADB in SBI DFHI. SBI DFHI’s management noted that they might consider a buy-back of shares rather than an IPO if ADB decided to exit; however, consent from SBI DFHI’s more than 30 minority shareholders would be required to pursue this option. SBI’s management did not comment about the possibility of taking over ADB’s shares in SBI DFHI. C. ADB’s Effectiveness 1. At-Entry Screening, Appraisal, and Structuring Work 35. The OEM rated ADB’s performance related to the Project’s screening, appraisal, and structuring as partly satisfactory. 36. ADB’s performance before the subscription of shares was mixed. The Project was relevant, because it complemented the Financial Sector Program (footnote 4) and the Capital Market Development Program (footnote 5). Considering the large influence of the SBI group on India’s financial system, ADB’s at-entry screening of this investment can be justified. OEM’s review of the project file suggested that ADB adequately assessed the issues in the Government securities market and the SBI group. The RRP appropriately highlighted the market risk associated with this investment resulting from interest rate fluctuations and considered that asset diversification would mitigate this risk. This consideration is questionable given the specialized nature of SBIGL’s operations (which would constrain asset diversification) and the lack of hedging instruments in the financial market.38 37. There is nothing to suggest that ADB had detailed discussions with SBI on the eventual reduction of SBI’s shareholding in SBIGL, on an IPO by SBIGL, and on ADB’s exit policy. The RRP was silent on an alternative mechanism that would ensure the divestment of ADB’s shareholding other than via an IPO and the potential difficulty of ADB’s exit if an IPO turned out not to be a realistic option. The letter agreement for the Project required SBI to arrange for ADB’s exit only if SBI decided to divest its shareholding in SBIGL. The lack of a workable, comprehensive exit mechanism for ADB was a major flaw in the project design.
38 International Finance Corporation staff interviewed by the OEM noted that the International Finance Corporation
decided not to invest in a primary dealer in India because of the high market risk associated with such an investment given the lack of hedging instruments.
15
2. Supervision and Administration 38. The OEM rated ADB’s performance related to supervision and administration as partly satisfactory. 39. After the subscription, the Private Sector Operations Department at headquarters administered this investment. ADB’s administrative performance was mixed. The OEM could not fully clarify why the India Resident Mission administered the associated investment in SBICAP but not this investment.39 ADB was represented on SBIGL’s board only during the earlier years (FY1997–FY2000) of the investment.40 The OEM could not verify why this representation was withdrawn.41 Throughout the investment period, SBIGL and SBI DFHI regularly submitted performance review reports to ADB. Based on a review of these reports and attendance at annual general meetings, supplemented by occasional correspondence, ADB officers have updated the quarterly private sector investment management notes. Since 2003, ADB has regularly proposed its exit from the investment as recommended in the PCR circulated in August 2001.42 However, ADB’s response to the proposed merger of SBIGL with DFHI fell short of expectations.43 ADB should have responded promptly to this proposal based on a thorough assessment of the merger’s implications in consultation with the Office of the General Counsel. Potentially, this merger could have offered an avenue for ADB’s divestment had the option been pursued more vigorously. 3. Role and Contribution 40. The OEM rated ADB’s role and contribution as partly satisfactory. 41. SBI and SBI DFHI management explained the contributions of the ADB investment as follows. First, this investment represented ADB’s tangible support for the financial sector reforms initiated by the Government since 1991. Second, ADB’s broadly based strategic thinking and international perspective brought benefits to SBIGL and SBI DFHI. Third, this investment was associated with a significant demonstration effect that enhanced confidence in the emerging Government securities market. However, the OEM did not consider ADB’s 39 According to PSOD, the reason for the separation of the supervision function of the two accounts is that SBICAP
was downgraded shortly after project approval because of a number of reasons, requiring closer monitoring through the India Resident Mission. On the other hand, the PCR (para. 41) noted that “it makes sense to closely involve ADB’s Resident Mission, which has staff with private sector experience (for SBIGL)” The OEM agrees with the latter view. India Resident Mission is of the view that PSOD’s current system of assigning projects on an ad hoc basis to resident missions should become more systematic and accountable so that the administration of private sector projects would be more effective and efficient.
40 There is no record suggesting that the nominee director from ADB actually attended SBIGL’s board meetings, whereas the OEM confirmed ADB’s representation at some of the annual general meetings of SBIGL and SBI DFHI.
41 The PCR (para. 41) noted that “the Resident Mission of ADB in India played an active role on SBIGL’s Board as a nominee director.” The OEM recognized the active role played by the India Resident Mission throughout the investment period. However, the India Resident Mission officer was not designated as a nominee director on the board of SBIGL at the time of the PCR according to the SBIGL’s annual report for FY2002.
42 The PCR (para. 38) noted that “ADB will enter into discussion with SBIGL’s management to develop a strategy for listing SBIGL in the next 2 years. This will depend, however, on overall investment conditions in the Indian stock market and the attractiveness of SBIGL to the investing public.” The OEM did not consider stock market conditions or the attractiveness of SBIGL’s shares as major constraints to an IPO during FY2001–FY2003. Rather, it was the reluctance of SBI and SBIGL as explained in para. 28.
43 SBIGL initially notified ADB about the proposed merger by means of a letter dated 27 May 2003; but the OEM could not find any document substantiating a thorough assessment by ADB officers of this proposal soon after the receipt of this letter or following ADB’s formal response to this letter.
16
contributions to SBIGL’s and SBI DFHI’s operations to have been fully tangible. Moreover, none of the three private sector primary dealers interviewed by the OEM was aware of ADB’s investment in SBIGL. This is understandable given that the annual reports of SBIGL (FY2001–FY2003) and SBI DFHI (FY2004–FY2005) are not explicit about ADB’s shareholding in the company. The OEM concluded that ADB played some demonstration role during the initial years of that investment, but that such effects are diminishing. D. Overall Rating 42. On the basis of the foregoing, the overall rating for this Project is satisfactory. This OEM conclusion is based in particular on consideration of the following factors. First, the investee company contributed to establishing and maintaining the primary dealer system. This, in turn, supported the development of the Government securities market as originally envisaged. Without the presence of SBIGL and SBI DFHI, the absorption of primary dealers in the primary market, especially during the initial stage of its development and during the downturn of the market in FY2005, would not have been sufficient. Second, to date the investment return has been highly satisfactory and exceeds the 12% in dollar terms estimated at appraisal. However, effective measures to mitigate the market risk and the exit risk are not in place, and thus the final investment outcome remains uncertain. Third, ADB’s investment was timely and complemented public sector operations, though ADB’s work quality fell short of expectations. If ADB had a tangible exit policy for the Project, its overall rating might have been excellent.
IV. ISSUES, LESSONS AND FOLLOW-UP ACTIONS
E. Issues 43. In line with the 2003 Fiscal Responsibility and Budget Management Act, as of April 2006, RBI will no longer play the role of underwriter of last resort in the primary auction of Government securities. The new arrangement aims to tighten fiscal management, enhance the transparency of the interest rate determination process, and make RBI’s open market operations more active instruments for monetary control. The new arrangement is premised on a greater role for primary market participants, especially primary dealers. However, most OEM interviewees questioned the viability of the current primary dealer system given the underperformance of primary dealers during the current period of rising interest rates. Because of this concern, RBI set up the internal Technical Group on Central Government Securities Market to examine reform options for the primary dealer system. Based on the group’s recommendations,44 RBI is currently finalizing a reform plan. Implementation of this plan is expected to create a more robust Government securities market. 44. In addition to reform of the primary dealer system, the development of a derivatives market and the removal of existing entry barriers for individual investors45 should help deepen and broaden the Government securities market. Progress in these areas may also serve to 44 The recommendations included (i) introducing a system of 100% underwriting commitment by primary dealers to
replace the current system of the 100% bidding commitment, (ii) giving primary dealers exclusivity in primary auctions on a selective basis based on relative secondary market performance, and (iii) permitting short-selling by primary dealers. Most primary dealers interviewed by the OEM supported these recommendations.
45 No explicit regulatory barrier hinders the entry of individual investors in the Government securities market, but the presence of individual investors in the secondary market is negligible. One reason could be that the typical lot size of Government securities in the secondary market is Rs100 million, which is prohibitive for individual investors. While no rule prohibits individual investors from buying Government securities in smaller lots from banks or primary dealers, the latter are not proactive in distributing Government securities to individual investors. Reportedly, the dissemination of market information and settlement arrangements are also not investor friendly.
17
develop the corporate debt market. India’s corporate debt market remains relatively underdeveloped, with the outstanding amount estimated at around Rs1 trillion. To date, the vast majority of corporate debt paper has been issued on a private placement basis, leading to a lack of transparency and liquidity in the corporate debt market. 45. In the 1990s, the Government started diluting its equity in public sector banks in a phased manner. A recent empirical study shows that in India, partially privatized public sector banks outperformed nonprivatized public sector banks.46 On the basis of this observation, the OEM generally supported the privatization of public sector banks; however, assessing the costs and benefits, particularly of the SBI group’s privatization,47 is beyond the scope of this PPER. ADB would need to undertake such an assessment should it consider participating in a project sponsored by SBI or its affiliates in the future. 46. As explained earlier, the Private Sector Operations Department (PSOD) has proposed its exit from the investment in the past but was not successful. Against this background, PSOD will need to discuss with the South Asia Department broader ADB leverage that might be helpful in devising an effective exit strategy. F. Lessons Learned 47. ADB equity investments require a workable and viable exit mechanism. Planned IPOs are often not a workable mechanism, as they depend on the nature of the investee, a sponsor, the industry, and the market conditions. ADB cannot rely solely on IPOs, and therefore needs to pursue a put option incorporated in a letter agreement or shareholders agreements. To make such an option enforceable, the method of revaluation of an investee at ADB’s divestment should be carefully discussed during processing and stated in the agreements. 48. If an investee company proposes a merger or acquisition, PSOD should carefully examine the implications of such a proposal in consultation with the Office of the General Counsel and provide prompt feedback to the investee company. ADB may need to pursue a put option if it cannot agree to the proposal. The subscription agreement should contain a clause specifying the agreed procedures if an investee company decides to pursue a merger or acquisition. While such decisions cannot always be foreseen at the time of processing, a clear understanding needs to be in place on how to deal with such situations should they materialize. 49. The quarterly private sector investment management note should elaborate on and update the status of projects that have deviated significantly from the original scope and plan. ADB should pay extra attention to monitoring such projects. In the case of this Project, the
46 Sathye, Milind. 2005. Privatization, Performance, and Efficiency: A Study of Indian Banks. Vikalpa 30 (1): 7-16.
Based on statistical evidence from financial data of 27 public sector banks (including SBI and its associated banks) in 1998–2002, this study derived the following conclusions: (i) the financial performance of partially privatized banks and their efficiency were significantly higher than those of nonprivatized public sector banks, (ii) the portfolio quality did not differ significantly between partially privatized public banks and nonprivatized public sector banks, (iii) the financial performance and efficiency of partially privatized banks seem to be catching up rapidly with those of fully privatized banks, and (iv) the gradual privatization and well-developed financial markets seem to have contributed to India’s success.
47 As concerns the SBI group companies, Sathye (footnote 46) did not detect any statistical evidence about the effects of privatization. Sathye (p. 14) commented on this finding as follows: “The capital of the SBI is not directly held by the Government of India [but held by RBI and other state-owned financial institutions] and the group continued to enjoy the privileges of government business being routed through them. This scenario is different than that of the nationalized banks [excluding the SBI group companies] where the Government of India held the entire capital directly. As a result, ‘the marketization shock’ seems to have worked well with the nationalized bank cohort.”

18
reluctance of the sponsor to divest its shareholding and of the investee company to undertake an IPO can be considered as major deviations that merited closer attention and more active follow-up by ADB. 50. ADB approved this Project in conjunction with the investment in SBICAP. However, monitoring and evaluation of the investment in SBICAP was undertaken separately: ADB headquarters administered this Project, whereas the India Resident Mission administered the investment in SBICAP. The PCR was prepared only for this Project. The assessment of the two complementary investments is beyond the scope of this PPER. This experience suggests that to the extent possible (i) the monitoring and evaluation of closely related projects sharing the same sponsor should come under the purview of one investment officer, and (ii) the PCRs and PPERs48 for the associated projects should be prepared simultaneously. G. Follow-Up Actions 51. Given the diminishing demonstration effect of this Project, the accumulated net worth of SBI DFHI (even taking into account the net loss in FY2005), the investment returns to date, and the limited prospects for the privatization of SBI DFHI, ADB should develop an exit strategy from this investment taking market conditions into account. SBI, as the sponsor of this Project, can be a possible counterpart for sales of SBI DFHI’s shares held by ADB.
48 This consideration may be reflected to ADB’s evaluation guidelines on private sector projects, which is being
prepared.
Appendix 1 19
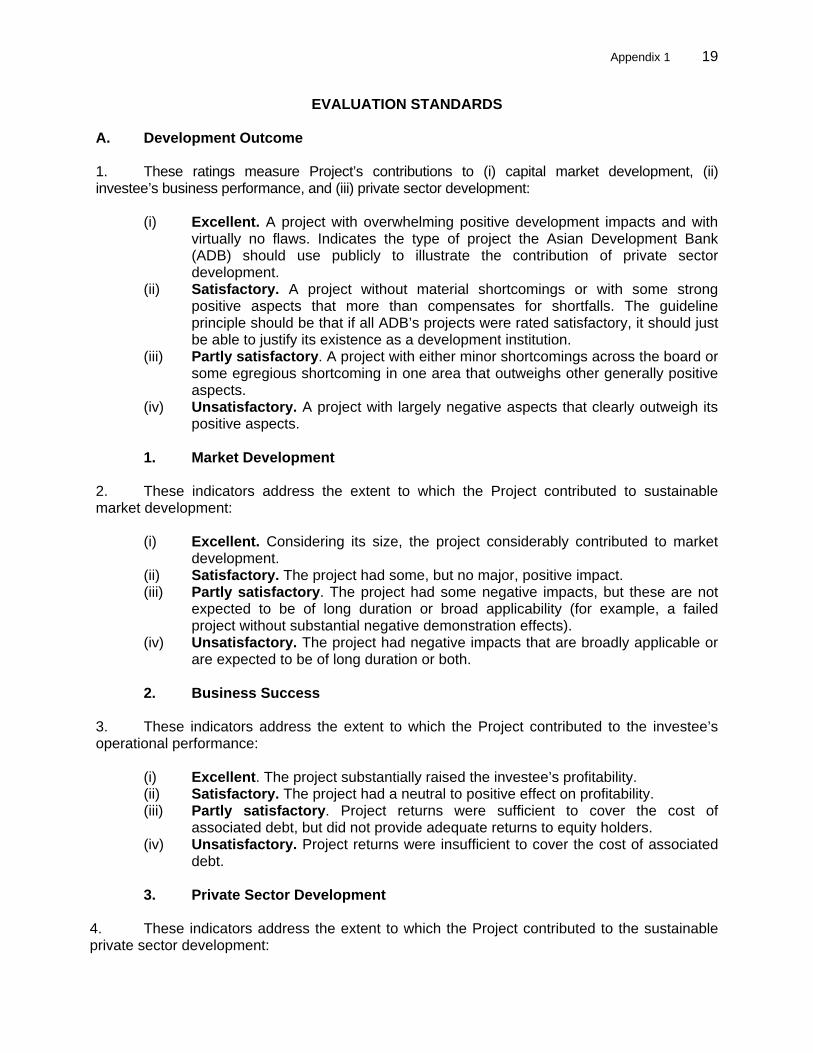
EVALUATION STANDARDS A. Development Outcome 1. These ratings measure Project’s contributions to (i) capital market development, (ii) investee’s business performance, and (iii) private sector development:
(i) Excellent. A project with overwhelming positive development impacts and with virtually no flaws. Indicates the type of project the Asian Development Bank (ADB) should use publicly to illustrate the contribution of private sector development.
(ii) Satisfactory. A project without material shortcomings or with some strong positive aspects that more than compensates for shortfalls. The guideline principle should be that if all ADB’s projects were rated satisfactory, it should just be able to justify its existence as a development institution.
(iii) Partly satisfactory. A project with either minor shortcomings across the board or some egregious shortcoming in one area that outweighs other generally positive aspects.
(iv) Unsatisfactory. A project with largely negative aspects that clearly outweigh its positive aspects.
1. Market Development
2. These indicators address the extent to which the Project contributed to sustainable market development:
(i) Excellent. Considering its size, the project considerably contributed to market development.
(ii) Satisfactory. The project had some, but no major, positive impact. (iii) Partly satisfactory. The project had some negative impacts, but these are not
expected to be of long duration or broad applicability (for example, a failed project without substantial negative demonstration effects).
(iv) Unsatisfactory. The project had negative impacts that are broadly applicable or are expected to be of long duration or both.
2. Business Success
3. These indicators address the extent to which the Project contributed to the investee’s operational performance:
(i) Excellent. The project substantially raised the investee’s profitability. (ii) Satisfactory. The project had a neutral to positive effect on profitability. (iii) Partly satisfactory. Project returns were sufficient to cover the cost of
associated debt, but did not provide adequate returns to equity holders. (iv) Unsatisfactory. Project returns were insufficient to cover the cost of associated
debt. 3. Private Sector Development
4. These indicators address the extent to which the Project contributed to the sustainable private sector development:

20 Appendix 1
(i) Excellent. Considering its size, the project contributed considerably to private
sector development. (ii) Satisfactory. The project had some, but no major, positive impact. (iii) Partly satisfactory. The project had some negative impacts, but these are not
expected to be of long duration or broad applicability (for example, a failed project without substantial negative demonstration effects).
(iv) Unsatisfactory. The project had negative impacts that are broadly applicable or are expected to be of long duration or both.
B. Investment Outcome 5. These ratings measure financial returns of ADB’s investment:
(i) Excellent. The financial internal rate of return (FIRR) of the ADB investment is significantly higher than the expected returns cited in the original investment proposal. Risks to a project’s future cash flow can be a factor for downgrading if the investment remains in ADB’s portfolio.
(ii) Satisfactory. The FIRR is on a par with or marginally higher than the expected returns cited in the original investment proposal. Risks to a project’s future cash flow can be a factor for downgrading if the investment remains in ADB’s portfolio.
(iii) Partly satisfactory. The FIRR is lower than the expected returns cited in the original investment proposal. Risks to a project’s future cash flow can be a factor for downgrading if the investment remains in ADB’s portfolio.
(iv) Unsatisfactory. The FIRR is negative. C. The Asian Development Bank’s Effectiveness 6. These ratings measure ADB’s overall performance related to the (i) Project’s screening, appraisal, and structuring; (ii) Project’s supervision and administration; and (iii) role and contribution:
(i) Excellent. ADB’s performance was exemplary. (ii) Satisfactory. ADB’s performance was materially up to a high professional
standard. (iii) Partly satisfactory. A material shortfall occurred in at least one area of ADB’s
performance. (iv) Unsatisfactory. Shortfalls in several areas or an egregious shortfall in one area
led (or could have led, under less favorable circumstances) to an unsatisfactory investment outcome.
1. Screening, Appraisal and Structuring
7. These indicators address to what extent ADB has professionally executed its front-end work to a sustainable corporate performance standard.
(i) Excellent. ADB’s front-end work could serve as a best-practice example. (ii) Satisfactory. Materially, ADB met good practice standards. (iii) Partly satisfactory. A material shortfall occurred in at least one important area. (iv) Unsatisfactory. Material shortfalls occurred in several areas, and a glaring
mistake or omission bordered on negligence in at least one important area.

Appendix 1 21
2. Supervision and Administration
8. These indicators show to what extent ADB has executed its supervision, taking into account that the appropriate level of supervision will depend on a project’s circumstances:
(i) Excellent. ADB has always kept itself promptly and fully informed about the project’s and the company’s performance in all material areas and used this knowledge proactively to improve the project’s development outcome and/or ADB’s investment outcome.
(ii) Satisfactory. ADB has always kept itself sufficiently informed to react in a timely manner to any material change in the project’s and company’s performance and took timely action when needed.
(iii) Partly satisfactory. ADB’s supervision was insufficient to monitor the project’s and company’s performance and/or ADB did not take timely and appropriate action.
(iv) Unsatisfactory. ADB missed material developments and/or did not use information to intervene in a timely and appropriate manner.
3. Role and Contribution
9. These indicators address the extent and relevance of ADB’s role and contribution:
(i) Excellent. ADB’s role was essential for the project to go ahead and ADB contributed significantly to its success.
(ii) Satisfactory. ADB’s role and contribution were in line with operating principles. (iii) Partly satisfactory. ADB’s role or contribution fell short in a material area. (iv) Unsatisfactory. ADB’s role was not plausibly additional and ADB did not deliver
its expected contribution.
22 Appendix 2
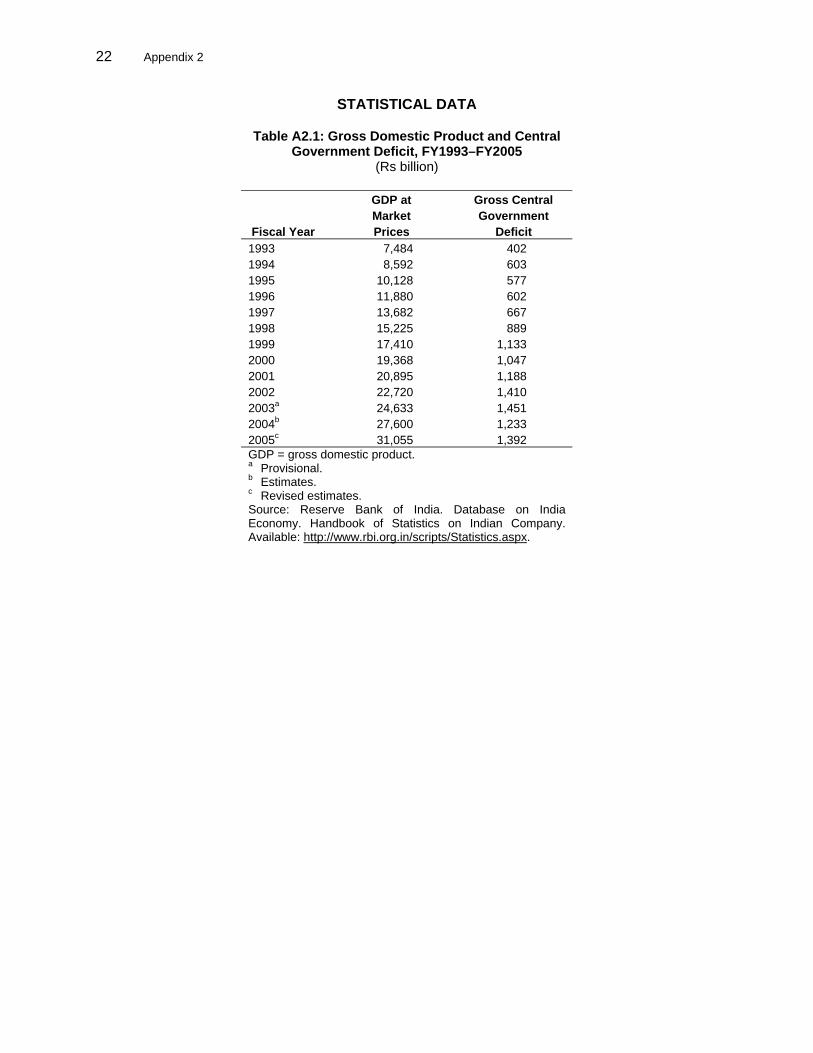
STATISTICAL DATA
Table A2.1: Gross Domestic Product and Central Government Deficit, FY1993–FY2005
(Rs billion) GDP at Gross Central Market Government Fiscal Year Prices Deficit 1993 7,484 402 1994 8,592 603 1995 10,128 577 1996 11,880 602 1997 13,682 667 1998 15,225 889 1999 17,410 1,133 2000 19,368 1,047 2001 20,895 1,188 2002 22,720 1,410 2003a 24,633 1,451 2004b 27,600 1,233 2005c 31,055 1,392 GDP = gross domestic product. a Provisional. b Estimates. c Revised estimates. Source: Reserve Bank of India. Database on India Economy. Handbook of Statistics on Indian Company. Available: http://www.rbi.org.in/scripts/Statistics.aspx.
Appendix 2 23
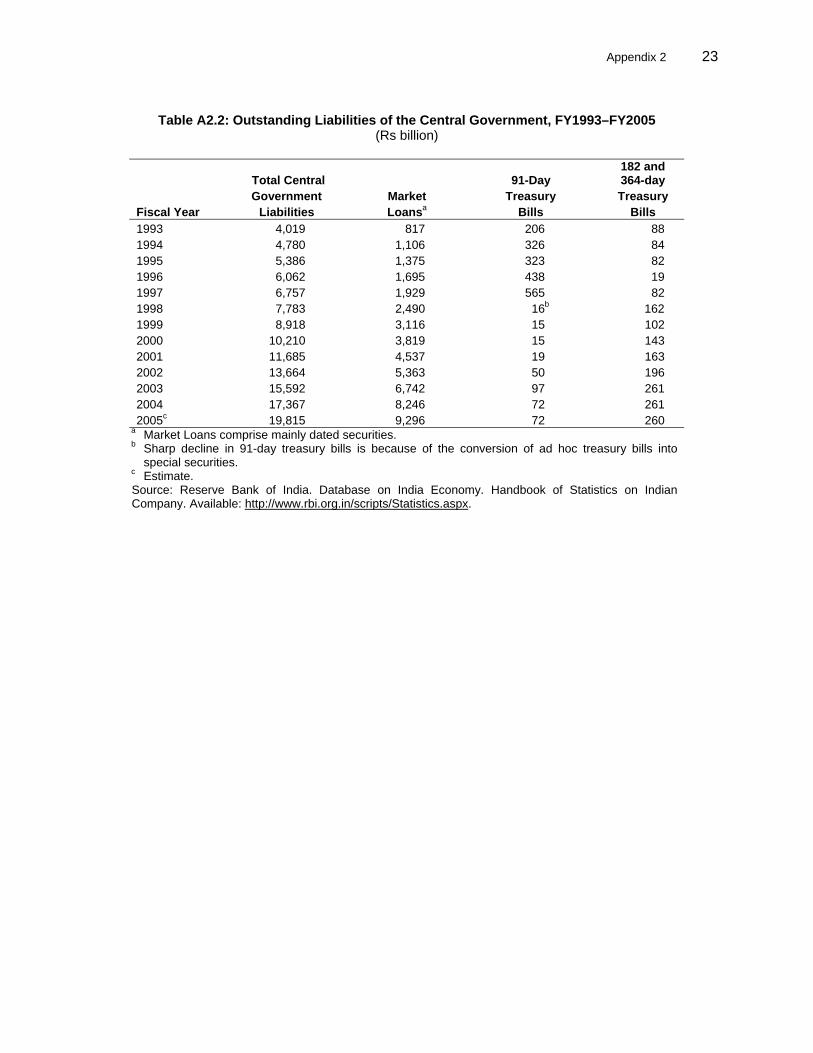
Table A2.2: Outstanding Liabilities of the Central Government, FY1993–FY2005
(Rs billion)
Total Central 91-Day 182 and 364-day
Government Market Treasury Treasury Fiscal Year Liabilities Loansa Bills Bills 1993 4,019 817 206 88 1994 4,780 1,106 326 84 1995 5,386 1,375 323 82 1996 6,062 1,695 438 19 1997 6,757 1,929 565 82 1998 7,783 2,490 16b 162 1999 8,918 3,116 15 102 2000 10,210 3,819 15 143 2001 11,685 4,537 19 163 2002 13,664 5,363 50 196 2003 15,592 6,742 97 261 2004 17,367 8,246 72 261 2005c 19,815 9,296 72 260
a Market Loans comprise mainly dated securities. b Sharp decline in 91-day treasury bills is because of the conversion of ad hoc treasury bills into
special securities. c Estimate. Source: Reserve Bank of India. Database on India Economy. Handbook of Statistics on Indian Company. Available: http://www.rbi.org.in/scripts/Statistics.aspx.
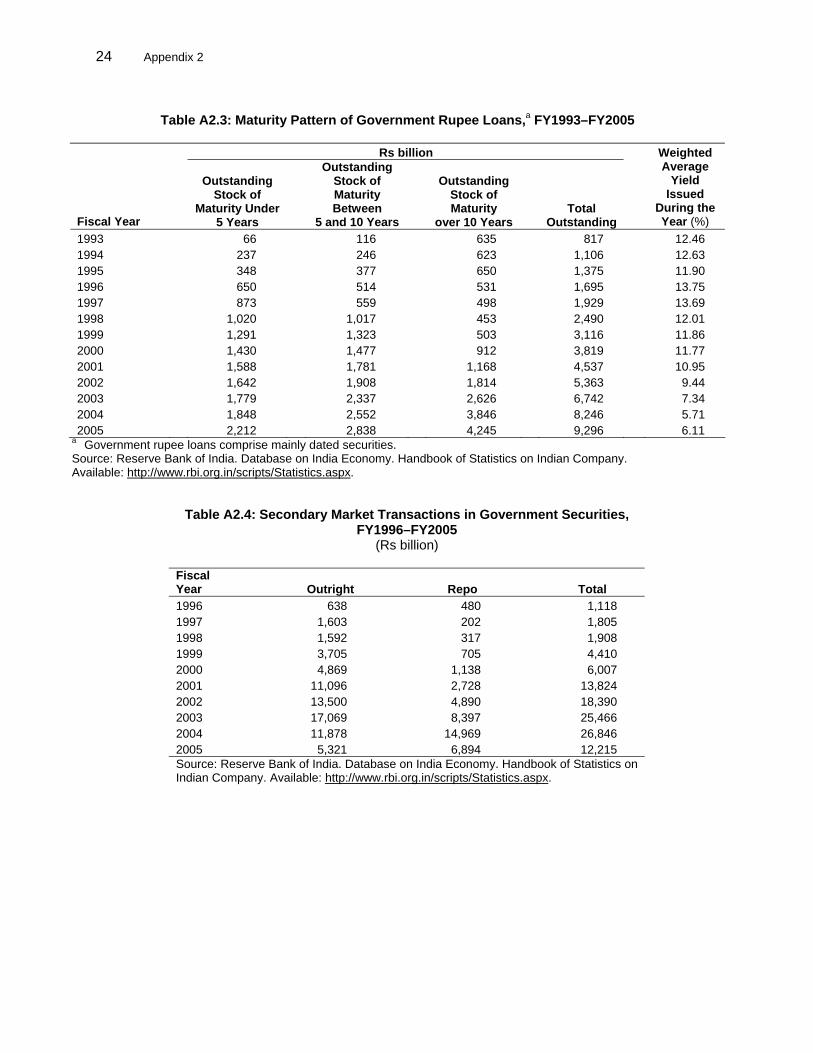
24 Appendix 2
Table A2.3: Maturity Pattern of Government Rupee Loans,a FY1993–FY2005
Rs billion
Fiscal Year
Outstanding Stock of
Maturity Under 5 Years
Outstanding Stock of Maturity Between
5 and 10 Years
Outstanding Stock of Maturity
over 10 Years Total
Outstanding
Weighted Average
Yield Issued
During the Year (%)
1993 66 116 635 817 12.46 1994 237 246 623 1,106 12.63 1995 348 377 650 1,375 11.90 1996 650 514 531 1,695 13.75 1997 873 559 498 1,929 13.69 1998 1,020 1,017 453 2,490 12.01 1999 1,291 1,323 503 3,116 11.86 2000 1,430 1,477 912 3,819 11.77 2001 1,588 1,781 1,168 4,537 10.95 2002 1,642 1,908 1,814 5,363 9.44 2003 1,779 2,337 2,626 6,742 7.34 2004 1,848 2,552 3,846 8,246 5.71 2005 2,212 2,838 4,245 9,296 6.11
a Government rupee loans comprise mainly dated securities. Source: Reserve Bank of India. Database on India Economy. Handbook of Statistics on Indian Company. Available: http://www.rbi.org.in/scripts/Statistics.aspx.
Table A2.4: Secondary Market Transactions in Government Securities,
FY1996–FY2005 (Rs billion)
Fiscal Year Outright Repo Total 1996 638 480 1,118 1997 1,603 202 1,805 1998 1,592 317 1,908 1999 3,705 705 4,410 2000 4,869 1,138 6,007 2001 11,096 2,728 13,824 2002 13,500 4,890 18,390 2003 17,069 8,397 25,466 2004 11,878 14,969 26,846 2005 5,321 6,894 12,215 Source: Reserve Bank of India. Database on India Economy. Handbook of Statistics on Indian Company. Available: http://www.rbi.org.in/scripts/Statistics.aspx.

Table A2.5: Ownership of Central Government Securities Outstanding as of the End of the Fiscal Year, FY1993–FY2004
(Rs billion) Holders 1993 1994 1995 1996 1997 1998 1999 2000 2001 2002 2003 2004 Total (I to IX) 816.9 1,105.8 1,375.2 1,695.3 1,928.9 2,490.2 3,116.0 3,818.8 4,536.7 5,363.2 6,742.0 8,246.1 I. Reserve Bank of India
(own account) 86.4 33.1 34.5 152.2 66.7 319.8 339.5 317.9 417.3 409.3 529.0 410.2
II. Commercial banks, of which:
528.1 795.1 945.9 1,090.5 1,302.1 1,436.9 1,836.1 2,316.9 2,767.1 3,254.6 3,942.2 4,562.1
Scheduled commercial banks (i + ii + iii)a
527.9 794.9 945.9 1,090.5 1,302.1 1,436.9 1,836.1 2,316.9 2,767.1 3,254.6 3,942.2 4,562.1
i. State Bank of India and associates
188.7 268.0 318.2 353.9 401.0 401.1 559.8 758.9 1,052.2 1,245.4 1,468.2 1,531.4
ii. Nationalized banks 277.6 424.6 498.9 579.2 683.7 763.3 908.6 1,105.7 1,216.4 1,378.8 1,714.8 1,998.8 iii. Other scheduled
commercial banks 61.5 102.3 128.8 157.5 217.3 272.5 367.7 452.3 498.5 630.4 759.2 1,031.8
III. Life Insurance Corporation of Indiab
133.5 186.3 236.3 302.2 382.9 465.1 567.9 703.9 842.7 1,071.4 1,302.9 1,597.2
IV. Unit Trust of India — 60.5 85.6 62.2 23.6 19.4 4.0 6.7 45.1 14.8 32.9 34.8 V. NABARD 17.7 16.9 18.6 14.2 13.4 13.4 13.1 12.9 12.1 12.9 12.3 20.5 VI. Employees Provident
Fund Scheme 6.2 6.2 6.2 10.0 18.5 27.8 42.7 60.7 87.3 110.1 135.5 166.8
VII. Coal Mines Provident Fund Scheme
2.3 2.3 2.3 5.5 7.5 9.7 11.4 13.6 15.0 18.3 23.3 —
VIII. Primary Dealers — — — — — — — — 76.5 70.8 97.8 97.1 IX. Otherc 42.7 5.3 45.8 58.5 114.3 198.1 301.4 386.2 273.6 401.0 666.0 357.5 — = not available, NABARD = National Bank for Agriculture and Rural Development. Note: The data represent the face value of interest-bearing, outstanding rupee securities excluding treasury bills; savings deposit certificates; other postal obligations; prize bonds; expired loans; and interest-free, nonnegotiable, Government securities. a Excluding regional rural banks. b Represents the corporation’s investment of funds from its life insurance business and capital redemption insurance business in Government securities. c Includes subscriptions made by the rest of the economy including, among others, all-India and some state-level financial institutions and/or corporations, plantation
provident funds, and refinancing institutions. Source: Reserve Bank of India. Database on India Economy. Handbook of Statistics on Indian Company. Available: http://www.rbi.org.in/scripts/Statistics.aspx.
Appendix 2 19

26 Appendix 3
CHRONOLOGY OF THE GOVERNMENT’S SECURITIES MARKET REFORMS
Year Reform Initiated Objective Remarks
June 1992 Introduction of auction method for issue of Central Government Securities
To make Government yields market determined
Price discovery has become very fine over a period of time.
December 1992
Introduction of the Reserve Bank of India (RBI) repo auction
Fine-tuning liquidity Precursor to Liquidity Adjustment Facility
January 1994
Issued Zero Coupon Bond for the first time. Securities Trading Corporation of India commenced operations
To add new instruments and intermediaries
Securities Trading Corporation of India and other Primary Dealers (PDs) have become important intermediaries in the Government securities market.
August 1994
Agreement between RBI and Government of India on limiting issue of ad hoc treasury bills
To do away with automatic monetization
Improved cash management for Government and a transparent issuance process
March 1995
PD system introduced To strengthen the market Intermediation and support primary issue
PD system has evolved as an important segment of Government security market.
July 1995 Delivery-versus-Payment (DVP) in Government securities was introduced
To reduce settlement risk
We have now moved to DVP-III.
September 1995
Floating Rate Bonds introduced To add more instruments
Floaters are now becoming popular. 15–20% of fresh Government of India borrowing is now through Floating Rate Bonds.
January 1997
Technical Advisory Committee constituted
To advise RBI on developing Government security, money and foreign exchange markets
Plays a pivotal role in implementing RBI’s reform agenda based on a consultative approach
March 1997
Introduction of Way and Means Advances system for Centre
Discontinuation of automatic monetization
Improved transparency and pricing as also autonomy in monetary policy making.
April 1997 The Fixed Income Money Market Dealers Association of India was established
Introduction of self regulation and development of market practices and ethics
Improved practices. Repo market has been developing.
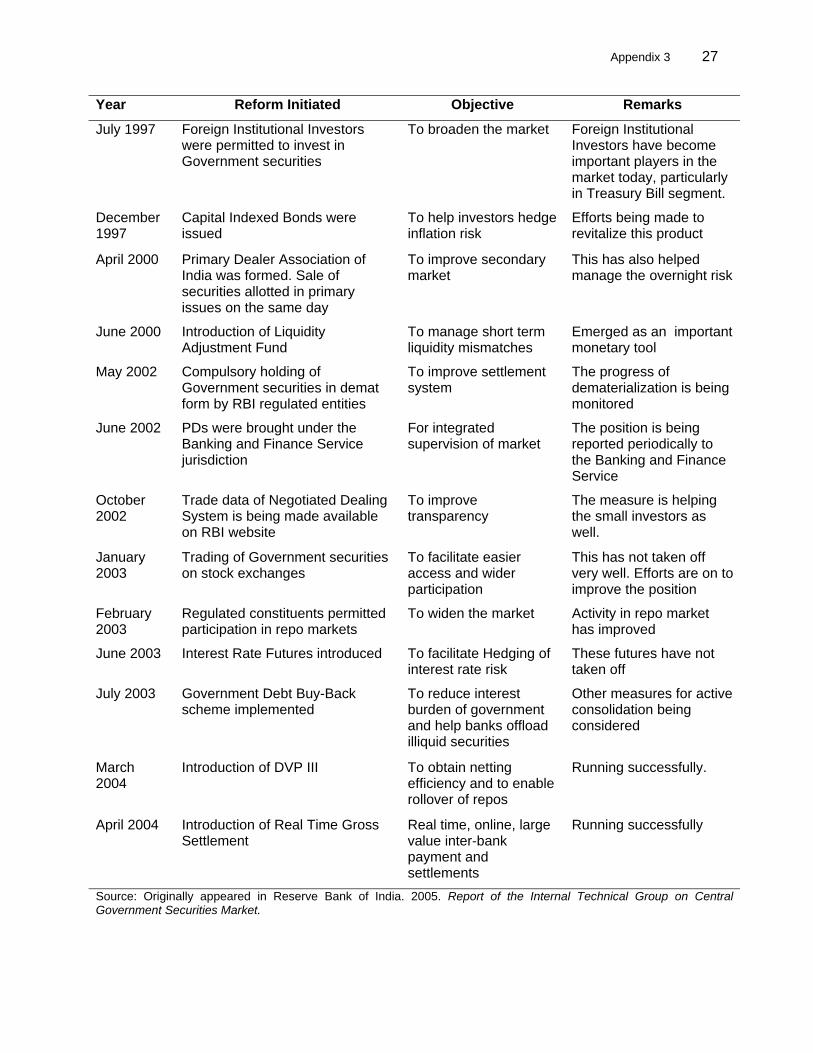
Appendix 3 27
Year Reform Initiated Objective Remarks
July 1997 Foreign Institutional Investors were permitted to invest in Government securities
To broaden the market Foreign Institutional Investors have become important players in the market today, particularly in Treasury Bill segment.
December 1997
Capital Indexed Bonds were issued
To help investors hedge inflation risk
Efforts being made to revitalize this product
April 2000 Primary Dealer Association of India was formed. Sale of securities allotted in primary issues on the same day
To improve secondary market
This has also helped manage the overnight risk
June 2000 Introduction of Liquidity Adjustment Fund
To manage short term liquidity mismatches
Emerged as an important monetary tool
May 2002 Compulsory holding of Government securities in demat form by RBI regulated entities
To improve settlement system
The progress of dematerialization is being monitored
June 2002 PDs were brought under the Banking and Finance Service jurisdiction
For integrated supervision of market
The position is being reported periodically to the Banking and Finance Service
October 2002
Trade data of Negotiated Dealing System is being made available on RBI website
To improve transparency
The measure is helping the small investors as well.
January 2003
Trading of Government securities on stock exchanges
To facilitate easier access and wider participation
This has not taken off very well. Efforts are on to improve the position
February 2003
Regulated constituents permitted participation in repo markets
To widen the market Activity in repo market has improved
June 2003 Interest Rate Futures introduced To facilitate Hedging of interest rate risk
These futures have not taken off
July 2003 Government Debt Buy-Back scheme implemented
To reduce interest burden of government and help banks offload illiquid securities
Other measures for active consolidation being considered
March 2004
Introduction of DVP III To obtain netting efficiency and to enable rollover of repos
Running successfully.
April 2004 Introduction of Real Time Gross Settlement
Real time, online, large value inter-bank payment and settlements
Running successfully
Source: Originally appeared in Reserve Bank of India. 2005. Report of the Internal Technical Group on Central Government Securities Market.

28 Appendix 4
KEY INFRASTRUCTURE FOR THE GOVERNMENT SECURITIES MARKET1 A. Securities Settlement System 1. Settlement of Government securities and funds is being done on a Delivery vs. Payments (DVP) basis in the books of the Reserve Bank of India (RBI) since 1995. A Special Funds Facility from Reserve Bank for securities settlement has also been in operation since October 2000 for breaking a gridlock situation arising from the course of DVP settlement. With the introduction of Clearing Corporation of India Limited (CCIL) in February 2002, which acts as clearing house and a central counterparty, the problem of gridlock of settlements has been reduced. To enable Constituent Subsidiary General Ledger account holders to avail of the benefits of dematerialized holding through their bankers, detailed guidelines have been issued to ensure that entities providing custodial services for their constituents employ appropriate accounting practices and safekeeping procedures. With the implementation of Real-Time Gross Settlement (RTGS) System, Securities Settlement System will also be linked to RTGS System to provide intraday liquidity to the market participants. B. Negotiated Dealing System
2. The Negotiated Dealing System (NDS), which was operationalized on 15 February 2002, provides based electronic dealing and reporting of transactions in money market instruments (including repo), facilitates secondary market transactions in Government securities disseminates information on trades with minimal time lag, and provides an online electronic bidding facility in the primary auctions of Central/State Government securities, and OMO/LAF auctions. This system is now being developed further so that anonymous based, order matching trading can take place more efficiently and reduce telephone based trading. In addition, the NDS enables “paperless” settlement of transactions in Government securities with electronic connectivity to CCIL and the DVP settlement system at the Public Debt Office (PDO) through electronic subsidiary general ledger (SGL) transfer form. All entities having SGL Accounts with RBI were advised to join the NDS-CCIL system by 31 March 2003. In phase I B of PDO-NDS Project, NDS was integrated with the securities settlement system and primary market operations. Further, all the regional PDOs were interconnected and automated which resulted in electronic maintenance of record of ownership of stock in physical and SGL form. This has facilitated electronic transfer of record of ownership to any PDO in the country.
C. Clearing Corporation of India Limited
3. The CCIL has started clearing of transactions in Government securities and repos reported on the NDS since 15 February 2002 and clearing of Rupees/US$ foreign exchange spot and forward deals since 12 November 2002. Acting as a central counterparty through novation, the CCIL provides guaranteed settlement and has in place risk management systems to limit settlement risk and operates a settlement guarantee fund backed by lines of credit from commercial banks. The netting of funds by CCIL reduces the liquidity requirements of the market and thereby liquidity risk of the system. All the transactions in Government securities concluded or reported on NDS have to be necessarily settled through the CCIL. CCIL has also initiated another instrument called “Collateralized Borrowing and Lending Obligation” which is a tripartite repo product for facilitating liquidity and cash management to other participants (Table A4). There are so far 156 members of CCIL.
1 This section appears in Mohan, Rakesh. 2004. A Decade of Reform in Government Securities Market in India and
the Road Ahead. Reserve Bank of India Bulletin (November): 1019–1021.
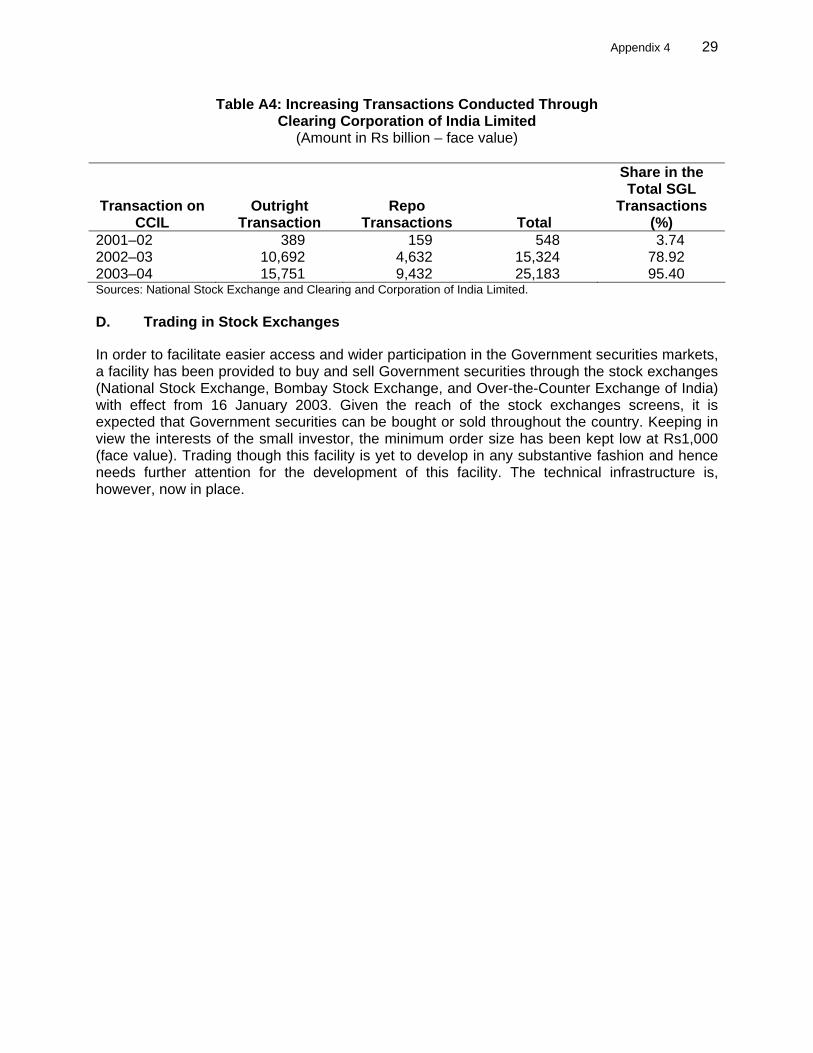
Appendix 4 29
Table A4: Increasing Transactions Conducted Through Clearing Corporation of India Limited
(Amount in Rs billion – face value)
Transaction on CCIL
Outright Transaction
Repo Transactions Total
Share in the Total SGL
Transactions (%)
2001–02 389 159 548 3.74 2002–03 10,692 4,632 15,324 78.92 2003–04 15,751 9,432 25,183 95.40 Sources: National Stock Exchange and Clearing and Corporation of India Limited. D. Trading in Stock Exchanges
In order to facilitate easier access and wider participation in the Government securities markets, a facility has been provided to buy and sell Government securities through the stock exchanges (National Stock Exchange, Bombay Stock Exchange, and Over-the-Counter Exchange of India) with effect from 16 January 2003. Given the reach of the stock exchanges screens, it is expected that Government securities can be bought or sold throughout the country. Keeping in view the interests of the small investor, the minimum order size has been kept low at Rs1,000 (face value). Trading though this facility is yet to develop in any substantive fashion and hence needs further attention for the development of this facility. The technical infrastructure is, however, now in place.
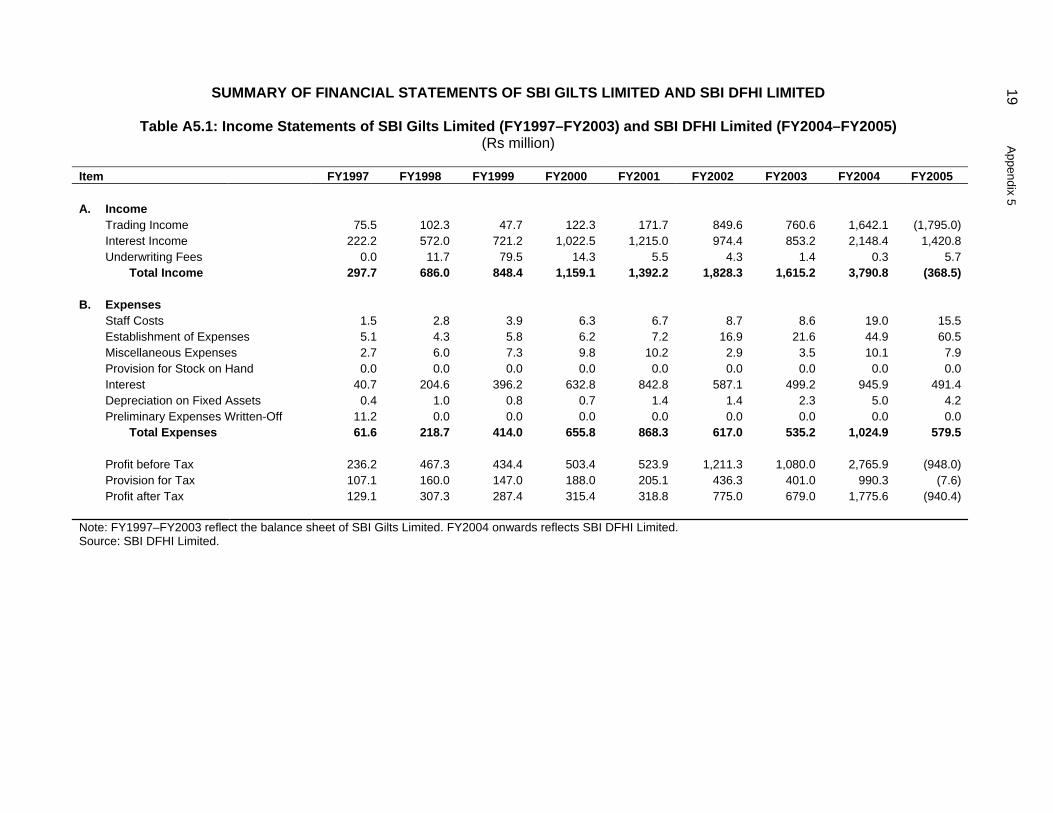
SUMMARY OF FINANCIAL STATEMENTS OF SBI GILTS LIMITED AND SBI DFHI LIMITED
Table A5.1: Income Statements of SBI Gilts Limited (FY1997–FY2003) and SBI DFHI Limited (FY2004–FY2005) (Rs million)
Item FY1997 FY1998 FY1999 FY2000 FY2001 FY2002 FY2003 FY2004 FY2005 A. Income Trading Income 75.5 102.3 47.7 122.3 171.7 849.6 760.6 1,642.1 (1,795.0) Interest Income 222.2 572.0 721.2 1,022.5 1,215.0 974.4 853.2 2,148.4 1,420.8 Underwriting Fees 0.0 11.7 79.5 14.3 5.5 4.3 1.4 0.3 5.7 Total Income 297.7 686.0 848.4 1,159.1 1,392.2 1,828.3 1,615.2 3,790.8 (368.5) B. Expenses Staff Costs 1.5 2.8 3.9 6.3 6.7 8.7 8.6 19.0 15.5 Establishment of Expenses 5.1 4.3 5.8 6.2 7.2 16.9 21.6 44.9 60.5 Miscellaneous Expenses 2.7 6.0 7.3 9.8 10.2 2.9 3.5 10.1 7.9 Provision for Stock on Hand 0.0 0.0 0.0 0.0 0.0 0.0 0.0 0.0 0.0 Interest 40.7 204.6 396.2 632.8 842.8 587.1 499.2 945.9 491.4 Depreciation on Fixed Assets 0.4 1.0 0.8 0.7 1.4 1.4 2.3 5.0 4.2 Preliminary Expenses Written-Off 11.2 0.0 0.0 0.0 0.0 0.0 0.0 0.0 0.0 Total Expenses 61.6 218.7 414.0 655.8 868.3 617.0 535.2 1,024.9 579.5 Profit before Tax 236.2 467.3 434.4 503.4 523.9 1,211.3 1,080.0 2,765.9 (948.0) Provision for Tax 107.1 160.0 147.0 188.0 205.1 436.3 401.0 990.3 (7.6) Profit after Tax 129.1 307.3 287.4 315.4 318.8 775.0 679.0 1,775.6 (940.4) Note: FY1997–FY2003 reflect the balance sheet of SBI Gilts Limited. FY2004 onwards reflects SBI DFHI Limited. Source: SBI DFHI Limited.
19 Appendix 5

Appendix 5 31
Table A5.2: Balance Sheets of SBI Gilts Limited (FY1999–FY2003) and SBI DFHI Limited (FY2004–FY2005) (Rs million)
Item FY1997 FY1998 FY1999 FY2000 FY2001 FY2002 FY2003 FY2004 FY2005 A. Net Worth and Liabilities 1. Shareholders' Equity Paid-Up Capital 1,000.0 1,000.0 1,000.0 1,000.0 1,000.0 1,000.0 1,000.0 2,909.1 2,909.1 Reserves and Surplus 99.6 294.0 471.4 652.6 817.0 1,343.2 1,739.5 7,614.5 6,671.8 Total (A1) 1,099.6 1,294.0 1,471.4 1,652.6 1,817.0 2,343.2 2,739.5 10,523.6 9,580.9 2. Borrowing Short-Term Borrowing 1,822.2 600.0 6,002.4 9,878.2 7,295.7 5,546.8 3,297.8 11,635.2 5,414.4 Long-Term Borrowing 0.0 0.0 0.0 0.0 0.0 0.0 0.0 Total (A2) 1,822.2 600.0 6,002.4 9,878.2 7,295.7 5,546.8 3,297.8 11,635.2 5,414.4 3. Deferred Tax Liability 0.0 0.0 0.0 0.0 0.0 0.0 0.0 0.3 0.0 Total 2,921.8 1,894.0 7,473.8 11,530.8 9,112.7 7,890.0 6,037.3 22,159.1 14,995.3 B. Application of Funds 1. Fixed Assets Gross Fixed Assets 3.2 4.0 4.3 5.8 8.9 14.8 15.2 54.2 56.3 Less Depreciation 0.4 1.3 2.1 2.8 4.2 5.7 7.9 34.9 39.0 Net Fixed Assets 2.8 2.7 2.2 3.1 4.7 9.1 7.3 19.3 17.3 2. Securities Held, Net of Provisions 2,768.1 1,813.6 6,167.3 8,685.5 8,845.8 7,933.7 6,156.0 20,936.7 10,746.9 3. Current Assets 150.9 77.7 1,304.3 2,842.2 262.2 (58.7) (131.0) 1,024.2 4,045.0 4. Investments 0.0 0.0 0.0 0.0 0.0 5.0 5.0 178.2 178.2 5. Deferred Tax Assets 0.0 0.0 0.0 0.0 0.0 0.9 0.0 0.0 7.4 6. Deferred Revenue Expense 0.0 0.0 0.0 0.0 0.0 0.0 0.0 0.7 0.5 Total 2,921.8 1,894.0 7,473.8 11,530.8 9,112.7 7,890.0 6,037.3 22,159.1 14,995.3 Note: FY1997–FY2003 reflect the balance sheet of SBI Gilts Limited. FY2004 onwards reflects SBI DFHI Limited. Source: SBI DFHI Limited.

32 Appendix 6
FINANCIAL INTERNAL RATE OF RETURN ON THE ASIAN DEVELOPMENT BANK’S INVESTMENT IN SBI DFHI LIMITED
Table A6.1: Internal Rate of Return Using a Net Asset Value Method to Calculate the Share Value
at Exit Assuming the Asian Development Bank Divested on 31 March 2005, FY1997–FY2005 (Rs ‘000)
Item FY1997 FY1998 FY1999 FY2000 FY2001 FY2002 FY2003 FY2004 FY2005 Investment (150,000) Dividends Paid to
ADB
15,000
15,000
18,000
21,000
37,500
37,500
40,909
Divestment 449,100 Net
Inflow/(Outflow)
(150,000)
15,000
15,000
18,000
21,000
37,500
37,500
40,909
449,100 IRR in Rs 24.37% ADB = Asian Development Bank, FY = fiscal year, IRR = internal rate of return. Source: Operations Evaluation Mission.
Table A6.2: Internal Rate of Return Using a Net Asset Value Method to Calculate the Share Value
at Exit Assuming the Asian Development Bank Divested on 31 March 2005, FY1997–FY2005 ($)
Item FY1997 FY1998 FY1999 FY2000 FY2001 FY2002 FY2003 FY2004 FY2005 Investment (4,192,286) Dividends paid
to ADB
352,941
347,745
404,949
447,046
765,619
797,533
889,328
Divestmenta 10,262,794 Net Inflow/ (Outflow)
(4,192,286)
352,941
347,745
404,949
447,046
765,619
797,533
889,328
10,262,794
IRR in $ 20.01% ADB = Asian Development Bank, FY = fiscal year, IRR = internal rate of return. a Based on 31 March 2005 net asset value of Rs329.34 and exchange rate of Rs43.76/$1.00. Source: Operations Evaluation Mission.
Table A6.3: Internal Rate of Return Using a Net Asset Value Method to Calculate the Share Value at Exit Assuming the Asian Development Bank Will Divest on 31 March 2006, FY1997–FY2006 a
($) Item FY1997 FY1998 FY1999 FY2000 FY2001 FY2002 FY2003 FY2004 FY2005 FY2006 Investment (4,192,286) Dividends
paid to ADB
352,941 347,745
404,949 447,046
765,619
797,533 889,328 0
Divestmentb 10,319,391 Net Inflow/
(Outflow) (4,192,286)
352,941 347,745
404,949 447,046
765,619
797,533 889,328 0 10,319,391 IRR in $ 18.29% ADB = Asian Development Bank, FY = fiscal year, IRR = internal rate of return. a Assuming no increase in net worth and no dividends paid to ADB during FY2006. b Based on 31 March 2005 net asset value of Rs329.34 using the 30 June 2005 exchange rate of Rs43.52/$1.00. Source: Operations Evaluation Mission.

MANAGEMENT RESPONSE TO THE PROJECT PERFORMANCE EVALUATION REPORT FOR THE SBI DFHI LIMITED IN INDIA
(Investment 7122-IND)
On 10 February 2006, the Director General, Operations Evaluation Department, received the following response from the Managing Director General on behalf of Management:
A. Overall Assessment 1. In general, Management finds the paper well prepared and very comprehensive in the evaluation of the project and its implementation. The report provides an excellent analysis of the growth of the Government Securities Market in India over the last 10 years and the role that the investee company played in promoting the accompanying capital market reforms. Management response focuses primarily on the overall assessment and the lessons learned.
2. Management notes that the PPER rates the overall project as satisfactory. While we can agree with this overall rating of the project, we would have wished for OED to place more emphasis on the fact that ADB’s assistance, through its Private Sector Operations Department (PSOD), to the establishment of the leading primary dealer company in the country contributed significantly to the development of the Government securities market. As stated in various parts of the report, this project is a fine example of ADB's private sector operations supporting broader policy dialogue undertaken by the public sector of ADB. The investment in SBI DFHI Limited serves as a prime model for the successful collaboration between the private and public sector side of ADB, whereby its public sector side helped develop an enabling environment for the target sector and PSOD then tested the robustness and market-friendliness of these policy measures by participating in an actual transaction. Clearly, the outcome of ADB's support to the Government's reform program was highly successful as evidenced by the growth and turnover of the Government securities market over the last ten years. We believe this positive achievement should have been reflected in a higher rating with respect to the project’s development outcome.
B. Lessons Learned 3. Management notes that a number of the lessons learned focus mainly on the fact that PSOD was not able to exit this investment as originally envisioned through a public offering within 4 years from the date of the investment. To address this issue, OED recommends that PSOD’s equity investments require a workable and viable exit mechanism. In particular, it is suggested that PSOD should not solely rely on an IPO and needs, therefore, to implement other divestment modalities such as a put option to the sponsor or majority shareholder. In this respect, PSOD agrees that an IPO is not always the best exit option as it might be difficult to achieve in view of the illiquid and underdeveloped state of many capital markets in ADB’s developing member countries. The emerging markets in the region continue to remain somewhat volatile and unpredictable, and it is not unusual for a planned IPO to be postponed for one or

even several years until favorable circumstances exist which support a successful public listing.
4. However, it should also be emphasized at this point that a put option is not always commercial or legally viable, and in most cases would provide for a price that is substantially lower than the market value of the shares. A put option against other shareholders may result in consolidation issues for that shareholder and a put option against the company itself may not always be easily enforceable, depending on legal and regulatory framework in the relevant country. Furthermore, ADB would take credit risk on the counterparty to the put option, which may not financially be able to comply with terms of the put. It is, therefore, essential that PSOD be given the autonomy to structure a workable and viable exit mechanism suitable to the type of investment and the particular characteristics and circumstances of each project.
5. In connection with the exit issue, it should also be highlighted that the project has been highly successful in terms of the company's financial position, profitability, quality of management and risk control systems. SBI DFHI has been profitable from its start and has always paid a dividend to ADB—with the exception of FY2005. As of December 2005, the company has almost returned ADB’s investment of $4.19 million through dividend payments amounting to $4 million so far. The total net asset value of ADB's shares in the company is currently valued at $10.2 million which will translate to an FIRR of roughly 18% assuming ADB would divest on 31 March 2006. This is certainly an excellent return on ADB's investment.
6. ADB continues to incorporate the lessons learned from its past investments by improving transaction structures in order to allow for timely exits. In this regard, PSOD has been able to negotiate put options in a number of its recent equity investments1 and will consider put options in relation to equity investments going forward.
C. Conclusion 7. Management agrees with the overall rating of the project and the report’s conclusion that the investment in SBI DFHI Limited contributed to the establishment of a primary dealer system in India which, in turn, supported the development of the Government securities market. Management notes OED’s comments regarding the desirability of a put option, but it also wishes to highlight that the investment was timely and complementary to ADB’s public sector operations and was highly successful in terms of the achieved and further expected financial return to ADB.
8. In line with the report’s recommended follow-up actions, PSOD has initiated discussions with the company and the SBI Group, its majority shareholder, regarding the sale of ADB’s shares.
1 A put option is in place in the following investments: MON-7197: Trade and Development Bank of Mongolia; AFG-
7199: Afghanistan International Bank; PRC-7200: Credit Orienwise Group; PRC-7219: Bank of China, Ltd.