project report icra pdf
TRANSCRIPT
A STUDY ON SIGNIFICANT DIFFERENCES IN CREDIT
RATINGS BY RATING AGENCIES
Summer Internship Report by Prateek Gupta, April-May, 2014
Mentor: Ms Manushree Saggar
Assistant Vice President
Faculty Advisor: Ms Nidhi Kaicker SBPPSE, AUD
Faculty Mentor: Dr. Kartik Dave

2
Acknowledgement First, I express my sincere gratitude to Ms Manushree Saggar, Assistant Vice-
President, Banking and Finance, ICRA Limited for allowing me to conduct this
project under her auspices. I am especially grateful for her confidence and the
freedom she gave me to do this work.
As a supervisor, Ms Manushree Saggar supported me in all stages of this work. She is
the initiator of this project and always gave me constant encouragement and advice,
despite her busy agenda. Without a coherent and illuminating instruction, this project
would not have reached its present form. I would like to thank her for the patient and
continuous guidance, encouragement, meticulous suggestions she has provided
throughout my work.
My sincere thanks to Mr. Puneet Maheshwari, Senior Analyst, Banking and Finance,
ICRA Limited and Ms. Monica Sharma, HR manager, ICRA Limited for their
constant support, help and cooperation throughout the project and for making me feel
so welcomed at ICRA Limited.
I would like to acknowledge the assistance of Mr. Ravi Rao, Mr. Saurabh Mittal who
offered me valuable suggestions for this study and express my gratitude for giving
their vital inputs, without which the study would not have been possible.
I would also like to express my thanks to Ms. Nidhi Kaicker, Assistant Professor,
School of Business, Public Policy and Social Entrepreneurship, Ambedkar University
Delhi for all the support and assistance.
Lastly I would like to extend my sincere thanks to all members of the ICRA Limited,
and all those who contributed directly or indirectly to this project.
PRATEEK GUPTA
MBA, BATCH-2015
SCHOOL OF BUSINESS, PUBLIC POLICY AND SOCIAL ENTREPRENEUSHIP
AMBEDKAR UNIVERSITY DELHI
3
Table of Contents
Executive Summary ............................................................................................................4 Chapter 1 ...............................................................................................................................5
Introduction ................................................................................................................................... 5 Importance of credit ratings ................................................................................................................... 5
Credit Rating in India ................................................................................................................. 7 Credit Rating in Recent Times .................................................................................................. 9
Chapter 2 ............................................................................................................................ 11 Problem Definition .................................................................................................................... 11 Objective...................................................................................................................................... 12 Methodology & Data................................................................................................................. 13
Data ............................................................................................................................................................. 13 Methodology ............................................................................................................................................ 17
Chapter 3 ............................................................................................................................ 19 Results .......................................................................................................................................... 19
Chapter 4 ............................................................................................................................ 24 Conclusion................................................................................................................................... 24
Bibliography..................................................................................................................... 26 Annexure: ........................................................................................................................... 28
Company Overview................................................................................................................... 28 Description................................................................................................................................................ 28 Key Offerings .......................................................................................................................................... 28 Financials .................................................................................................................................................. 31 Organizational Structure ...................................................................................................................... 33 Competitors .............................................................................................................................................. 33
Key Deliverables ........................................................................................................................ 35
4
Executive Summary It has been observed that credit ratings of companies have been gaining a lot of
importance lately specially after the US financial crisis and investors often use these
ratings as important information for various financial purposes and investment
decisions. Therefore the aim of this report was to investigate if there were any
differences in the credit ratings provided by different credit rating agencies to the
same companies, and if any, why? For this purpose a dataset was prepared from
various secondary sources to sort out the same set of companies credit rated by the
two largest credit rating agencies in India i.e. CRISIL and ICRA Limited. The method
of research used was statistical analysis using SPSS software. The dataset was
analyzed using paired sample t test by comparing the means of ratings provided by the
two rating agencies for all the companies, industry sector wise and on the basis of
them being listed or not. The goal of this paper was to check whether the null
hypothesis i.e. “ There is no significant difference in the credit ratings given by
CRISIL and ICRA to the same set of companies” was true or false and the results
were surprising.
According to the statistical tests run, it showed that there were significant difference
in the ratings provided by two different rating agencies for all companies, core
industry sectors such as Chemicals, pharmaceuticals, textiles, education, health,
consumer services, construction and engineering and non-listed companies. There
were often different ratings given by these two agencies for the same companies.
Going further as to why these differences in the ratings even when the parameters on
which these companies are rated are usually the same, it was found that firstly credit
ratings are subjective and there is no fixed format or rationale followed by any rating
agency and it is the opinion of any individual rating agency. Secondly ICRA Limited
ratings reflect the likelihood that an obligator will default as well as loss given default
whereas CRISIL ratings reflect only the probability of default. Thirdly ICRA follows
a notching policy whereas CRISL doesn’t and this is the reason CRISIL rating is
usually more positive than ICRAs. All the above-mentioned reasons add to the
difference seen in the ratings given by these two agencies for the set of companies.
5
Chapter 1 Introduction Credit ratings are letter designations assigned by credit rating agencies, which
evaluate the credit worthiness of a debtor (a company in the case of corporate credit
ratings) based on its ability to pay back debt and the likelihood of default.
(Kaur & Kaur, 2011) in their study on rating methodologies of credit rating agencies
said Credit rating is the symbolic indicator of the current opinion of rating agencies
regarding the relative capability of issuer of debt instrument, to service the debt
obligations as per contract. The corporations with specialized functions namely,
assessment of the likelihood of the timely payments by an issuer on a financial
obligation is known as Credit Rating Agencies.
Importance of credit ratings In the post reforms period, with increase in activity and operations in the Indian
Financial sector, both new and existing companies are opting for finance from the
Indian Capital Market. The competition among the firms has also increased by an
excessive amount and the importance of credit ratings have also increased globally.
The importance of Credit Rating is significant as it can be seen as an investor service,
which establishes a link between risk & return. They also provide a yardstick against
which to measure the risk inherent in any instrument. Most importantly it helps in the
development of financial markets and therefore has an increased importance. Since an
investor uses the ratings to assess the risk level and compares the offered rate of
return with expected rate of return to optimize his risk return trade off. The risk
perception of a common investor in the absence of a rating system largely depends on
his familiarity and his knowledge of the financial market and the names of the
promoters and collaborators. Therefore, credit ratings play an important role of
reducing the knowledge gap or information symmetry between borrowers and lenders.
(Adelson, 2012) in a recent study observed that the importance of credit rating is
increasing was mainly due to the fact that there was a gap in distinction between high
risk borrower and low risk borrowers and the lenders charged all borrowers the same
rate of interest and volume of borrowing by low risk borrowers was suffering and
lenders would in turn misallocate productive resources away from low risk borrowers
which in turn would make the economic output suboptimal. It also helps the issuers of

6
debt instruments to price their issues correctly and to reach out to new investors.
Another way of describing the importance of credit rating is in terms of market
efficiency where they contribute to the operations of marketing. It helps to improve
market function and efficiency by reducing the ability of one investor to outperform
another by making better judgments about creditworthiness and puts investors on
equal footing. Given the systemic superstructure position that the Credit Rating
Agencies have come to occupy as information and insight gatekeepers, they play an
important role in the modern capital markets. Their importance is to various
stakeholders such as Investors, Issuers, Banks, and Regulators. To the investors, given
the vast amount of information available to them, some being valuable and some not,
CRAs play a useful role in helping investors sift through information and analyze the
credit risks they face when lending or purchasing. Issuers also rely on credit ratings as
an important tool to access investors and to reach a wider investor base. For Banks,
they are likely to save capital if they get loan rated, although it’s not mandatory under
BASEL II norms to get credit rating. The banks can save up capital if its credit rating
is high as their Risk weight1 would be less then and it is in turned passed on to the
borrower company in terms of reduced basis points. Regulators use ratings for
regulatory purposes. Firstly under BASEL II norms of the Basel Committee on
banking supervision, banking regulators can accredit credit rating agencies based on
some criteria and the ratings assigned by these External Credit Assessment
Institutions are used to assign risk weights to various bank exposures in calculating
capital charge. Thus, it provides comfort to the regulators in their assessment of
product risks and overall systemic risks. Secondly the increasing levels of default
resulting from easy availability of finance, has led to the growing importance of the
credit rating. The other factors are growth of information technology, Globalization of
financial markets, Increasing role of capital and money markets, Lack of government
safety measures, The trend towards privatization, Securitization of debt.
1 In terms of the minimum amount of capital that is required within banks and other institutions, based on a percentage of the assets, weighted by risk. For example, the loans that are secured by letter of credit would be weighted riskier than a mortgage loan that is secured with collateral.
7
Credit Rating in India (Kumar & Rao, 2012) in a recent study examined the Credit rating business in India
and declared the same to be a sweet spot as it is on the cusp of robust growth
potential, driven by three triggers: Strong capex cycle in Indian economy, lower
penetration of corporate bond market and regulatory push due to implementation of
Basel II norms.
Credit ratings are playing an increasingly important role in financial markets. In India,
rating is a more recent phenomenon, but the changing global perspectives on the
subject do impact the financial system. India was perhaps the first amongst
developing countries to set up a credit rating agency in 1988. The function of credit
rating was institutionalized when RBI made it mandatory for the issue of Commercial
Paper (CP) and subsequently by SEBI, when it made credit rating compulsory for
certain categories of debentures and debt instruments. In June 1994, RBI made it
mandatory for Non- Banking Financial Companies (NBFCs) to be rated. Credit rating
is optional for Public Sector Undertakings (PSUs) bonds and privately placed non-
convertible debentures up to Rs. 50 million. Fixed deposits of manufacturing
companies also have the option to get rated. The Reserve Bank of India liaises with
SEBI, on the issue of rating agencies’ adherence to IOSCO Code of Conduct
Fundamentals.
The Ratings industry in India has been built up to its present position over a period of
fifteen years. Over the years, credit ratings have evolved into a 90-crore market, with
four agencies providing rating services, and significant pull from investors for the
product. (Raghunathan & R. Varma) in a recent study examined that the ratings
business in India has seen two phases. During the first of these phases, there was no
experience of credit ratings, and virtually no awareness, on the part of investors and
issuers.
The second phase saw the advent of regulatory support for credit ratings, with the
introduction and increasing rigor of regulations covering primarily the markets for
public issue of debt and for fixed deposits, aimed at protecting smaller investors, these
measures also amounted to regulatory recognition of the role of credit ratings and the
quality of the effort put in till then, in estimating credit quality. With these measures,
credit ratings rapidly passed out of the arcane realm of high finance, and into the
8
lexicon of the individual market participant. This phase also saw the arrival of
competition, in the form of other domestic agencies entering the market.
In India the rating activities started with the incorporation of the Credit Rating
Information Services of India Ltd. (CRISIL) in 1987 which commenced its operations
of rating of companies in 1987-1988 and was promoted by Industrial Credit and
Investment Corporation of India Ltd. (ICICI) and Unit Trust of India (UTI). The
second rating agency Investment Information and Credit rating Agency of India Ltd.
(ICRA) was incorporated in 1991 and was jointly sponsored by Industrial Finance
Corporation of India (IFCI) and other financial institutions and banks. The other
rating agency, Credit Analysis and Research Ltd. (CARE), incorporated in April
1993, is a credit rating information and advisory services company promoted by
Industrial Development Bank of India (IDBI) jointly with Canara Bank, Unit Trust of
India (UTI), private sector banks and financial services companies. Another rating
agency Onicra Credit Rating Agency of India Ltd., which was incorporated in 1993, is
recognized as the pioneer of the concept of individual credit rating in India. Further
Duff and Phelps Credit Rating (India) Private Ltd. (DCR) was established in 1996,
which is presently known as Fitch Ratings India Private Ltd. One more rating agency
SME Rating Agency of India Limited (SMERA), which was a joint venture of SIDBI,
Dun & Bradstreet Information Services (D&B), Credit Information Bureau of India
Limited (CIBIL), and 11 other leading banks in the country, was established in 2005.
Further Duff and Phelps Credit Rating (India) Private Ltd. (DCR) was established in
1996, which is presently known as Fitch Ratings India Private Ltd. One more rating
agency SME Rating Agency of India Limited (SMERA), which was a joint venture of
SIDBI, Dun & Bradstreet Information Services (D&B), Credit Information Bureau of
India Limited (CIBIL), and 11 other leading banks in the country, was established in
2005. A new rating agency, Brickwork Ratings (BWR) that is based in Bangalore was
incorporated in 2007. Besides CRISIL (Standard & Poor), ICRA (Moody’s), CARE
and Fitch, Brickwork Ratings is the fifth Credit Rating Agency to be recognized by
SEBI.

9
Credit Rating in Recent Times Given the slump faced by economies globally and the rise in the number of
defaultees, it is about time that the economy had a strong credit rating system in place
to ensure smooth operation for the entire chain. The most significant change in recent
relates to emphasis on their accountability and more important, the caution in
regulators’ use of ratings. With the increasing market orientation of the Indian
economy, investors value a systematic assessment of two types of risks, namely –
business risk arising out of the open economy and linkages between money, capital
and foreign exchange markets and –payment risk. With a view to protect small
investors, who are the main target for unlisted corporate debt in the form of fixed
deposits with companies, credit rating has been made mandatory. In the recent times,
the world witnessed the worst financial crisis that began in the United States in 2007
with problems in the subprime mortgage market and credit rating agencies were
largely held responsible for it as they underestimated the risks associated with
structured credit products and failed to adjust their ratings quickly enough to
deteriorating market conditions. It is believed that the rating methods adopted by
different agencies and the differences in the ratings assigned by different credit rating
agency to the same company were significantly different, and were one of the main
reasons behind the crisis. Therefore the importance of credit ratings and regulation of
credit rating agencies has increased in the recent times. This happened mainly because
of the shortcomings such as they lowered the perception of credit risk by giving AAA
ratings to senior tranches of structured finance products like collateralized debt
obligations, same rating they gave to the government and corporate bonds yielding
systematically lower returns. Also there were flaws in rating methodologies such as
the lack of sufficient historical data relating to the US subprime market, an inability to
take into account the severe weakening of underwriting standards by originators,
overreliance on mathematical and statistical methodologies based on inadequate data,
failure to take account of interdependencies, disregard of conflict of interests. Since
then the agencies have been regulated strictly and in the US, they have been subject to
SEC oversight in the form of disclosure requirements. In the US CRA’s2 are officially
registered as NRSROs3, and the system was introduced in 1975, fundamentally
2 Credit rating Agency 3 Nationally recognized statistical rating organizations
10
revised in 2006. Moody’s and S&P were majorly responsible behind triggering the
worst financial crisis when they downgraded the inflated ratings of mortgage-backed
securities. It is believed that more than any other single event, the sudden downgrades
of residential mortgage backed securities and collateralized debt obligation ratings
were the immediate cause of the financial crisis.
As we have understood from above that credit ratings are symbols designated by
rating agencies to evaluate the credit worthiness of a debtor in terms of its capability
to service these debt obligations. Their importance has been increasing in the recent
times as the activity in the financial sector as well as the competition among the firms
is increasing at a rapid pace; therefore it acts as an investor service that establishes a
link between risk and return. In India, around 1987 RBI made credit rating mandatory
due to its increasing importance and risks in the financial markets and then emerged
two of the India’s major credit rating agencies with more than 90% market share
providing their rating services, such as CRISIL promoted by ICICI and UTI and
ICRA Limited which was jointly sponsored by IFCI and other financial institutions
and banks.
While both agencies have equivalent rating grades (ranging from AAA+ to D) yet
there are some subtle differences in what the credit ratings for two agencies measure.
In the next chapter we will discuss about the same as a problem and the main
objective of the paper is to assess the consistency in rating methodology of each
individual rating agency by taking companies belonging to same rating class (within
group) including AAA, AA, A and BBB as sample and with the help of statistical
tools, analyzing the significant differences in the ratings, if any.

11
Chapter 2
Problem Definition
ICRA Limited and CRISIL, India’s two biggest credit rating agencies’ rating rationale
includes analyzing business risk as well as financial risk, yet sometimes their credit
ratings for the same companies differ. This difference in the ratings by two agencies
for the same companies created a lot of confusion and some of the companies’ ratings
were inflated in the US, and when these agencies suddenly downgraded the ratings, it
led to a crisis, which is now known as the subprime crisis. Therefore our problem lies
in the difference in the credit ratings assigned by different Credit Rating Agencies to
the same companies in India, if any, which was one of the major reasons of subprime
crisis in the US. Although Credit Rating Agencies have different concepts and
measurements of the probability of default, various studies found a great similarity for
investment grade ratings ( Cantor and Packer, 1997). There have also been evidences
of difference in rating scales once we move beyond the two largest agencies. For
example, ratings for the same issuer tend to be lower for the two largest agencies (
CRISIL & ICRA ) as compared to others such as CARE, FITCH etc. The difference
in the ratings is usually due to different rating scales or simply the selection bias. If all
agencies rate all firms, then differences in the agencies’ average ratings can be
interpreted as differences in tehir rating scales, however many frims do not get rated
by other agencies such as CARE, CIBIL, FITCH, as a result observed differences
between the ratings of these agencies may reflect the effects of sample selection bias.
The selection bias is important because issuers that expect a low rating from a third
agency are unlikelt to request one. The major problem is while both the agencies have
equivalent rating grades and scales (ranging from AAA to D for both CRISIL &
ICRA) and almost all investors/analysts/ regulators treat these ratings as the same, yet
there are subtle differences in what the credit ratings for the two agencies measure.
(Ghosh, 2013) in his study of differences in S&Ps and Moody’s Credit ratings
menioned that CRISIL ratings are the opinions on the probability of default by a
corporate and Moody’s ratings are based on expected losses reflecting both the
probability of default and expected financial losses i.e Loss Given Default.Our
problem essentially is that is there any difference in the ratings assigned by CRISIL &

12
ICRA to the same companies and we will try to analyse if there is any difference or
not by using statistical comparison of the long term debt rated by CRISIL & ICRA.
Although (Kaur & Kaur, 2011) in their study Credit Rating in India, used profitability
ratios to assess whether there is any difference and found out that rating agencies use
consistent methodology while assigning a particular rating grade and there was no
significant difference in the value of all ratios that belonged to different sets of
similarly rated companies yet there were some exceptions to the quick ratio of AA
rated companies by CRISIL as there was significant difference in this ratio. In the
next section, we will try to state the objectives and methodology and then statistically
try to prove if there are actually any significant differences in the ratings
Objective CRISIL and ICRA are India’s two biggest and most important credit rating agencies
and their ratings are widely used for both regulatory and investment purposes. While
both agencies have equivalent rating grades (ranging from AAA+ to D) yet there are
some subtle differences in what the credit ratings for two agencies measure. This was
one of the reasons of the subprime crisis in the US, which motivated me to study the
differences if any in the ratings assigned by different CRAs in India. The main
objective of the paper is to assess the consistency in rating methodology of each
individual rating agency by taking companies belonging to same rating class (within
group) including AAA, AA, A and BBB as sample and with the help of statistical
tools, analyzing the significant differences in the ratings, if any.
The objective of this study is to find the significant differences in credit ratings by
CRISIL and ICRA in India. A statistical comparison of credit ratings from the two
agencies segmented by industry sectors, listed or non-listed; has been analyzed to see
whether three are any clear differences between them. The differences will be
analyzed by comparing the companies on the basis of ratings given by both the
agencies, then on the basis of industry to see whether there are any differences in the
ratings assigned for that industry segment, then the market capitalization will also
taken into account and finally bifurcation on the basis of whether the company is
listed or not listed and if there are any significant differences between the listed
companies and not listed companies rated by both CRISIL and ICRA.
13
Methodology & Data
Data We use ratings data for Indian companies (both listed and non listed). The sample size
is restricted by data availability- i.e. we select only those companies which are rated
by CRISIL as well as ICRA both.
The data includes the companies which are currently rated by both CRISIL and ICRA
and whose ratings have not been suspended or withdrawn. The data is taken from
secondary sources and it is readily available from various electronic sources such as
Bloomberg, Thomson Reuters, CRISIL rating scan, ICRA’s website and rating guide.
For this study the dataset has been limited to the Indian Companies and their long-
term ratings. The list of companies includes listed as well as non-listed companies.
The main concern here is that the universe of firms rated by both CRISIL and ICRA is
much smaller than the total firms that are rated by either one of them or any other
agency. This is because getting a credit rating involves a huge cost and therefore not
many companies get themselves rated by more than one agency. Out of the total
companies i.e. 15544 only 280 had credit ratings from both the agencies as on
March31, 2014. The common companies is much lower as it also includes Private
Limited companies which are generally rated by only one agency. The data has been
sorted according to the industry to which each company belongs to and with their
ratings and market capitalization and will be analyzed corresponding to these
parameters.
The following table shows the classification of ratings as to what each rating signifies
regarding the safety and the risk of default.

14
Table 1: Ratings Classification RATINGS CLASSIFICATION
AAA Highest degree of safety regarding timely servicing of financial obligations, lowest credit risk
AA High degree of safety, very low credit risk A Adequate degree of safety, low credit risk BBB Moderate degree of safety, moderate credit risk BB Moderate risk of default B High risk of default C Very high risk of default D Ratings are in default or expected to be in default
For the long-‐term ratings modifiers {"+" (plus) / "-‐"(minus)} can be used with the rating symbols for the categories [ICRA] AA to [ICRA] C. The modifiers reflect the comparative standing within the category.
Since letter ratings cannot be easily analyzed by statistical methods, therefore number
ranks from 0-19 have been assigned to each rating notch starting with AAA assigned
as 0. The higher number represents a lower rating and lower credit strength. The
difference in ranks (rating gap) will help in measuring the number of notches that a
long-term rating by the two agencies differs from each other. For the purpose of this
paper a positive rating gap will represent a higher CRISIL rating as compared to
ICRAs rating. So, for example, if the long-term rating for a company rated by CRISIL
is BBB+ and BBB- by ICRA, then the rating gap is +2 and on the other hand if the
rating by CRISIL is BBB- and rating by ICRA is BBB, then the rating gap is -1. Table
1 indicates the rating scale for both the agencies and the ranks assigned to them by us
for statistical comparison.
15
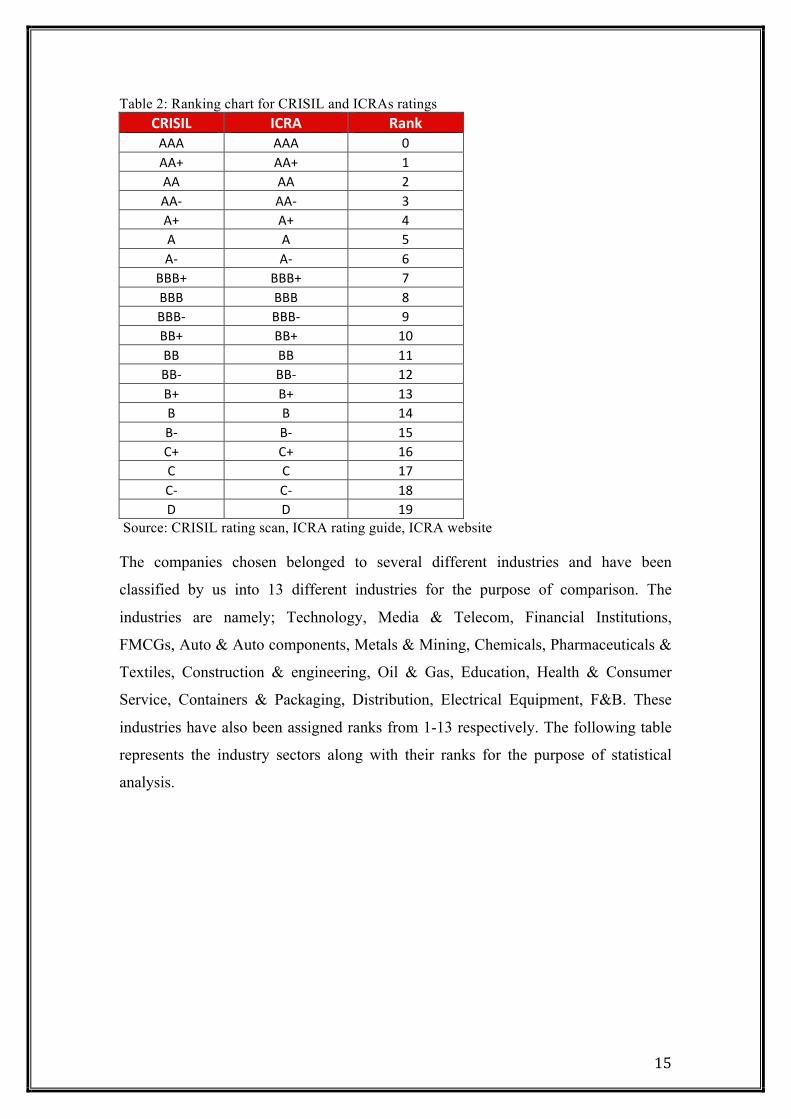
Table 2: Ranking chart for CRISIL and ICRAs ratings CRISIL ICRA Rank AAA AAA 0 AA+ AA+ 1 AA AA 2 AA-‐ AA-‐ 3 A+ A+ 4 A A 5 A-‐ A-‐ 6
BBB+ BBB+ 7 BBB BBB 8 BBB-‐ BBB-‐ 9 BB+ BB+ 10 BB BB 11 BB-‐ BB-‐ 12 B+ B+ 13 B B 14 B-‐ B-‐ 15 C+ C+ 16 C C 17 C-‐ C-‐ 18 D D 19
Source: CRISIL rating scan, ICRA rating guide, ICRA website The companies chosen belonged to several different industries and have been
classified by us into 13 different industries for the purpose of comparison. The
industries are namely; Technology, Media & Telecom, Financial Institutions,
FMCGs, Auto & Auto components, Metals & Mining, Chemicals, Pharmaceuticals &
Textiles, Construction & engineering, Oil & Gas, Education, Health & Consumer
Service, Containers & Packaging, Distribution, Electrical Equipment, F&B. These
industries have also been assigned ranks from 1-13 respectively. The following table
represents the industry sectors along with their ranks for the purpose of statistical
analysis.
16
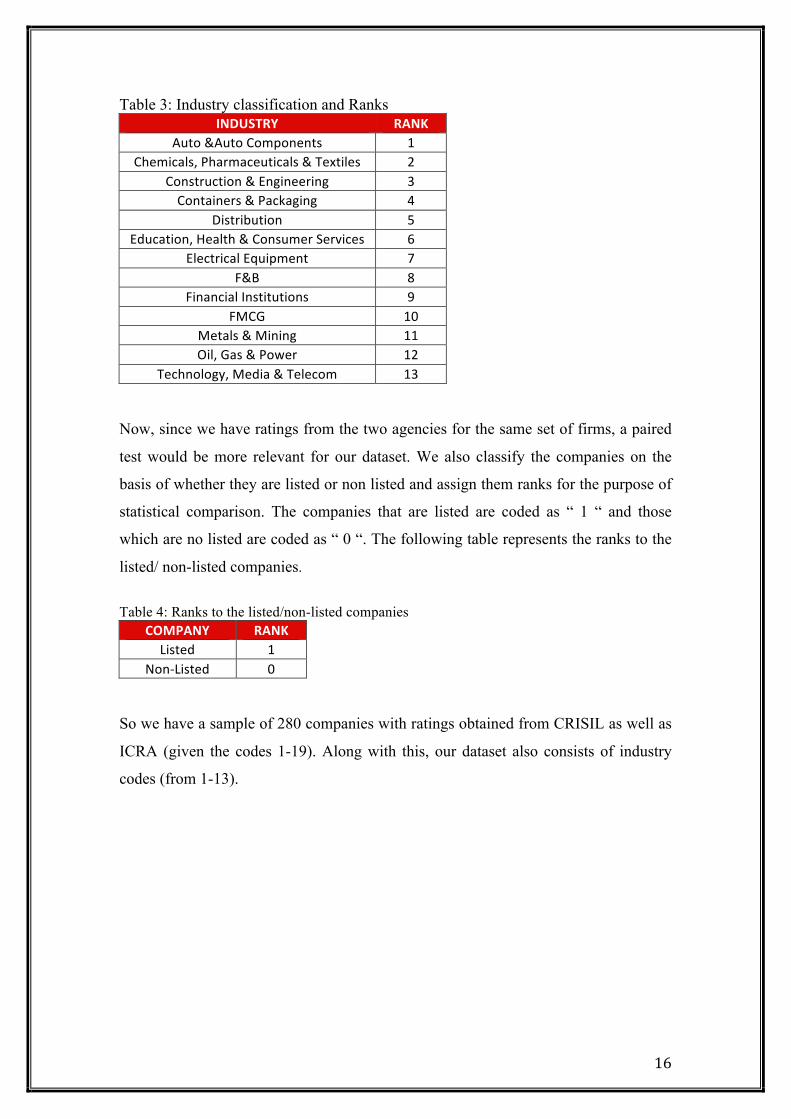
Table 3: Industry classification and Ranks INDUSTRY RANK
Auto &Auto Components 1 Chemicals, Pharmaceuticals & Textiles 2
Construction & Engineering 3 Containers & Packaging 4
Distribution 5 Education, Health & Consumer Services 6
Electrical Equipment 7 F&B 8
Financial Institutions 9 FMCG 10
Metals & Mining 11 Oil, Gas & Power 12
Technology, Media & Telecom 13
Now, since we have ratings from the two agencies for the same set of firms, a paired
test would be more relevant for our dataset. We also classify the companies on the
basis of whether they are listed or non listed and assign them ranks for the purpose of
statistical comparison. The companies that are listed are coded as “ 1 “ and those
which are no listed are coded as “ 0 “. The following table represents the ranks to the
listed/ non-listed companies.
Table 4: Ranks to the listed/non-listed companies COMPANY RANK
Listed 1 Non-‐Listed 0
So we have a sample of 280 companies with ratings obtained from CRISIL as well as
ICRA (given the codes 1-19). Along with this, our dataset also consists of industry
codes (from 1-13).
17
Methodology Using the dataset constructed as mentioned above, we use the Paired difference t test
to check the following-
♦ Whether there is a significant difference in ratings for all companies
♦ Whether there is a significant differences in ratings for companies
disaggregated by industry sectors
♦ Whether there is a significant difference in ratings for listed companies and
non-listed companies
The test used is as follows:
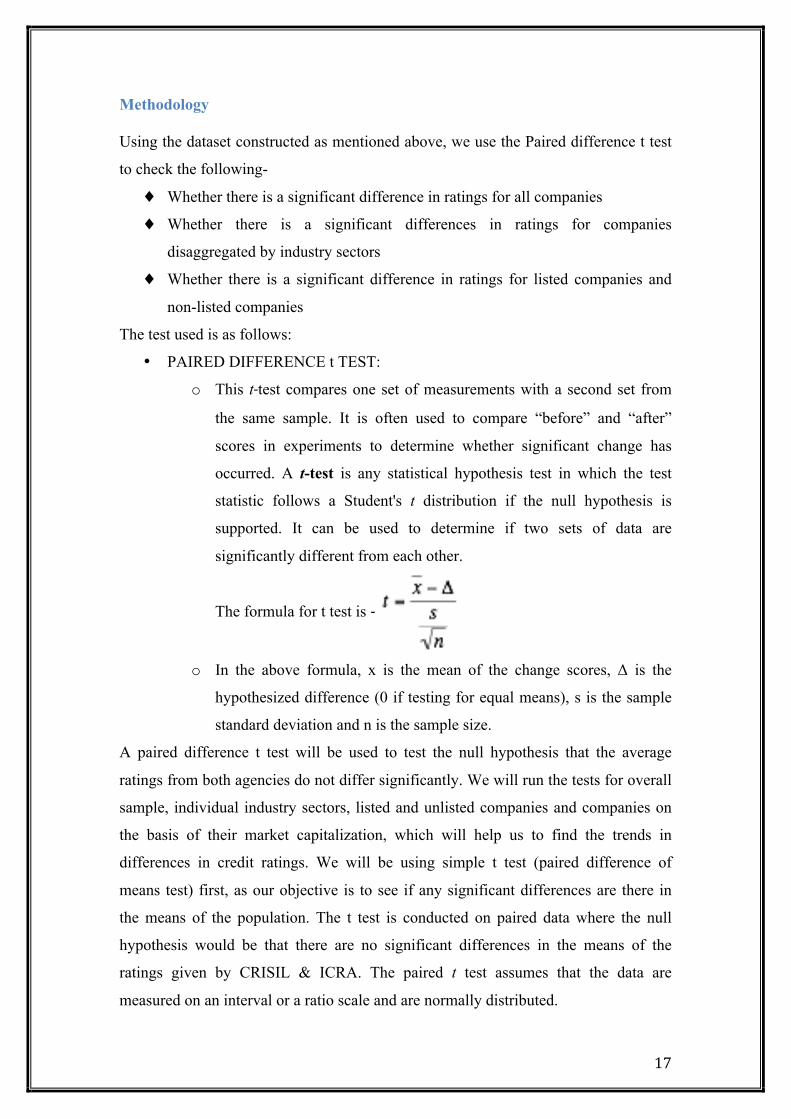
• PAIRED DIFFERENCE t TEST:
o This t‐test compares one set of measurements with a second set from
the same sample. It is often used to compare “before” and “after”
scores in experiments to determine whether significant change has
occurred. A t-test is any statistical hypothesis test in which the test
statistic follows a Student's t distribution if the null hypothesis is
supported. It can be used to determine if two sets of data are
significantly different from each other.
The formula for t test is -‐
o In the above formula, x is the mean of the change scores, Δ is the
hypothesized difference (0 if testing for equal means), s is the sample
standard deviation and n is the sample size.
A paired difference t test will be used to test the null hypothesis that the average
ratings from both agencies do not differ significantly. We will run the tests for overall
sample, individual industry sectors, listed and unlisted companies and companies on
the basis of their market capitalization, which will help us to find the trends in
differences in credit ratings. We will be using simple t test (paired difference of
means test) first, as our objective is to see if any significant differences are there in
the means of the population. The t test is conducted on paired data where the null
hypothesis would be that there are no significant differences in the means of the
ratings given by CRISIL & ICRA. The paired t test assumes that the data are
measured on an interval or a ratio scale and are normally distributed.

18
For the purpose of our analysis, we will use hypothesis testing where:
Null hypothesis: H0: µ1 = µ2 (There is no significant difference in the ratings by two
agencies)
Alternate Hypothesis: H1: µ1 ≠ µ2 (There is a significant difference in the ratings by
two agencies)
Significance level is α = 0.05
• µ1 = mean value of the ratings assigned ICRA to the same set of companies
• µ2 = mean value of the ratings assigned by CRISIL to the same set of
companies
With the help of the methodology explained above, we would perform the statistical
paired sample t test in SPSS and analyze the results on the basis of the tables obtained
from performing the test. This will help us in checking whether our null hypothesis is
true or false i.e. whether there are any significant differences in the ratings assigned
by CRISIL and ICRA Limited to the same set of companies. The test would be
performed for all the companies, companies belonging to specific industry i.e.
industry wise whether the significant difference is there or not for any particular
industry and also whether there is any significant difference for companies which are
listed or non-listed.
19
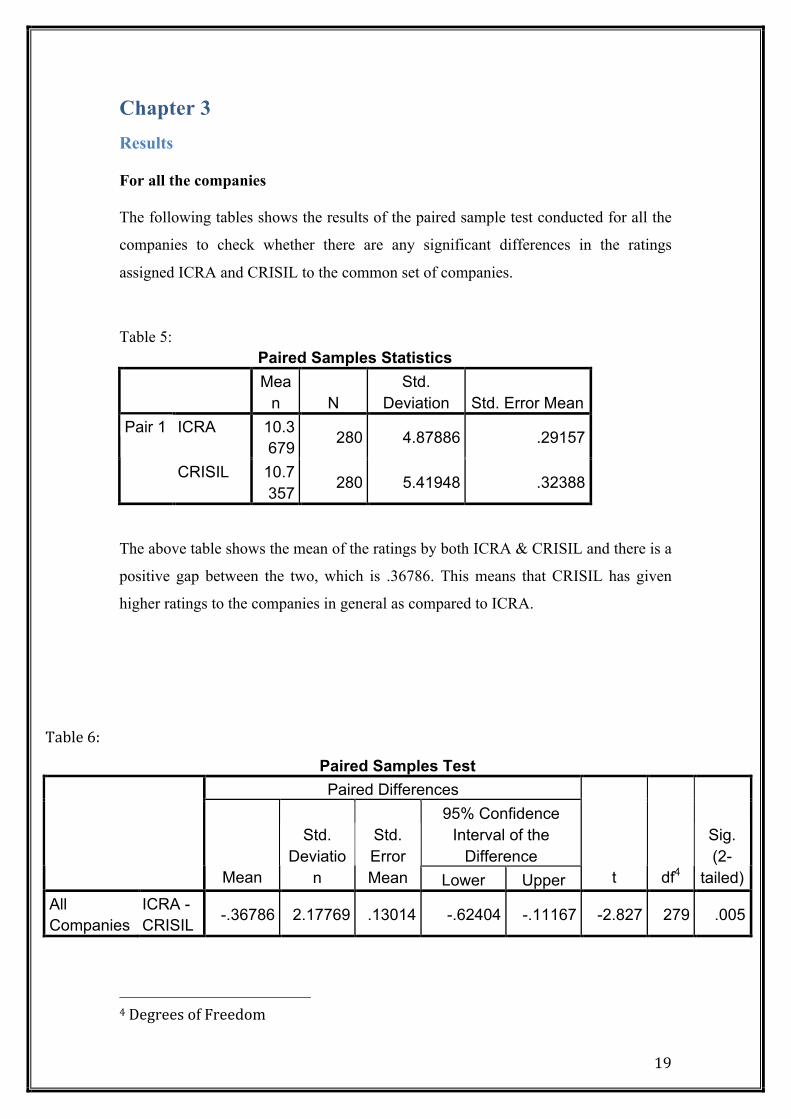
Chapter 3 Results For all the companies The following tables shows the results of the paired sample test conducted for all the
companies to check whether there are any significant differences in the ratings
assigned ICRA and CRISIL to the common set of companies.
Table 5:
Paired Samples Statistics
Mea
n N Std.
Deviation Std. Error Mean ICRA 10.3
679 280 4.87886 .29157 Pair 1
CRISIL 10.7357
280 5.41948 .32388
The above table shows the mean of the ratings by both ICRA & CRISIL and there is a
positive gap between the two, which is .36786. This means that CRISIL has given
higher ratings to the companies in general as compared to ICRA.
Paired Samples Test Paired Differences
95% Confidence Interval of the
Difference Mean
Std. Deviatio
n
Std. Error Mean Lower Upper t df4
Sig. (2-
tailed) All Companies
ICRA - CRISIL -.36786 2.17769 .13014 -.62404 -.11167 -2.827 279 .005
4 Degrees of Freedom
Table 6:
20
From the above tables, it is clear that CRISIL had higher average ratings than ICRA at
a significance level 0.05. Now according to Table 6, t statistic is -2.827 with 279
degrees of freedom. The p value is 0.005 which is lower than 0.05. Therefore if p <
0.05, we reject the null hypothesis. This means that there are significant differences in
the ratings assigned by CRISIL and ICRA to the same set of companies.
From the results obtained in Table 7, we can conclude that most of the industries had
statistically no significant differences between CRISIL and ICRA ratings. The only
exceptions were three industries namely Chemicals, Pharmaceuticals & Textiles and
Construction & Engineering and Education, Health & Consumer Services that in total
constituted 101 companies out of the total dataset of 280 companies.
For Chemicals, Pharmaceuticals & Textiles, the t value was -2.311 and the p value
was 0.026 that was lower than 0.05. Therefore we rejected the null hypothesis and
conclude that there is a significant difference in ratings assigned by CRISIL and
ICRA to the companies belonging to this industry sector. Similarly for Construction
& Engineering, the t value was -2.544 and p value was 0.015 that was lower than 0.05
and therefore the null hypothesis is rejected. The same way for the industry
Education, Health & Consumer Services, the t value was -5.209 and the p value was
0.000 that was lower than 0.05 and null hypothesis was rejected. For the remaining 10
industries, the statistical tests show that there were no significant differences in
ratings obtained by companies from CRISIL and ICRA.

21
Paired Samples Test Paired Differences
95% Confidence Interval of the
Difference INDUSTRY Mean
Std. Deviatio
n
Std. Error Mean Lower Upper t df
Sig. (2-
tailed) Auto & Auto Components
ICRA - CRISIL .47619 2.37948 .51924 -.60693 1.55931 .917 20 .370
Chemicals, Pharmaceuticals & Textiles
ICRA – CRISIL
-.78049 2.16232 .33770 -1.46300 -.09798 -2.311 40 .026
Construction & Engineering
ICRA – CRISIL -.66667 1.75810 .26208 -1.19486 -.13848 -2.544 44 .015
Containers & Packaging
ICRA – CRISIL .42857 .78680 .29738 -.29909 1.15624 1.441 6 .200
Distribution ICRA – CRISIL
.61905 1.96153 .42804 -.27383 1.51193 1.446 20 .164
Education, Health & Consumer Service
ICRA – CRISIL
-3.8666
7 2.87518 .74237 -5.45889 -2.27444 -5.209 14 .000
Electrical Equipment
ICRA – CRISIL
-.33333 .65134 .18803 -.74717 .08051 -1.773 11 .104
F&B ICRA – CRISIL -.26471 1.60130 .27462 -.82343 .20402 -.964 33 .342
Financial Institutions
ICRA – CRISIL
-.26087 1.35704 .20008 -.14212 .66386 1.304 45 .199
FMCG
ICRA – CRISIL
1.0000 4.79583 2.14476 -4.95481 6.95481 .466 4 .665
Metals & Mining
ICRA – CRISIL .06667 2.76371 .71359 -1.46383 1.59716 .093 14 .927
Table 7: Industry wise test scores and significance values for statistical tests
22
Oil, Gas & Power
ICRA – CRISIL
-.71429 2.05866 .77810 -2.61823 1.18966 -.918 6 .394
Technology, Media & Telecom
ICRA - CRISIL -.81818 1.60114 -.48276 -1.89384 .25748 -1.695 10 .121
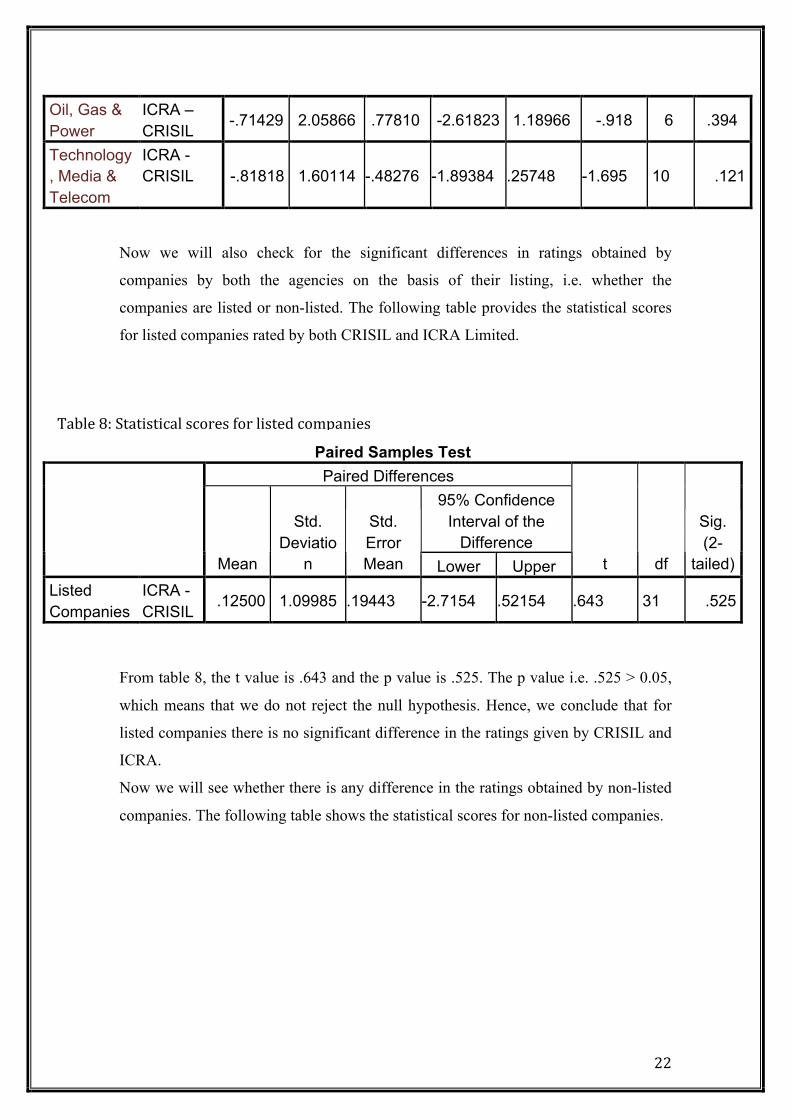
Now we will also check for the significant differences in ratings obtained by
companies by both the agencies on the basis of their listing, i.e. whether the
companies are listed or non-listed. The following table provides the statistical scores
for listed companies rated by both CRISIL and ICRA Limited.
Paired Samples Test Paired Differences
95% Confidence Interval of the
Difference Mean
Std. Deviatio
n
Std. Error Mean Lower Upper t df
Sig. (2-
tailed) Listed Companies
ICRA - CRISIL
.12500 1.09985 .19443 -2.7154 .52154 .643 31 .525
From table 8, the t value is .643 and the p value is .525. The p value i.e. .525 > 0.05,
which means that we do not reject the null hypothesis. Hence, we conclude that for
listed companies there is no significant difference in the ratings given by CRISIL and
ICRA.
Now we will see whether there is any difference in the ratings obtained by non-listed
companies. The following table shows the statistical scores for non-listed companies.
Table 8: Statistical scores for listed companies
23
Paired Samples Test Paired Differences
95% Confidence Interval of the
Difference Mean
Std. Deviatio
n
Std. Error Mean Lower Upper t df
Sig. (2-
tailed)
Non-Listed Companies
ICRA - CRISIL
-.43145 2.27363 .14438 -.71582 -.14709 -2.988 247 .003
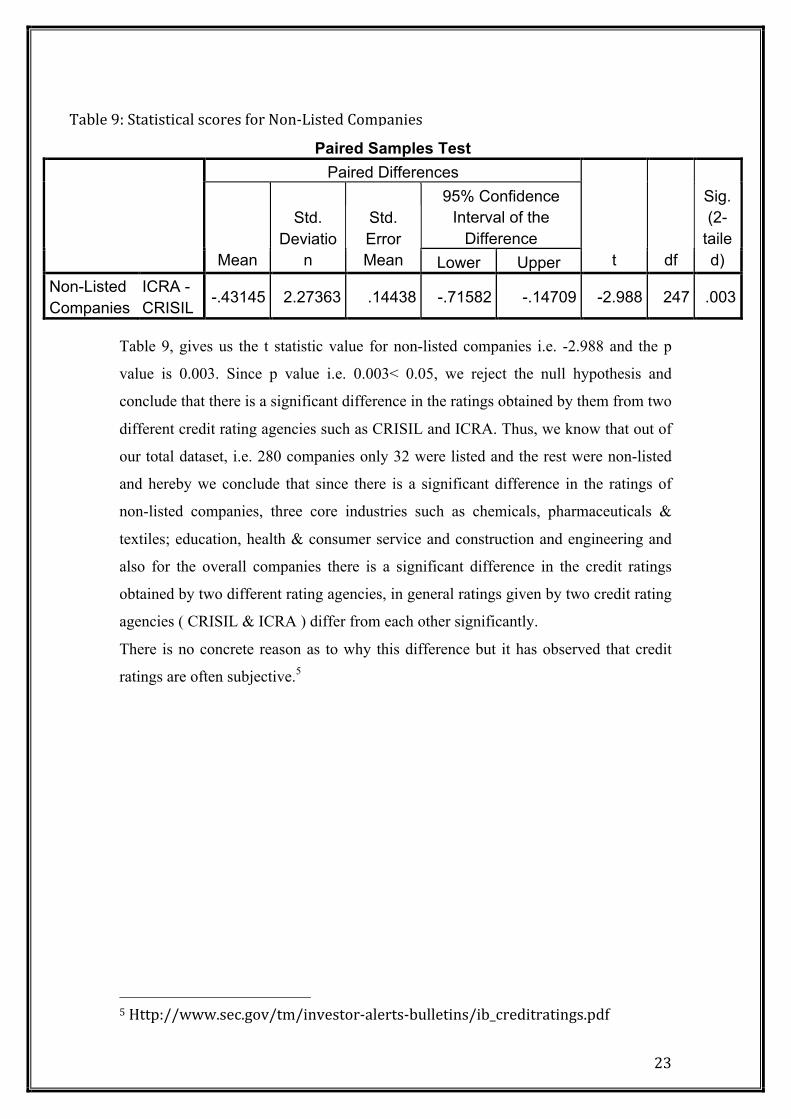
Table 9, gives us the t statistic value for non-listed companies i.e. -2.988 and the p
value is 0.003. Since p value i.e. 0.003< 0.05, we reject the null hypothesis and
conclude that there is a significant difference in the ratings obtained by them from two
different credit rating agencies such as CRISIL and ICRA. Thus, we know that out of
our total dataset, i.e. 280 companies only 32 were listed and the rest were non-listed
and hereby we conclude that since there is a significant difference in the ratings of
non-listed companies, three core industries such as chemicals, pharmaceuticals &
textiles; education, health & consumer service and construction and engineering and
also for the overall companies there is a significant difference in the credit ratings
obtained by two different rating agencies, in general ratings given by two credit rating
agencies ( CRISIL & ICRA ) differ from each other significantly.
There is no concrete reason as to why this difference but it has observed that credit
ratings are often subjective.5
5 Http://www.sec.gov/tm/investor-‐alerts-‐bulletins/ib_creditratings.pdf
Table 9: Statistical scores for Non-‐Listed Companies
24
Chapter 4 Conclusion This paper analyzed the ratings from CRISIL and ICRA Limited to study the biases
and trends between the two rating agencies. The results were both encouraging and
surprising at the same time. The most important result was that ICRA’s ratings have
been consistently lower than the ratings given by CRISIL to the same set of
companies in most of the cases. The difference was statistically significant. As
suspected, there are biases and differences in the ratings for different industry sectors,
which are apparent in the difference in average ratings.
Again factors like one agency being overall more lenient or conservative or having
different rating policies for different industries maybe one of the reasons for this but
usually it has been observed that credit ratings are subjective. There are no standard or
agreed upon methods to measure the accuracy of credit ratings and this is partly
because of the subjective nature of credit ratings. Also the performance of credit
ratings may not be comparable across different industry standards, i.e. defaults and
rating changes may not be consistent for each rating category across sectors. Credit
rating agencies also use different analytical approaches and levels of subjectivity
when determining credit ratings. They may differ in the time horizon that their ratings
address. For example, some credit rating agencies aim for stability in ratings so they
assume a longer term horizon in their analysis whereas other credit rating agency
might prefer to address short term risks and events, that can lead to more variability in
their ratings. Additionally, some credit rating agencies’ ratings only reflect the
likelihood that an obligator will default, while others’ ratings also consider the
expected loss that may result from a default. Similar is the case with CRISIL and
ICRA, hence, the significant differences in their ratings for the same set of companies.
CRISIL’s ratings reflect the probability of default whereas ICRA considers loss given
default while determining credit ratings. Usually big rating agencies have almost a
similar rating rationale, so is the case with CRISIL and ICRA, they follow and
consider the same parameters while determining a credit rating for a company i.e.
Business Risk and Financial Risk yet sometimes within those parameters there might
be some differences and as we said that it is totally of a subjective nature, therefore
even when analyzing according to the same rationale, the analysis might be
25
subjective. One more reason could be that for CRISIL while doing bank ratings, it
does not follow notching while rating upper tier II and upper tier I capital and
assumes it to be the same whereas ICRA follows a notching policy which might add
to the reasons behind the differences in ratings by these two agencies.
Overall it appears that ICRA has a bias towards lower rating as compared to CRISIL.
It is imperative for investors, regulators and analysts to note that the two ratings are
not equivalent and should not be treated as the same as it provides valuable insights to
investors in taking financial investment decisions as these credit ratings help them to
compare risks associated with it and offers diverse views on the creditworthiness of
an investment.
26
Bibliography (n.d.). Retrieved from www.smallb.in: http://smallb.in/%20/fund-‐your-‐business%20/credit-‐rating%20/msme-‐rating%20/rating-‐agencies-‐india Adelson, M. H. (2012, May 17). S&P The Role of Credit Ratings in Financial System. Retrieved from www.standardandpoors.com: http://www.standardandpoors.com/ratings/articles/en/us/?articleType=HTML&assetID=1245333790527#ContactInfo Cantor, R., & Packer, F. (1997, May 30). Differences of opinion and selection bias in the credit rating industry. Journal of Banking & Finance . Cantor, R., & Packer, F. (1995, December). Multiple Ratings and Credit Standards: Differences of opinion in the credit rating industry. 32. 32. Federal Reserve Bank of New york. Elkhoury, M. (2008). Credit Rating Agencies and Their Potential Impact on developing Countries. United Nations Conference on Trade and Development. Ghosh, s. (March4, 2013). A study of Differences in Standarad & Poor's and Moody's Corporate Credit Ratings. The Leonard N. Stern School of Business. Glucksman Institute for Research in Securities Markets . Kaur, K., & Kaur, D. R. (2011). Credit Rating in India: A Study of Rating Methodology of Rating agencies. Global Journal of Management and Business Research , 11 (12). Krishnan, D. K., Nair, S. C., Tiwari, S. P., Nagpal, S. P., Sahajwala, M. R., & Jayasmhan, S. S. (December 2009). Report of the Committee on comprehensive regulation for credit rating agencies. Ministry of Finance, Capital Markets Division. Kumar, K. V., & Rao, S. H. (2012). Credit Rating: Role in Modern Financial System. IRJC of Marketing, Financial Services & Managament Research , 1 (8), 13. laere, E. V., Vantieghem, J., & Baesens, B. (2012). The difference between Moody's and S&P bank ratings: is discretion in the rating process causing a split? National University of Singapore, RMI. Pride, M. D. (2012). Swimming with The Curent: The role od Credit Rating Agencies in Contemporary Global Governance. Thesis, University of Sydney Business School, School of Political Economy. Raghunathan, V., & R. Varma, J. When AAA means B: The state of Credit Rating in India. Indian Institute of Management, Ahmedabad, India. Ryan, J. (2012). The Negative Impact of Credit Rating Agencies and Proposals for better regulation. German institute for International and Security Affairs, Research Division. SWP Research Division.

27
Utzig, S. (2010, January 26). The Financial Crisis and the Regulation of Credit Rating Agencies: A European Banking Perspective. ADBI Working Paper Series.
28
Annexure:
Company Overview
Description ICRA Limited (formerly Investment Information and Credit Rating Agency of India
Limited) was set up in 1991 by leading financial/investment institutions, commercial
banks and financial services companies as an independent and professional
Investment Information and Credit Rating Agency. Today, ICRA and its subsidiaries
together form the ICRA Group of Companies (Group ICRA). ICRA is a Public
Limited Company, with its shares listed on the Bombay Stock Exchange and the
National Stock Exchange. ICRA Limited is an independent and professional
investment information and credit rating agency. The Company operates in
Outsourced and Information Services, Consulting Services, Rating Services and
Professional and information technology (IT) Services. ICRA rates rupee
denominated debt instruments issued by manufacturing companies, commercial
banks, non-banking finance companies, financial institutions, public sector
undertakings and municipalities, among others. The Grading Services offered by
ICRA include Grading of: initial public offers (IPOs); microfinance institutions
(MFIs); construction entities; real estate developers and projects; healthcare entities,
and maritime training institutes. ICRA Management Consulting Services Limited
(IMaCS), a wholly owned subsidiary of ICRA Limited, is a multi-line management
consulting firm. The international Credit Rating Agency Moody’s Investors Service is
ICRA’s largest shareholder.
Key Offerings Rating Services
As an early entrant in the Credit Rating business, ICRA Limited (ICRA) is one of the
most experienced Credit Rating Agencies in the country today. ICRA rates rupee
denominated debt instruments issued by manufacturing companies, commercial
banks, non-banking finance companies, financial institutions, public sector
29
undertakings and municipalities, among others. ICRA also rates structured obligations
and sector-specific debt obligations such as instruments issued by Power, Telecom
and Infrastructure companies. The other services offered include Corporate
Governance Rating, Stakeholder Value and Governance Rating, Credit Risk Rating of
Debt Mutual Funds, Rating of Claims Paying Ability of Insurance Companies, Project
Finance Rating, and Line of Credit Rating. ICRA, along with National Small
Industries Corporation Limited (NSIC), offers a Performance and Credit Rating
Scheme for Small-Scale Enterprises in India. The service is aimed at enabling Small
and Medium Enterprises (SMEs) improve their access to institutional credit, increase
their competitiveness, and raise their market standing.
Grading Services
The Grading Services offered by ICRA employ pioneering concepts and
methodologies, and include Grading of: Initial Public Offers (IPOs); Microfinance
Institutions (MFIs); Construction Entities; Real Estate Developers and Projects;
Healthcare Entities; and Maritime Training Institutes. In IPO Grading, an ICRA-
assigned IPO Grade represents a relative assessment of the “fundamentals” of the
issue graded in relation to the universe of other listed equity securities in India. In
MFI Grading, the focus of ICRA’s grading exercise is on evaluating the candidate
institution’s business and financial risks. The Grading of Construction Entities seeks
to provide an independent opinion on the quality of performance of the entities
graded. Similarly, the Grading of Real Estate Developers and Projects seeks to make
property buyers aware of the risks associated with real estate projects, and with the
developers’ ability to deliver in accordance with the terms agreed. ICRA’s Healthcare
Gradings present an independent opinion on the quality of care provided by healthcare
entities. In the education sector, ICRA offers the innovative service of Grading of
Maritime Training Institutes in India.
Consulting Services
ICRA Management Consulting Services Limited (IMaCS), a wholly owned subsidiary
of ICRA Limited, is a multi-line management and development consulting firm with a
global operating footprint. IMaCS offers Consulting Services in Strategy, Risk
Management, Regulation & Reform, Transaction Advisory, Development Consulting
30
and Process Re-engineering. IMaCS’ clientele includes Banks and Financial Service
Companies, Corporate Entities, Institutional Investors, Governments, Regulators, and
Multilateral Agencies. Besides India, IMaCS has consulting experience across 35
countries in South East Asia, Northern Asia, West Asia, Africa, Western Europe, and
North America.
Software Development, Business Intelligence and Analytics and Engineering
Services
ICRA Techno Analytics Limited (ICTEAS), a wholly owned subsidiary of ICRA
Limited, offers a complete portfolio of Information Technology (IT) solutions to meet
the dynamic needs of present-day businesses. The services range from the traditional
development of client-server, web-centric and mobile applications to the generation of
cutting-edge Business Intelligence applications and analytics solutions. With years of
experience in data-mining and predictive data modeling, ICTEAS offers various
analytics solutions such as sales analytics and spend analytics. An in-depth knowledge
of various technology areas, coupled with its strengths in various verticals, enables
ICTEAS provide end-to-end services of excellent quality. It uses a mix of
onsite/offshore strategies to optimize bottom-line benefits for its customers. ICTEAS
is a Microsoft Gold Partner and is ISO 27001 certified. The Engineering Division of
ICTEAS offers multidisciplinary computer aided engineering design services. The
activities cover design and drawing in the mechanical, civil/structural, electrical and
instrumentation space. ICTEAS engineers and designers are well versed in AutoCAD,
MicroStation, PDS and Staad pro with experience in the Oil & Gas, Petrochemical
and Power Sectors. The services range from providing Engineering Design Services
to CAD Vectorisation and Conversion Services. Over the years, ICTEAS has
successfully deployed skilled resources to work for large engineering consulting
companies both in the domestic and international market.ICTEAS has two
subsidiaries, ICRA Sapphire Inc. (ICSAP) and Axiom Technologies Limited
(AXIOM). ICSAP is based in Connecticut, USA, while AXIOM operates out of
Kolkata, India.
31
Financials
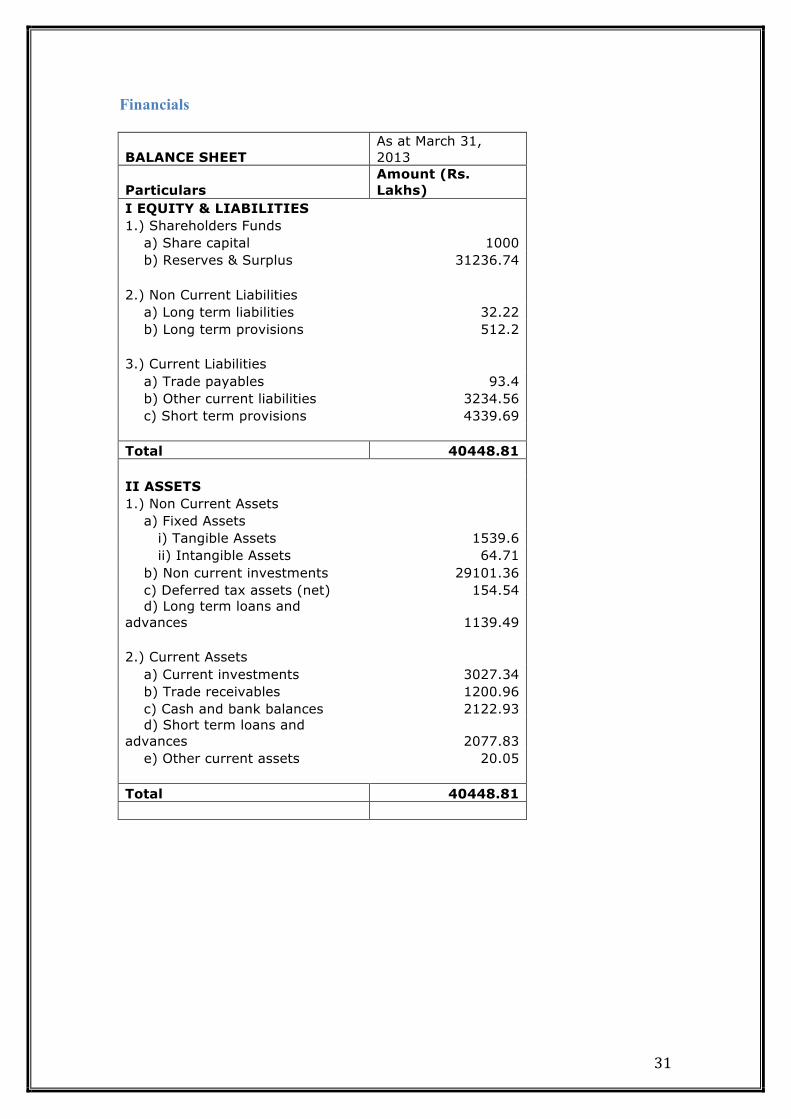
BALANCE SHEET As at March 31, 2013
Particulars Amount (Rs. Lakhs)
I EQUITY & LIABILITIES 1.) Shareholders Funds a) Share capital 1000 b) Reserves & Surplus 31236.74 2.) Non Current Liabilities a) Long term liabilities 32.22 b) Long term provisions 512.2 3.) Current Liabilities a) Trade payables 93.4 b) Other current liabilities 3234.56 c) Short term provisions 4339.69 Total 40448.81 II ASSETS 1.) Non Current Assets a) Fixed Assets i) Tangible Assets 1539.6 ii) Intangible Assets 64.71 b) Non current investments 29101.36 c) Deferred tax assets (net) 154.54 d) Long term loans and advances 1139.49 2.) Current Assets a) Current investments 3027.34 b) Trade receivables 1200.96 c) Cash and bank balances 2122.93 d) Short term loans and advances 2077.83 e) Other current assets 20.05 Total 40448.81
32
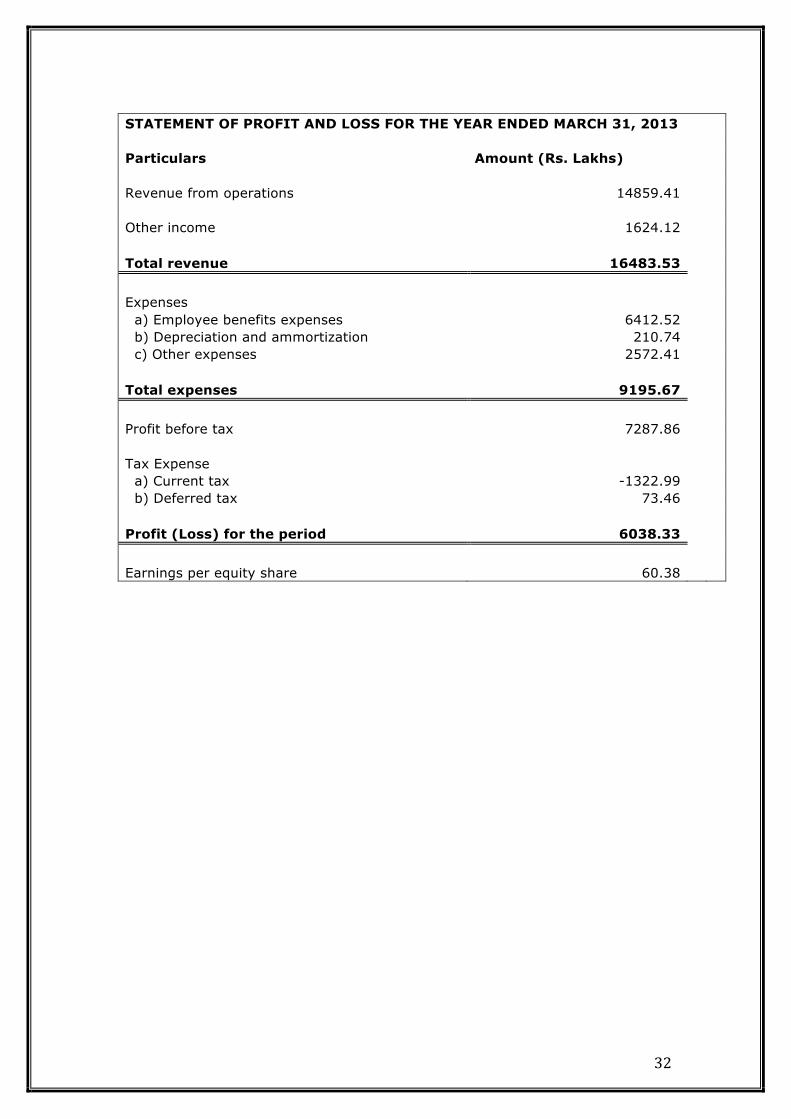
STATEMENT OF PROFIT AND LOSS FOR THE YEAR ENDED MARCH 31, 2013 Particulars Amount (Rs. Lakhs) Revenue from operations 14859.41 Other income 1624.12 Total revenue 16483.53
Expenses a) Employee benefits expenses 6412.52 b) Depreciation and ammortization 210.74 c) Other expenses 2572.41 Total expenses 9195.67
Profit before tax 7287.86 Tax Expense a) Current tax -1322.99 b) Deferred tax 73.46 Profit (Loss) for the period 6038.33
Earnings per equity share 60.38

33
Organizational Structure
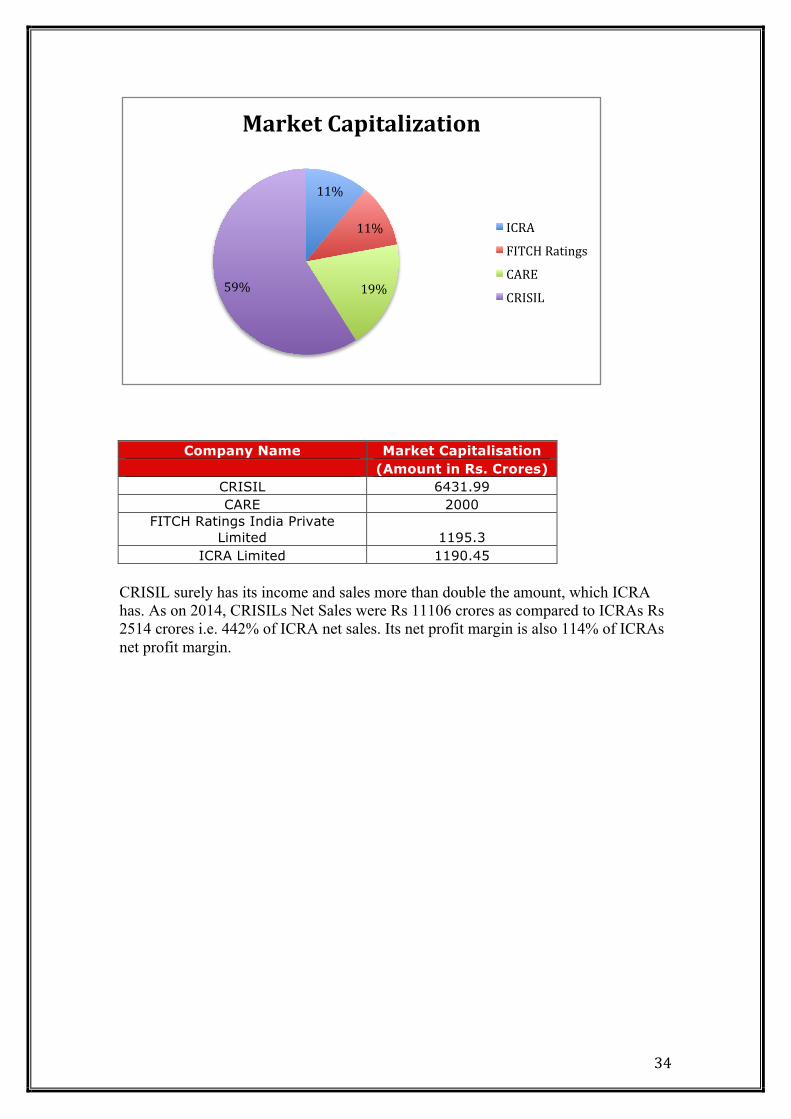
Competitors The competitors for ICRA Limited are CRISIL, CARE and FITCH Ratings India Private Limited. However CRISIL is a head on competitor for ICRA and has a larger number of clients than ICRA. Credit Rating and Information Services of India Ltd. (CRISIL) is a global analytical company providing ratings, research and risk and policy advisory services. Its major shareholder is Standard & Poor’s. It is the largest credit rating agency in India, which pioneered ratings in India more than 20 years ago and is today the undisputed business leader with the largest number of rated entities and rating products i.e. around 41738 entities including 20000 small and medium enterprises. The market capitalization of ICRA and its competitors are shown in the following pie chart and table.
34
Company Name Market Capitalisation (Amount in Rs. Crores)
CRISIL 6431.99 CARE 2000
FITCH Ratings India Private Limited 1195.3
ICRA Limited 1190.45 CRISIL surely has its income and sales more than double the amount, which ICRA has. As on 2014, CRISILs Net Sales were Rs 11106 crores as compared to ICRAs Rs 2514 crores i.e. 442% of ICRA net sales. Its net profit margin is also 114% of ICRAs net profit margin.
11%
11%
19% 59%
Market Capitalization
ICRA
FITCH Ratings
CARE
CRISIL

35
Key Deliverables
Summer Internship report submitted to ICRA Limited is as follows:
Title: Understanding Rating Methodology for Housing Finance Companies and
analysis of GRUH Finance Limited in the same framework

36
GRUH FINANCE LIMITED
Mentor: Ms Manushree Saggar (Assistant Vice President)
37
Table of Contents
COMPANY OVERVIEW......................................................................................................... PRODUCTS OFFERED BY GRUH ....................................................................................... SHAREHOLDING PATTERN......................................................................................................... COMPANY’S MANAGEMENT........................................................................................................ BUSINESS RISK PROFILE .............................................................................................................
COMPANY ANALYSIS AND CREDIT PERSPECTIVE..................................................... PORTFOLIO TREND....................................................................................................................... IMPROVEMENT IN ASSET QUALITY INDICATORS............................................................... CAPITAL ADEQUACY..................................................................................................................... LIQUIDITY FACTORS..................................................................................................................... BORROWING PROFILE ................................................................................................................. EARNINGS PROFILE.......................................................................................................................
REFERENCES.......................................................................................................................... ANNEXURE: ............................................................................................................................
38
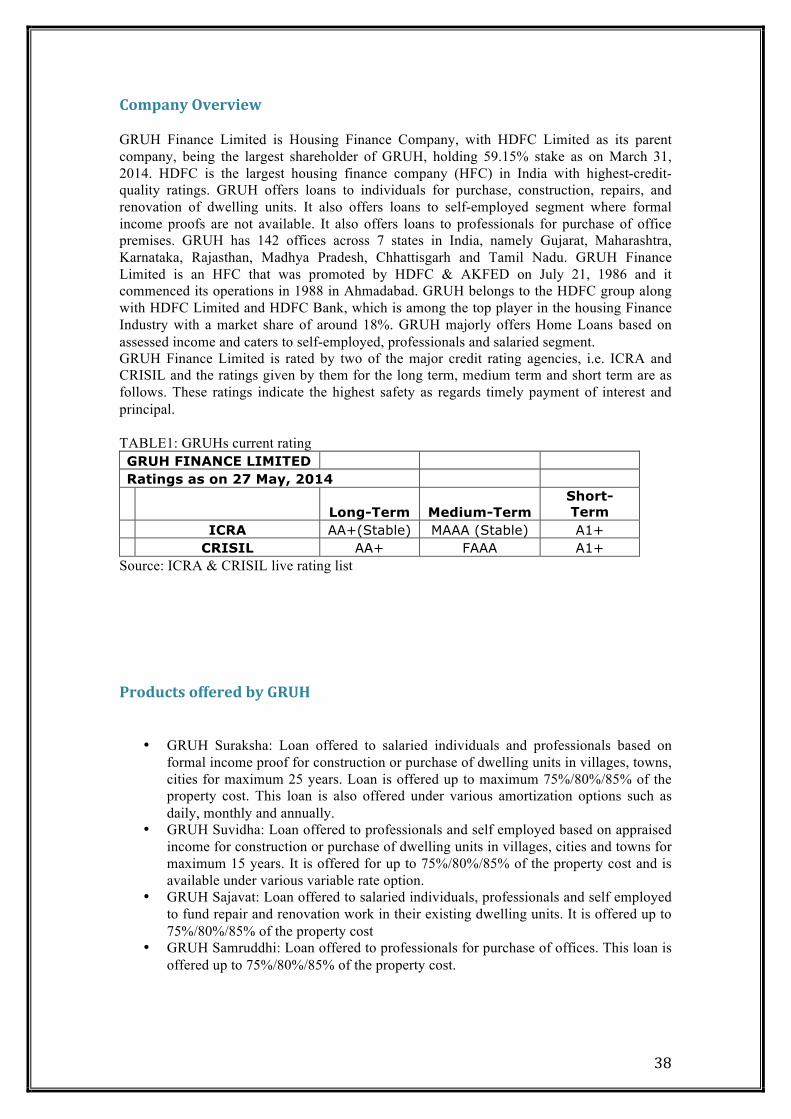
Company Overview GRUH Finance Limited is Housing Finance Company, with HDFC Limited as its parent company, being the largest shareholder of GRUH, holding 59.15% stake as on March 31, 2014. HDFC is the largest housing finance company (HFC) in India with highest-credit-quality ratings. GRUH offers loans to individuals for purchase, construction, repairs, and renovation of dwelling units. It also offers loans to self-employed segment where formal income proofs are not available. It also offers loans to professionals for purchase of office premises. GRUH has 142 offices across 7 states in India, namely Gujarat, Maharashtra, Karnataka, Rajasthan, Madhya Pradesh, Chhattisgarh and Tamil Nadu. GRUH Finance Limited is an HFC that was promoted by HDFC & AKFED on July 21, 1986 and it commenced its operations in 1988 in Ahmadabad. GRUH belongs to the HDFC group along with HDFC Limited and HDFC Bank, which is among the top player in the housing Finance Industry with a market share of around 18%. GRUH majorly offers Home Loans based on assessed income and caters to self-employed, professionals and salaried segment. GRUH Finance Limited is rated by two of the major credit rating agencies, i.e. ICRA and CRISIL and the ratings given by them for the long term, medium term and short term are as follows. These ratings indicate the highest safety as regards timely payment of interest and principal. TABLE1: GRUHs current rating GRUH FINANCE LIMITED Ratings as on 27 May, 2014
Long-Term Medium-Term Short-Term
ICRA AA+(Stable) MAAA (Stable) A1+ CRISIL AA+ FAAA A1+
Source: ICRA & CRISIL live rating list
Products offered by GRUH
• GRUH Suraksha: Loan offered to salaried individuals and professionals based on formal income proof for construction or purchase of dwelling units in villages, towns, cities for maximum 25 years. Loan is offered up to maximum 75%/80%/85% of the property cost. This loan is also offered under various amortization options such as daily, monthly and annually.
• GRUH Suvidha: Loan offered to professionals and self employed based on appraised income for construction or purchase of dwelling units in villages, cities and towns for maximum 15 years. It is offered for up to 75%/80%/85% of the property cost and is available under various variable rate option.
• GRUH Sajavat: Loan offered to salaried individuals, professionals and self employed to fund repair and renovation work in their existing dwelling units. It is offered up to 75%/80%/85% of the property cost
• GRUH Samruddhi: Loan offered to professionals for purchase of offices. This loan is offered up to 75%/80%/85% of the property cost.
39
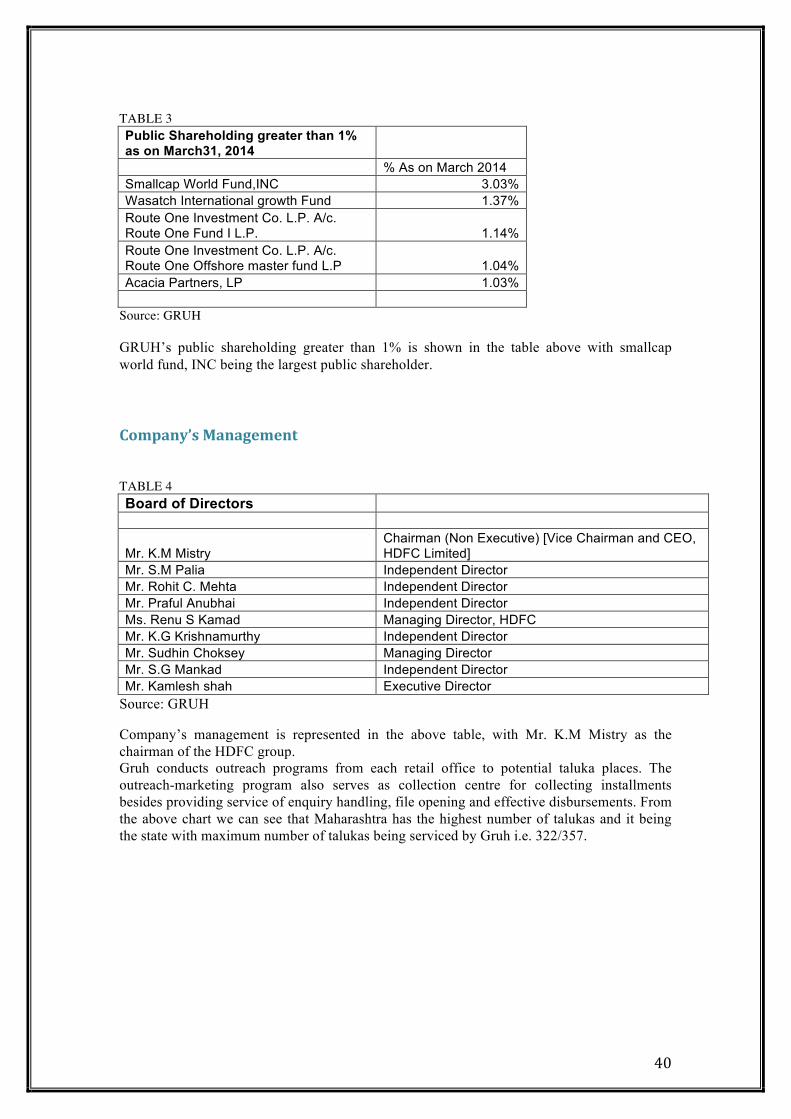
Shareholding Pattern TABLE 2: SHAREHOLDING PATTERN Shareholding Pattern as at March 31, 2014 % As on March 2014 Promoter HDFC Ltd. 59.15 Public/ Resident Indians 17.65 FI, MF & Banks 0.67 Corporate Bodies 2.03 FII 17.46 NRI/OCBs 3.03 Total 100
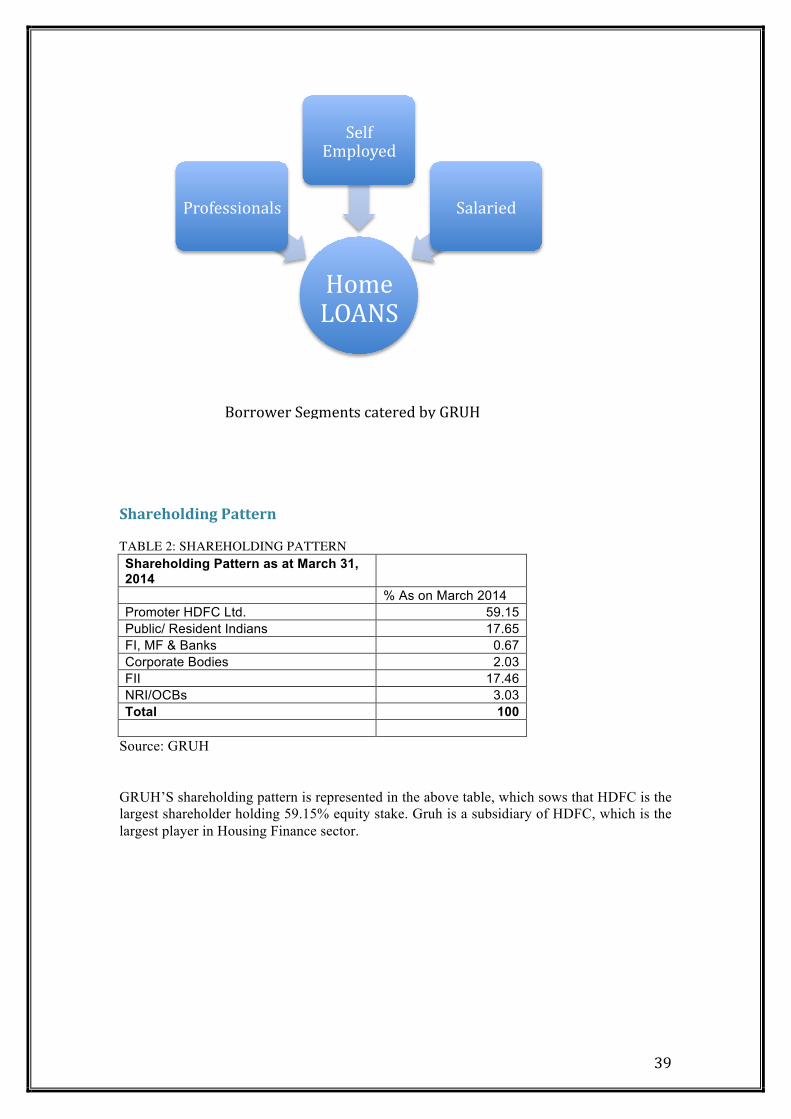
Source: GRUH GRUH’S shareholding pattern is represented in the above table, which sows that HDFC is the largest shareholder holding 59.15% equity stake. Gruh is a subsidiary of HDFC, which is the largest player in Housing Finance sector.
Home LOANS
Professionals
Self Employed
Salaried
Borrower Segments catered by GRUH
40
TABLE 3 Public Shareholding greater than 1% as on March31, 2014 % As on March 2014 Smallcap World Fund,INC 3.03% Wasatch International growth Fund 1.37% Route One Investment Co. L.P. A/c. Route One Fund I L.P. 1.14% Route One Investment Co. L.P. A/c. Route One Offshore master fund L.P 1.04% Acacia Partners, LP 1.03%
Source: GRUH GRUH’s public shareholding greater than 1% is shown in the table above with smallcap world fund, INC being the largest public shareholder. Company’s Management TABLE 4 Board of Directors
Mr. K.M Mistry Chairman (Non Executive) [Vice Chairman and CEO, HDFC Limited]
Mr. S.M Palia Independent Director Mr. Rohit C. Mehta Independent Director Mr. Praful Anubhai Independent Director Ms. Renu S Kamad Managing Director, HDFC Mr. K.G Krishnamurthy Independent Director Mr. Sudhin Choksey Managing Director Mr. S.G Mankad Independent Director Mr. Kamlesh shah Executive Director
Source: GRUH Company’s management is represented in the above table, with Mr. K.M Mistry as the chairman of the HDFC group. Gruh conducts outreach programs from each retail office to potential taluka places. The outreach-marketing program also serves as collection centre for collecting installments besides providing service of enquiry handling, file opening and effective disbursements. From the above chart we can see that Maharashtra has the highest number of talukas and it being the state with maximum number of talukas being serviced by Gruh i.e. 322/357.
41
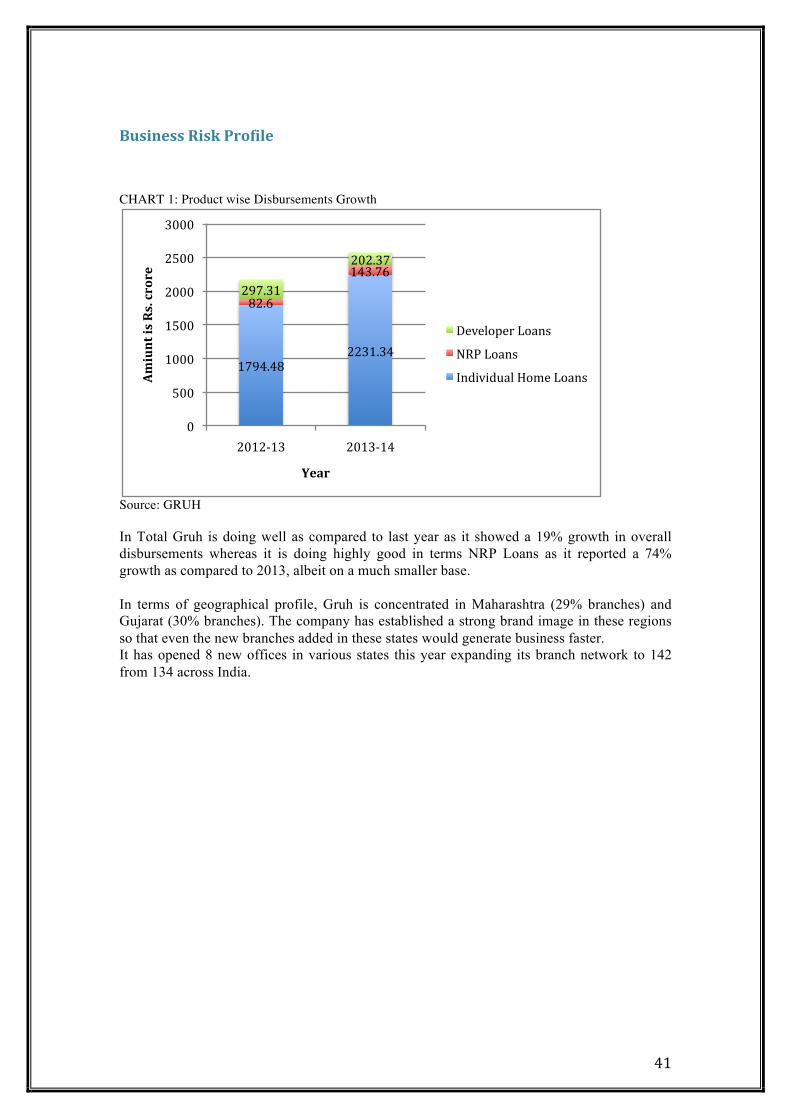
Business Risk Profile CHART 1: Product wise Disbursements Growth
Source: GRUH In Total Gruh is doing well as compared to last year as it showed a 19% growth in overall disbursements whereas it is doing highly good in terms NRP Loans as it reported a 74% growth as compared to 2013, albeit on a much smaller base. In terms of geographical profile, Gruh is concentrated in Maharashtra (29% branches) and Gujarat (30% branches). The company has established a strong brand image in these regions so that even the new branches added in these states would generate business faster. It has opened 8 new offices in various states this year expanding its branch network to 142 from 134 across India.
1794.48 2231.34
82.6
143.76 297.31
202.37
0
500
1000
1500
2000
2500
3000
2012-‐13 2013-‐14
Amiunt is Rs. crore
Year
Developer Loans
NRP Loans
Individual Home Loans
42
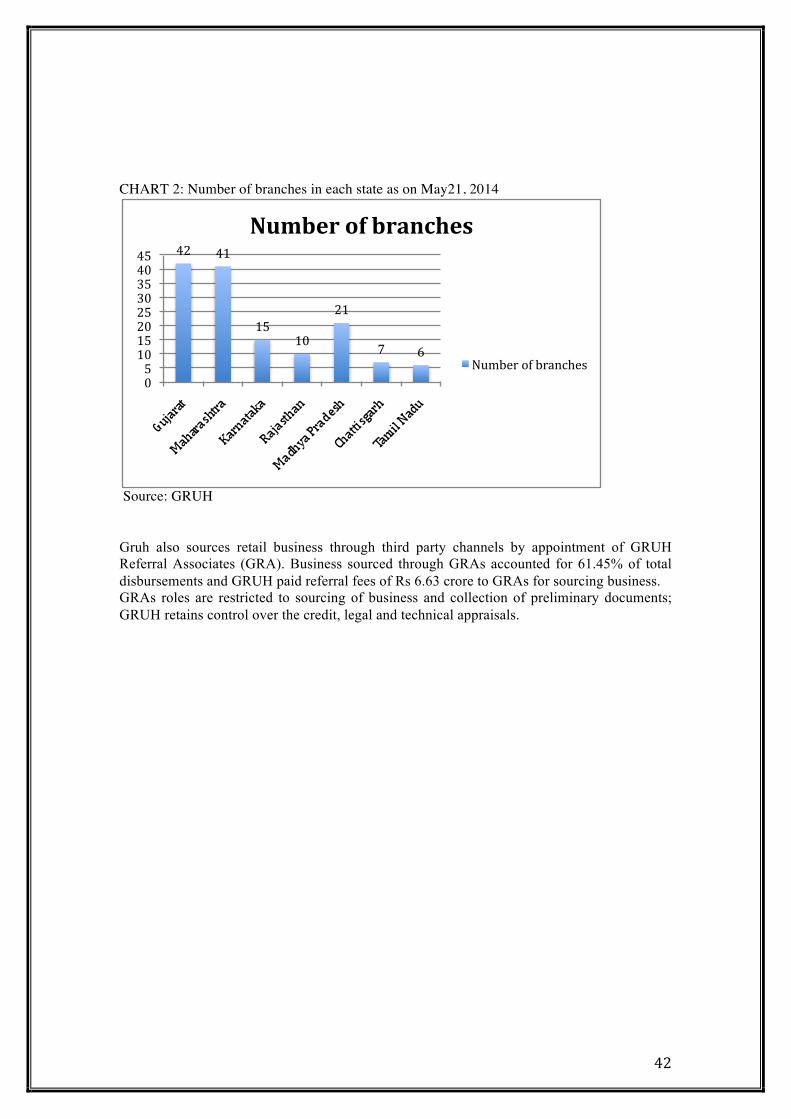
CHART 2: Number of branches in each state as on May21, 2014
Source: GRUH Gruh also sources retail business through third party channels by appointment of GRUH Referral Associates (GRA). Business sourced through GRAs accounted for 61.45% of total disbursements and GRUH paid referral fees of Rs 6.63 crore to GRAs for sourcing business. GRAs roles are restricted to sourcing of business and collection of preliminary documents; GRUH retains control over the credit, legal and technical appraisals.
42 41
15 10
21
7 6
0 5 10 15 20 25 30 35 40 45
Number of branches
Number of branches
43
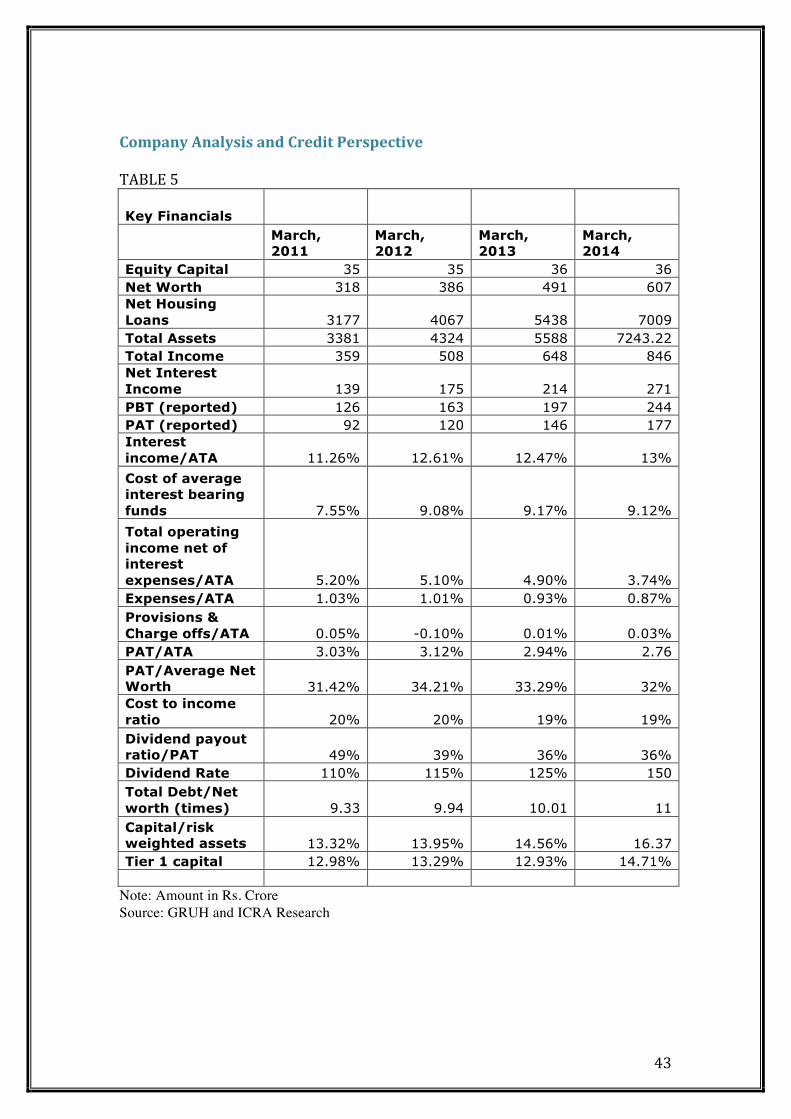
Company Analysis and Credit Perspective TABLE 5
Key Financials
March, 2011
March, 2012
March, 2013
March, 2014
Equity Capital 35 35 36 36 Net Worth 318 386 491 607 Net Housing Loans 3177 4067 5438 7009 Total Assets 3381 4324 5588 7243.22 Total Income 359 508 648 846 Net Interest Income 139 175 214 271 PBT (reported) 126 163 197 244 PAT (reported) 92 120 146 177 Interest income/ATA 11.26% 12.61% 12.47% 13% Cost of average interest bearing funds 7.55% 9.08% 9.17% 9.12% Total operating income net of interest expenses/ATA 5.20% 5.10% 4.90% 3.74% Expenses/ATA 1.03% 1.01% 0.93% 0.87% Provisions & Charge offs/ATA 0.05% -0.10% 0.01% 0.03% PAT/ATA 3.03% 3.12% 2.94% 2.76 PAT/Average Net Worth 31.42% 34.21% 33.29% 32% Cost to income ratio 20% 20% 19% 19% Dividend payout ratio/PAT 49% 39% 36% 36% Dividend Rate 110% 115% 125% 150 Total Debt/Net worth (times) 9.33 9.94 10.01 11 Capital/risk weighted assets 13.32% 13.95% 14.56% 16.37 Tier 1 capital 12.98% 13.29% 12.93% 14.71%
Note: Amount in Rs. Crore Source: GRUH and ICRA Research

44
Portfolio Trend GRUH reported a loan book of Rs. 7009.04 crore as on March 31, 2014 as compared to Rs. 5437 crore last year, registering a year-on-year growth of 29%. As in the following chart we can see that the loan book is increasing every year at a stable rate but the growth percentage actually declined as compared to last year which 33% and as on March 31, 2014 it is 29%. CHART 3
Source: GRUH
Improvement in Asset quality Indicators TABLE 6: Asset quality of GRUH
March, 2011
March, 2012
March, 2013
March, 2014
Gross NPA 25.9 21.1 17.6 18.87 Provisions required as per NHB norms 6.4 25.5 31.1 30.82 Excess Provisions 21.5 13.9 8.4 12.04 Total NPA Provisions 27.9 39.5 39.5 42.86 Net NPA 0 0 2.7 0 Gross NPA % 0.81% 0.52% 0.32% 0.27% Net NPA % 0 0 0.05% 0 Net NPA/Net Worth 0 0 0.55% 0
Source: GRUH and ICRA Research Note: Amount in Rs Crore
3177 4077
5437.8
7009.04
29% 28%
33%
29%
25% 26% 27% 28% 29% 30% 31% 32% 33% 34%
0 1000 2000 3000 4000 5000 6000 7000 8000
March 31, 2011
March 31, 2012
March 31, 2013
March 31, 2014
Amiunt is Rs. crore
Date
Portfolio trend and growth
Loan outstanding
Growth %

45
Despite the difficult operating environment, GRUH has managed to maintain low levels of Gross NPA. The gross NPAs however increased a little as compared to 2013 from Rs. 17.6 crore to Rs. 18.87 crore but the Gross NPA% declined from 0.32% in 2013 to 0.27% in 2014 owing to increase in the advance base The net NPAs of the company stood at NIL as on March 31, 2014 (0.05% as on March 31, 2013). Nevertheless, GRUH has operated in this segment for over a decade, enjoys a good understanding of it and has an established in-house appraisal and recovery system, which has enabled it to manage risks so far Capital Adequacy TABLE 7: Capital Adequacy of GRUH
March, 2011
March, 2012
March, 2013
March, 2014
Loans and advances 3177 4067 5438 7009 % Growth 29% 28% 33.71% 28.89% CRAR 13.32% 13.95% 14.56% 16.37% Net Worth as a % of Total Assets 9.40% 8.92% 8.79% 8.38%
Note: Amount in Rs Crore Source: GRUH and ICRA research With a 29% growth in loan book in 2014, GRUH’s economic capital (net worth in relation to total assets) declined from 8.79% as on March 31, 2013 to 8.38% as on March 31, 2014. The loan book although grew from Rs. 5438 crore as on March 2013 to Rs. 7009 crore as on March 2014 yet the capital adequacy ratio increased from 14.56% in 2013 to 16.37% in 2014. This happened due to the change in risk weights. Also the gearing of the company is at 10.6 times as on March 31, 2014 which is moderate. One of the reasons for an increase in CRAR can be the regulatory change by National Housing Bank, because of which GRUH reported an increase in regulatory CRAR. The reduction in Risk weights for large ticket home loans (>Rs. 7.5 million) was from 125% to 75% and small ticket home loans (< Rs. 7.5 million) from 50-100% to 50%. CHART 4
Source: GRUH and Research
9.40%
8.92% 8.79%
8.38%
7.80% 8.00% 8.20% 8.40% 8.60% 8.80% 9.00% 9.20% 9.40% 9.60%
March, 2011
March, 2012
March, 2013
March, 2014
Percentage
Year
Net Worth as a % of Total Assets
Net Worth as a % of Total Assets
46
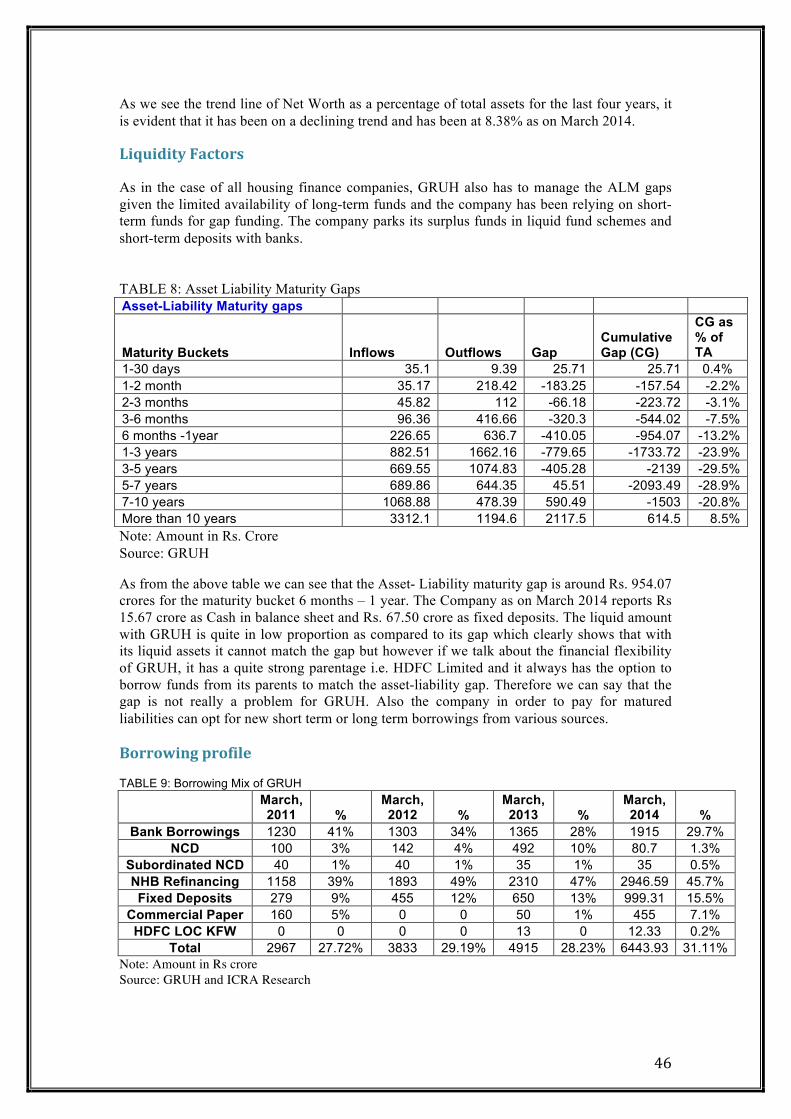
As we see the trend line of Net Worth as a percentage of total assets for the last four years, it is evident that it has been on a declining trend and has been at 8.38% as on March 2014. Liquidity Factors As in the case of all housing finance companies, GRUH also has to manage the ALM gaps given the limited availability of long-term funds and the company has been relying on short-term funds for gap funding. The company parks its surplus funds in liquid fund schemes and short-term deposits with banks. TABLE 8: Asset Liability Maturity Gaps Asset-Liability Maturity gaps
Maturity Buckets Inflows Outflows Gap Cumulative Gap (CG)
CG as % of TA
1-30 days 35.1 9.39 25.71 25.71 0.4% 1-2 month 35.17 218.42 -183.25 -157.54 -2.2% 2-3 months 45.82 112 -66.18 -223.72 -3.1% 3-6 months 96.36 416.66 -320.3 -544.02 -7.5% 6 months -1year 226.65 636.7 -410.05 -954.07 -13.2% 1-3 years 882.51 1662.16 -779.65 -1733.72 -23.9% 3-5 years 669.55 1074.83 -405.28 -2139 -29.5% 5-7 years 689.86 644.35 45.51 -2093.49 -28.9% 7-10 years 1068.88 478.39 590.49 -1503 -20.8% More than 10 years 3312.1 1194.6 2117.5 614.5 8.5% Note: Amount in Rs. Crore Source: GRUH As from the above table we can see that the Asset- Liability maturity gap is around Rs. 954.07 crores for the maturity bucket 6 months – 1 year. The Company as on March 2014 reports Rs 15.67 crore as Cash in balance sheet and Rs. 67.50 crore as fixed deposits. The liquid amount with GRUH is quite in low proportion as compared to its gap which clearly shows that with its liquid assets it cannot match the gap but however if we talk about the financial flexibility of GRUH, it has a quite strong parentage i.e. HDFC Limited and it always has the option to borrow funds from its parents to match the asset-liability gap. Therefore we can say that the gap is not really a problem for GRUH. Also the company in order to pay for matured liabilities can opt for new short term or long term borrowings from various sources. Borrowing profile TABLE 9: Borrowing Mix of GRUH
March, 2011 %
March, 2012 %
March, 2013 %
March, 2014 %
Bank Borrowings 1230 41% 1303 34% 1365 28% 1915 29.7% NCD 100 3% 142 4% 492 10% 80.7 1.3%
Subordinated NCD 40 1% 40 1% 35 1% 35 0.5% NHB Refinancing 1158 39% 1893 49% 2310 47% 2946.59 45.7% Fixed Deposits 279 9% 455 12% 650 13% 999.31 15.5%
Commercial Paper 160 5% 0 0 50 1% 455 7.1% HDFC LOC KFW 0 0 0 0 13 0 12.33 0.2%
Total 2967 27.72% 3833 29.19% 4915 28.23% 6443.93 31.11% Note: Amount in Rs crore Source: GRUH and ICRA Research
47
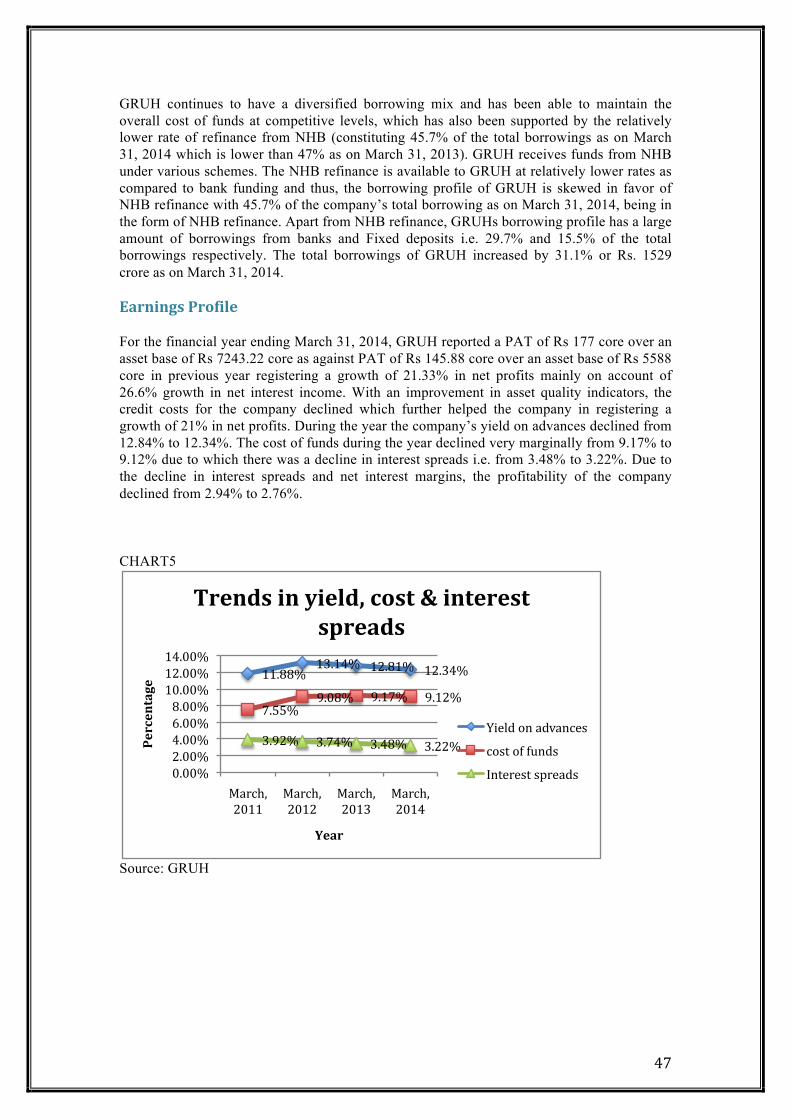
GRUH continues to have a diversified borrowing mix and has been able to maintain the overall cost of funds at competitive levels, which has also been supported by the relatively lower rate of refinance from NHB (constituting 45.7% of the total borrowings as on March 31, 2014 which is lower than 47% as on March 31, 2013). GRUH receives funds from NHB under various schemes. The NHB refinance is available to GRUH at relatively lower rates as compared to bank funding and thus, the borrowing profile of GRUH is skewed in favor of NHB refinance with 45.7% of the company’s total borrowing as on March 31, 2014, being in the form of NHB refinance. Apart from NHB refinance, GRUHs borrowing profile has a large amount of borrowings from banks and Fixed deposits i.e. 29.7% and 15.5% of the total borrowings respectively. The total borrowings of GRUH increased by 31.1% or Rs. 1529 crore as on March 31, 2014. Earnings Profile For the financial year ending March 31, 2014, GRUH reported a PAT of Rs 177 core over an asset base of Rs 7243.22 core as against PAT of Rs 145.88 core over an asset base of Rs 5588 core in previous year registering a growth of 21.33% in net profits mainly on account of 26.6% growth in net interest income. With an improvement in asset quality indicators, the credit costs for the company declined which further helped the company in registering a growth of 21% in net profits. During the year the company’s yield on advances declined from 12.84% to 12.34%. The cost of funds during the year declined very marginally from 9.17% to 9.12% due to which there was a decline in interest spreads i.e. from 3.48% to 3.22%. Due to the decline in interest spreads and net interest margins, the profitability of the company declined from 2.94% to 2.76%. CHART5
Source: GRUH
11.88% 13.14% 12.81% 12.34%
7.55% 9.08% 9.17% 9.12%
3.92% 3.74% 3.48% 3.22%
0.00% 2.00% 4.00% 6.00% 8.00% 10.00% 12.00% 14.00%
March, 2011
March, 2012
March, 2013
March, 2014
Percentage
Year
Trends in yield, cost & interest spreads
Yield on advances
cost of funds
Interest spreads
48
CHART 6
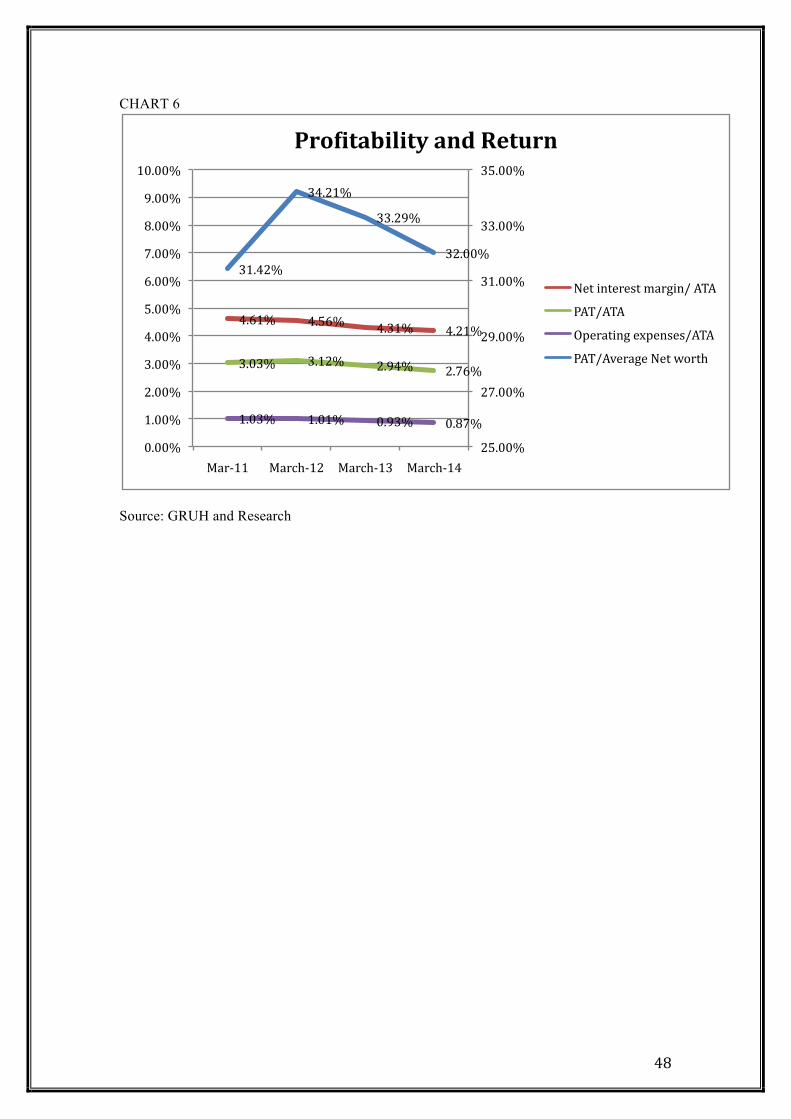
Source: GRUH and Research
4.61% 4.56% 4.31% 4.21%
3.03% 3.12% 2.94% 2.76%
1.03% 1.01% 0.93% 0.87%
31.42%
34.21%
33.29%
32.00%
25.00%
27.00%
29.00%
31.00%
33.00%
35.00%
0.00%
1.00%
2.00%
3.00%
4.00%
5.00%
6.00%
7.00%
8.00%
9.00%
10.00%
Mar-‐11 March-‐12 March-‐13 March-‐14
Proaitability and Return
Net interest margin/ ATA
PAT/ATA
Operating expenses/ATA
PAT/Average Net worth

49
References GRUH FINANCE LIMITED
• Gruh Finance Limited. (2011). 25th Annual Report 2010-11.
• Gruh Finance Limited. (2012). 26th Annual Report 2011-12.
• Gruh Finance Limited. (2013). 27th Annual Report 2012-13.
• Gruh Finance Limited. (2014). 28th Annual Report 2013-14.
The ICRA website provides many credit perspectives and the rating methodologies
for various Banks and HFCs and also contains reports on economic trends and
outlook, and research reports for various sectors (www.icra.in)
50
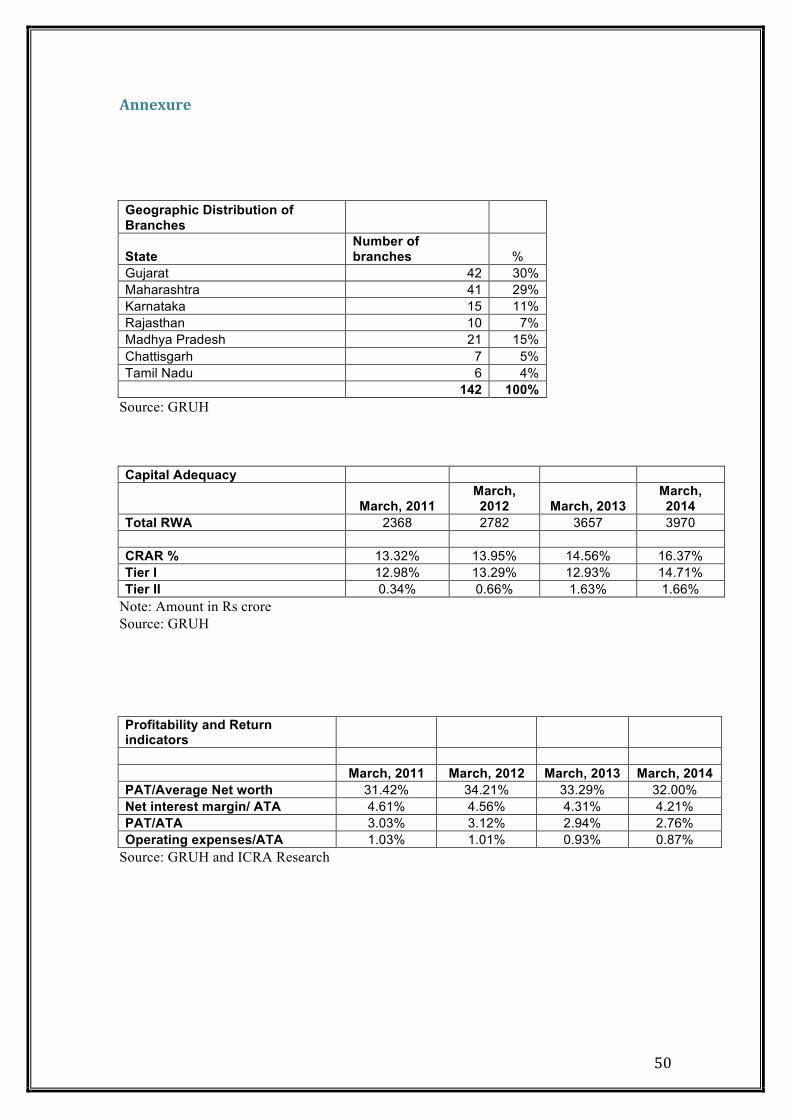
Annexure Geographic Distribution of Branches
State Number of branches %
Gujarat 42 30% Maharashtra 41 29% Karnataka 15 11% Rajasthan 10 7% Madhya Pradesh 21 15% Chattisgarh 7 5% Tamil Nadu 6 4% 142 100%
Source: GRUH Capital Adequacy
March, 2011 March, 2012 March, 2013
March, 2014
Total RWA 2368 2782 3657 3970 CRAR % 13.32% 13.95% 14.56% 16.37% Tier I 12.98% 13.29% 12.93% 14.71% Tier II 0.34% 0.66% 1.63% 1.66%
Note: Amount in Rs crore Source: GRUH Profitability and Return indicators March, 2011 March, 2012 March, 2013 March, 2014 PAT/Average Net worth 31.42% 34.21% 33.29% 32.00% Net interest margin/ ATA 4.61% 4.56% 4.31% 4.21% PAT/ATA 3.03% 3.12% 2.94% 2.76% Operating expenses/ATA 1.03% 1.01% 0.93% 0.87%
Source: GRUH and ICRA Research

51
Annexure 1: Past Financials
March, 2011 March, 2012 March, 2013 March, 2014 Interest Income 340 486 618 846 Interest Expenses 201 310 404 575 Net Interest Income 139 175 214 271 Fee Based Income 19 23 30 27 Total Net Income 158 198 244 298 Operating Expenses 31 39 46 56 Operating Profile 127 159 197 242 Provisions 1 -4 1 2 Operating Profit 126 163 197 242 Profit from Securitization transaction - - - - Subvention money - - - - PBT 126 163 197 244 Tax 34 41 51 67 PAT 92 120 146 177 Dividend 45 47 52 26.63 Liabilities Equity 35 35 36 36 Net Reserves 283 350 455 571 Net Worth 318 386 491 607 Borrowings 2987 3845 4976 6094.6 Other Liabilities 79 93 121 541.38 Total Liabilities 3393 4334 5600 7243 Assets Fixed Assets 12.2 11.64 11.78 11.03 Deferred Tax Asset 9.27 11.95 12.46 16.9 Other loans and advances 1.61 28.62 27.03 26.82 Total Loans 3177 4077 5438 7009.04 Investments 35 24 65 52.96 Current Assets 158.12 181.43 45.51 126.47 Total Assets 3393.2 4334 5600 7243
Source: GRUH Products wise disbursements growth
2012-13 2013-14 Growth% Individual Home Loans 1794.48 2231.34 24.34% NRP Loans 82.6 143.76 74.04% Developer Loans 297.31 202.37 -31.93% Total 2174.39 2577.47 18.54%
Source: GRUH
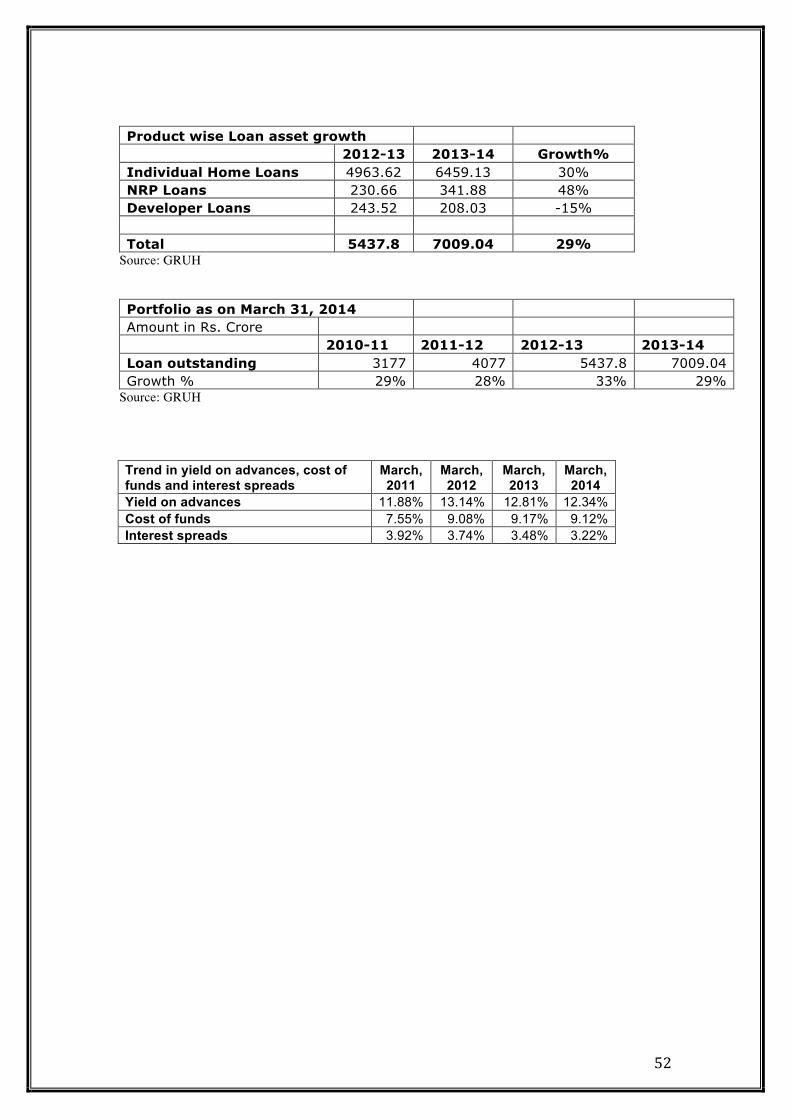
52
Product wise Loan asset growth 2012-13 2013-14 Growth% Individual Home Loans 4963.62 6459.13 30% NRP Loans 230.66 341.88 48% Developer Loans 243.52 208.03 -15% Total 5437.8 7009.04 29%
Source: GRUH Portfolio as on March 31, 2014 Amount in Rs. Crore 2010-11 2011-12 2012-13 2013-14 Loan outstanding 3177 4077 5437.8 7009.04 Growth % 29% 28% 33% 29%
Source: GRUH Trend in yield on advances, cost of funds and interest spreads
March, 2011
March, 2012
March, 2013
March, 2014
Yield on advances 11.88% 13.14% 12.81% 12.34% Cost of funds 7.55% 9.08% 9.17% 9.12% Interest spreads 3.92% 3.74% 3.48% 3.22%

53