project report on non destructive …web.iitd.ac.in/~sbhalla/thesispdf/arora.pdf · ced 310: mini...
TRANSCRIPT

CED 310: MINI PROJECT
PROJECT REPORT ONNON DESTRUCTIVE
EVALUATION OF DEFECTS INCONCRETE
By:RAJAN ARORA
2004CE10269
Supervisor: DR. SURESH BHALLACo-Supervisors: DR.SUNEET TULI DR. SUDHAKAR
Department of Civil Engineering
Indian Institute of Technology, New Delhi
1
Certificate by Student
“I do certify that this report explains the work carried out by me in
the Course CED 310: Mini Project under the overall supervision
of Dr. S.Bhalla, Dr.Suneet Tuli and Dr. Sudhakar. The contents of
the report including text, figures, tables, graphs, etc. have not
been reproduced from other sources such as books, journals,
reports, manuals, websites, etc. Wherever limited reproduction
from another source had been made the source had been duly
acknowledged at that point and also listed in the References.”
Rajan Arora2004CE10269

2
Certificate by Supervisor
“This is to certify that the report submitted by Rajan Arora
describes the work carried out by him in the course CED 310:
Mini Project under my overall supervision.”
Dr. Suresh Bhalla
3
Acknowledgement
I would like to express my gratitude to the Department of Civil
Engineering, IIT, Delhi for providing me with the opportunity to work on
this interesting project as my Mini Project. I would especially like to thank
my supervisor, Dr. S.Bhalla, Department of Civil Engineering, IIT, Delhi,
for guiding me through this project. His constant support and encouragement
and my frequent discussions with him have helped me to gain a lot of insight
and knowledge which has helped me greatly in my work for this project. I
would also like to thank my Co-Supervisors Dr.Suneet Tuli and Dr.
Sudhakar, Centre for Applied Research and Electronics (CARE), IIT Delhi
for showing faith in me to undertake this project. Working under them has
been a greatly rewarding experience and without their enthusiasm this
project would not have been possible.
I would also like to thank Mr. Sahu, Mr. Piyush Jain and Mr. Lal
Chand for their cooperation and assistance in the lab-work that was required
for this project. Lastly, I would like to thank Mr Ravi Babu Mulaveesala (a
PhD Scholar, CARE) for his constant help and great contribution and
dedication in completing this project.
Rajan Arora2004CE10269

4
ABSTRACTIn the recent past, Non Destructive Techniques to evaluate defects and strength of concrete have
developed great importance. These techniques have their own advantages as well as limitations,
when compared to conventional strength estimation and damage detection tests.
In this project various concrete specimens (Beams and Square Slab) were cast and
discontinuities were created in these using thick paper sheet and wooden pieces at varying
depths and position within the specimens.
The objective of this project was to detect these defects by using three techniques:
(1) Rebound Hammer Test
(2) Ultra Sonic Pulse Velocity Test
(3) Thermal Imaging Technique
And finding the most suitable and economical technique to serve the purpose.
Use of Thermal Imaging Technique in this area is a very new concept and its relevance in this
area has been explored in this project and it has been found that this technique is of great use in
detecting defects in concrete.
Please note that this project does not deal with determining the strength of specimens.
1

5
TABLE OF CONTENTS
PAGE
CERTIFICATES………………………………………………………….1
ACKNOWLEDGMENT…………………………………………………...3
ABSTRACT……………………………………………………….…...4
TABLE OF CONTENTS………………………………………………5
LIST OF FIGURES…………………………………………………….7
LIST OF TABLES……………………………………………………..8
CHAPTER 1: INTRODUCTION………………………………………………….9
1.1Non Destructive Techniques……………………………………9
1.2 Evaluation of Defects in Concrete………………………………91.2.1 Methodology and Technique Employed……………………91.2.2 Analysis and Results……………………………………..9
1.3 Project Objective……………………………………………...9
1.4 Report Organisation…………………………………………..10
CHAPTER 2: THEORETICAL BACKGROUND………………………………...11
2.1 Concrete Mix Design………………………………………...112.1.1 Factors governing Concrete-Mix Design………………112.1.2 Method of Concrete Mix Design……………………...11
2.2 Non Destructive Evaluation (NDE) Techniques………………….11
2.3 Rebound Hammer Test………………………………………..12
2.4 Ultra Sonic Pulse Velocity Test………………………………...13
2.5 Thermal Imaging Technique…………………………………...15

6
CHAPTER 3: TESTS, RESULTS AND ANALYSIS…………………………...17
3.1 Preparation of Specimen…………………………………………17
3.2 Rebound Hammer Test………………………………………….19
3.2.1 Experimental Set Up………………………………....193.2.2 Results……………………………………………...20
3.2.3 Conclusion ………………………………………....22
3.3 Ultra Sonic Pulse Velocity Test ……………………………….233.3.1 Experimental Set Up………………………………..23
3.3.2 Results…………………………………………....233.3.3 Conclusion ………………………………………..26
3.4 Thermal Imaging Technique…………………………………..27
3.4.1 Experimental Set Up……………………………….273.4.2 Results …………………………………………...27
CHAPTER 4: CONCLUSIONS AND RECCOMENDATIONS………………...30
4.1 Conclusions ………………………………………………...30
4.1.1 Rebound Hammer Test…………………………….30
4.1.2 Ultra Sonic Pulse Velocity Test……………………..30
4.1.3 Thermal Imaging Technique………………………..30
4.2 Recommendations …………………………………………..31
4.3 Future Work………………………………………………..31
REFERENCES…………………………………………………………32
7
LIST OF FIGURES
PAGEFigure 2.1 Direct Method Of Testing (USPV )……………………………….13
Figure 2.2 Indirect Method Of Testing (USPV)…………………………………14
Figure2.3 Semi Direct Method Of Testing (USPV)…………………………….14
Figure 2.4 Experimental Set Up Showing The Position Of Specimen And Heat
Sources………………………………………………………………..15
Figure 3.1 Beam with No Discontinuity…………………………………………17
Figure 3.2 Beam with Discontinuity in the Middle………………………………17
Figure 3.3 Beam with Discontinuity in the Corner………………………………17
Figure 3.4 Thick Paper Discontinuity…………………………………………….17
Figure3.5 Beam With Discontinuities At Varying Depth……………………….18
Figure3.6 Square Slab with Wooden Discontinuities at Varying Depths……….18
Figure3.7 Wooden Discontinuity………………………………………………..19
Figure3.8 Rebound Hammer (Schmidt Hammer)……………………………….19
Figure3.9 Rebound Hammer Test Result On Beam With No Discontinuity……21
Figure 3.10 Rebound Hammer test result on Beam with discontinuity
at one corner…………………………………………………………..22
Figure3.11 USPV Test Apparatus (PUNDIT)……………………………………23
Figure3.12 USPV Test Result on Beam with No Discontinuity…………………..24
Figure 3.13 USPV Test Result on Beam with Discontinuity in The Middle………25
Figure 3.14 USPV Test Result on A Beam With Discontinuity At One Corner…..26
Figure 3.15 Square Slab with X-Y coordinates………………………………….....26
Figure.3.16 USPV Test Result On Square Slab……………………………………..26
Figure3.17 Schematic Diagram Showing The Experimental Set Up Of
Thermal Imaging Technique……………………………………….…27
Figure3.18 Thermal Image and The Cooling Curve Of Beam With
Discontinuity In The Middle…………………………………………27
Figure3.19 Thermal Image And The Cooling Curve Of Beam

8
With Discontinuity At One Corner………………………………….28
Figure3.20 Thermal Image And The Cooling Curve Of Beam With Discontinuities At
Varying Depth……………………………………………………………28
Figur3.21 Thermal Image And The Cooling Curve Of Square Slab With Wooden
Discontinuities At Varying Depth……………………………………….29
LIST OF TABLES
PAGE
TABLE 3.1 Rebound number values at various points along the length …………….20 of beam with no discontinuity.
TABLE 3.2 Rebound number values at various points along the length …………….21 of beam with discontinuity at one corner.
TABLE3.3 Time taken by pulse in USPV at various points along the ………………..23 length of beam with no discontinuity.
TABLE 3.4 Time taken by pulse in USPV at various points along the ……………….24 length of beam with discontinuity in the middle.
TABLE 3.5 Time taken by pulse in USPV at various points along the ……………….25 length of beam with discontinuity at one corner.

9
CHAPTER 1
INTRODUCTION
1.1 Non Destructive Techniques
Non Destructive techniques are the methods predominant these days. These methods in
civil engineering are used to detect defects and determine the strength of a structure. As
the name suggest, in these techniques strength and discontinuities are determined without
causing any harm to the structure. These techniques have their own advantages as well as
limitations, when compared to conventional strength estimation and damage detection
tests.
1.2 Evaluation Of Defects In Concrete
1.2.1 Methodology and technique employed
In this project 3 techniques have been used, namely
(1) Rebound Hammer Test.(2) Ultra Sonic Pulse Velocity Test.(3) Thermal Imaging Technique.
1.2.2 Analysis and Results
In the first test graphical results were obtained and at the location of defect the
value (R number) goes out of range of equipment and no value is obtained thus indicating
the presence of defect.
In the second experiment also graphical results were obtained and the formation of
peak in the graphs clearly indicated the presence of a defect at that point.
In the third test, a thermal image was obtained in which a clear picture of the
defect could be seen.
1.3 Project Objective
The results obtained from the three techniques are compared and the most effective and
most economical technique to determine these defects has been suggested.

10
1.4 Report Organisation
This report consists of a total of four chapters including this introductory chapter.
Chapter 2 provides a theoretical background on various aspects. It provides information
regarding concrete mix design, Various Non Destructive techniques like Rebound
Hammer Test, Ultra Sonic Pulse Velocity test and Thermal Imaging Technique. Chapter
3 includes the test results of the rebound hammer test, USPV test and Thermal Imaging
Technique. Finally, conclusions and recommendations are presented in Chapter 4, which
is followed by a list of references.

11
CHAPTER 2
THEORETICAL BACKGROUND
2.1 Concrete Mix Design
The method of concrete mix design consists of selection of optimum proportions of
cement, fine & coarse aggregates and water, so that concrete of specified properties is
obtained most economically.
2.1.1 Factors governing Concrete-Mix Design
(i) Grade of concrete: The mix design is carried out targeting a mean strength, so that the
concrete manufactured confirms to the requirement of strength.
(ii) Type of cement: The type of cement influences the rate of development of the strength
as well as the durability under aggressive environments. The type of cement is selected,
depending upon the requirements of the performance of the concrete.
(iii)Cement content: Concrete mixes having high cement content give rise to increased
shrinkage. Cracking and creep of concrete also increase with increase in cement paste.
(iv)Aggregate type: Size, shape & grade of aggregate are also deciding factors whileobtaining concrete mix design. (Sinha, 2002)
2.1.2 Method of Concrete Mix Design
SP34 provides various instructions, tables & graphs, for designing of concrete mix,
targeting at required values of specific characteristic properties, in the most economical
way, taking into account all the given conditions and constraints over the performance
levels under various environments.
2.2 Non Destructive Evaluation (NDE) Techniques
The NDE techniques used in this project are:
(1) Rebound Hammer Test
(2) Ultra Sonic Pulse Velocity Test
(3) Thermal Imaging Technique
(4) The Theoretical Background of these have been described in the succeeding
sections.

12
2.3 Rebound Hammer Test
The Schmidt Rebound Hammer measures the hardness of material at the surface by the
rebound of hammer mass after an elastic impact against the surface. The mass is released
from a standard pre-compressed spring thus having a fixed amount of energy. Principle
of this test is that the rebound of the elastic mass depends on the hardness of the surface
upon which it impinges. Energy is lost on impact due to localized crushing and internal
friction within the body of the concrete. This internal friction is the function of the
elastic properties of concrete constituents. Rebound Number is the distance traveled by
the mass after the elastic impact expressed as a percentage of original distance. This
gives a measure or indication of hardness and an estimate of the strength of concrete.
There are several factors other than concrete strength that influence rebound hammer test
results, including surface smoothness and finish, moisture content, coarse aggregate type,
and the presence of carbonation.
Although rebound hammers can be used to estimate concrete strength, the
rebound numbers must be correlated with the compressive strength of molded specimens
or cores taken from the structure.
However, within certain constraints, the empirical correlation provided by one of
the researcher Facaoaru (MINT, 2006), is:
K = a Nb (2.1)
where N: rebound index; K: compressive strength; a and b are constants depending
on moisture content of concrete and dosage of cement, age of concrete, and in special
cases, the type of cement.
The estimated error in this method is +30%. Again, the calibration equation (2.1)
is valid for a particular type of cement, aggregates used, moisture content, & age of
specimen. (Deshpande, 2004)

13
2.4 Ultra Sonic Pulse Velocity Test
The velocity of ultrasonic pulses traveling in a solid material depends on the
density and elastic properties of that material. Ultrasonic testing is used to detect internal
flaws which send echoes back in the direction of the incident beam and these are picked
up by a receiving transducer. The measurement of the time taken for the pulse to travel
from a surface to a flaw and back again enables the position of the flaw to be located.
Such a technique is mainly used in metals because if this is applied to heterogeneous
materials like concrete and timber, echoes are generated at numerous boundaries of
different phases resulting in scattering of pulse energy in all directions.
The frequencies generally used lies in the range of 20 kHz to 250 kHz with 50
kHz being most suitable for concrete. The wavelength corresponding to this frequency
range is about 200 mm to 16 mm.
For assessing the quality of material from ultrasonic pulse velocity measurement,
it is necessary for this measurement to be of higher order of accuracy i.e (+/-) 1%.
Pulse Velocity = Path Length / Transit Time
The instrument used for this test is known as PUNDIT, Portable Ultrasonic Non
Destructing Digital Indicating Tester. It indicates the time taken for the earliest part of the
pulse to reach the receiving transducer. There are three methods of testing depending on
the arrangement of the transducers namely;
(1) Direct : where Transmitting and Receiving Transducers are on the parallel
surfaces.
TX
RX
FIG 2.1 Direct Method of testing (USPV).

14
TX: Transmitting Transducer
RX: Receiving Transducer
(2) Indirect: where Transmitting and Receiving Transducer are on the same surface.
(3) Semi Direct: where Transmitting and Receiving Transducers are on the
perpendicular surfaces.
Pulses are not transmitted through large air voids in a material or it takes a
longer time to travel through such voids. So it is possible to detect voids through this test.
( Deshpande,2004); (PUNDIT User Manual).
RXTX
TX
RX
FIG 2.2 Indirect Method of testing (USPV)
FIG 2.3 Semi Direct method of testing (USPV)
15
2.5 Thermal Imaging Technique
Thermal imaging technique is an active method for quantitative investigations of
the near surface region of various structures. It has recently been applied and optimised to
applications in civil engineering. By using either an internal or external heat source, parts
of the structure under investigation are heated up and the transient heat flux is observed
by recording the temperature change at the surface as a function of time. This method is
very well suited for the detection of voids in concrete, up to concrete covers of 10 cm as
well as for the location of delaminations in multi-layered systems (e.g. plaster on
concrete, CFRP-laminates on concrete, asphalt on concrete).
Defects like voids in concrete or masonry or delaminations at interfaces of
composites, which have different density, heat capacity and/or heat conductivity in
comparison to the bulk material, can be localised and partly quantified. The analysis of
heating-up and cooling-down processes during and after activation with an internal or
external heat source (i.e. radiator) is a well-established technique for the characterisation
of non-metallic materials. Up to now, there are only a few examples where active
thermography has been applied successfully in civil engineering. The method is very
useful for the determination of the built-in position of anchoring elements at curtain
facades as well. Further developments and applications in civil engineering are using the
sun as natural heat Also safety relevant defects like voids in tendon ducts and cracks in
concrete could be recognised. (Takahide &Kubo, 2002).
.
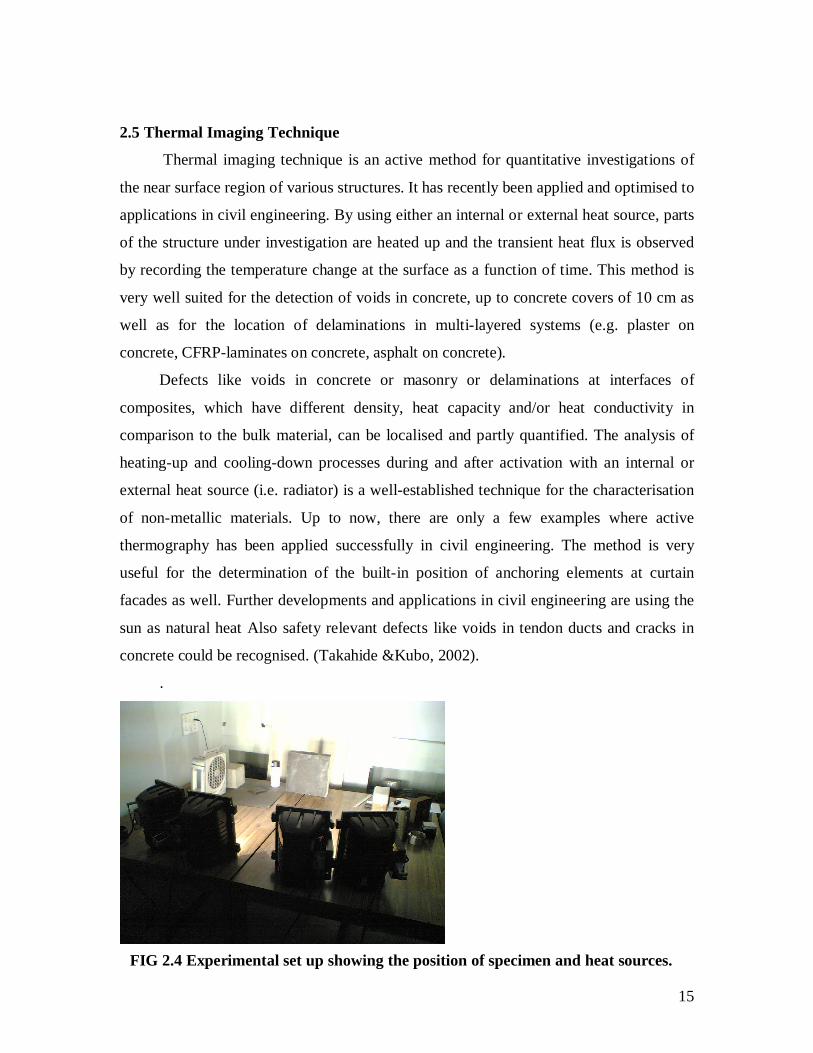
FIG 2.4 Experimental set up showing the position of specimen and heat sources.
16
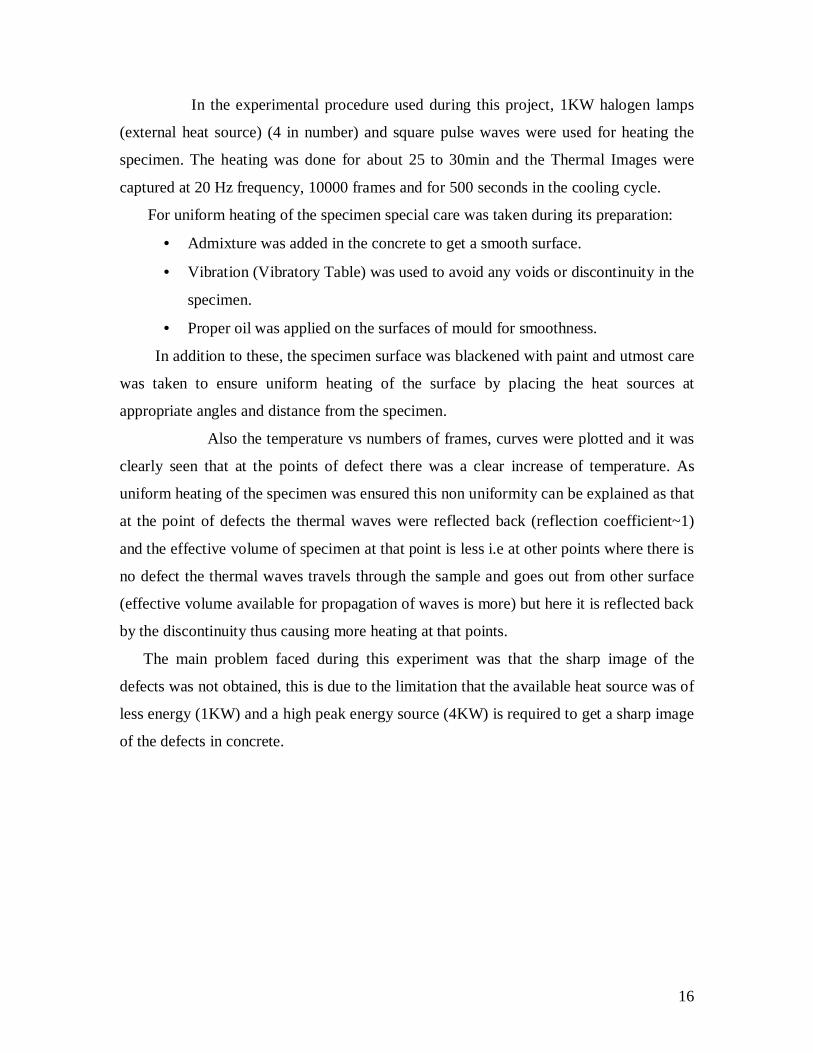
In the experimental procedure used during this project, 1KW halogen lamps
(external heat source) (4 in number) and square pulse waves were used for heating the
specimen. The heating was done for about 25 to 30min and the Thermal Images were
captured at 20 Hz frequency, 10000 frames and for 500 seconds in the cooling cycle.
For uniform heating of the specimen special care was taken during its preparation:
• Admixture was added in the concrete to get a smooth surface.
• Vibration (Vibratory Table) was used to avoid any voids or discontinuity in the
specimen.
• Proper oil was applied on the surfaces of mould for smoothness.
In addition to these, the specimen surface was blackened with paint and utmost care
was taken to ensure uniform heating of the surface by placing the heat sources at
appropriate angles and distance from the specimen.
Also the temperature vs numbers of frames, curves were plotted and it was
clearly seen that at the points of defect there was a clear increase of temperature. As
uniform heating of the specimen was ensured this non uniformity can be explained as that
at the point of defects the thermal waves were reflected back (reflection coefficient~1)
and the effective volume of specimen at that point is less i.e at other points where there is
no defect the thermal waves travels through the sample and goes out from other surface
(effective volume available for propagation of waves is more) but here it is reflected back
by the discontinuity thus causing more heating at that points.
The main problem faced during this experiment was that the sharp image of the
defects was not obtained, this is due to the limitation that the available heat source was of
less energy (1KW) and a high peak energy source (4KW) is required to get a sharp image
of the defects in concrete.

17
CHAPTER 3TESTS, RESULTS AND ANALYSIS
3.1 Preparation Of Specimen
(1) Three Beams (50cmX 10cmX10cm) of M25 grade were cast and discontinuities were
created using Thick Paper Sheet at a depth of 5cm from the front face as shown below.
• Beam 1: with no discontinuity
• Beam 2: with discontinuity in the middle
• Beam 3: with discontinuity at one corner
Details of Thick Paper discontinuity:
These beams were kept for 10 days Simple Curing before testing.
5cm
9cm
10 cm
50 cm
10 cm
10 cm
Thick Paper Sheet 50 cm
10 cm
Thick Paper Sheet
50 cm
10 cm
10 cm
FIG 3.3
FIG 3.1
FIG 3.2
FIG 3.4
18
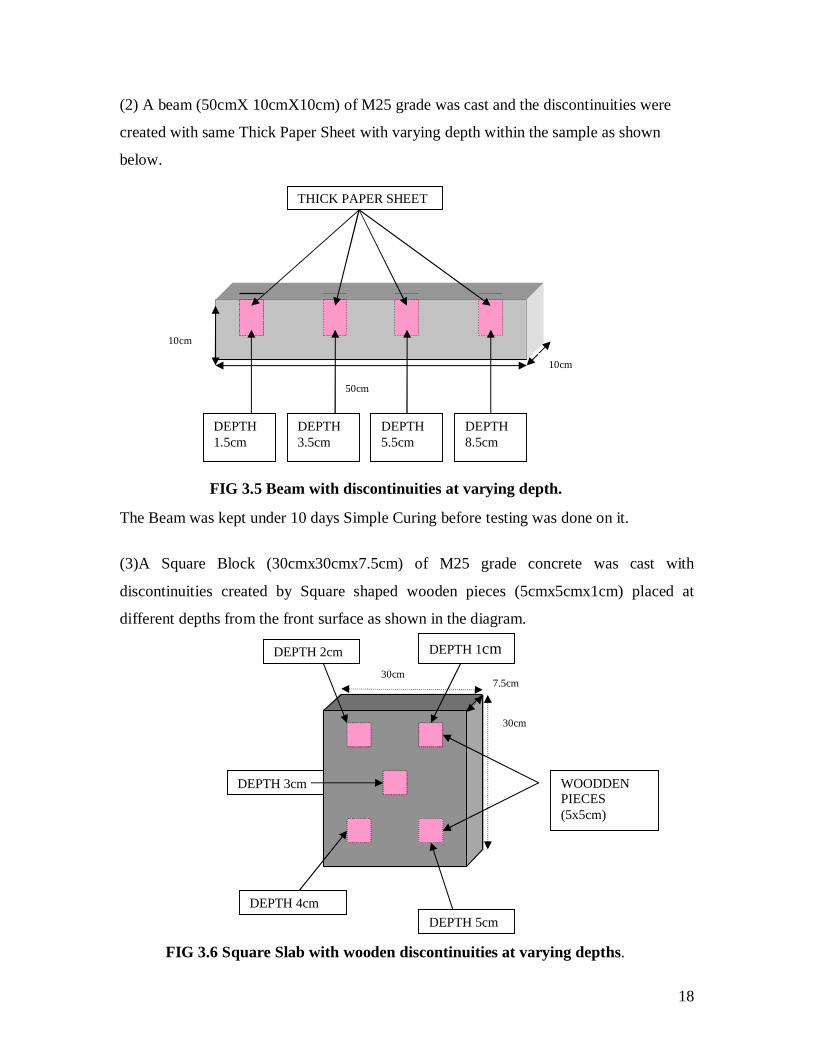
(2) A beam (50cmX 10cmX10cm) of M25 grade was cast and the discontinuities were
created with same Thick Paper Sheet with varying depth within the sample as shown
below.
The Beam was kept under 10 days Simple Curing before testing was done on it.
(3)A Square Block (30cmx30cmx7.5cm) of M25 grade concrete was cast with
discontinuities created by Square shaped wooden pieces (5cmx5cmx1cm) placed at
different depths from the front surface as shown in the diagram.
50cm
10cm
10cm
THICK PAPER SHEET
DEPTH1.5cm
DEPTH3.5cm
DEPTH5.5cm
DEPTH8.5cm
DEPTH 3cm WOODDENPIECES(5x5cm)
DEPTH 1cmDEPTH 2cm
DEPTH 4cmDEPTH 5cm
30cm
30cm7.5cm
FIG 3.5 Beam with discontinuities at varying depth.
FIG 3.6 Square Slab with wooden discontinuities at varying depths.

19
Details of the discontinuity (wooden pieces) are as under:
The specimen was kept for 10 days Simple Curing before testing was done on it.
3.2 Rebound Hammer Test3.2.1 Experimental Set Up
5cm
5cm
1cm
FIG 3.7Wooden Discontinuity.
FIG 3.8 Rebound Hammer (Schmidt Hammer)

20
3.2.2 Results
Rebound Hammer Test was performed on the Rectangular Beams having thick paper
sheet discontinuities and the results were as shown.
BEAM 1 (with no Discontinuity) [FIG3.1]
TABLE 3.1
Point Number Rebound Number (R) Point Number Rebound Number (R)
1 20 17 23
2 21 18 24
3 23 19 23
4 23 20 23
5 23 21 22
6 21 22 22
7 22 23 22
8 22 24 20
9 24 25 24
10 21 26 23
11 20 27 22
12 22 28 24
13 23 29 24
14 23 30 27
15 22 31 22
16 22 32 35

21
R number vs Number of points along the specimen for the above values.
Rebound Hammer Specimen 1
05
10152025303540
0 5 10 15 20 25 30 35
No. of points along the length of Specimen
R n
umbe
r
As expected there is not much variation in the value of R number along the length of
specimen.
Beam 3: (with discontinuity at the centre) FIG.3.2
TABLE 3.2
Point Number Rebound Number (R) Point Number Rebound Number (R)
1 23 17 20
2 21 18 20
3 20 19 21
4 22 20 22
5 20 21 21
6 19 22 20
7 19 23 21
8 22 24 19
9 21 25 20
10 19 26 --
FIG3.9 Rebound Hammer test result on Beam with no discontinuity (FIG.3.1).

22
11 19 27 19
12 20 28 --
13 20 29 --
14 21 30 --
15 23 31 --
16 21 32 --
R number vs Number of points along the specimen for the above values
Rebound Hammer on Sample 3 {with discontinuity at onecorner}
0
5
10
15
20
25
0 5 10 15 20 25 30 35
No. of points along length of Specimen
R N
umbe
r
3.2.3 Conclusion
In the region of discontinuity the R number value decreases and goes out of the range of
Schmidt Hammer. Thus it gives a little idea about the location of discontinuity but no
strong conclusion can be drawn.
FIG 3.10 Rebound Hammer test result on Beam with discontinuity at one corner. (FIG.3.3).

23
3.3 Ultra Sonic Pulse Velocity Test3.3.1 Experimental Set Up
3.3.2 Results
USPV Test was conducted on the rectangular beams having thick paper sheet
discontinuities at different locations and the results obtained are as under:
BEAM 1: (with no discontinuity) [FIG.3.1]
TABLE 3.3
Point Number Time taken by pulse to
travel from one end to
other (microseconds)
Point Number Time taken by pulse to
travel from one end to
other (microseconds)
1 19.8 6 20.3
2 20.5 7 21.8
3 20.2 8 21.5
4 20.2 9 20.8
5 21.2 10 21.0
FIG 3.11 USPV Test Apparatus (PUNDIT)
24
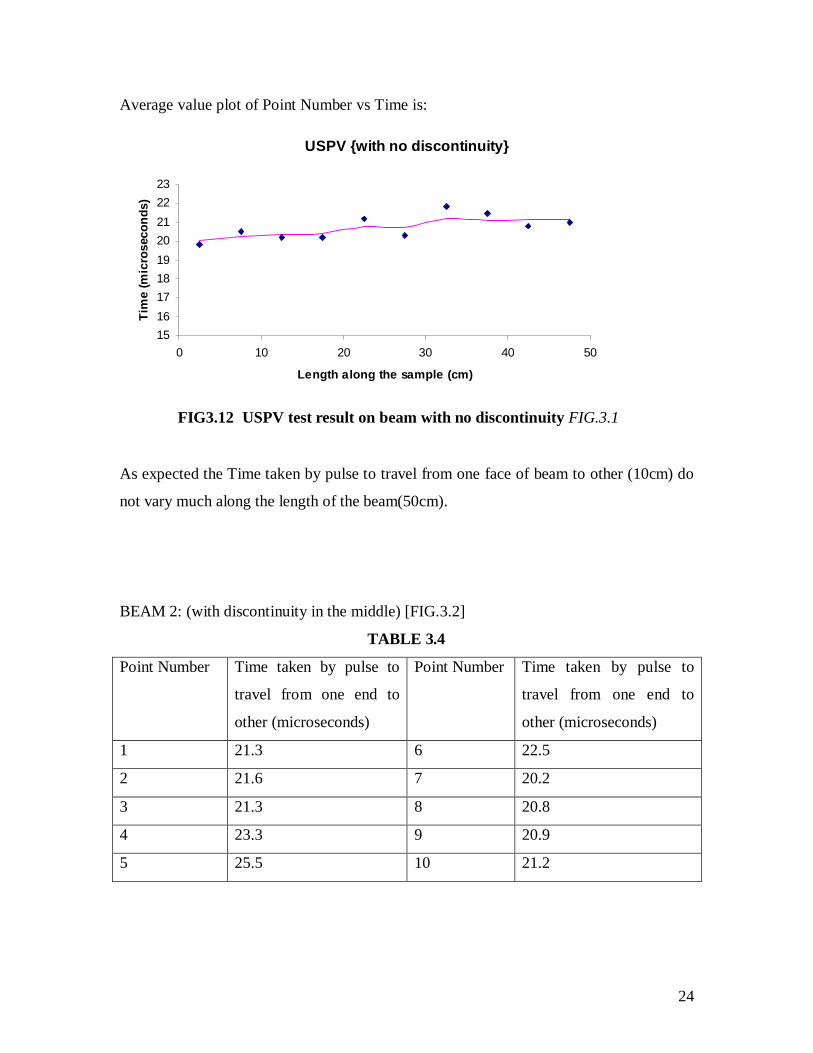
Average value plot of Point Number vs Time is:
USPV {with no discontinuity}
151617181920212223
0 10 20 30 40 50
Length along the sample (cm)
Tim
e (m
icro
seco
nds)
As expected the Time taken by pulse to travel from one face of beam to other (10cm) do
not vary much along the length of the beam(50cm).
BEAM 2: (with discontinuity in the middle) [FIG.3.2]
TABLE 3.4
Point Number Time taken by pulse to
travel from one end to
other (microseconds)
Point Number Time taken by pulse to
travel from one end to
other (microseconds)
1 21.3 6 22.5
2 21.6 7 20.2
3 21.3 8 20.8
4 23.3 9 20.9
5 25.5 10 21.2
FIG3.12 USPV test result on beam with no discontinuity FIG.3.1

25
Plot of Point Number vs Time is:
USPV {with obstruction in the middle}
2021222324252627282930
0 5 10 15 20 25 30 35 40 45 50
Length along the specimen (cm)
Tim
e (m
icro
seco
nds)
The plot clearly shows the indication that at the location of defect the time, pulse take to
travel is more as compared to other points.
BEAM 3: (with discontinuity at one corner) [FIG.3.3]
TABLE 3.5
Point Number Time taken by pulse to
travel from one end to
other (microseconds)
Point Number Time taken by pulse to
travel from one end to
other (microseconds)
1 20.5 6 22.2
2 20.4 7 21.5
3 21.5 8 21
4 21.2 9 23.2
5 21.7 10 23.2
FIG 3.13 USPV test result on beam with discontinuity in the middle (FIG.3.2)

26
Average value plot of Point Number vs Time is:
USPV{with obstruction on one corner}
20
20.5
21
21.5
22
22.5
23
23.5
0 10 20 30 40 50
Length along the Specimen (cm)
Tim
e ( m
icro
seco
nds)
The plot clearly shows the indication that at the location of defect the time, pulse take to
travel is more as compared to other points.
Square Slab (with wooden discontinuities) [FIG.3.6]
7.515
22.5
S1
S2
S3
10
12
14
16
18
20
Time(mcrosecon
ds)
X distance (cm)
Y distance(cm)
3.3.3 Conclusion
By looking at the data obtained and the plots we can strongly infer the location of
defects in the specimen. Thus a good method to rely upon.
FIG 3.14 USPV test result on a beam with discontinuity at one corner (FIG.3.3)
2
46
8 97
5
31
X
Y
Fig 3.15 Square Slab with X-Y coordinates FIG.3.16 USPV test result on square slab

27
3.4 Thermal Imaging Technique3.4.1 Experimental Set Up
3.4.2 Results
Thermal Imaging technique was performed on the Beams having thick paper sheet
discontinuities and on the Square slabs having wooden defects and the thermal image was
captured during the cooling cycle for 500 seconds and 10000 frames.
BEAM 2: (with discontinuity in the middle) [FIG3.2]
COMPUTER
INFRARED CAMERA HEAT SOURCE
SPECIMEN
FIG3.17 Schematic diagram showing the experimental set up of Thermal Imaging Technique.
28
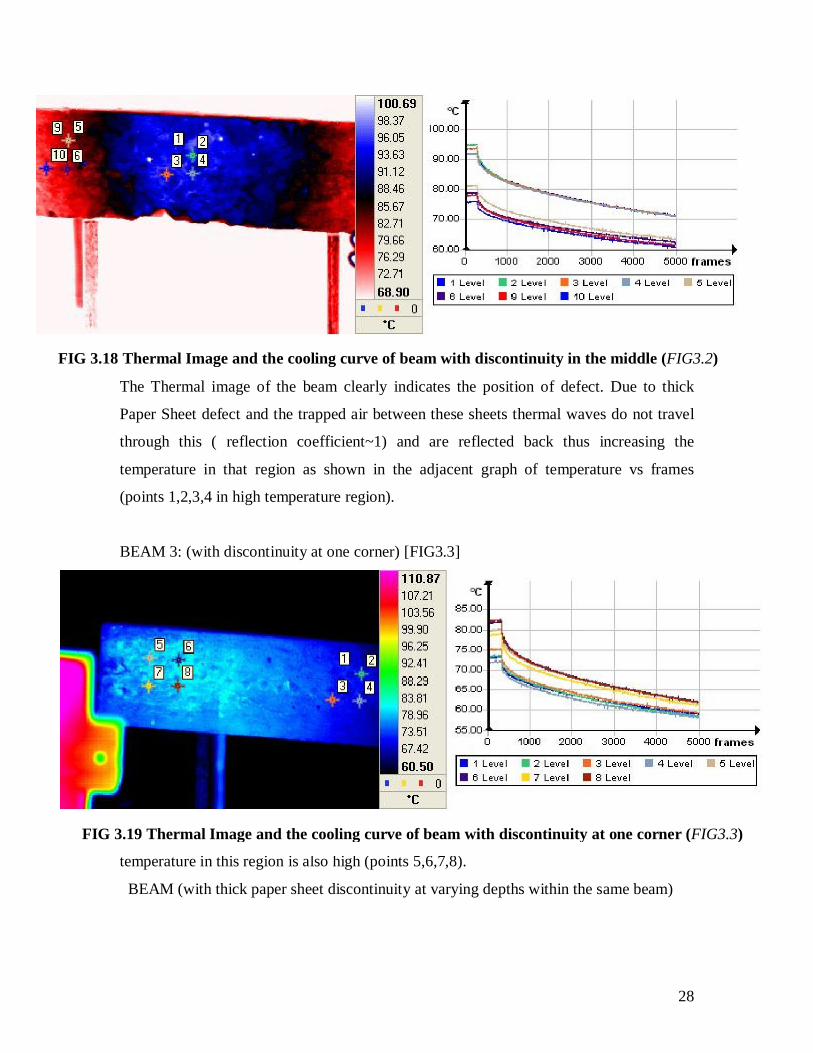
The Thermal image of the beam clearly indicates the position of defect. Due to thick
Paper Sheet defect and the trapped air between these sheets thermal waves do not travel
through this ( reflection coefficient~1) and are reflected back thus increasing the
temperature in that region as shown in the adjacent graph of temperature vs frames
(points 1,2,3,4 in high temperature region).
BEAM 3: (with discontinuity at one corner) [FIG3.3]
In the Thermal image the location of the thick paper sheet is clearly visible and the
temperature in this region is also high (points 5,6,7,8).
BEAM (with thick paper sheet discontinuity at varying depths within the same beam)
FIG 3.18 Thermal Image and the cooling curve of beam with discontinuity in the middle (FIG3.2)
FIG 3.19 Thermal Image and the cooling curve of beam with discontinuity at one corner (FIG3.3)
29
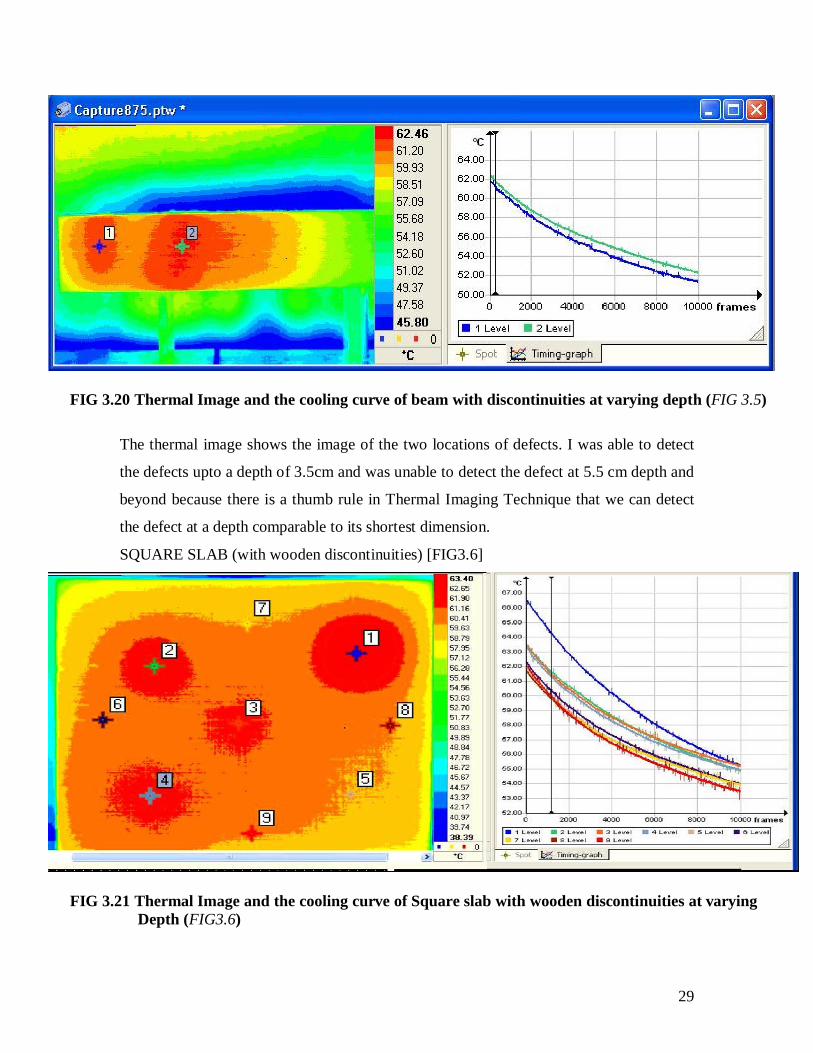
The thermal image shows the image of the two locations of defects. I was able to detect
the defects upto a depth of 3.5cm and was unable to detect the defect at 5.5 cm depth and
beyond because there is a thumb rule in Thermal Imaging Technique that we can detect
the defect at a depth comparable to its shortest dimension.
SQUARE SLAB (with wooden discontinuities) [FIG3.6]
FIG 3.20 Thermal Image and the cooling curve of beam with discontinuities at varying depth (FIG 3.5)
FIG 3.21 Thermal Image and the cooling curve of Square slab with wooden discontinuities at varying Depth (FIG3.6)

30
In the Square Slab, I was able to detect the discontinuities at 1cm, 2cm,
3cm, 4cm depths but was not able to detect defect at 5cm depth as it is equal to the
dimension of defect (5cm X 5cm).
CHAPTER 4
CONCLUSIONS AND RECCOMENDATIONS
4.1 Conclusions
4.1.1 Rebound Hammer Test According to my Experiments we can clearly see that for Non Destructive Evaluation
of Defects in Concrete Rebound Hammer test is not the one that can be relied upon.
Though from data obtained (R number) and plots [FIG3.10-FIG.3.11] we can clearly see
that it gives some indication of the presence of some defect but strong conclusion can’t
be drawn from these results.
Also if the concrete specimen is such that it’s R value is low (that is R<18) than by
Schmidt Hammer we can’t get the R value at all (at any point) and the little bit indication
that we were able to draw from this test about the presence of discontinuities could not be
drawn and in that case this test will be a complete failure.
So the only conclusion that can be drawn here is that Rebound Hammer test is of
negligible importance in detecting defects in concrete.
4.1.2 Ultra Sonic Pulse Velocity Test
From my experiments it can be seen that the USPV Test is the one on which we can
completely rely to serve our purpose. From Time taken by pulse vs Points along the

31
length of specimen plots [FIG3.12-FIG.3.14] we can easily see that at the points of
discontinuities the time taken by the pulse to travel across the beam increases
considerably and this point is seen as a peak in the graph.
4.1.3 Thermal Imaging Technique
The use of this technique in Non Destructive Evaluation of Defects in Concrete is entirely
a new concept. Not much work has been done so far in this field. By the work I have
carried out during my project in this field, it has been found that this experiment is of
great relevance to us.
In this experiment whole specimen can be scanned in a single shot unlike Rebound
Hammer Test and USPV test where each and every point is to be scanned.
The results I got, by this experiment clearly show the picture (blurred image) of the
defect. The result could be improved further and a sharp image of the defect can be seen
by the use of high peak energy heat sources. In IIT the heat source available are of 1KW
power and to obtain the sharp image the heat sources required should have energy of
4KW.
Despite this limitation the results show the clear image of the defect, its location and
size. By further analysis of the cooling curves obtained, we can get the depth of the defect
but this part is beyond the scope of this project.
4.2 Recommendations Though both Ultra Sonic Pulse Velocity test and Thermal Imaging Technique give
very good results and are of equal importance in detecting defects in concrete but there is
much difference in their cost inputs. The experimental apparatus (especially Infrared
Camera) used in Thermal Imaging Technique is very costly. So, as far as we are
concerned about the detection of defect only and not the shape and size of discontinuity
present, I would recommend USPV Test but when we are concerned about the shape and
size of defect than I would recommend the use of Thermal Imaging Technique.
Also if the depth of defect is more (more than the shortest dimension of the defect)
than I would recommend using USPV for better results.

32
4.3 Future Work
In my B.Tech Project I’ll be trying some more Non Destructive techniques like
Vibratory techniques, Ground penetrating radar technique etc. for detection of defects
and also for the strength determination.
I’ll be analyzing the cooling curves of thermal imaging technique for depth detection
and will try my best to publish a paper on the use of this technique for detection of
defects in concrete.
REFERENCES
Sinha S.N. (2002), Reinforced Concrete Design, 2nd ed. Tata Mc Graw Hill Publishing
Company, New Delhi
IS 456 (2000), Plain and Reinforced Concrete- Code of Practice, Bureau of Indian
Standards, New Delhi.
Ch. Maierhofer et al (2006), “Application of impulse-thermography for non-destructive
assessment of concrete structures” Cement & Concrete Composites Vol 28 Page 393-401
A. Brink et al (2005) “Quantitative impulse-thermography as non-destructive testing
method in civil engineering – Experimental results and numerical simulations”
Construction and Building Materials Vol 19 Page 731–737.
Takahide Sakagami *, Shiro Kubo (2002) “Development of a new non-destructive testing
technique for quantitative evaluations of delamination defects in concrete structures
based on phase delay measurement using lock-in thermography” Infrared Physics &
Technology Vol43 Page 311–316

33
Deshpande V.B, Hawlader Suman (2004) Structure Laboratory Manual.
PUNDIT User Manual.