project title: innovative tools to improve nutrient and
TRANSCRIPT

1
Project Title: Innovative Tools to Improve Nutrient and Financial Accounting Conservation
Practices on Vermont Farms
Timeframe: 14-Mar, 2017 through 31-Aug, 2019
Agreement Number: #69-1644-17-156
Date of submission: January 25, 2020
Deliverables identified in the grant agreement:
1. Add import/export functions to goCropTM.
2. Plan, format & create a minimum of six new goCrop reports that can easily be used to check plan
compliance with VT Agency of Agriculture.
3. Integrate Whole Farm Nutrient Balance Calculator into goCropTM.
4. Integrate NRCS Economic Cover Crop Calculator into goCropTM.
5. List and maps of participating farms.
6. Test goCropTM and improve with feedback from 10 participating farms.
7. Prepare case studies and bulletins to share with farmers across Vermont.
8. Develop webinar and tutorials to share with farmers across Vermont.
9. Submit Quarterly and Final Reports.

2
Table of Contents
Executive Summary 3
Introduction 4
Background 7
Review of Methods 9
Discussion of Quality Assurance 13
Findings 14
Recommendations and Conclusions 15
Appendix A: June 2017 Press Release 16
Appendix B: NMB Input List 17
Appendix C: CCEC Input List 18
Appendix D: goCropTM Features Advertisement 19
Appendix E: Map with Participating Farms 20
Appendix F: Farmer Success Story 21
Appendix G: Sample NMP Report: Planned Manure Applications 26
Appendix H: Sample NMP Report: Planned Fertilizer Applications 27
Appendix I: Sample NMP Report: Land Base Summary Report 28
Appendix J: Sample NMB Report: Annual Nutrient Balance 29
Appendix K:Sample NMB Report: Distribution of Nutrients 30
Appendix L: Sample NMB Report: Itemized Nutrient Imports and Exports (%) 31
Appendix M: Sample NMB Report: Itemized Nutrient Imports and Exports (lb/tillable acre) 32
Appendix N: Sample NMB Report: Graphical Interpretation 33
Appendix O: Sample CCEC Report: Short Term Summary 34
Appendix P: Sample CCEC Report: Economic Analysis 35
Appendix Q: Sample CCEC Report: Financial Analysis 36
Appendix R: Sample CCEC Report: Long Term Summary 37

3
Executive Summary
The overall goal of this project was to decrease agricultural nonpoint source nutrient pollution to
watersheds impaired from agricultural nutrient and sediment runoff and erosion. Farmers need
easy-to-use decision-making tools to facilitate adoption and implementation of conservation
practices. goCropTM is a state-of-the-art web and mobile nutrient management application that was
initially designed to meet the nutrient management planning requirements necessary to fulfill the
NRCS 590 standards and the Vermont Agency of Agriculture, Farm and Markets (VAAFM) water
quality regulations. Currently over 300 nutrient management plans (NMPs) in the state of Vermont
have been developed with GoCropTM. Increasing the ease of developing NMPs and adding access
to analysis tools will aid data-driven decision-making processes that promote economic healthy
and environmentally sound solutions.
To achieve those objectives, the following features were incorporated into goCropTM:
1) Ability to reduce the burden of data entry required of an NMP by including a method to
import data from a csv file.
2) Ability to export data from goCropTM to allow farmers the potential to use their data with
other analysis or modeling software.
3) Integration of Cornell’s Whole Farm Nutrient Mass Balance Software model into
goCropTM to allow farmers the ability to assess whole farm nutrient balances of their
farming system.
4) Integration of the Natural Resources Conservation Service’s (NRCS) Cover Crops
Economics Decision Support Tool into goCropTM to allow farmers to assess the economic
benefits of planting cover crops.
5) Creation of 12 new data analysis reports give farmers more data to make informed crop
and soil management that meets economic and environmental goals.
In order to ensure that these enhancements were easy to use and understand these new features
were beta-tested by farmers. Their feedback was incorporated into subsequent goCrop™ releases.
Unfortunately, due to a delay in writing code, feedback on the Whole Farm Nutrient Mass Balance
Software and the Cover Crops Economics Decision Support Tool was limited to 10 farmers over
the course of one year. This delay also necessitated a no-cost extension. Thankfully, with the
granted no-cost extension and good grant fund management, more data reports were included than
initially anticipated. The Northwest Crops and Soils Program (NWCS) promoted the tools
especially with farmers involved in the NMP courses held annually by UVM Extension. These
tools have also been advertised during webinars, courses, conferences workshops, and during
individual technical assistance visits. By the end of this project, 20% of dairy farmers in Vermont
(146 dairy farmers) are actively using goCropTM and its associated tools on more than 50,000 acres.
Farmers are able to use the new functions and NWCS consistently solicits feedback to improve
goCropTM. At the start of 2020, a Facebook post and tweet from the NWCS social media pages
officially announced the release of the goCrop™ analysis tools. The announcement will be posted
on the UVM NWCS website and shared with other partner organizations via -email along with the
Farmer Success Story (Appendix F). The goCropTM tool is available as a 30-day free trial or as a
one-year paid subscription.
4
Introduction
Overview
The goCropTM software package that provides a practical and cost effective means of creating a
NRCS 590 compliant nutrient management plan (NMP) that also meets Vermont state standards.
goCropTM is designed so that farmers with some assistance from technical service providers can
develop and maintain an NMP which when implemented helps the producer protect soil and water
and improve or maintain yields.
The purpose of this project is to integrate new features to goCropTM so farmers can more easily
enter NMP data, view and assess their data, and transfer data to other software platforms. In
addition, new analysis tools were built into the goCrop™ to aid farmers in understanding the flow
of nutrients on the farm with Cornell’s Whole Farm Nutrient Mass Balance Calculator (NMB) and
show the economic benefits of cover crops with NRCS’s Cover Crop Economics Calculator
(CCEC).
goCropTM was developed under the direction of UVM Extension Agronomist and Nutrient
Management Specialist, Dr. Heather Darby. Darby has extensive experience working with local
farmers in field based research projects as well as development of nutrient management plans.
Penelope Hobbs, software engineer, was contracted to work on this project. Hobbs has seven years
of experience designing and developing web and mobile applications, including several projects
in the areas of agriculture, education, and scientific research. She is a graduate of Cornell
University where she focused on statistics, biology, agriculture, and computer science. Lindsey
Ruhl, UVM Extension Research Specialist, helps Dr. Darby manage goCropTM projects and assists
farmers in writing their NMPs. She gathered farmer feedback on the new features during beta-
testing.
Goals and Objectives
The goals of this project outlined in this CIG grant were to:
1. Add import/export functions to goCropTM.
2. Plan, format & create a minimum of six new goCropTM reports that can easily be used to
check plan compliance with VT Agency of Agriculture.
3. Integrate Whole Farm Nutrient Balance Calculator into goCropTM.
4. Integrate NRCS Economic Cover Crop Calculator into goCropTM.
5. List and maps of participating farms.
6. Test goCropTM and improve with feedback from 10 participating farms.
7. Prepare case studies and bulletins to share with farmers across Vermont.
8. Develop webinar and tutorials to share with farmers across Vermont.
9. Submit Quarterly and Final Reports.
Scope
These tasks will help us meet the goal of reducing losses of manure nutrients, especially P, through
runoff and leaching by developing planning and analysis tools that help farmers maximize
productivity while minimizing environmental impact. The project proposes to accomplish three

5
objectives to help farm operators identify ways to improve the implementation of water quality
policy and its directives.
1. The first objective of this project is to add enhancements to the GoCropTM NMP tool to
allow for the importing and exporting of data. This goal will establish a metadata file and
a template which can be used by all nutrient management planners to create datasets that
can be uploaded into goCropTM. The benefits of this are threefold. First, it will allow the
data collected to be used for NMP planning to be standardized. It will ensure that all plans
are developed using a common set of variables. This will be clearly defined for planners
to be able to comply. This data created using a pre-determined file format such as excel
will then be portable between GoCropTM and other NMP software packages. It will
eliminate the need to re-enter data between platforms. More importantly, it will provide a
way to add consistency to the planning process. Once this is accomplished we propose to
develop key reports which regulators and other stakeholders could look at to quickly assess
plans. Example of reports are planned vs. actual rotations and summarization of as applied
nutrient values. This will help make nutrient management plans more understandable and
consistent across the state. All plans would need to be submitted in the provided format
for uploading into goCropTM which could then be utilized to generate the key reports that
would be designed to the specifications of the stakeholders. Second, it will enable farm
operators to move data between technical service providers much easier. Having the data
in a common file format will make the data much more portable. Third, the implementation
of this goal will create efficiencies within organizations charged with using NMPs to assist
farmers with meeting current and future regulations.
2. The second goal of this project is to work with software developers to integrate Cornell
University’s Whole Farm Nutrient Balance Software model into GoCropTM. The benefit
of doing this is that many of the inputs are already included in a GoCropTM NMP. All of
the cow numbers, manure generation numbers, fertilizer inputs, crop yields, etc. are already
embedded in the nutrient management plan. We will simply add a module for Mass
Nutrient Balancing and provide a way to input the remaining data pieces such as milk
production, meat exports, feed analysis records and then use the methodology used in the
Cornell model to generate whole farm mass nutrient balances. We will work with the
software developers at Cornell to ensure that the GoCropTM model is developed correctly
and then demonstrate the effectiveness on 10 farms across the state of Vermont.
3. The third goal of this project is to add a module to GoCropTM which will allow producers
to evaluate the economics of cropping practices so that sound economic decisions can be
made regarding the implementation of different cropping practices. This module will be
integrated into GoCropTM based on the NRCS Cover Crop Economics Calculator. We will
use a standard list of field operations costs (Pennsylvania generates one annually for the
Northeastern region of the United States). The farm operator would also have the
opportunity to input their own values into the module. Much of this data is already in
GoCropTM because of the requirement to do record keeping and only the additional pieces
and the calculation spreadsheets would have to be developed. The creation of this module

6
in GoCropTM will make nutrient management much more practical from an economic sense
to the producer. With the addition of a module to calculate costs and profit from particular
practices it will make the process of nutrient management planning more relevant to the
farmer in day to day operations. Once the module has been developed we propose to
demonstrate the effectiveness of this tool on 10 farms across the state of Vermont.
Relationships Dr. Quirine Ketterings of Cornell University provided NWCS with the Whole Farm Nutrient
Mass Balance calculations at no-cost. The NRCS Cover Crops Economics Decision Support
Tool is publically available online. Penelope Hobbs is the paid contractor who programmed the
new features into goCropTM.
Funding NRCS provided funds for this project in the amount of $74,984. Additional funding to support
this CIG grant were non-federal matching funds in the about of $9,554.10 from UVM.
Collaborating farmers who beta-tested provided $25,793 in-kind match. Hobbs, the software
developer provided $23,760 in in-kind match. VAAFM provided $30,000 as third-party match.
Match funds totaled $89,107.10.

7
Background
The overall goal of this project is to decrease agricultural nonpoint source nutrient pollution to
watersheds impaired from agricultural nutrient and sediment runoff and erosion. To that end, the
purpose of the project is to further refine and broaden the use of new state-of-the-art web
application, goCropTM, developed to enhance the adoption and effectiveness of nutrient
management on livestock farms.
The focus of the work conducted under this grant will be to address the following three problems
faced by stakeholders in the state of Vermont.
1. Currently there are several different methods of developing NMPs. Each of these methods
may meet the 590 NMP standards but provide the information to the producer and other
stakeholders in an inconsistent format. Certain planners may add data not critical to the
plan and different planners build the overall documents differently. This makes it difficult
to quickly assess plans for compliance and identify area of the farm that may need
addressing before issues arise. Regulators and other stakeholder must “hunt” for the
information they are looking for which is a drain on personnel resources and can produce
inconsistent outcomes based on information provided to the stakeholders. With more and
more emphasis being placed on the ability of stakeholders to access and assess NMPs a
consistent format is very important to ensure objective assessments and efficient use of
staff time throughout government agencies.
2. It is common knowledge that there is a problem with excess nutrients from agricultural
operations reaching the waters of Vermont. It is also known that the state of Vermont is a
net importer of phosphorus which is the main contributor to water quality issues in the
Lake Champlain Basin and other lakes, rivers and streams within Vermont. Historically,
universities and other entities have developed accounting tools to attempt to track and
document the imports and exports of nutrients at the farm level in an attempt to measure
the impact a given operation may have on water quality. One tool that has been used which
we propose to integrate into goCropTM is Cornell University’s Whole Farm Nutrient
Balance Software. These tools quite often also provide the information that helps
producers identify inefficiencies in their farming systems. For example, a farmer may feed
the cows too many minerals which would be identified when looking at the reports
generated by a Nutrient Mass Balance Calculator. The problem with these “calculators” is
that the data is very time consuming to gather and that farmers often have limited time to
focus on providing the data to people helping them calculate their balances. As a result,
this tool has been underutilized in Vermont as a way to help farmers identify what their
contribution to the water quality issues in Vermont might be and subsequently how they
might be able to reduce any imbalances on their farm. There is need to streamline this
process and utilize existing data sources to facilitate the generation of mass nutrient
balances on farms.
3. The explosion of conservation practices across Vermont such as cover cropping and
reduced tillage practices has been spurred on by a large personnel and financial

8
commitment by various stakeholders who are seeking to make drastic improvements in
water quality. The problem is that farmers need to assess if the implementation of these
practices will produce a positive return on investment (ROI) on their farms. Once the
government stops providing funding will the farmer adopt the practice into their long term
cropping methods or revert back to the “old” ways? One way to help farmers recognize
the short and long term benefits of conservation cropping methods is to provide a financial
assessment of those practices on the farmer’s fields. Currently there are good tools such
as NRCS’s Cover Crop Economics Calculator but the amount of redundant data entry limits
the acceptance of these tools on farm operations. However, it is critical to the long term
adoption of these practices and the justification of the millions of dollars of taxpayer’s
money that is invested into the implementation of these practices that farmers recognize
the financial benefits of the practices after the government money stops flowing (typically
3-5 years after a practice has been implemented).
This project proposes to address all three of these critical issues by adding enhancements and
functionality to goCropTM. Through the utilization of goCropTM it will become much easier to
produce the information needed at the farm level to make decisions that will have a positive impact
on water quality. The use-value of these methodologies and efficacy of the integrated system
were explored with ten farmers who beta-tested the new features in goCropTM.

9
Review of methods
goCropTM went live on the web and mobile platforms in 2012. The goCropTM tool was one of the
first mobile applications to help dairy farmers comply with NRCS and Vermont state reporting
standards. Since its inception, goCropTM has improved its ability to aid farmers in writing their
own NMPs and with the addition of key reports, facilitate farmer implementation and Vermont
state review. goCropTM has added several modules to help meet the NMP needs of vegetable
farmers and grazing farmers. Funds from this grant expanded goCropTM’s capabilities with the
addition of the NMB and CCEC analysis tools, making goCropTM a one stop shop to write an NMP
cost-effectively and use tools to make data-driven decisions that promote economically and
environmentally sound practices. The announcement anticipating these new nutrient-management
decision making tools was made in a June 13th, 2017 press release (Appendix A).
Although there are many useful analysis tools available on the web, many farmers in Vermont are
not comfortable using computers and therefore are not likely to use the tools. Hosting multiple
tools on a single platform that farmers are familiar with will increase the likelihood of adoption.
However, these analysis tools are only as good the accuracy of the data used. To that end,
improvements were made to goCropTM to reduce the burden of data entry for writing NMPs and
using the analysis tools. See Appendix B for a list of inputs required by the NMB and Appendix
C for a list of inputs required by the CCEC.
Over the course of this grant, many improvements were made to goCropTM. Table 1 provides a list
of release dates and corresponding features related to the grant. Table 1 is not an exhaustive list
of all improvements and does not include details of major back-end changes i.e. converting to
Javascript for faster report generation, converting code to be cross-platform app compatible that
will reducing future software improvements costs, stream-lining the user-interface, and general
updates and required maintenance.
Table 1. Release dates of features directly related to the CIG grant and other related improvements
funded from other sources.
Release date CIG Funded Features Non-CIG Funded Features
2017/04/04 Planned Fertilizer Application
Report added
Planned Manure Application Report
added
Use fall applied manure records for
subsequent year’s nutrient balance
instead of planned fall manure
application.
2017/05/07 Existing Manure Drawdown Report
modified to show imported manure.
Existing Field by Field Planning
Report modified to incorporate
fertilizer sources with mineralization
rates.
Existing NMP reports modified to
include critical NMP notes
goGraze available on live site.

10
2017/12/19 NMB released to live site.
Annual Nutrient Mass Balance Report
added
New version of P-Index
incorporated.
2018/01/29 Ability to indicate if a fertilizer is
organic (preparation for goVeg)
Ability to add a fertilizer in gallons
with density calculation for lbs.
applied.
2018/04/09 Data can be shared from goCropTM
NMP to the NMB.
2018/09/ Export capabilities added.
2018/10/22 Ability to download data goCropTM
added.
goVeg added to live site, but not
visible as work continue, included
ability to draw sub-fields and make
plans and records for sub-fields.
2018/11/29 Added ability to indicate if a field is
frequently flooded added to stay in
line with VT regulations.
2019/01/20 Import capabilities added.
2019/02/08 CCEC released to live site.
CCEC Short-Term Summary Report
CCEC Long Term Economic
Analysis Report
Financial Analysis Report
Long Term Summary Report
2019/03/19 Autofill crop row based on previous
row in CCEC (reduces data level
redundancy).
2019/09/13 NMB Distribution of Nutrients (%)
Report added.
Itemized Nutrient Contributions
Report added
How to Interpret This Report page
added to NMB
Remaining diagnostics added to
Annual NMB Report.
Ability to base information in one
rotation year off of the previous year
in CCEC.
2019/09/12 Changes
Added shortcuts for copying
rotation years on the CCEC
On NMB allow input of large
numbers on with commas on smart
forms

11
Added Distribution of Nutrients
Report and Itemized Nutrient
Contributions Reports
Added Dairy Diagnostics section
to the balance report
Added details about interpreting
the NMB reports (adapted from the
spear program manual) to the
NMB "About" page
In CCEC scenario list, display
description in addition to start date
and rotation list
Made clarifying changes to text
and hints throughout the CCEC
o Added more plain language to
hint for “Crop Yield Decrease”
o Clarified that additional
herbicide costs do not include
cover crop termination cost
o Added “Other” in front of
increased management costs
o Economics Report: Explained
short vs long term
o Changed “soil retention
benefit” to "erosion reduction
benefit" throughout
Made CCEC “Next” button more
prominent
Fixes
Fixed AU calculation and per-head
milk production calculations
Fixed bug causing form to close
upon submitting the initial NMB
form instead of transitioning directly
to the next wizard step
2019/11/20 Added Vermont NMP Land Base
Summary Report to meet VT state
LFO reporting standards.
CCEC in-place calculation added
to convert $/lb of nutrient for
fertilizer
Ability to indicate how many acres
receive manure in NMB.
Ability to record crop yield in
tons/ac or total tons in NMB.

12
NMB Graphical Interpretation
Report added with the ability to opt
in and share your data with others.
goCrop™ training webinars were held in December of 2018 and 2019 (30 participants).
Representative from NRCS, VACD, and Extension staff attended. The NMB tool was introduced
to 128 farmers during the 2018 and 2019 NMP classes. Due to its later release, the CCEC was
introduced to 45 farmers during the 2019 classes. NWCS will continue to introduce farmers to
these tools in subsequent classes and events. A handout was created to advertise the benefits of
using these tools (Appendix D).
One of the major challenges implementing this project was the prioritization of goCropTM updates
and the workload of the developer, Hobbs who also has to manage her time commitment to other
non-UVM projects. Currently, all programming is conducted by one person and the speed of
goCropTM updates can be limited by her finite time. Over the past two years, goCropTM has required
serious improvements to comply with new water regulations and to assist the diverse array of farms
in the state of VT (i.e. grazing, beef, vegetable, hops, etc.). The goCrop™ platform also needed
significant upgrades to allow goCrop™ accessibility from all types of mobile devices. The
workload of these non-CIG related goCropTM projects slowed the project but were necessary to
complete the tasks in the CIG grant. Nonetheless, the project and all deliverables were completed.
Valuable feedback was provided on goCrop™ and its associated analysis tools from farmers
enrolled in NMP classes. This feedback helped identify ways to reduce the burden of data entry
which will decrease the barriers to analysis tool use. See Appendix E for a map with participating
farms.

13
Discussion of quality assurance
This project was not a field-based project and as such there was not an experimental design,
sampling procedures, or samples to analyze. The data entered into goCropTM is stored remotely
on a secure server.
To account for impact of using the tools, we asked participating farmers the following questions:
1) Is this tool useful?
2) What have you gained from using the tool?
3) Has this tool changed your perspective? (In the case of the NMB where nutrients are
coming onto your farm and in the case of the CCEC, the value of cover crops.)
4) Will you make any management changes as a result?
The impacts of the project are shared in a success story (Appendix F) which was shared in early
2020 when officially announcing the release of the analysis tools on the NWCS Facebook page
and Twitter feed (Image 1). The success story can be viewed on the NWCS Soil Health and
Nutrient Management page: https://www.uvm.edu/extension/nwcrops/soil-health-and-nutrient-
management. The NWCS Facebook post was also shared by the Farmer’s Watershed Alliance
(FWA) and posted on their website as a blog: http://farmerswatershedalliance.org/?p=940 (Image 2).
Image 1. UVM NWCS Twitter feed showing the announcement of goCropTM’s new features release
with a link to the farmer success story.
Image 2. The FWA shares UVM NWCS Facebook post.

14
Findings
During the last two years more than 146 farmers have either developed or updated their nutrient
management plan, impacting more than 50,000 acres. According to 2019 post-NMP class survey
results (n=35), more than 80% said they would implement the nutrient recommendations
(application rates, timing, etc.) and land treatment recommendations (manure setbacks, cover
cropping, rotations, buffers, etc.) on 76% of their acres or more. Quite possibly as a result of
these behavior changes, 65% said they thought that the NMP would have a small, positive
impact on the quality of surface water.
Some farmers will realize fertilizer cost savings as a result of implementing their NMP. For
example, 9% of respondents indicated that they would decrease nitrogen application rates and
18% said they would decrease phosphorus rates. Conversely, cost savings may be realized with
higher yields as a result of adding adequate fertility. 20% of respondents said their NMP
recommended an increase in nitrogen rates and 15% would increase phosphorus rates. 57% of
respondents thought these changes in fertility applications will increase their crop yield.
However, whether these fertility application changes will result in increased profitability is split,
26% of respondents indicating that the NMP will save them money to grow crops and 29% of
respondents indicating that it would cost them more money to grow crops. Although farmers felt
the increased cost would result in higher yields.
Furthermore, the ability to import soil records in particular has greatly eased the burden of data
entry. This features saves the farmers and technical assistance staff time. Farmers also have
greater control over their data with the ability to export. Before the Land Base Summary Report
was available, exported spreadsheets have been used to fulfill state regulatory reporting
requirements. Exported data also gives farmers greater capabilities to observe trends over time.
The CCEC helped farmers understand the financial cost and benefit of cover crops. NWCS will
continue to introducing farmers to use the tool in order to encourage cover crop implementation
and strengthen the resolve of those cover cropping.
The original grant proposal included planning, formatting, and developing 6 new goCropTM
reports. A total of 12 reports have been created with CIG funds: 3 for NMP purposes, 5 for
NMB, and 4 for the CCEC (See Appendices G-R for sample reports). The NMB and CCEC are
fully functional and farmer-tested easy to use. See Appendix F for the impacts the analysis tools
had on farmers.

15
Conclusions and recommendations
This CIG grant funded made goCropTM easier to use, expanded its functionality, and increased the
number of reports available to farmers. These improvements made to goCropTM with funds from
this grant increase the likelihood of goCropTM recruiting and maintaining subscribers. In
particular, the ability to import data and the updated user-interface, will help farmers who use
goCropTM to write their NMPs. Farmers who create their NMPs are more invested in updating their
plans annual and keeping records of their farm management operations. When farmers implement
their NMP by applying the right rate at the right time, they are protecting water quality. When
farmers keep accurate records, they can make data-driven decisions and adjust their NMP
accordingly.
Especially with the negative publicity farmers are receiving as the public becomes more concerned
about the impacts that agricultural has on the environment, the NMB, CCEC, and new reports are
extremely help. These tools help farmers think about their management practices in novel ways
and will help them better communicate the success they are seeing on their farms to general public
and other farms.
There is room for improvement with this work, in particular, making it more accessible. As a
nutrient management planning tool, goCropTM was designed to be modifiable to meet other state
needs. As needed, NWCS can provide estimates to adapt goCropTM for specific state reporting
requirements. In the future, NWCS plans on making the analysis tools available for use without
the purchase of a yearly goCropTM subscription.

16
Appendix A. June 2017 Press Release.

17
Appendix B. NMB Input List
Contact Screen
Producer name, farm name, address, phone,
Farm information: balance year, Total Farm
acres, All tillable crop and pasture acres,
number of acres, perennial and annual with
>10% legume, acres receiving manure
Data collection by: name, e-mail
Watershed: primary, secondary
Animal information: milking and dry cows,
heifers: 1-2 year, heifers less than one year,
calves, bulls and steers, other livestock
Farm Crop Production
% legume (if applicable)
Acreage grown
Manure application (yes/no): for legume-
containing crops only
Nutrient Analysis on dry matter (DM)
basis: crude protein (CP), phosphorus (P),
and potassium (K)
Feed type or use: forage, grain, or bedding
Inventory, %DM entered as well if you
select as fed (AF)
Yield: tons/acre
Feed Purchased
Tons/yr
% DM, and CP, P and K values as a % of
DM
Feed type: grain, forage or TMR
% Forage
Inventories (wet tons)
Purchased Fertilizers
Tons/yr: that have been applied, do not
include inventories
%N, %P2O5, %K2O
Animals Purchased
Type (species)
Description
Number
Weight/head (lbs)
Miscellaneous Purchases
Tons/yr
% DM, and % N, P, and K as % DM
Milk Sold
Milk, lbs/year
Milk protein (%)
Animals Sold
Type
Description
Number
Weight/head (lbs)
Crops Sold
Tons/yr
% DM, and CP, P, and K as % DM
Forage Type: Grain, Forage, TMR
% Forage
Other Exports
Tons/yr
% solids
% wet N, P and K

18
Appendix C. CCEC Input List
General
Cost of N, P, K, and S from fertilizer ($/lb)
Cost of carbon ($/ton)
Cost of fertility lost to erosion (Recommended value suggested)
Cost of water quality damages (Recommended value suggested)
Field rotation
Per year in rotation
Average yields (ton/acre)
Cover crop seed cost ($/acre)
Termination cost ($/acre)
Other increased management costs, if applicable ($/acre)
Crop yield decrease or increase (ton/acre)
Other costs, if applicable ($/acre)
Reduction in N, P, and K purchased (lb/acre)
Reduction in herbicide insecticide and fungicide cost ($/acre and %)
Erosion reduction (ton/acre)
Erosion repair savings ($/acre)
Other benefits ($/acre)
Optional
Grazing costs and savings
Cover crop harvesting costs and savings

19
Appendix D. goCropTM Features Advertisement

20
Appendix E. Map with Participating Farms

21
Appendix F. Farmer Success Story
Farmers Respond to goCropTM Integrated Analysis Tools:
Cornell’s Whole Farm Nutrient Mass Balance Calculator
&
NRCS’s Cover Crop Economics Calculator
Introduction
With the passing of the Vermont Clean Water Bill (Act 64) in 2015, Vermont now has some of the strictest
water quality regulations in the nation. The Required Agricultural Practices, a legislative fulfillment of Act
64, require farmers to create nutrient management plans (NMPs) and keep records of their manure and
fertilizer applications. The purpose of NMPs is to help farmers grow crops and minimize the risk of nutrient
and soil loss to the environment. The development and maintenance of an NMP is complex and time
consuming. To help farmers meet this demand, goCropTM was developed under the direction of University
of Vermont Extension Agronomist Dr. Heather Darby. As a web-based tool, goCropTM provides a
comprehensive method to create NMPs and maintain records to meet state regulations. Farmer feedback
was solicited each step in the development process to produce an easy to use tool. As an agronomic tool
that helps farmers manage crops and soil, goCropTM already has high-use value to farmers. To add to the
capabilities of goCropTM, additional decision-making tools were added that help farmers quickly and
efficiently analyze where nutrients are going on their farm with the Whole Farm Mass Nutrient Balance
Calculator based on Cornell’s model, and to assess the monetary benefits of cover crops with the Cover
Crop Economics Calculator based on the Natural Resources Conservation Services (NRCS) spreadsheet.
Hosting multiple tools under one platform, makes goCropTM a convenient one stop location to write an
NMP cost-effectively and help farmers make data-driven decisions that promote economically and
environmentally sound practices. Farmers were excited to try goCropTM’s newly released features. What
follows are accounts of farmers experiences with these analysis tools.
Whole Farm Mass Nutrient Balance Calculator
Unlike the NMP, the Whole Farm Nutrient Mass Balance Calculator (NMB) looks at how nutrients move
onto and off the entire farm. The final reports show the balance and ratios of nutrients (nitrogen, phosphorus,
and potassium) in tons from farm-grown crops and from imported and exported feed, fertilizer applied,
bought or sold animals, amount of milk sold, and other agricultural goods. In the case of Vermont, this tool
can be used to assess if a farm is a net importer or exporter of nitrogen, phosphorus, and potassium. Farmers
can use this information to determine where nutrients like phosphorus are coming from onto their farm and
then can make decisions on how to reduce those nutrient imports. Conversely, reports may show a net
removal of nutrients from farm fields and the farmer can use this information to determine if more nutrients
should be added to the fields or rations to keep the farm system healthy.
Tim Magnant of Bridgeman View Farm was highly engaged in the process and not content to rely just on
his memory, he referred to his invoices to calculate the amount of grain and fertilizer he purchased. He
acknowledges that the information he gets out of the tool is only as good as the data he puts in it. After

22
using the goCrop™ NMB tool, Magnant was surprised to see that the majority of phosphorus actually came
onto his farm as feed, not fertilizer. Magnant stated, “It taught me things I wanted to know about how things
work. I never thought about grain and phosphorus in milk. I thought it was all about the fertilizer.” Geoff
Sweeney of Sweeney Farm and Olivia Reynolds of Crosswinds Dairy and Daughters also shared this
sentiment. Sweeney commented, “I had not thought of grain as an importer of phosphorus…after using this
tool, I talked to the feed guy about over mineralization of the animals. They just don’t need all of it.” After
viewing the reports, Reynolds also noted that not many nutrients are imported, but thought it was interesting
that the major importation of nitrogen was fertilizer and the major importation of phosphorus was feed.
Recognizing that feed is a main source of bringing phosphorus onto the farm and that dairy animals often
get more phosphorus than they need, can encourage farmers to source lower phosphorus feed options.
Farmers are willing to buy lower-phosphorus feed if it has similar quality and cost to the feed they currently
purchase. As a NMP tool, goCropTM helps farmers optimize nutrients from crops, which can lead to higher
yields and a reduction in imported feed.
Reynolds works with her NMP daily and uses it as a
way to understand field-by-field nutrient balances.
Reynolds appreciated that the NMB reports gave her
a whole farm perspective. Reynolds intuitively
knows the information displayed in the reports, but
seeing the numbers really make whole farm nutrient
cycling click. She saw in numbers what she was
experiencing on the farm. For example, about 30%
of the fields do not receive manure. The barrier
those fields face to receiving on-farm generated
nutrients is distance from the home farm pit. It takes
too much time and is not cost-effective to haul
manure that far. When examining the Annual Nutrient Balance Report from the goCrop™ tool, Reynolds
remarked that the only time nutrients leave the farm are when animals or milk are sold. After looking at the
Itemized Report, Reynolds saw that nutrients were most heavily applied on the corn fields in the beginning
of the season. She recognizes that this is not the best use of nutrients because there is a higher risk of run-
off in the spring and it is not at a time when the plants need it the most.
Although Reynolds found all reports informative, she was most surprised by the results in the Graphical
Interpretations Report. Crosswinds Dairy and Daughters fell in the operational zone optimal ranges where
nutrient balance and milk production are within feasible limits. She said, “I feel like we are doing our job.”
Although Magnant saw that he was a net exporter of phosphorus in the Annual Nutrient Balance Report,
seeing it illustrated in the Graphical Interpretation Report really made him excited. “Reports are nice
because we can see the results. We are doing a good job. This report isn’t for me, it’s for the naysayers…The
reports work in my favor because they show that the agronomics we are doing are working. It’s proof. We
are doing as good as we can do. This shows me we are doing pretty well.”
Image 1. Reynolds uses goCropTM’s analysis tools on
her laptop.

23
Cover Crop Economics Calculator
The benefits of cover crops are widely known.
They can increase organic matter, increase nutrient
availability to crops, and reduce erosion. As a
result, cover crops have the ability to protect water
quality, improve soil health, and increase cash crop
yield. Of course, they also have planting,
maintenance, and termination costs. The Cover
Crops Economics Calculator (CCEC) considers
these factors to assess if cover crops have a net
monetary gain or loss in a single season or
throughout the duration of an entire crop rotation.
The CCEC gave farmers an opportunity to understand the different values that cover crops bring to their
farm. For example, Magnant put in a value of $10/acre for the positive public relations cover crops provide
to his farm. For Beau Rainville of Larose Farm, the highest benefit of the cover crop to his farm is keeping
his soil on the field and hence, this prompted him to increase the recommended dollar value for fertility
loss due to erosion. However, Nick Manning of Manning Dairy ended up with a report showing that cover
crops were not cost-effective. This was due to the cost associated with an estimated yield drag associated
with planting short-day corn so that cover crops would establish well. The results in the report piqued
Manning’s interest in using the tool more to understand the cost-benefit analysis. Manning still plans on
planting cover crops because they still benefit his fields by curbing erosion and keeping topsoil in place.
For others, like Magnant and Mike Ferris of Ferris Farm, the reports showed the financial gains of cover
crops. Ferris said, “The Cover Crops Economics Calculator helped me realize the monetary value and
savings of planting cover crops.” Using the Cover Crops Economics Calculator only confirmed what
Magnant was seeing on the ground. “Reports show me that it makes me money, but I also know that my
system saves me money…I think planting cover crops is the right thing to do and this shows it,” shared
Magnant. He is realizing the benefits of his healthier soils. He attributes his good soil to the combination
of cover crops and no-till practices minimizing soil loss and increasing nutrient conservation and cycling.
In fact, he may not even apply starter fertilizer to his corn fields next year. The CCEC reports show that
there is an annual $2,000 benefit for the whole farm to planting cover crops. As Magnant says, “This is not
a big number, but as a farmer, can I really afford to throwaway $2,000?” Both Magnant and Ferris are
looking forward to using the tool to run scenarios to pinpoint the most cost effect cover crop system for
their 2020 cover cropping plan.
Summary
Farmers are always looking for ways to tweak their operations to make them more successful and cost-
effective. The new goCropTM analysis tools, Whole Farm Nutrient Mass Balance and Cover Crop
Economics Calculators, provide a modern way for farmers to assess total nutrient load of their farm and
realize the financial benefit of using cover crops. The Whole Farm Nutrient Mass Balance Calculator gives
farmers the information they need to identify the main source of phosphorus importation onto the farm and
adjust feeding or fertility practices that will minimize nutrient loading and maximize overall farm
productivity. For many farmers, the Cover Crops Economics Calculator can be used as a tool to justify the
good work they are already doing. By ascribing a monetary value to cover crops, farmers may be more
likely to expand acres under cover crops and espouse the good virtues of cover crops, encouraging other
farmers to plant more acres.
Image 2. Magnant uses goCropTM’s analysis tools on
his laptop.

24
To sign up for a free 30-day trial and try the new analysis tools visit: www.gocrop.com
For more information about goCropTM contact:
Heather Darby or Lindsey Ruhl
UVM Extension Northwest Crops and Soils Team
278 S. Main Street, Suite 2
St. Albans, Vermont 05478
(802) 524-6501

25
Appendix G. Sample NMP Report: Planned Manure Applications
26
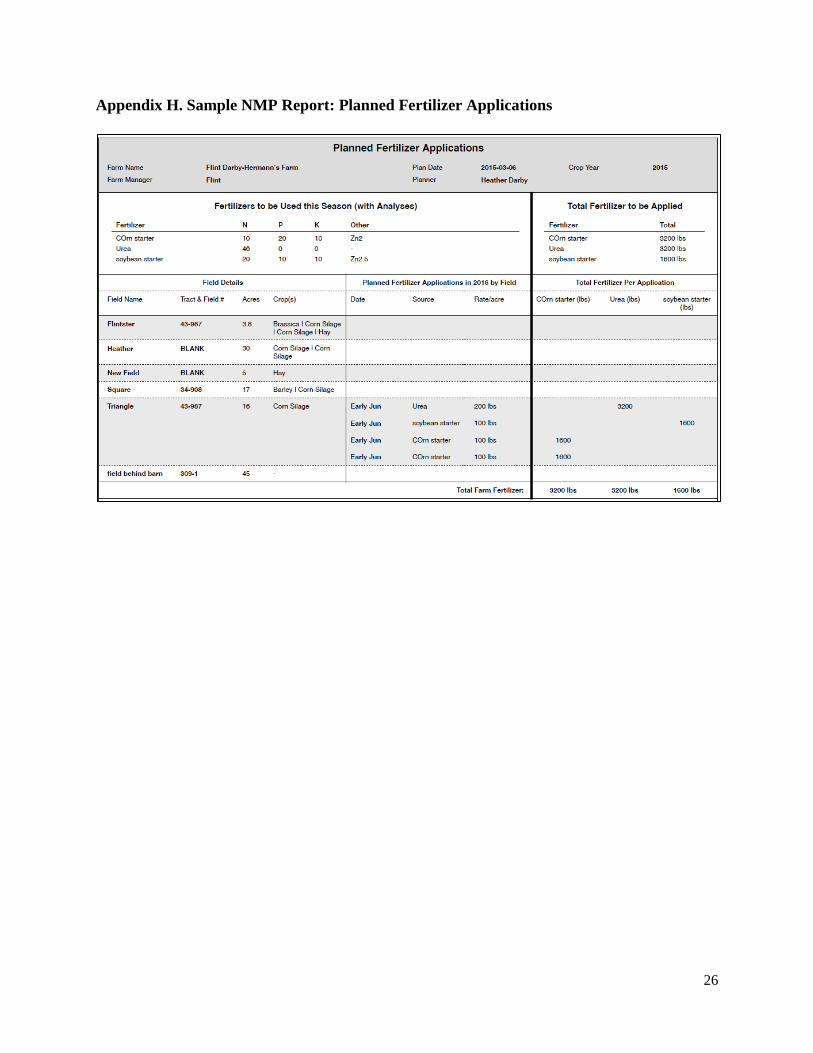
Appendix H. Sample NMP Report: Planned Fertilizer Applications

27
Appendix I. Sample NMP Report: Land Base Summary

28
Appendix J. Sample NMB Report: Annual Nutrient Balance

29
Appendix K. Sample NMB Report: Distribution of Nutrients

30
Appendix L. Sample NMB Report: Itemized Nutrient Imports and Exports (%)

31
Appendix M. Sample NMB Report: Itemized Nutrient Imports and Exports (lb/tillable acre)

32
Appendix N. Sample NMB Report: Graphical Interpretation

33
Appendix O. Sample CCEC Report: Short Term Summary

34
Appendix P. Sample CCEC Report: Economic Analysis

35
Appendix Q. Sample CCEC Report: Financial Analysis

36
Appendix R. Sample CCEC Report: Long Term Summary