project title mechanism of thermal runaway in · pdf fileproject title mechanism of thermal...
TRANSCRIPT

Project Title
MECHANISM OF THERMAL RUNAWAY IN VRLA BATTERIES AND METHODS TO SUPPRESS IT – PHASE II
FINAL TECHNICAL REPORT
BY
PROF. DETCHKO PAVLOV (PRINCIPAL INVESTIGATOR) FULL MEMBER OF THE BULGARIAN ACADEMY OF SCIENCES
(MARCH 2007)
UNITED STATES ARMY
EUROPEAN RESEARCH OFFICE OF THE U.S. ARMY
LONDON, ENGLAND
CONTRACT NUMBER: N62558-06-P-0070
CONTRACTOR: INSTITUTE OF ELECTROCHEMISTRY AND ENERGY SYSTEMS (IEES)
LEAD-ACID BATTERIES DEPARTMENT
Approved for Public Release; Distribution Unlimited

Report Documentation Page Form ApprovedOMB No. 0704-0188
Public reporting burden for the collection of information is estimated to average 1 hour per response, including the time for reviewing instructions, searching existing data sources, gathering andmaintaining the data needed, and completing and reviewing the collection of information. Send comments regarding this burden estimate or any other aspect of this collection of information,including suggestions for reducing this burden, to Washington Headquarters Services, Directorate for Information Operations and Reports, 1215 Jefferson Davis Highway, Suite 1204, ArlingtonVA 22202-4302. Respondents should be aware that notwithstanding any other provision of law, no person shall be subject to a penalty for failing to comply with a collection of information if itdoes not display a currently valid OMB control number.
1. REPORT DATE MAR 2007
2. REPORT TYPE N/A
3. DATES COVERED -
4. TITLE AND SUBTITLE MECHANISM OF THERMAL RUNAWAY IN VRLA BATTERIESAND METHODS TO SUPPRESS IT PHASE II
5a. CONTRACT NUMBER
5b. GRANT NUMBER
5c. PROGRAM ELEMENT NUMBER
6. AUTHOR(S) 5d. PROJECT NUMBER
5e. TASK NUMBER
5f. WORK UNIT NUMBER
7. PERFORMING ORGANIZATION NAME(S) AND ADDRESS(ES) UNITED STATES ARMY EUROPEAN RESEARCH OFFICE OF THEU.S. ARMY LONDON, ENGLAND
8. PERFORMING ORGANIZATIONREPORT NUMBER
9. SPONSORING/MONITORING AGENCY NAME(S) AND ADDRESS(ES) 10. SPONSOR/MONITOR’S ACRONYM(S)
11. SPONSOR/MONITOR’S REPORT NUMBER(S)
12. DISTRIBUTION/AVAILABILITY STATEMENT Approved for public release, distribution unlimited
13. SUPPLEMENTARY NOTES The original document contains color images.
14. ABSTRACT
15. SUBJECT TERMS
16. SECURITY CLASSIFICATION OF: 17. LIMITATION OF ABSTRACT
SAR
18. NUMBEROF PAGES
23
19a. NAME OFRESPONSIBLE PERSON
a. REPORT unclassified
b. ABSTRACT unclassified
c. THIS PAGE unclassified
Standard Form 298 (Rev. 8-98) Prescribed by ANSI Std Z39-18

2
TABLE OF CONTENTS Page ABSTRACT 3 INTRODUCTION 4 EXPERIMENTAL SET-UP 5 EXPERIMENTAL RESULTS AND DISCUSSION 6
1. Cycling test at U = 2.60 V 6
1.1. Characteristic profiles of cell current, temperature and potential 6
for a single polarization pulse
1.2. Influence of separator type and thickness 8
2. Step-wise constant voltage polarization 13
3. Transition between polarized and depolarized state of negative plate 23
at constant current polarization
4. Galvanostatic pyramidal polarization: determination of b 26
5. Self heating 28
6. Initiation of TRA at high saturation levels 29
7. Influence of separator type on cycle life of recombinating cells
with operative oxygen cycle 34
CONCLUSIONS 41 LITERATURE CITED 43

3
ABSTRACT The aim of this project is to elucidate the mechanism of thermal runaway in VRLA
batteries and especially the eventual role of the AGM separator. The oxygen evolution
(OER) and oxygen recombination reactions (ORR) proceed in the cells, and the only
work done by the input power is to transfer water from anode to cathode through these
reactions, the remaining energy being dissipated as heat. The heat generators in the
cell are the electrochemical reactions through their activation overpotentials, the
exothermic chemical reactions and the exothermicity of ORR plus Joule Ohmic
heating in electrolyte and solid phases. We have shown that, within the range of
currents used (up to 1C), the major contribution comes from electrochemical
reactions. The cell temperature is at most in a first order dependence of recombinant
current. The OER at constant applied voltage and fixed ambient temperature is
accelerated by the rise of internal cell temperature and overpotential, as the negative
plate is depolarized by ORR due to enhanced separator permeability for oxygen flow
by electrolyte displacement and/or drying and negative plate local desaturation. If the
negative plate potential is stabilized at Pb/PbSO4 potential and cannot be shifted by
any current applied, the cell behaviour is controlled solely by OER reaction. Thus, a
lower applied voltage is enough to produce a current sufficient to generate conditions
for thermal runaway.
The range of overall active block saturations for stable behaviour is somewhere
between 92% (where efficient recombination is possible) and 83-80% (where thermal
runaway occurs immediately).
Modification of AGM separators (i.e. MAGM) could improve recombination and water
retention at high saturations >92%, while for low saturations the newly developed
modification MAGM II shows additionally a very promising effect of suppressing
thermal runaway phenomena even at saturations below 80%. In MAGM II cells the
thermal runaway excursion to boiling is moved beyond the positive grid corrosion
failure point.
The results obtained in this study suggest strongly that by modification of separator
properties it is possible to achieve better thermal control, in concert with other cell
design improvements, plus the usual external measures as power input management
and passive/active cooling.

4
INTRODUCTION In order to be able to control a given phenomenon it is of utmost importance to
disclose the mechanism(s) of its action and of the processes involved. In the case of
valve-regulated lead-acid batteries (VRLAB) a very important factor is the saturation of
battery cells with electrolyte. The degree of electrolyte saturation is responsible for the
proportion between the gas channels along which oxygen flows and liquid
(hydrophilic) channels along which the flows of H+ and SO42- ions, and water move
between the two types of plates in the cell. The processes of oxygen reduction
proceed at the negative (lead) plates and these are exothermic processes. In the first
phase of the TRA project (contract number: N62558-03-M-0805), it was established
that reduction of oxygen and its recombination to water might proceed through a
combination of electrochemical and chemical reactions [1-5]. These reactions take
place at the negative plates. As these are exothermic reactions, the temperature in the
cell rises and may reach values beyond the temperature range of normal battery
operation, which will shorten battery cycle life. It was established further that the
reactions at the two types of plates (electrodes) might get into a self-accelerating
interrelation. This interrelation results in rapid increase of cell current (i.e. of the rate of
the electrochemical reactions) and of cell temperature to values that may lead to
battery failure or impair substantially the performance of the battery. This phenomenon
is called “thermal runaway” (TRA).
In the previous reporting period (2nd Interim Report) we have established that TRA
occurs when the electrolyte saturation in the cell falls down below 80% [6,7]. The
major volume of electrolyte is absorbed in the AGM separator. Hence, the latter’s
properties, pore distribution by radius and thickness, will exert a strong influence on
the occurrence of the TRA phenomenon during VRLAB operation.
In the last reporting period we investigated the influence of separator type and
thickness on VRLAB operation. AGM separator supplied by Hollingsworth & Vose
(USA) and modified AGM separator (MAGM) were used for these investigations.
MAGM was produced employing a technology developed by the team of the Lead-
Acid Batteries Department at the Institute of Electrochemistry and Energy Systems
(IEES) of the Bulgarian Academy of Sciences (US Patent: 6,509,118 B1 [8]).
Cells were assembled with AGM and MAGM separators of two different thicknesses. It
has been established that separator type affects the occurrence of TRA. In an attempt

5
to facilitate manifestation of this effect, the polymer emulsion originally used for
separator modification (MAGM) was substituted with a new one with different formula
(MAGM II). Initial tests and investigations of the thermal phenomena in cells with
MAGM II separators were performed and the results obtained are most encouraging.
EXPERIMENTAL SET-UP All experiments were performed with 4 Ah test cells comprising two positive and three
negative plates. Two types of separators were used: absorptive glass mat (AGM) and
modified absorptive glass mat (MAGM) separators. The thickness of the separators
was also varied. Four test cells were assembled: two cells with AGM separator - one
with 3 mm thickness of the separator and one with 4.8 mm, respectively; and two cells
with MAGM separator – again one with 3 mm and one with 4.8 mm separator
thickness. The thicker separator comprised two sheets of 2.4 mm AGM or MAGM
separator attached to one another. For the sake of simplicity we will refer to the four
cells as AGM3, AGM2x2.4, MAGM3 and MAGM2x2.4. The separator sheets were
placed both between the positive and negative plates, and between the box walls and
the outermost negative plates in order to prevent free oxygen access directly to the
bare negative plate surface and subsequent fast oxygen reduction, as well as dry-out
of the outer negative plates. All experiments were carried out at room temperature.
The equipment used was:
• Bitrode SCN 10-5 test modules used to maintain constant current or constant
voltage in the model cells;
• Ag/Ag2SO4 reference electrode designed in this laboratory;
• 16-channel computerized data acquisition system;
• Thermocouples mounted on the cell walls;
• Computerized gassing rate monitoring (GRM) system (own design).
Cell current (I), voltage (U), positive and negative plate potentials (ϕ+ and ϕ−)
temperature (T) and released gas (in terms of number of gas bubbles per unit time,
dN/dt), were monitored during the experiments.
6
EXPERIMENTAL RESULTS AND DISCUSSION
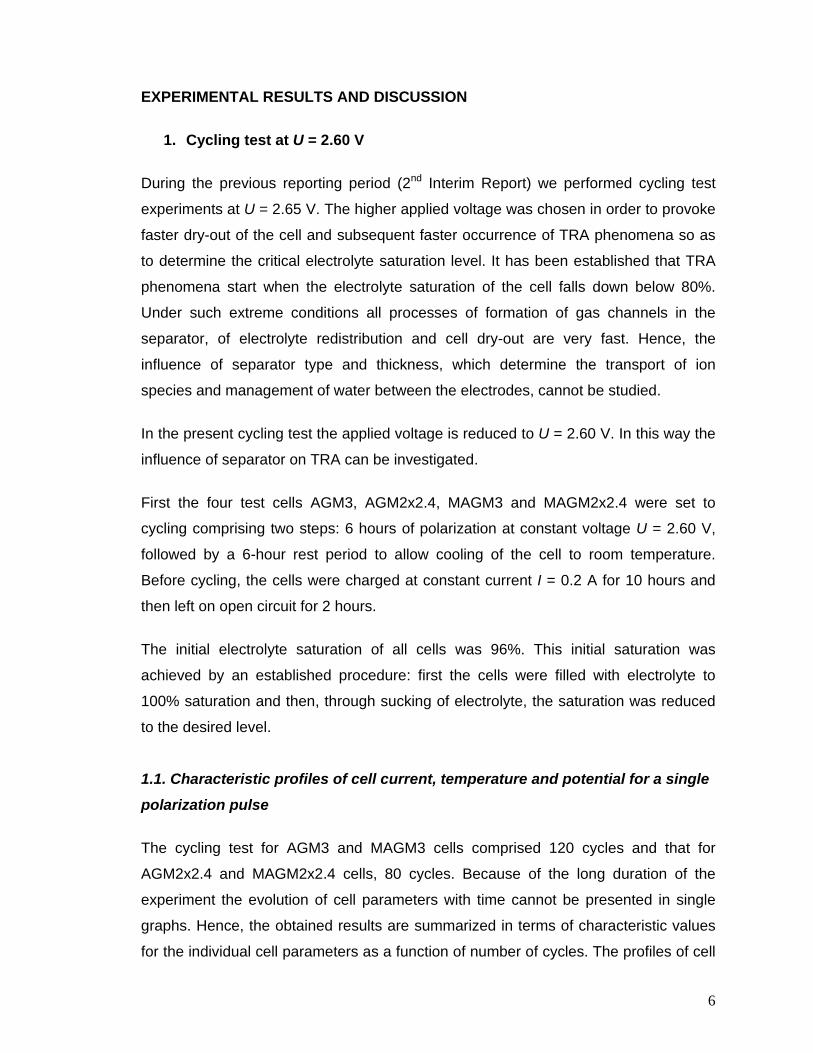
1. Cycling test at U = 2.60 V During the previous reporting period (2nd Interim Report) we performed cycling test
experiments at U = 2.65 V. The higher applied voltage was chosen in order to provoke
faster dry-out of the cell and subsequent faster occurrence of TRA phenomena so as
to determine the critical electrolyte saturation level. It has been established that TRA
phenomena start when the electrolyte saturation of the cell falls down below 80%.
Under such extreme conditions all processes of formation of gas channels in the
separator, of electrolyte redistribution and cell dry-out are very fast. Hence, the
influence of separator type and thickness, which determine the transport of ion
species and management of water between the electrodes, cannot be studied.
In the present cycling test the applied voltage is reduced to U = 2.60 V. In this way the
influence of separator on TRA can be investigated.
First the four test cells AGM3, AGM2x2.4, MAGM3 and MAGM2x2.4 were set to
cycling comprising two steps: 6 hours of polarization at constant voltage U = 2.60 V,
followed by a 6-hour rest period to allow cooling of the cell to room temperature.
Before cycling, the cells were charged at constant current I = 0.2 A for 10 hours and
then left on open circuit for 2 hours.
The initial electrolyte saturation of all cells was 96%. This initial saturation was
achieved by an established procedure: first the cells were filled with electrolyte to
100% saturation and then, through sucking of electrolyte, the saturation was reduced
to the desired level.
1.1. Characteristic profiles of cell current, temperature and potential for a single
polarization pulse The cycling test for AGM3 and MAGM3 cells comprised 120 cycles and that for
AGM2x2.4 and MAGM2x2.4 cells, 80 cycles. Because of the long duration of the
experiment the evolution of cell parameters with time cannot be presented in single
graphs. Hence, the obtained results are summarized in terms of characteristic values
for the individual cell parameters as a function of number of cycles. The profiles of cell

7
current, temperature and plate potentials during a single polarization pulse are
presented in Fig. 1.
1.1
1.2
1.3
1.4
time
Posi
tive
plat
e po
tent
ial
-1.3
-1.2
-1.1
-1
Neg
ativ
e pl
ate
pote
ntia
l
maximum
quasi-stationary value
OC relaxation
minimum
ϕ+
ϕ−
ϕ+
ϕ−
0time
Cur
rent
22
Tem
pera
ture
I max
quasi-stationary values
T max
OC relaxation
Fig. 1. Characteristic profiles of I, T, ϕ+ and ϕ− during single polarization step followed by open circuit relaxation.
Figure 1a shows that on switching polarization on the cell current passes through a
maximum first and then decreases reaching a quasi-stationary value at the end of the
polarization step. Peak sharpness and time for establishing steady-state regime vary
during the experiment.
The cell temperature also passes through a maximum, which is broader and flatter
than that for I, and at the end of polarization the temperature goes to quasi-stationary
value (see Fig.1a). Both current and temperature maximums can be attributed to
some structural changes in the cell related to the formation of gas channels in the
separator facilitating oxygen transport between the plates. After this period the closed
oxygen cycle (COC) is operative. In this experiment temperature variations are small
because the generated cell current is very low (see Fig. 3 in Section 1.2.). During the
open circuit (OC) period, T relaxes to room temperature. From the relaxation curve the
thermal capacity and convective heat transfer coefficient can be evaluated.
Figure 1b presents the characteristic profiles of positive and negative plate potential
pulses. Both potentials pass through maximums, then through minimums and reach
stationary values thereafter. In the beginning of polarization the first two reactions that
proceed at the negative plate are reduction of residual PbSO4 to Pb and evolution of
H2. The maximum in ϕ− is a result of the former reaction. After certain time, PbSO4 is
reduced and O2 reaches the negative plate, hence ϕ− does not increase further. The
potential minimum and the quasi-stationary value of ϕ− are determined by the
competition between the oxygen and hydrogen reactions. Initially, the hydrogen

8
reaction is predominant. With time of polarization the amount of oxygen that reaches
the negative plate increases and O2 reduction becomes determining for the potential
value: ϕ− goes to less negative values.
As temperature variations in this experiment are very small (up to 5-10oC, see next
chapter) the positive plate potential profile is determined entirely by the negative one.
Both potentials are interrelated through the applied constant voltage.
For interpretation of the experimental data from the cycling test we will discuss the
evolution of the quasi-stationary values of the cell parameters with number of cycles in
the next chapter.
1.2. Influence of separator type and thickness
All cells lost water during the experiments. The changes in electrolyte saturation vs.
number of cycles are presented in Fig. 2.
87
88
89
90
91
92
93
94
95
96
97
0 20 40 60 80cyN
sat%
MAGM2x2.4 AGM2x2.4
MAGM3 AGM3
Fig. 2. Changes of cell saturation during cycling test experiment
The initial saturation of the cells was 96%. Judging by the saturation vs. cycle number
curves two stages in cell behaviour can be distinguished: non-stationary one and
stationary one. During the stationary stage the saturation of the cells with electrolyte
does not depend on separator thickness. The stationary saturation level for both AGM
cells is reached after 54 cycles and for both MAGM cells after 63 cycles. The
corresponding stationary saturation levels are 88.3% for AGM cells and 90.2% for
MAGM cells, respectively. The cells with MAGM separator lost less water compared to

9
cells with AGM separator. This was due to the facilitated transport of oxygen through
the MAGM separator due to the latter’s hydrophobic channels. Hence, cells with this
type of separator start to operate in regime of recombination at higher saturations.
This was also demonstrated during the non-stationary stage of water loss, in which
MAGM cells lost less water and retained higher saturation levels than AGM cells.
MAGM3 cell had the highest recombination rate and it maintained the highest
saturation level during the non-stationary period.
Figure 3 presents the changes in stationary values of cell current, Ist vs. number of
cycles for the four test cells. At the beginning of the cycling test Ist for AGM3 cell is
0.08 A (Fig. 3a). Between 15th and 30th cycles the cell undergoes a transition period
and Ist increases to 0.2 A. This transition period is in correlation with the cell dry-out.
Electrolyte saturation decreases below 90% and more gas channels for oxygen
transportation between the electrodes are formed. Figure 4a shows that the greater
amount of O2 that reaches the negative plate causes the negative plate potential ϕ− to
shift towards less negative values: ϕ− changes from –1.29 V to –1.21 V. Due to the
interrelation between ϕ− and ϕ+ through the applied voltage the positive plate potential
increases from 1.31 V to 1.39 V (Fig. 4b). The latter leads to enhanced oxygen
evolution and subsequent cell current increase. After this transition period the
electrolyte saturation of the cell remains constant but Ist creeps up smoothly to the end
of the experiment reaching 0.3 A.
Figure 3a indicates a slightly different behaviour of MAGM3 cell. In general, of the
cells with 3 mm thick separators the one with MAGM separator sustains higher current
(0.6 A). This is due to the fact that MAGM separator allows faster formation of gas
channels, even at higher electrolyte saturations, due to its special processing
(modification). Hence, MAGM3 cell operates in regime of higher oxygen recombination
at any saturation level compared to AGM3 cell. This finding is clearly demonstrated by
the potential curves in Figs. 4a and 4b. Throughout the cycling test, the negative
electrode of MAGM3 cell is more depolarized than that of AGM3 cell. In the case of
MAGM3 cell, ϕ− = -1.21 V at the beginning of the experiment and it goes to –1.14 V
with cell dry-out. This difference between AGM3 and MAGM3 cells is more
pronounced at higher saturations. The smooth decrease of Ist of MAGM3 cell up to the
50th cycle correlates with the decrease of ambient temperature (Fig. 5).

10
0
0.1
0.2
0.3
0.4
0.5
0.6
0.7
0.8
0.9
0 10 20 30 40 50 60 70 80 90 100 110 120 130
CyN
Ist,
A
88
90
92
94
96
98
100
sat
,%
AGM3 Ist MAGM3 IstAGM3 sat% MAGM3 sat%
0
0.02
0.04
0.06
0.08
0.1
0.12
0.14
0.16
0.18
0.2
0 5 10 15 20 25 30 35 40 45 50 55 60 65 70 75 80
CyN
I, A
88
89
90
91
92
93
94
95
96
97
98
sat%
MAGM2x2.4 Ist AGM2x2.4 IstMAGM2x2.4 sat% AGM2x2.4 sat%
Fig. 3. Changes of cell current and saturation with number of cycles: a) AGM3 and MAGM3 cells; b) AGM2x2.4 and MAGM2x2.4 cells

11
-1.3
-1.28
-1.26
-1.24
-1.22
-1.2
-1.18
-1.16
-1.14
-1.12
-1.1
0 10 20 30 40 50 60 70 80 90 100 110 120CyN
ϕ-, V
AGM2x2.4 AGM3MAGM2x2.4 MAGM3
a)
1.3
1.32
1.34
1.36
1.38
1.4
1.42
1.44
1.46
1.48
1.5
0 10 20 30 40 50 60 70 80 90 100 110 120CyN
ϕ+ , V
AGM2x2.4 AGM3MAGM2x2.4 MAGM3
b)
Fig. 4. Changes of negative and positive plate potentials with number of cycles

12
On grounds of the data in Figs. 3a and 4 the following conclusions can be drawn for
the influence of separator type on the performance of AGM3 and MAGM3 cells:
During COC operation MAGM3 cell has more depolarized negative plate than AGM3
cell. It corresponds to higher polarization of the positive plate and higher rate of
oxygen evolution in MAGM3 cell. Hence, MAGM3 cell operates at higher current
compared to AGM3 cell (Fig. 3a). As COC is more efficient in cells with MAGM
separator the water loss of MAGM3 cell will be lower than that of AGM3 cell and the
cell with MAGM separator will sustain higher saturation level.
Let us now look at the behavior of the cells with thicker separator. During the first 40
cycles the current of both AGM2x2.4 and MAGM2x2.4 cells is around 0.05 A (Fig. 3b).
This current is an order of magnitude lower than that of MAGM3 cell. After 40th cycle, I
of AGM2x2.4 cell starts to increase and reaches a stationary value of 0.15 A during
65th cycle. It is interesting to note that I of MAGM2x2.4 cell stays very low and almost
constant for all 80 cycles of the test (Fig. 3b). If we compare this behavior with the
changes in electrolyte saturation it can be seen that for AGM2x2.4 cell when the
saturation level falls below 90% more channels for transport of O2 between the
electrodes are open, which accelerates the oxygen reduction rate and I increases.
Figure 3b evidences that the changes of saturation between 96% and 90.5% for
MAGM2x2.4 cell do not affect the cell current. During the first 20 cycles the negative
plate potentials of both AGM2x2.4 and MAGM2x2.4 cells are very close (around -1.27;
-1.28 V). Then ϕ- of AGM2x2.4 cell starts to decrease and reaches -1.18 V at 60th
cycle. This change in negative plate potential is related to the increase of cell current
from 0.06 A to 0.15 A. The negative plate of MAGM2x2.4 cell also depolarized
between cycles 40 and 60, but the change of ϕ- is only 40 mV in this case, which has
but insignificant influence on cell current (Fig. 4a).
The above results indicate that AGM2x2.4 cell is very sensitive to changes in
electrolyte saturation, especially for saturations lower than 90%. Below that saturation
level a substantial depolarization of the negative plate occurs, which leads to an
increase of positive plate potential and to three-fold increase in cell current.
The changes in saturation between 96% and 90% do not affect the electrochemical
behavior of the two cells with MAGM separator (MAGM3 and MAGM2x2.4). This

13
difference between the cells with MAGM and AGM separators is due to the specific
treatment of MAGM separator that changes the surface properties of its fibers.
Figure 5 presents the changes in temperature difference between cell and ambient
temperatures (T-Ta) during the experiment. The ambient temperature is also given in
the Figure. The temperature differences for the cells with thick separators are not
presented because they are less than 2oC due to the very low current values. The
heat generation for AGM2x2.4 and MAGM2x2.4 cells is negligible. It is seen from the
graphs that (T-Ta) for cells with 3mm thick separator follows the respective cell current
behavior and is a direct consequence of I.
0
5
10
15
20
25
30
0 10 20 30 40 50 60 70 80 90 100 110 120
CyN
T-Ta
, o C
Ambient temperature
MAGM3
AGM3
Fig. 5. Changes of T – Ta and ambient temperature with number of cycles.
2. Step-wise constant voltage polarization Figure 3 shows that at the end of the cycling test at U = 2.60 V the currents of all four
cells reach stationary values. Hence, every cell has a characteristic current for the
reached stationary saturation values and applied voltage 2.60 V. Table 1 summarizes
the final stationary saturation levels and cell currents for the four cells under test. The
question is what will be the behavior of the cells at the same saturations but at lower
applied voltages?

14
Table 1. Saturation levels and cell currents at the end of the cycling test at U = 2.60 V
AGM3 MAGM3 AGM2x2.4 MAGM2x2.4
Saturation 88.6% 90% 88.1% 90.4%
Ist, A 0.3 0.45 0.15 0.05
The following experiment was set up: first the cells were set to constant voltage
polarization at U = 2.60 V for 16h; then the voltage was changed stepwise (by 0.05 V
per step) to U = 2.35 V. The duration of each step was 8 h. The experiment was
repeated twice for the sake of consistency. The variations of cell current, positive and
negative plate potentials with time were monitored.
Figure 6 shows the changes in cell current with time for AGM3 and MAGM3 cells.
When AGM3 cell is polarized at U = 2.60 V, its current I passes through an initial
maximum, followed by a minimum at 0.15 A and starts to increase thereafter reaching
0.34 A after 16 h of polarization. At U = 2.60 V, the current of MAGM3 cell reaches its
stationary value of 0.45 A. With decreasing the polarization voltage the current of both
cells decreases. For both cells I cannot reach quasi-stationary value within the time of
polarization and the experiment demonstrates very long current relaxation times, τ.
The possible reasons for these long relaxation times are impeded transport of O2
through the separator, diffusion through the thin liquid film adjacent to the electrode
surface or adsorption relaxation time. The first two reasons are hardly possible. At the
saturation levels of this experiment (Table 1), gas penetration channels for O2
transport between the electrodes are easy to form. The characteristic time for this
process is around 1 to 3 hours depending on the saturation. The characteristic time for
diffusion of O2 molecules through 100 μm thick film is of the order of 10-5 s. Therefore,
the only possible reason for relaxation time of the order of 20 h is barrier limited
adsorption. The problem of long relaxation time needs further investigations.

15
0
0.05
0.1
0.15
0.2
0.25
0.3
0.35
0.4
0 8 16 24 32 40 48 56 64 72 80 88 96 104
time, h
I, A
2.3
2.35
2.4
2.45
2.5
2.55
2.6
2.65
U, V
AGM3a)
I
MAGM3
0
0.1
0.2
0.3
0.4
0.5
0.6
0.7
0 8 16 24 32 40 48 56 64 72 80 88 96 104
time, h
I, A
2.3
2.35
2.4
2.45
2.5
2.55
2.6
2.65
U, V
I
b)
Fig. 6. Cell current during step-wise constant voltage polarization: a) AGM3 cell;
b) MAGM3 cell
Figure 7 shows the changes in positive and negative plate potentials for AGM3 and
MAGM3 cells during the stepwise constant voltage polarization experiment.

16
1.1
1.15
1.2
1.25
1.3
1.35
1.4
1.45
0 8 16 24 32 40 48 56 64 72 80 88 96 104
time, h
ϕ+,V
-1.3
-1.25
-1.2
-1.15
-1.1
-1.05
-1
-0.95
ϕ-,V
ϕ+
ϕ−
AGM3
a)
1.15
1.2
1.25
1.3
1.35
1.4
1.45
1.5
0 8 16 24 32 40 48 56 64 72 80 88 96 104time, h
ϕ+,V
-1.25
-1.2
-1.15
-1.1
-1.05
-1
-0.95
-0.9
ϕ−, V
ϕ+
ϕ−
MAGM3
b)
Fig. 7. Positive and negative plate potentials during step-wise constant voltage
polarization: a) AGM3 cell; b) MAGM3 cell.
At U = 2.60 V, both electrodes are polarized in both cells (ϕ+ ≈ 1.40 V and ϕ− ≈ -1.20 V
for AGM3 cell and ϕ+ ≈ 1.45 V and ϕ− ≈ -1.15 V for MAGM3 cell, respectively). During
the period of current increase the positive electrodes polarize while the negative ones

17
depolarize. During the subsequent stepwise decrease of U down to 2.35 V, the
behavior of ϕ+ and ϕ− of both AGM3 and MAGM3 cells is similar:
(a) AGM3 cell: at applied voltages from 2.60 V to 2.40 V, ϕ+ decreases slightly from
1.42 V to 1.38 V. The changes of U affect only ϕ−, i.e. the negative electrode
depolarizes stepwise. The negative plate potential changes by 160 mV and
reaches values of –1.030 V at U = 2.40 V. The stationary potential of the negative
plate is within the range from –1.010 V to –1.03V. When this potential is reached,
further changes in applied voltage (U ≤ 2.40 V) affect positive plate potential, which
changes step-wise by approximately 50 mV. Hence, U = 2.40 V appears to be a
critical applied voltage. When U > 2.40 V, the positive electrode is the potential
determining one with constant polarization and the changes in U affect only ϕ−. On
the contrary, for U ≤ 2.40 V, the negative electrode is the potential determining one
and only ϕ+ changes with U.
(b) MAGM3 cell: U = 2.40 V is a critical applied voltage for this cell, too. The stationary
potential of the negative plate is –1.020 V and is more pronounced. Hence, U =
2.40 V appears to be a critical transition voltage, which most probably plays an
important role for the cell behaviour. Elucidation of this phenomena requires further
experimental investigations.
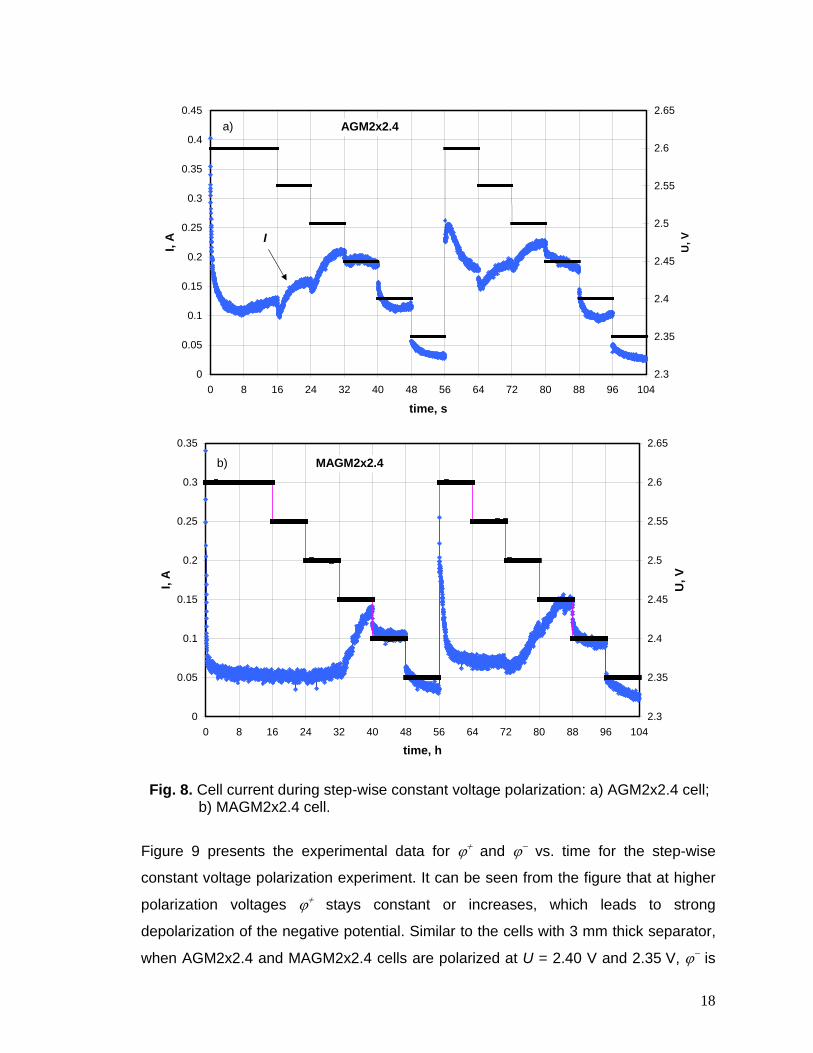
Figures 8 and 9 present the experimental data for I, U, ϕ+, and ϕ− for cells with thick
separators (AGM2x2.4 and MAGM2x2.4). On changing the polarization voltage the
cells with 4.8 mm thick separator have completely different behavior from the cells
with 3 mm thick separator. Like the cells with 3 mm separator, when polarized at
2.60 V the currents of AGM2x2.4 and MAGM2x2.4 cells have stationary values, Ist.
However, in contrast to the cells with thinner separator, here there is a region of
applied voltages for which I increases with decrease of polarization voltage for both
AGM and MAGM cells. For AGM2x2.4 cell, the current passes through a maximum at
U = 2.50 V and then decreases with further decrease of U. The data for MAGM2x2.4
cell presented in Fig. 8b show that I stays constant (I = 0.06 A) for applied voltages
from 2.60 V to 2.50 V. With further decrease of U to 2.45 V, I starts to increase,
passes through a maximum and then decreases with lower applied voltages. During
the second run of the step-wise constant voltage polarization the current increase
starts at higher polarization voltage U = 2.50 V.
18
0
0.05
0.1
0.15
0.2
0.25
0.3
0.35
0.4
0.45
0 8 16 24 32 40 48 56 64 72 80 88 96 104
time, s
I, A
2.3
2.35
2.4
2.45
2.5
2.55
2.6
2.65
U, V
AGM2x2.4
I
a)
0
0.05
0.1
0.15
0.2
0.25
0.3
0.35
0 8 16 24 32 40 48 56 64 72 80 88 96 104
time, h
I, A
2.3
2.35
2.4
2.45
2.5
2.55
2.6
2.65
U, V
MAGM2x2.4 b)
Fig. 8. Cell current during step-wise constant voltage polarization: a) AGM2x2.4 cell;
b) MAGM2x2.4 cell.
Figure 9 presents the experimental data for ϕ+ and ϕ− vs. time for the step-wise
constant voltage polarization experiment. It can be seen from the figure that at higher
polarization voltages ϕ+ stays constant or increases, which leads to strong
depolarization of the negative potential. Similar to the cells with 3 mm thick separator,
when AGM2x2.4 and MAGM2x2.4 cells are polarized at U = 2.40 V and 2.35 V, ϕ− is

19
closer to the OC potential of Pb electrode and subsequent changes of U affect only ϕ+.
Hence, for cells with thick separators U = 2.40 V is a critical transition voltage at which
the negative electrode becomes independent and the changes in applied voltage
affect the polarization of the positive plate only. A comparison between the data in
Figs. 7 and 9 evidences that the critical transition voltage U = 2.40 V does not depend
on separator type and thickness.
1.1
1.15
1.2
1.25
1.3
1.35
1.4
1.45
0 8 16 24 32 40 48 56 64 72 80 88 96 104
time, h
ϕ+ , V
-1.3
-1.25
-1.2
-1.15
-1.1
-1.05
-1
-0.95
ϕ− , V
AGM2x2.4
ϕ−
ϕ+
a)
1.1
1.15
1.2
1.25
1.3
1.35
1.4
1.45
0 8 16 24 32 40 48 56 64 72 80 88 96 104
time, h
ϕ+, V
-1.3
-1.25
-1.2
-1.15
-1.1
-1.05
-1
-0.95
ϕ-, V
MAGM2x2.4
ϕ+
ϕ−
b)
Fig. 9. Positive and negative plate potentials during step-wise constant voltage
polarization: a) AGM2x2.4 cell; b) MAGM2x2.4 cell

20
It follows from the above discussion that evolution of the negative plate passes
through two stages during oxygen cycle operation: a) stationary or depolarized stage,
when ϕ− ≈ -1.020 V, and b) polarized stage when ϕ− > ⏐-1.020 V⏐.
It can be seen from the data in Fig. 8 that, for given periods of time when polarization
voltage decreases the cell current increases. In an attempt to explain this behavior we
have plotted the quasi-stationary values of ϕst+ and ϕst
− vs. I (Figs. 10 and 11). For the
polarization steps at which I does not reach stationary value we have taken the I value
at the end of polarization.
ϕ+ = 0.0892Log(I ) + const
1.3
1.32
1.34
1.36
1.38
1.4
1.42
1.44
1.46
1.48
0.01 0.1 1
I,A
ϕ+,
V
AGM3 MAGM3AGM2x2.4 MAGM2x2.4
Fig. 10. Positive plate potential as a function of cell current during step-wise constant voltage polarization.
As expected, Fig. 10 shows that the positive plate potentials of all four cells obey the
Tafel equation and do not depend on separator thickness or type:
ϕ + = 0.0892 log(I) + const (1)
The slope is 89.2 mV per decade, which corresponds to the value for oxygen evolution
reaction. At the positive plate only the electrochemical reaction of oxygen evolution
proceeds. For a given polarization voltage the negative plate potential determines the

21
value of the positive plate potential, which settles the cell current following Tafel
equation (1).
Figure 11 presents the obtained I vs. ϕst
− curves for the four cells under test and the
two subsequent step-wise voltage series.
0
0.1
0.2
0.3
0.4
0.5
0.6
-1.35 -1.3 -1.25 -1.2 -1.15 -1.1 -1.05 -1 -0.95
ϕ-, V
I, A
AGM2x2.4MAGM2x2.4AGM3MAGM3
higher recombination
Fig. 11. Cell current vs. negative plate potential during step-wise constant voltage polarization.
The following conclusions can be drawn from the graphs:
a) For the cells with thicker separator the dependence of I on ϕst− for both step-
wise voltage series are very close, which means that within the 8 hours of
polarization the processes at the negative plate reach stationary state. This is
not the case with the thinner separator cells. There are two I vs. ϕst− curves for
the AGM3 cell. Up to -1.1 V, the two curves are very close, but at more
negative ϕst− values the difference becomes wider. For MAGM3 cell the two
curves are considerably apart from each other at potentials lower than -1.030V,
which may be a result of some structural changes in the negative plate that
may cause different reactions to proceed during the first and second
polarization series.
b) Separator thickness and type exert substantial influence on the rates of the
reactions that proceed at the negative plates. For the cells with thinner
separators the reactions proceed at higher rate in the cell with MAGM3
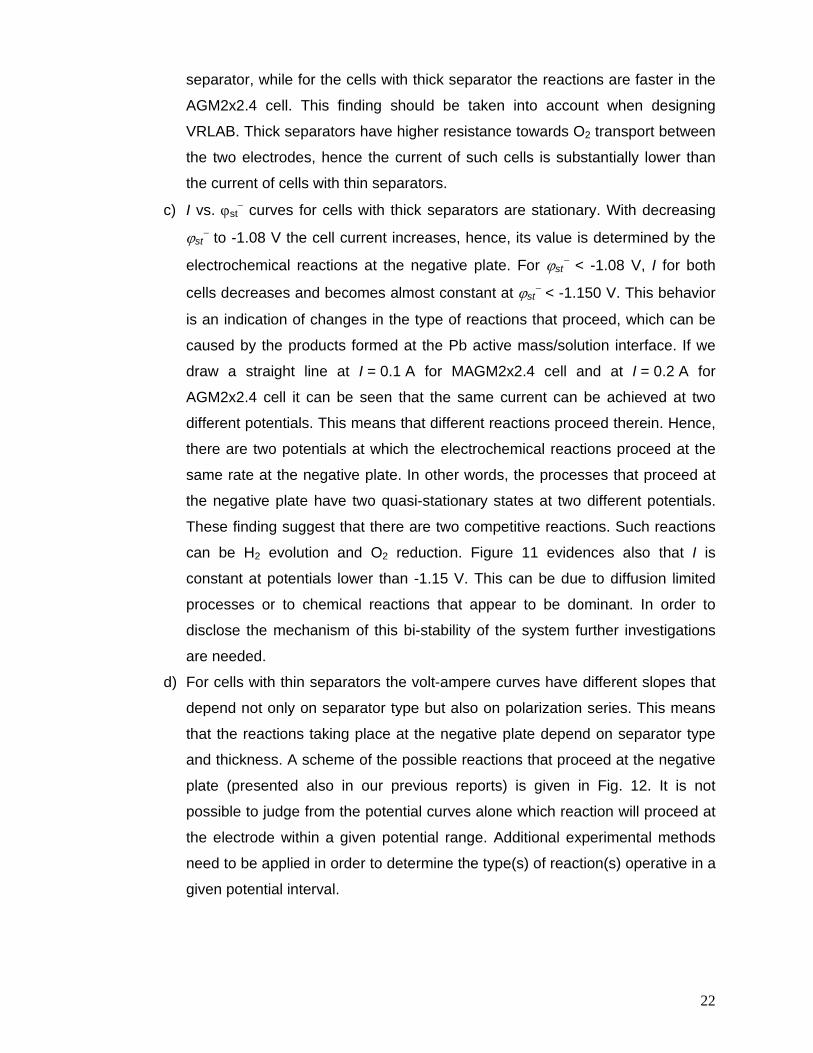
22
separator, while for the cells with thick separator the reactions are faster in the
AGM2x2.4 cell. This finding should be taken into account when designing
VRLAB. Thick separators have higher resistance towards O2 transport between
the two electrodes, hence the current of such cells is substantially lower than
the current of cells with thin separators.
c) I vs. ϕst− curves for cells with thick separators are stationary. With decreasing
ϕst− to -1.08 V the cell current increases, hence, its value is determined by the
electrochemical reactions at the negative plate. For ϕst− < -1.08 V, I for both
cells decreases and becomes almost constant at ϕst− < -1.150 V. This behavior
is an indication of changes in the type of reactions that proceed, which can be
caused by the products formed at the Pb active mass/solution interface. If we
draw a straight line at I = 0.1 A for MAGM2x2.4 cell and at I = 0.2 A for
AGM2x2.4 cell it can be seen that the same current can be achieved at two
different potentials. This means that different reactions proceed therein. Hence,
there are two potentials at which the electrochemical reactions proceed at the
same rate at the negative plate. In other words, the processes that proceed at
the negative plate have two quasi-stationary states at two different potentials.
These finding suggest that there are two competitive reactions. Such reactions
can be H2 evolution and O2 reduction. Figure 11 evidences also that I is
constant at potentials lower than -1.15 V. This can be due to diffusion limited
processes or to chemical reactions that appear to be dominant. In order to
disclose the mechanism of this bi-stability of the system further investigations
are needed.
d) For cells with thin separators the volt-ampere curves have different slopes that
depend not only on separator type but also on polarization series. This means
that the reactions taking place at the negative plate depend on separator type
and thickness. A scheme of the possible reactions that proceed at the negative
plate (presented also in our previous reports) is given in Fig. 12. It is not
possible to judge from the potential curves alone which reaction will proceed at
the electrode within a given potential range. Additional experimental methods
need to be applied in order to determine the type(s) of reaction(s) operative in a
given potential interval.

23
Fig. 12. Scheme of the chemical and electrochemical reactions involved in the
reduction of oxygen at the negative plates [4]. 3. Transition between polarized and depolarized state of negative plate at constant current polarization In an attempt to study in detail the bi-stable behavior of cells with 4.8 mm thick
separators and to try to elucidate the processes involved we performed the following
experiment with MAGM2x2.4 cell. The changes in ϕ−, ϕ+ , U and gassing rate were
monitored and the obtained results are presented in Fig. 13.
H2O2+ 2H 2H2O + (- 383.2 kJ/mol)
2H++ 2e- 2H
2H H2
H2O2+ 2H++ 2e- 2H2O
O2+ 2H++ 2e- H2O2
5
9
86
7
11
Pb(OH)2+ 2e- + 2H+ Pb + 2H2O
PbSO4 + 2e- + 2H- Pb+ H 2SO4
4Pb(OH)2+ H2SO4 3PbO.PbSO4.H2O + 4H2O + Q
16
15
14
13
17
12
10 H2O2 H2O + ½O2 + (- 97.38 kJ/mol)
Pb + H2O2 Pb(OH)2 + (- 326.2 kJ/mol)
Pb(OH)2 + 2H2O PbO + ( + 159.0 kJ/mol)
Pb(OH)2+ H2SO4 PbSO4 + 2H2O + (- 89.6 kJ/mol)
2Pb + O2+ 2H 2O 2Pb(OH)2 + (- 457.6 kJ/mol)
+