project1 28/6/04 1:08 pm page 1 australian · 2004. 8. 6. · project1 28/6/04 1:08 pm page 1 level...
TRANSCRIPT

Project1 28/6/04 1:08 PM Page 1
Level 6, 33 York Street Sydney NSW 2000 AustraliaLocked Bag 7 Australia SquareSydney NSW 1215Phone 61 2 8296 1100 Fax 61 2 9299 3777ABN 72 085 293 910www.aer.com.au
AUSTRALIAN

Matrix Metals Limited July 2004
page 2 of 32 Copyright © 2004 by Aegis Equities Holdings Pty Limited. All Rights Reserved.
Contents 1. Summary 3
2. Synopsis 5
3. Company Overview 7
4. Operations 13
5. Copper and Currency Outlook 22
6. Financial Forecasts 26
7. Valuation 28
IMPORTANT NOTICE
Aegis has been commissioned to produce this report. Disclaimer & Disclosure of Interests This publication has been prepared by Aegis Equities Research Pty Limited (ACN 085 293 910)(“Aegis”), an Australian Financial Services Licensee. Aegis has been commissioned to prepare this independent research report (“Report”) and will receive fees for its preparation. The company specified in the Report (the “Participant”) has provided Aegis with information about its activities. Whilst the information contained in this publication has been prepared with all reasonable care from sources that Aegis believes are reliable, no responsibility or liability is accepted by Aegis for any errors, omissions or misstatements however caused. Any opinions, forecasts or recommendations reflects the judgement and assumptions of Aegis as at the date of publication and may change without notice. Aegis and the Participant, their officers, agents and employees exclude all liability whatsoever, in negligence or otherwise, for any loss or damage relating to this document to the full extent permitted by law. This publication is not and should not be construed as, an offer to sell or the solicitation of an offer to purchase or subscribe for any investment. Any opinion contained in the Report is unsolicited general information only. Neither Aegis nor the Participant are aware that any recipient intends to rely on this Report or of the manner in which a recipient intends to use it. In preparing our information, it is not possible to take into consideration the investmentobjectives, financial situation or particular needs of any individual recipient. Investors should obtain individual financial advice from their investment advisor to determine whether opinions or recommendations (if any) contained in this publication are appropriate to their investment objectives, financial situation or particular needs before acting on such opinions or recommendations. This publication is not for public circulation or reproduction whether in whole or in part and is not to be disclosed to any person other than the intended recipient, without obtaining the prior written consent of Aegis. Aegis and/or the Participant, their officers, employees or its related bodies corporate may, from time to time hold positions in any securities included in this report and may buy or sell such securities or engage in other transactions involving such securities. Aegis and the Participant, their directors and associates declare that from time to time they may hold interests in and/or earn brokerage, fees or other benefits from the securities mentioned in this publication.
Aegis, its officers, employees and its related bodies corporate have not and will not receive, whether directly or indirectly, any commission, fee, benefit or advantage, whether pecuniary or otherwise in connection with making any statements and/or recommendation (if any), contained in this Report. Aegis discloses that from time to time itor its officers, employees and related bodies corporate may have an interest in the securities, directly or indirectly,which are the subject of these statements and/or recommendations (if any) and may buy or sell securities in the companies mentioned in this publication; may effect transactions which may not be consistent with the statements and/or recommendations (if any) in this publication; may have directorships in the companies mentioned in this publication; and/or may perform paid services for the companies that are the subject of such statements and/or recommendations (if any). However, under no circumstances has Aegis been influenced, either directly or indirectly, in making any statements and/or recommendations (if any) contained in this Report.
The information contained in this publication must be read in conjunction with the Legal Notice which can be located at http://www.aer.com.au

Matrix Metals Limited July 2004
page 3 of 32 Copyright © 2004 by Aegis Equities Holdings Pty Limited. All Rights Reserved.
ASX: MRX Bloomberg: MRX AU Reuters: MRX.AX 20 July 2004
Matrix Metals Limited COMM* $0.095 Share price target (12 months): n/a
Summary
Aegis Equities Research has undertaken a commissioned research report on Matrix Metals Limited (MRX).
MRX is an established Australian junior copper company on the verge of recommencing copper production and embarking on a rapid expansion path. Coming at a time of a sustainable recovery in copper prices MRX is set to experience strong earnings and cash flow growth over the next two years. We forecast net profit after tax of $2.6M in FY05 and $22.8M or 4.0c in FY06 for a PER of only 2.3x.
We have derived a current valuation of 17.1 cents per share. This could increase to 24.0 cents per share as certain plans come to unfold in the medium term and with the expectation that the exploration success demonstrated by the company continues. Threats come from volatile commodity prices, possible strengthening of the A$ and the mining and geological risks that normally make the junior resources sector of higher risk and relatively speculative.
MRX is a company focused on achieving growth and shareholder return based on the discovery, development and exploitation of copper deposits (both oxide and sulphide) in the Mt Isa base metals province of North West Queensland, where it has a large tenement area of over 3000sq km.
A decision is expected soon to develop The White Range Project, MRX’s most advanced project, potentially coming on stream in early to mid 2005 at an annual production rate of 15,000t of copper metal. This could be followed one year later by the start-up of the rapidly emerging Mt Watson Project at a similar scale, giving the company annual production of 30,000t copper per annum for at least nine years on the current resource base of 250,000t contained copper with successful exploration adding to this resource in the short term.
In its four years since listing on the ASX, MRX has demonstrated solid management through difficult times both at the corporate level and operationally, and delivered consistent exploration success.
Investment Opinion
This report on Matrix Metals Limited has been commissioned and as such Aegis has received a fee for undertaking a site visit, due diligence, research and analysis and creation of this report. Aegis believes it would be inappropriate to include a recommendation, investment opinion and share price target. However, Aegis has provided a valuation and earnings forecast as well as discussion of investment risks and rewards.
Valuation: $0.171Valuation Methodology: DCF
Key Assumptions
Beta 1.0Market risk premium (%) 6.6Risk free rate (%) 5.5WACC (%) 11.5Copper price (US$/lb): FY05 1.28FY06 1.28
Exchange rate ($US/$A):
FY05 0.72FY06 0.70
Share Price Risk n/a
Ethical rating: n/a
$-
$0.02$0.04
$0.06$0.08$0.10
$0.12$0.14$0.16
Jul-03 Nov-03 M ar-04 Jul-04
Performance against indices (%) 1 Year 2 YearMRX 163.9 131.7Rel to Sector 28.4 30.2Rel to Market 14.2 10.9
Yr to Jun NPAT Rep $M
NPAT1 Adj $M
EPS1 c
EPS chg %
PER x
PER rel All Ords x
PER rel Sector x
DPS c
Yield %
Franking %
ROE %
2003A -2.8 -2.8 -1.0 -9.6 -0.5 -0.5 0.0 0.0 0.0 -24.2
2004F -2.5 -2.5 -0.6 -14.3 -0.9 -1.0 0.0 0.0 0.0 -11.6
2005F 2.6 2.6 0.5 19.8 1.4 1.5 0.0 0.0 0.0 6.9
2006F 22.8 22.8 4.0 756.7 2.3 0.2 0.2 0.0 0.0 0.0 44.8 1 NPAT and EPS are adjusted by removing non-recurring items and goodwill. All the above statistics are derived from normalised earnings.
Market cap: $51.4M Shares on issue: 541M 0.0% of All Ordinaries 0.0% of Sector

Matrix Metals Limited July 2004
page 4 of 32 Copyright © 2004 by Aegis Equities Holdings Pty Limited. All Rights Reserved.
Recommendation1: NONE 12M Target: $n/a Company risk2: n/a Share Price risk2: n/a Ethical rating3: n/aYear end Jun. All figures in A$M
Profit & loss summary 2003A 2004F 2005F 2006F
Operating revenue 0.8 0.0 3.6 59.7
Invest & Other Income -1.0 -2.2 0.2 -4.3
EBITDA -1.5 -2.2 2.2 28.3
Depreciation / Amort -1.2 -0.6 -0.3 -3.8
EBIT -2.8 -2.9 1.9 24.5
Net Interest 0.0 0.4 0.8 -1.3
Pre-tax profit -2.8 -2.5 2.7 23.2
Tax expense 0.0 0.0 -0.1 -0.4
Minorities 0.0 0.0 0.0 0.0
NPAT -2.8 -2.5 2.6 22.8
Non recurring items 0.0 0.0 0.0 0.0
Reported profit -2.8 -2.5 2.6 22.8
NPAT add Goodwill & Pref 0.0 0.0 0.0 0.0
Adjusted profit -2.8 -2.5 2.6 22.8 Cashflow summary 2003A 2004F 2005F 2006F
EBITDA -1.5 -2.2 2.2 28.3
Working capital changes 0.0 -0.4 -0.6 -4.1
Interest and tax -0.1 0.4 0.7 -1.2
Other Operating items -1.5 0.1 0.0 0.0
Operating cashflow -3.2 -2.2 2.4 23.1
Required capex -0.5 -2.1 -28.5 -0.2
Maintainable cashflow -3.7 -4.3 -26.1 22.9
Dividends 0.0 0.0 0.0 0.0
Acq / Disp -1.3 -2.1 -0.5 -0.5
Other Investing items 0.1 0.0 0.0 0.0
Free cashflow -4.9 -6.4 -26.6 22.4
Equity 7.0 25.2 0.0 0.0
Debt increase/(reduction) -0.7 -14.9 26.6 -22.4 Balance sheet 2003A 2004F 2005F 2006F
Cash & short term deposits 2.3 21.0 0.0 16.8
Inventories 0.2 0.0 0.0 0.0
Trade debtors 0.0 0.0 0.6 4.6
Other curr assets 0.0 0.0 0.0 0.0
Total current assets 2.5 21.1 0.6 21.5
Property, plant and equipment 1.4 3.3 32.0 29.4
Non-current intangibles 10.2 11.4 11.4 11.4
Non-current investments 0.0 0.0 0.0 0.0
Other non-curr assets 0.5 0.5 0.5 0.5
Total assets 14.8 36.3 44.5 62.8
Trade creditors 0.3 0.0 0.0 0.0
Curr borrowings 0.0 0.0 0.0 0.0
Other curr liabilities 0.1 0.0 0.1 1.1
Total current liabilities 0.5 0.0 0.1 1.1
Borrowings 0.1 0.0 5.6 0.0
Other non-curr liabilities 0.5 0.0 0.0 0.0
Total liabilities 1.1 0.0 5.7 1.1
Minorities / Convertibles 0.0 0.0 0.0 0.0
Total shareholders equity 13.7 36.2 38.8 61.6
Ratio analysis 2003A 2004F 2005F 2006F
Sales growth(%) -88.2 -100.0 0.0 1,556.4
EBITDA growth(%) 1,169.6
EPS growth(%) 756.7
EBITDA/Sales margin(%) -189.6 0.0 62.0 47.5
EBIT/Sales margin(%) -342.0 0.0 53.6 42.0
Tax rate(%) 0.0 0.0 5.0 10.0
Net debt/equity(%) -15.7 -58.0 14.4 -27.2
Net debt/net debt + equity(%) -18.6 -138.1 12.6 -37.4
Net interest cover(x) -58.0
Payout ratio(%) 0.0 0.0 0.0 0.0
Capex to deprec'n(%) 6.1
NTA per share($) 0.0 0.1 0.2 0.3
ROA(%) -18.4 -10.7 7.2 47.7
ROE(%) -24.2 -11.6 6.9 44.8 Multiple analysis 2003A 2004F 2005F 2006F
Market cap($M) 51
Net debt($M) 0
Peripheral assets($M) 0
Enterprise value($M) 51
EV/EBIT(x) -18.4 -12.6 12.7 1.0
EV/EBITDA(x) -18.4 -12.6 12.7 1.0
EV/EBITDA All Ords (x) 9.5 8.7 8.1 7.7
EV/EBITDA rel All Ords (x) -1.9 -1.5 1.6 0.1
P/E(x) -9.6 -14.3 19.8 2.3
P/E All Ords 18.3 15.8 13.9 12.6
P/E rel All Ords(x) -0.5 -0.9 1.4 0.2
P/E Sector(x) 17.5 14.4 13.0 12.0
P/E rel Sector(x) -0.5 -1.0 1.5 0.2
Assumptions 2003A 2004F 2005F 2006F
USD/AUD 0.59 0.73 0.72 0.70
LME copper (US$/lb) 0.73 1.04 1.28 1.28
Interest rates (%) 4.79 5.36 5.50 5.50

Matrix Metals Limited July 2004
page 5 of 32 Copyright © 2004 by Aegis Equities Holdings Pty Limited. All Rights Reserved.
2. Synopsis
Company Overview
MRX is a company focused on achieving growth and shareholder returns based on the discovery, development and exploitation of copper deposits in the Mt Isa base metals province of North West Queensland. The company has a well advanced business plan to grow to a mid tier, long term, low cost copper cathode producer, based on the development of its existing 100% owned oxide copper resources which contain 250,000t of copper and by continued exploration. Situated within its large, 3,000sq km tenement area are MRX’s two advanced projects of White Range and Mt Watson. White Range hosts resources of 12.6Mt @ 1.1% Cu including the Greenmount resource of 7.4Mt @ 1.0% Cu and the higher grade Kuridala deposit (2.5Mt @ 1.4% Cu). The rapidly expanding resource at Mt Watson was recently increased to 8.0Mt @ 1.0% Cu.
MRX acquired the Mt Cuthbert SX/EW copper operation prior to listing in July 2000 and operated it until its closure in 2002. It was a courageous but correct decision by managementto cease production on economic grounds. Mt Cuthbert was a small scale (5,500tpa copper) and consequently high cost operation. Cash operating costs averaged US$0.65 – 0.75/lb between 1998 – 2002 when the LME copper price was persistently low at close to US$0.70 (on an annual average basis), except for 2000 when it averaged US$0.82/lb.
Production and Expansion and Strategy
MRX is planning to bring White Range into production as soon as possible, which is likely to be mid 2005, at a rate of 15,000tpa of copper. A Bankable Feasibility Study (BFS) is due for completion in August 2004, a mining permit has been obtained, landowner agreements are inplace, financing discussions are well advanced and all appears set for go ahead. Mt Watson, located 150km to the northwest is likely to provide a major expansion for the company. A BFS is targeted to begin on the Mt Watson Project at the end of 2004 to look at a production scale of 10-15,000tpa copper. At these rates current resources at the two project areas offer up to 10 years of production. Parallel with project development will be an active exploration program aimed at the discovery of additional oxide resources to enable higher production rates as well as potentially large sulphide orebodies.
Competencies and Advantages
Management - MRX has a strong management core that has been with the company since
its creation four years ago and even longer for the key operations people who worked at Mt Cuthbert. Andrew Chapman has led the company as MD from the start through some difficult times and is responsible for leading it into the healthy position it is in today. Operating and exploration personnel are highly experienced and loyal to the exciting geological province in which they work.
Financial position – Supplemented by the raising of equity funds, net cash at the end of June 2004 amounted to $21M. This should be sufficient for ongoing exploration and feasibility work for the two projects allowing project development to be debt/equity financed. A rapid build up in earnings and cash flow is forecast to strengthen the financial position.
Conventional and well-tested production process – Shallow open pit mining, heap leach, Solvent Extraction and Electrowinning are common and universally used techniques. Key variables of acid consumption and leach times have shown indications of being within acceptable ranges. In operating the Mt Cuthbert plant for a number of years, the companyis very familiar with the process.
Low operating costs - White Range total cash operating costs are estimated at US$0.57/lb and Mt Watson $0.50/lb. Although the technology will be primarily the same as Mt Cuthbert, economies of scale will make a great deal of difference to the operating costs. In particular, Mt Watson is expected to benefit from higher metallurgical recoveries.
Potential for on going mineral discoveries – MRX’s tenements are located within the world class, Mt Isa base metals province, an area with a history of both oxide and sulphide orebodies and production.

Matrix Metals Limited July 2004
page 6 of 32 Copyright © 2004 by Aegis Equities Holdings Pty Limited. All Rights Reserved.
Copper price outlook - The copper price has rebounded strongly over the past two years, driven by increasing global demand and tightening supply. US consumption has been a key driver as well as strong growth from China. The outlook is very favourable for copper over the next two years.
Ready market for the product – MRX will have the advantage of producing LME Grade A copper metal on site for ready delivery to domestic and international customers.
Relations with Indigenous People - MRX has been building a relationship and negotiating Indigenous Land Use Agreements (ILUAs) with the local communities, the Kalkadoon People and the Mitakoodi People since the inception of the Company in mid 2000.
Strengths
Mineral resources to support production plans
Large and prospective exploration tenements
Established company with track record in exploration and mining
Financially secure
Conventional heap leach, SX/EW technology
Quality, high integrity management
Strong copper price outlook
Weaknesses
One commodity company (although potential for gold)
Low grade ore
Small cap – reduced investor interest
Projects yet to get the go-ahead
Opportunities
Expansion by way of Mt Watson start up
High probability of identifying new mineral resources
Mt Watson sulphide anomalies
New tenement acquisition
Threats
Wet weather seasons
Cycle lows in copper price
Any strengthening of AUD
Timing is critical re the copper price
Financial Outlook
The company is about to enter a new phase of growth with the commencement of production from the White Range project that is expected to be operating at full capacity early in FY06. Earnings are forecast to jump dramatically in FY06 to $23M (NPAT) on sales revenue of $60M.Some revenue can be expected in the FY05 year from the commencement of production in June 2005. Our earnings forecasts do not include the Mt Watson Project which would add significantly to the financial forecasts from FY07 onwards. Inclusion of Mt Watson would resultin a FY07F NPAT of $25M, preventing the falling away of corporate profits seen in the one project scenario, due to a lower copper price.
Valuation and share price catalyst
We have derived a current valuation of 17.1 cents per share. This could increase to 24.0 cents per share as certain plans come to unfold in the medium term and with the expectation that the exploration success demonstrated by the company continues. The main components of the valuation are the White Range Project ($39M or 6.8cps) and the Mt Watson Project ($31M or 5.4cps), based broadly on current resources and indications of immediate upgrades. Further upgrades are almost assured over the longer term which would add value and has been considered in the Expanded Case valuation of 24.0 cents. This may still prove to be conservative if the promising encounters of copper sulphide mineralisation at both Greenmount and Mt Watson lead to significant discoveries. It is a very active time for the company and over the next six months there will be many milestone events that will all potentially act as share price catalysts: 1) completion of the White Range BFS, 2) results fromthe drilling of Mt Watson sulphides, 3) quantifying the resource 'expansion' at a lower cut-off grade, 4) commencement of a Mt Watson BFS, 5) drill results from Mt Earl and other targets as part of ongoing exploration.

Matrix Metals Limited July 2004
page 7 of 32 Copyright © 2004 by Aegis Equities Holdings Pty Limited. All Rights Reserved.
3. Company Overview
Business Outline and Strategy Matrix is a company focused on achieving growth and shareholder return based on the
discovery, development and exploitation of copper deposits in the Mt Isa base metals province of North West Queensland. The company has a well advanced business plan to grow to a mid-tier, long term, low cost copper cathode producer based on the development and exploitation of the 100% owned oxide copper assets. This plan will be achieved predominately by the exploitation of the existing resource and reserve inventory and via the achievement of ongoing exploration success on the significant, and largely unexplored, tenement portfolio.
A fundamental part of the business is exploration, an activity in which Matrix has a great deal of expertise. It is a proven explorer with a number of exploration successes to its name within its two project areas. Exploration is focused on oxide copper deposits located within trucking distance of the two project areas. The prospectivity of the province in combination with the abilities and experience of MRX personnel and the employment of modern exploration techniques gives the exploration activity a high degree of potential value creation.
The company holds a strategic tenement position in the province totalling in excess of 3,000sqm, all of which is 100% owned and not subject to any joint venture or non-government royalty arrangements. The two project areas in the tenement package are Mt Cuthbert and White Range, separated by about 120km.
Fig 1. MRX Tenement Locations
Source: Matrix
Mt Cuthbert contains the Mt Cuthbert Production Facility, the discoveries of Mt Earl and Mt Watson and many targets over an extensive tenement area. The Production Facility is a fully developed heap leach solvent extraction/electrowinning facility including all associated infrastructure and services with an estimated replacement value of $20M. It was operated successfully from 1996 to late 2002 when operations were suspended due to low copper prices.
White Range is a copper oxide deposit with JORC compliant resources of 12.6Mt at 1.1% Cu which were identified by the previous owner in 1998. A BFS is under way on the development of the resource.

Matrix Metals Limited July 2004
page 8 of 32 Copyright © 2004 by Aegis Equities Holdings Pty Limited. All Rights Reserved.
The medium term growth strategy is to establish production at both projects. It is planned to relocate, upgrade and re-start the Mt Cuthbert plant at White Range and to construct and commission new production facilities at Mt Watson. Based on existing resources and the demonstrated exploration potential of these projects, the opportunity is presented to achieve combined production of up to 30,000 t of copper per annum.
In addition to the potential growth that the existing assets provide through production and discovery, growth will also be sought through the acquisition of exploration properties and of advanced near production assets located within the Mt Isa province.
History Matrix purchased 100% of the Mt Cuthbert Operation and the White Range Project in early
2000 and subsequently listed on the ASX on 11 July 2000.
When MRX operated the plant at Mt Cuthbert, copper cathode production was on occasion lifted to rates in excess of 115% of nameplate capacity. Depressed copper prices in the years 2000 and 2001 made the returns from the operation marginal and the decision was made in mid 2001 to suspend open pit mining and the stacking of new ore and to derive ongoing copper production from the existing leach pad inventory. This resulted in a gradual decline in production through to late 2002 at which point a decision was made to suspend production.
After the acquisition of the Mt Watson prospect in late 2000, the first drilling program at the prospect was completed in June 2001 and resulted in an inferred resource of 837,000 t grading 1.3% copper being estimated over a 1 km strike length, with initial mineralisation being identified over a strike length in excess of 2.5 km.
A subsequent drill program completed in late 2001 and another program completed in February 2002 resulted in the resource inventory increasing to 1.6Mt at 1.1% copper as at May 2002 with a significant proportion of the resource elevated to the measured category.
Another upgrade at Mt. Watson followed to 2.6Mt and again very recently to 8.0Mt at 1.1% Cu, including a sulphide resource of 1.5Mt at 1.0% Cu.
The existing White Range resource was the basis of a previous feasibility study which determined an economic +8year mine life project was viable. MRX has proceeded with a Bankable Feasibility Study that is due for completion in August 2004.
In April 2001, Constellation Copper Corporation (Constellation) previously called Summo Minerals Corporation (Summo) became the major shareholder in MRX with a 48% holding company when it purchased all the shares held by Murchison United and Majestic Resources. Constellation’s major shareholder is the US private equity fund Resource Capital Fund (RCF). At the same time Constellation provided a $3.25M loan to Matrix and was invited to have two representatives appointed to the Board. As mentioned later in this report, Constellation sold its entire shareholding in July 2004.
Shareholders funds upon listing were $11.1M and no additional new equity was raised in FY01. However over the three years to end June 2004 close to $40M has been raised in new equity, principally through placements, rights issues and SPPs: $2.6M in FY02, $11.3M in FY03 and $25.1M in FY04. This included conversion of Constellation’s loan to $3.1M equity in September 2003. $21M cash remains on the balance sheet.
Financial History The following tables summarise the financial history of the company from the first year of
operation in FY01 to the end of 1H04. It serves to highlight that management has been successful in steering the company through unforeseen difficult times of low copper prices, limited equity market support and extreme wet conditions through the 2002 wet season.
Looking at the Financial Performance, revenues effectively ceased when mining operations at Mt Cuthbert in 2002. When in production in the two prior years the low copper price impactedprofitability harshly, resulting in losses for the company in FY01 and FY02. In the absence of operating income in FY03 and FY04 the negative bottom line was reflective of exploration, development and admin costs incurred.

Matrix Metals Limited July 2004
page 9 of 32 Copyright © 2004 by Aegis Equities Holdings Pty Limited. All Rights Reserved.
Fig 2. Financial Performance ($M)
1H04 FY03 FY02 FY01
Copper Revenue 0.0 0.8 6.9 10.7
Cost of Sales -0.3 -1.4 -7.8 -9.9
Borrowing Costs -0.1 -0.2 -0.2 -0.1
Write Down of Heaps 0.0 -1.2 0.0 -5.6
Corporate and Admin -0.7 -1.0 -0.8 -0.8
Net Profit after tax -1.0 -2.8 -1.7 -6.1
Source: Matrix
In the face of some difficult commodity market conditions in the early years of the company’s
life, cash flow has been prudently managed. Equity funds have more recently been forthcoming to carry on the core activities and prepare for the planned production restart. Debt funding has not been required.
Fig 3. Cash Flow ($M)
1H04 FY03 FY02 FY01
Receipts 0.0 1.0 8.9 9.3
Payments -1.0 -3.3 -9.7 -13.0
Net Interest Expense 0.0 0.0 -0.1 0.0
Capex 0.1 -0.5 0.0 -0.1
Exploration, Evaluation and Devel. -1.1 -1.3 -0.7 -0.5
Mine Development, Security, Other 0.0 -1.0 -1.2 -0.4
Share Issues (Net) 6.0 7.6 2.6 -0.8
Net Increase 3.9 1.4 0.8 -4.7
Source: Matrix
Cash of $6.2M as at the end of December 2003 has been supplemented with additional equity
raisings in the six months to June 2004 taking cash at the end of the period to an estimated $21.0M.
Fig 4. Balance Sheet ($M)
1H04 FY03 FY02 FY01
Cash 6.2 2.3 0.9 0.1
Exploration and Development 11.4 10.2 8.8 8.4
Total Assets 19.9 14.8 13.2 14.4
Current Liabilities 0.8 0.5 3.9 8.7
Total Borrowings 0.4 0.1 4.1 4.0
Total Liabilities 1.6 1.1 4.4 9.5
Shareholders Funds 18.2 13.7 5.7 4.9
Source: Matrix

Matrix Metals Limited July 2004
page 10 of 32 Copyright © 2004 by Aegis Equities Holdings Pty Limited. All Rights Reserved.
Corporate Structure MRX is a limited liability company. As at the end of June 2004 there were 541.5M fully paid
ordinary shares on issue and quoted on the ASX. In addition there were the following issued and unquoted securities:
Fig 5. Securities (issued and unquoted)
Expiry No. Exercise Price (cents)
20-Mar-05 3,893,036 25
31-Aug-05 625,000 25
14-Jun-06 2,250,000 25
31-Jan-07 612,500 15
30-Sep-06 34,250,000 5.3
30-Jun-05 750,000 10
30-Jun-06 750,000 10
30-Jun-07 750,000 10
31-Jan-07 75,000 10
Source: Matrix
Shareholders The major shareholder Constellation Copper Corporation (Constellation) announced that it
sold its entire holding MRX on 16 July 2004 to a number of international institutions at a priceof eight cents per share. Constellation advised the Company that the decision to sell the shareholding was driven exclusively by the requirement to provide capital for the development of Constellation’s copper project in the USA, which is currently under construction.
Constellation became a major shareholder in April 2001 when it purchased all shares in MRX from Murchison and Majestic, resulting in a 48% holding in the company. Its shareholding was diluted over time by the new equity issues that followed to the level of 23.64% with the last issue in May this year.
Outside of Constellation the register has comprised mainly individual private investors, although one or two institutions have been on the register from time to time.
At the same time as Constellation’s departure from the register, Greg Hahn, President and CEO of Constellation tendered his resignation from the MRX Board.
Company management The company is managed from Perth, where the Head Office is located and senior
management personnel are based. These include the Managing Director, Finance Director andGeneral Manager, Development and their staff. At present, there are a total of 6 full time employees in Perth.
Exploration and feasibility activities for the White Range Project are run out of Brisbane, where the project manager and his small staff are located. The three senior geologists assigned to the projects are based in Cloncurry and Mt Cuthbert and are supported by their staff. The total Queensland personnel can range from 7 to 14, depending on drilling.

Matrix Metals Limited July 2004
page 11 of 32 Copyright © 2004 by Aegis Equities Holdings Pty Limited. All Rights Reserved.
Directors David Humann FCA, FCPA – Chairman
Mr Humann is a Chartered Accountant with 41 years international experience predominantly with the accountancy firm, PricewaterhouseCoopers. He was a member of Pricewaterhouse World Board of Directors and its World Executive Management Committee based in London and New York. He also held the positions of Chairman and Senior Partner of Pricewaterhouse - Hong Kong and China, Managing Partner Asia Pacific and was a member of the Policy Committee of the Australasian firm. Mr. Humann is currently Chairman of MacMahon HoldingsLimited, Mincor Ltd and a director of ERG Limited and TICOR Limited.
Andrew Chapman – Managing Director
Andrew Chapman has spent his 22 year career in the mineral resources industry predominately in the gold, base metals and coal sectors. Commencing his career in civil engineering in the Victorian brown coalfields, he moved to Western Australia in the late 1980s and progressed into the gold and base metals industry focussing in the fields of projectevaluation and development. He has been directly responsible for the development of two gold projects in WA. After spending time with an international engineering group responsible for its business development and project evaluation activities, he moved into company and corporate management in the mid 1990's. Andrew created and listed Matrix Metals in 2000 and is the Managing Director of Matrix. He was also a founding director of the Australian Gold Council.
Mr Ian C. Burvill BE, MBA, MAusIMM, MIEAust, CP Eng – Non Executive Director
Mr. Burvill was appointed to the Board of Matrix on 7th February 2003. He has 17 years experience in the mining industry, comprising 10 years in finance and 7 years in engineering. He coordinates the Australian investment activities of Resource Capital Funds (RCF) an American private equity firm. Prior to joining RCF in late 2001, Mr. Burvill was Head of Technical Services in the resource banking department of N.M. Rothschild & Sons (Australia) Limited. Before joining Rothschild in 1992, he worked for engineering consultants on the design, construction and commissioning of mineral processing plants in Australia and North America. Mr. Burvill's mining industry experience ranges from feasibility study development, to project development, to debt and equity financing. He is currently a Director of Pan Australian Resources N.L. and SouthCoal Pty. Ltd. (a coking coal producer).
Shane McBride – Chief Financial Officer
Mr McBride is a Certified Practising Accountant and Chartered Secretary with 23 years experience in the accounting profession including 18 years experience in the resource industry. His experience has been gained in several listed Australian Public Companies in the areas of management and financial accounting, general administration and company secretarial functions. Mr McBride has a BBus.(Acct) degree, is a Fellow of CPA Australia, Fellow of Chartered Secretaries Australia and the Institute Chartered Secretaries and Administrators, and is a Member of the Australian Institute of Directors. Mr Mc Bride has been with Matrix since its incorporation in February 2000.

Matrix Metals Limited July 2004
page 12 of 32 Copyright © 2004 by Aegis Equities Holdings Pty Limited. All Rights Reserved.
Key Personnel
Fig 6. Current Management Structure
Native TitleNegotiations
Bob DennisMt. WatsonArea Project
Phil FrankWhite RangeArea Project
Andrew ChapmanExploration Management
(Interim)
Shane McBrideCFO
Company Secretary
Brent MurdochDevelopment
Manager
(Vacant)Operations
Management
Andrew ChapmanCEO
Source: Matrix
Andrew Chapman – Managing Director
See Directors on previous page
Shane McBride – Executive Director & Chief Financial Officer
See Directors on previous page
Brent Murdoch – General Manager, Development
Brent Murdoch has been in the mining industry for twenty (20) years covering all aspects of mine development, operation and administration, personnel management, safety, training, cost control and industrial relations. He has had specialised experience in mine start-ups over the last ten (10) years. He has a very strong technical and economic analysis background, including reserve engineering and evaluation of operating mines.He has directed or participated in more than 22 Greenfield mines being developed into production. In his role with Matrix Brent has been responsible for the White Range Feasibility Study, technical, economic and strategic evaluation of the Mt Cuthbert and Mt Watson projects.
Bob Dennis – Exploration Manager – Mt Cuthbert Project
Bob Dennis is a geologist with 25 years experience in the resource industry covering exploration, evaluation, development and extraction of base metals and gold. He has held positions of Senior Exploration Geologist with Carpentaria Exploration (MIM), Mining Superintendent with Carpentaria Gold and Murchison United (Mt Cuthbert), Chief Geologist with Mount Isa Mines and Sardinia Gold Mining, and Operations Manager for Matrix Metals. His was work on smaller scale, lower cost development allowed the development the McArthur River mine, discovered the high grade gold resource of the Ravenswood Gold Mine and commenced the exploration decline project for the George Fisher Mine. At MIM led a re-evaluation of the Mt Isa Open Cut potential. In addition to his Operations Manager role with Matrix, he has been responsible for the recognition of the Mt Watson style of mineralisation. Bob has been employed full time at the Mt Cuthbert project for six years.
Phil Frank – Exploration Manager – White Range Project
Phil Frank has 40 years experience, has worked in the Mt Isa region almost continually for 20 years, is responsible for the discovery of Greenmount, Vulcan, Mc Cabe resources and all the other prospects at White Range. He has been with the White Range project since the mid 1990's and with Matrix since the listing in 2000.

Matrix Metals Limited July 2004
page 13 of 32 Copyright © 2004 by Aegis Equities Holdings Pty Limited. All Rights Reserved.
4. Operations
Historical Perspective Matrix purchased 100% of the Mt Cuthbert Operation and the White Range Project in early
2000 prior to listing on the ASX on 11 July 2000. Mt Cuthbert was purchased from Murchison United NL for 20M MRX shares. White Range was purchased from Majestic Resources NL for $5.0M cash.
The Figure above shows MRX’s tenements to be situated in the heart of the Mt Isa base metals province. Nearby mines include the world class primary sulphide operations of Mt Isa, Ernest Henry, Cannington and Osborne as well as copper oxide mines of Mt Gordon and Selwyn.
Fig 7. Mt. Cuthbert Tenement Locations (Resource estimates as at September 2003)
Source: Matrix (Sept 2004)
Mt Watson is increasingly likely to become the main producer in the tenement area with feed also likely to come from other resources and new discoveries in the area.
Mt Cuthbert/Mt Watson The Mt Cuthbert area, which includes the Mt Watson and Mt Earl prospects comprise semi-
contiguous blocks of tenements covering an area approaching 2,000 sq km and are predominately granted mining leases, granted exploration licenses together with a number of mining lease and exploration permit applications. The area extends 100km north from a point 50 km north east of Mt Isa.
Mt Cuthbert Mine
Mt Cuthbert operated as an open pit, heap leach, SX/EW facility having been commissioned in November 1996 by Murchison United NL at a scale of 5,500t copper cathode per annum. By the end of 1999, 13,800t of cathode had been plated and sold. Open pit mining ceased in November 1999 with the onset of the wet season and the stacking of stockpiled ore onto the heaps ceasing in December. After Matrix acquired the project, mining recommenced at the end wet season in the first half of 2000.

Matrix Metals Limited July 2004
page 14 of 32 Copyright © 2004 by Aegis Equities Holdings Pty Limited. All Rights Reserved.
In the year to June 30 2001, the first year of control by MRX, 4,300t of copper cathode were produced. Heavy rain interrupted production in the second half of the financial year. Due to the low price of copper it was decided to cease mining in December 2001, but to continue copper production from the leach pad inventory at the same time supplemented by the stacking of electrostatic precipitator dust (ESP) purchased from another party. ESP was blended with low grade stockpiles or other material. This method of production continued intoFY02 with the resultant output being 2,450t copper in that year.
Production was suspended in September 2002 on completion of drawdown of the economic copper from the leach pads. In FY03 the focus of activities was on exploration, to confirm the strong growth potential for the resource inventories in the Mt Cuthbert/Mt Watson area.
Mt Watson
The Mt Watson tenement, located 20km north of Mt Cuthbert, was purchased in October 2000 after identification by Bob Dennis as highly prospective ground. An initial drilling program, completed in June 2001 established an initial inferred resource of 837,000t at 1.3% copper, located in two discrete bodies of mineralization referred to as the Eastern and Western zones. The resource was extended following additional drilling in 2002 to 1.6Mt at 1.1% Cu.
Fig 8. Mt. Watson Resource Location
Source: Matrix (July 2004)
Late in 2002 a new zone was discovered immediately to the north of the Mt Watson Central Resource area. A highly successful drilling program in January 2004 led to the conclusion thatthe mineralized system at Mt Watson was larger than previously estimated. This was followed up in March with the reporting of excellent drill results, the best being 70m at 1.34% copper as shown in the section below.

Matrix Metals Limited July 2004
page 15 of 32 Copyright © 2004 by Aegis Equities Holdings Pty Limited. All Rights Reserved.
Fig 9. Mt Watson Western Zone Cross Section
Source: Matrix (Sept 2003)
Copper sulphide intersections (38m @2.2% Cu) were encountered for the first time leading toa revised exploration program of targeting further sulphides. A sulphide resource was announced for the first time on 20 July 2004 of 1.5Mt @ 1.07% Cu.
Also on this day, it was announced that the total leachable copper resource at Mt Watson was upgraded by 250% to 6.5Mt @ 1.0% Cu at a (arguably high) cut off grade of 0.5% Cu. This was an excellent result arising from the exploration work and drilling from February to June 2004. This announcement can be considered as one of the most important in the company’s history as it contained several implications:
The upgraded resource established the foundation for an SX/EW development at Mt Watson and the commencement of a BFS, scheduled for later this year.
Strong continuity of the Mt Watson resource is confirmed over its 1.5km strike to date; it is open both along strike and at depth; this highlights further potential for oxides at Mt Watson and surrounding areas.
The potential for the discovery of a major copper sulphide deposit at depth has increased with the previously reported sulphide drill intercepts field work and the results of the MIMDAS geophysical survey just completed. The major primary sulphide anomaly identified at Mt Watson will be diamond drilled late July.
The Company has been granted a Mining Lease for Mt Watson as a stand alone mining and treatment operation and is not required to complete an EIS.
Mt Earl
A reverse circulation drilling program completed at the Mt Earl prospect in June 2003 identified it as a new discovery with resource potential. The 15 hole, 693m RC program had the objective of locating resource width and grade and to confirm the resource potential. Every hole was mineralized with some of the results as follows: 16m @ 1.62% Cu, 20m @ 1.22% Cu, 19m @ 1.15% Cu and 12m @ 0.9% Cu.

Matrix Metals Limited July 2004
page 16 of 32 Copyright © 2004 by Aegis Equities Holdings Pty Limited. All Rights Reserved.
White Range White Range is located 35km south of Cloncurry and 100km south of Mt Cuthbert on a
tenement area of approximately 1000 sq km on the Eastern Fold Belt of the Mt Isa Inlier. A Pre-Feasibility Study (PFS) was completed by Majestic Resources in 1999 based on production of 8,400t copper and a resource of 12.6Mt at 1.2% Cu. The resource is contained within five deposits know as Greenmount (7.4Mt), Kuridala (2.5Mt), McCabe (1.2Mt), Stuart (1.2Mt) and Vulcan (0.3Mt). Greenmount is the largest and key deposit at White Range.
The PFS examined the development of the five deposits with an emphasis on combined copper-cobalt recovery. The resource was recalculated and restated by Matrix (see Fig 13) in April this year as a copper only resource, neglecting to define the cobalt content.
An independent assessment of the PFS conducted at the time concluded, “it is considered feasible that a scenario can be developed that will indicate a viable project. Principal risk in the resource area is associated with identification of the amount of oxide zone versus transition zone mineralisation present. A potential downside for the existing deposits of up to 20% in tonnage should be factored into any feasibility sensitivity analysis on the amount of readily leachable oxide ore. This risk, however, is largely offset by the potential for discovery of additional oxide mineralisation either adjacent to existing deposits or in new deposits.” Exploration success at a number of new prospects reported by Matrix in 2003 vindicate this projection.
Fig 10. White Range Tenement Area and Resource Locations
Source: Matrix

Matrix Metals Limited July 2004
page 17 of 32 Copyright © 2004 by Aegis Equities Holdings Pty Limited. All Rights Reserved.
Fig 11. Greenmount Deposit (3D graphic)
Source: Matrix
The Greenmount deposit occurs in a variably altered and strongly sheared envelope in Marimo Slate near the contact between the Marimo Slate and underlying Corella Formation. The mineralised zone dips east at between 80° and 45° and attains a width of up to 50m. The maximum depth of leachable copper mineralisation comprising oxide and transitional zones has increased from 90m to 150m as a result of the drilling campaign. This depth increase has significantly increased the size potential of the leachable copper resource.
In addition to the copper resources and advanced exploration targets, the White Range area is prospective for gold. A gold resource was estimated at Greenmount from the intersections within the deposit of 3.6Mt at 0.8g/t containing 90,00oz gold, contiguous with the existing copper resource, both of which are hosted predominately in the Marimo slates. The nature of the existing gold mineralization makes it likely to be amenable to heap leaching. However there are no plans to extract the gold at this stage although it may be possible to isolate the gold/copper resource on the leach pads as part of the copper project for re-treatment at another time
White Range’s progress under Matrix Management
MRX recommenced drilling in late 2002 at the Greenmount deposit with a 21 hole, 1700m RC program designed to infill the existing drill data and to seek an upgrade and reclassification of the copper resource. It would also test for strike extensions to the north and south. Based on the results of the program White Range resources were recalculated, restated and first published by Matrix - the leachable resource at Greenmount was increased in March 2003 by 80% or 4.0Mt to 7.3Mt at 1.0% Cu. These remain as presented in Figure 13.
Also in early 2003, three surrounding prospects, Toby Barty, Desolation and Copper Canyon were drilled for the first time by MRX, confirming resource grade and widths of mineralization at all prospects.
In July, 2003 SG Australia Limited (SG) agreed to fund the completion of a BFS for White Range. SG provided a $2.0M debt facility and accepted a $0.35M share placement.
The White Range Project BFS has progressed well and is due to be completed in August 2004.It has been a thorough preparation for the commencement of a significant operation involving finalisation of geological studies, resource and reserve estimation, mine design, metallurgical testwork, process and engineering design, water supply evaluation, cost estimation and preparation for tendering and awarding of construction and operational contracts.
At the time of Aegis’ visit to the site, mid July 2004, the BFS was at the late stage of assessment of geotechnical drilling results in the footwall and hangingwall designed to test structural features of the proposed open pit. Final metallurgical testwork on new core samples is now completed.

Matrix Metals Limited July 2004
page 18 of 32 Copyright © 2004 by Aegis Equities Holdings Pty Limited. All Rights Reserved.
Mineral Resources
Fig 12. Resources as of July 2004
Measured Indicated Inferred Total
000 t % Cu 000 t % Cu 000 t % Cu 000 t % Cu
Mt Cuthbert Area Oxide and Transition Zone
Leichhardt 894 1.0 241 0.9 1,135 1.0
Ned Kelly 95 1.0 95 1.0
Mighty Atom North 233 1.1 233 1.1
Mighty Atom South 86 1.1 86 1.1
Little Wonder 126 1.5 126 1.5
Mt Millicent 231 1.0 231 1.0
Mt Cuthbert Extended 64 1.9 64 1.9
Total 1,729 1.1 241 0.9 1,970 1.1
Mt Watson Area Oxide and Transition Zone
Oxide 910 1.1 5,000 1.0 630 0.9 6,540 1.1
Sulphide 440 1.1 1,050 1.1 1,490 1.0
Watson Total 910 1.1 5,440 1.0 1,680 1.2 8,030 1.0
Hidden Treasure 229 1.5 71 0.8 300 1.3
Total 1,139 1.1 5,511 1.0 1,680 1.2 8,330 1.1
White Range Area Oxide and Transition Zone
Greenmount 6,791 1.0 570 0.9 7,362 1.0
Kuridala 1,218 1.4 1,281 1.4 14 1.6 2,513 1.4
McCabe 505 1.1 714 1.0 1,219 1.0
Vulcan 187 1.4 73 1.1 260 1.3
Stuart 1,222 1.1 1,222 1.1
Total 2,945 1.2 8,973 1.1 657 0.9 12,576 1.1
Total 4,084 1.2 16,213 1.1 2,578 1.0 22,876 1.1
Source: MRX (July 2004). Cut-off grade 0.5% Cu.
MRX has total resources of 22.9Mt @ 1.1% Cu from the three project areas, calculated on a 0.5% cut-off grade containing 252,000 tonnes of copper. Apart from the initial introduction ofsulphide resources at Mt Watson with the latest upgrade in mid July 2004, resources are all oxide and transition zone material. The table also includes the large increase of Mt Watson oxide and transition resource announced in July 2004.
The Mt Watson resource is growing rapidly and at 6.54Mt at 1.1% Cu is close to overtaking the company’s single largest resource at Greenmount (7.36Mt at 1.0% Cu).
We stress that the resource figures quoted are calculated using a cut-off grade of 0.5% Cu which is likely to understate the extent of the economic resources. A cut-off of 0.3% Cu may be economic in this environment of stronger copper prices which we would expect to result in a meaningful lift in total resources.
Only 11% of total resources are in the inferred category with 17% measured and 72% indicated.

Matrix Metals Limited July 2004
page 19 of 32 Copyright © 2004 by Aegis Equities Holdings Pty Limited. All Rights Reserved.
Production Scenario
White Range
The White Range BFS is due for completion in August 2004. The scope of the BFS is the development of the total resource of [email protected]% Cu to an operating scale of 15,000tpa.
We have adopted the principal features of the project into our analysis as follows:
Conventional open pit, heap leach, SX/EW operation. In this process, mined ore is crushed, acid agglomerated and stacked on pads. The stacked ore is then irrigated with dilute acidified liquor and the copper minerals are dissolved to produce copper sulphate solution. This is recovered in dams and further processed to produce 99.99% LME Grade Acopper cathode.
First cathode produced June-July 2005, stacking of heaps to begin March quarter 2005, full production 4Q05.
Capital expenditure $28M including EPCM (+15%), contingencies and working capital. Thisassumes the relocation and re-use of the Mt Cuthbert plant and the Great Australia electrowinning circuit, recently acquired.
Location of the plant, ore heaps and tailings dumps adjacent to the Greenmount resource.
Ore feed predominantly from Greenmount, but also from the higher grade Kuridala and Vulcan. The McCabe and Stuart resources are also available to be scheduled for processing.
Water supply a combination of borefield and dam.
Diesel power.
Contract mining and crushing.
60% debt/40% equity (including off-take funding).
Cash operating costs US$0.57/lb ($0.81/lb) on full production commencing FY06.
Fig 13. White Range Project Summary
FY05 FY06 FY07
Tonnes to heaps Mt 0.1 1.7 1.7
Grade % Cu 1.10 1.10 1.10
Recovery % 80 80 80
Cathode produced Kt 0.9 15.0 15.0
Revenue $M 3.6 59.7 44.8
EBITDA $M 2.0 32.6 17.6
Depreciation $M 0.3 3.3 3.3
EBIT $M 1.7 29.4 14.3
LME Copper price US$/lb 1.28 1.28 0.95
Cash operating costs US$/lb 0.57 0.57 0.58
Capex $M 28.0 0.2 0.2
NPV (discount rate 11.5%) $M 39.2
Source: Aegis
Strong copper prices that we see persisting over the next two years should result in White
Range getting off to a very good start. We forecast revenues of $60M and an EBIT of almost $30M in FY06. We calculate an ungeared, after tax NVP of $39M at a discount rate of 11.5%.

Matrix Metals Limited July 2004
page 20 of 32 Copyright © 2004 by Aegis Equities Holdings Pty Limited. All Rights Reserved.
Mt Watson
Mt Watson is an advanced exploration project, about to move into the project feasibility phase and as such its production prospects cannot be well defined. The company stated a production target of 10,000t minimum on the basis of the initial resource of 2.9Mt at 1.1% Cu and the success of ongoing exploration. The recent resource upgrade to 6.5mt is likely to see the production rate increase to at least 15,000tpa.
From our observations of its location and access, ore type and competency and other features, we would expect the project to generated similar NPVs to White Range. Metallurgically, the deposit has reported encouraging results. Cash costs are likely to be lower but capital costs higher than the White Range Project that was able to save on the re-use of the Mt Cuthbert plant.
We have not included Mt Watson in our earnings forecasts. Although a significant resource has been established and the likelihood of further additions to the resource is very high, it remains at an early stage. We have included Mt Watson in our base case valuation using the following assumptions and projections.
Conventional open pit, heap leach, SX/EW operation.
First cathode produced August 2006, stacking of heaps to begin March quarter 2006, full production early FY07.
Capital expenditure $32M including EPCM, contingencies and working capital.
Location of the plant, ore heaps and tailings dumps adjacent to the Mt Watson resource.
Ore feed predominantly from Mt Watson, but also from Mt Earl and Cuthbert deposits within economic trucking distance of approximately 20km.
Borefield water supply.
Diesel power.
Cash operating costs US$0.51/lb ($0.73/lb) on full production commencing FY07.
Fig 14. Mt Watson Project Summary
FY05 FY06 FY07 FY08
Tonnes to heaps Mt 0.4 1.6 1.6
Grade % Cu 1.1 1.1 1.1
Recovery % 88 88 88
Cathode produced Kt 3.4 15.5 15.5
Revenue $M 12.8 46.3 42.7
EBITDA $M 7.4 21.6 17.6
Depreciation $M 1.6 3.3 3.3
EBIT $M 5.8 18.4 14.3
LME Copper price US$/lb 1.28 0.95 0.88
Cash Operating costs US$/lb 0.51 0.51 0.51
Capex $M 31.0 0.2 0.2
NPV (12.1% discount rate) $M 31.1
Source: Aegis

Matrix Metals Limited July 2004
page 21 of 32 Copyright © 2004 by Aegis Equities Holdings Pty Limited. All Rights Reserved.
Landowner Agreements Matrix has been building a relationship and negotiating Indigenous Land Use Agreements
(ILUAs) with the local communities, the Kalkadoon People and the Mitakoodi People since the inception of the Company in mid 2000.
The Kalkadoon People are the recognised traditional owners of the area covering the Mt Cuthbert area and a portion of the White Range project area, with the Mitakoodi people also being traditional owners in the White Range area.
In 2003, two milestone agreements with the Kalkadoon People were successfully concluded and are now in force and fully operational. The working provisions of these ILUAs provide for the granting of Mining Leases and certain Exploration Permits in the Mt Cuthbert region including the prospects in the Mt Earl and Mt Watson areas. The first result arising from the workings of the ILUA was the granting of the Mt Watson Mining Lease in mid 2003.
At the White Range Project area negotiations were initiated in 2003 with the Mitakoodi Peoplein regard to the granting of the mining lease for the Greenmount deposit. A native title agreement was signed on the 8th October 2003, with the Greenmount Mining Lease now granted.
Matrix is continuing to work with the Kalkadoon People and other interested native title parties to ensure access to land is secured on an ongoing long term basis.
The greater White Range Project area straddles the boundary between the Kalkadoon and Mitakoodi native title claim areas and in recognition of this, MRX has commenced negotiationson a new tripartite ‘area’ agreement to address the long term situation. The object is to secure an agreement between MRX and the two indigenous groups providing for the granting of all exiting and future tenure applications within the overall White Range area. The development of White Range is not dependent on this agreement.
Matrix has adopted a very proactive, pragmatic and the Company believes, progressive stance on this important issue. The Company believes the relationships that have been built and the milestone native title outcomes that have been achieved are testament to the merit of the approach taken.

Matrix Metals Limited July 2004
page 22 of 32 Copyright © 2004 by Aegis Equities Holdings Pty Limited. All Rights Reserved.
5. Copper and Currency Outlook
Prices The two principal pricing variables relevant to MRX are the copper price (in USD) and the
AUD/USD exchange rate. The final product in MRX’s SX/EW production process is 99.99% pure cathode copper which is priced in US dollars against the benchmark LME prices. Our forecasts for these two variables are as follows:
Fig 15. Assumptions
FY03A FY04A FY05F FY06F FY07F FY08F
Copper Price (LME, US$/t) 1,598 2,297 2,811 2,811 2,094 1,929
Copper Price (LME, US$/lb) 0.73 1.04 1.28 1.28 0.95 0.88
Exchange Rate (USD/AUD) 0.59 0.73 0.72 0.70 0.70 0.70
Source: Aegis
The copper price has risen sharply over the past 2 years in response to an increase in global
demand, major growth in Chinese demand and little in the way of new production following a long period of limited exploration, discovery or mine development. The inevitable result of these trends was to see stockpiles fall to historically low levels and prices rise dramatically. It has been a similar story for all base metals.
The LME copper price has doubled from US$1500/t in mid 2002 to over $3000/t in April this year. The move in A$ copper prices has not been as dramatic due to the strengthening of the local currency, although it has still increased 60% from a low point of $2500/t in June 2003 and remains near its recent high of $4000/t.
LME stocks have come down from 1.0Mt to 100,000t over the past two years to critical levels.
We expect the currency to stabilize around the 0.70 level over the longer term, consistent with an eventual subsidence in commodity prices.
Fig 16. Copper Price & Stockpiles
100,000
250,000
400,000
550,000
700,000
850,000
1,000,000
Jan-01 Nov-01 Aug-02 Jun-03 Apr-04
$1,250
$1,500
$1,750
$2,000
$2,250
$2,500
$2,750
$3,000
$3,250
LME Inventories (t) Copper Price (US$/t)
Source: Aegis
Matrix Metals Limited July 2004
page 23 of 32 Copyright © 2004 by Aegis Equities Holdings Pty Limited. All Rights Reserved.
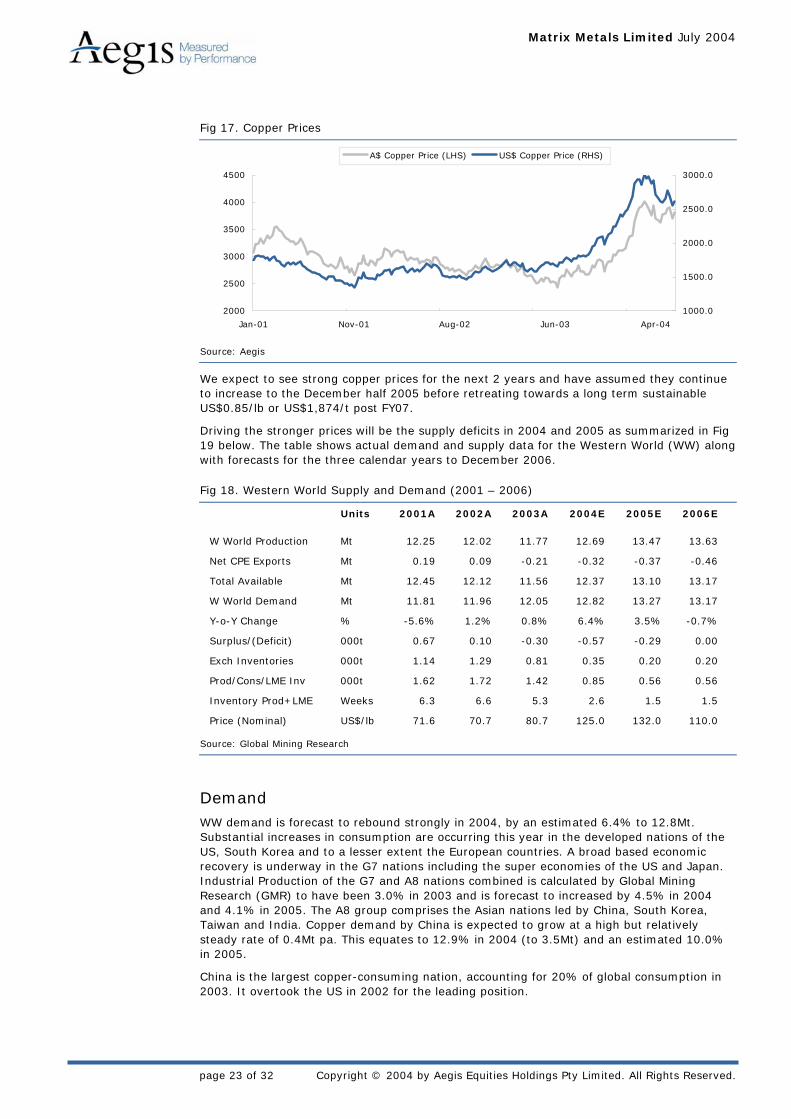
Fig 17. Copper Prices
2000
2500
3000
3500
4000
4500
Jan-01 Nov-01 Aug-02 Jun-03 Apr-04
1000.0
1500.0
2000.0
2500.0
3000.0
A$ Copper Price (LHS) US$ Copper Price (RHS)
Source: Aegis
We expect to see strong copper prices for the next 2 years and have assumed they continue to increase to the December half 2005 before retreating towards a long term sustainable US$0.85/lb or US$1,874/t post FY07.
Driving the stronger prices will be the supply deficits in 2004 and 2005 as summarized in Fig 19 below. The table shows actual demand and supply data for the Western World (WW) alongwith forecasts for the three calendar years to December 2006.
Fig 18. Western World Supply and Demand (2001 – 2006)
Units 2001A 2002A 2003A 2004E 2005E 2006E
W World Production Mt 12.25 12.02 11.77 12.69 13.47 13.63
Net CPE Exports Mt 0.19 0.09 -0.21 -0.32 -0.37 -0.46
Total Available Mt 12.45 12.12 11.56 12.37 13.10 13.17
W World Demand Mt 11.81 11.96 12.05 12.82 13.27 13.17
Y-o-Y Change % -5.6% 1.2% 0.8% 6.4% 3.5% -0.7%
Surplus/(Deficit) 000t 0.67 0.10 -0.30 -0.57 -0.29 0.00
Exch Inventories 000t 1.14 1.29 0.81 0.35 0.20 0.20
Prod/Cons/LME Inv 000t 1.62 1.72 1.42 0.85 0.56 0.56
Inventory Prod+LME Weeks 6.3 6.6 5.3 2.6 1.5 1.5
Price (Nominal) US$/lb 71.6 70.7 80.7 125.0 132.0 110.0
Source: Global Mining Research
Demand WW demand is forecast to rebound strongly in 2004, by an estimated 6.4% to 12.8Mt.
Substantial increases in consumption are occurring this year in the developed nations of the US, South Korea and to a lesser extent the European countries. A broad based economic recovery is underway in the G7 nations including the super economies of the US and Japan. Industrial Production of the G7 and A8 nations combined is calculated by Global Mining Research (GMR) to have been 3.0% in 2003 and is forecast to increased by 4.5% in 2004 and 4.1% in 2005. The A8 group comprises the Asian nations led by China, South Korea, Taiwan and India. Copper demand by China is expected to grow at a high but relatively steady rate of 0.4Mt pa. This equates to 12.9% in 2004 (to 3.5Mt) and an estimated 10.0% in 2005.
China is the largest copper-consuming nation, accounting for 20% of global consumption in 2003. It overtook the US in 2002 for the leading position.

Matrix Metals Limited July 2004
page 24 of 32 Copyright © 2004 by Aegis Equities Holdings Pty Limited. All Rights Reserved.
Fig 19. World Primary Copper Consumption 2003
China20%
USA15%
Japan8%
Germany7%
Sth Korea6%
Italy 4%
Taiwan4%
M exico3%
Russia2%
France3%
Other28%
Source: Global Mining Research
Long term demand growth is expected to sit at a more subdued, but relatively firm 2.7%pa, a continuation of the rate established since 1980. Prior to this time it was a higher 4.0% pa.
Supply Production of primary copper increased substantially in the second half of the 1990s due to
expansion of the major mines in Chile and Indonesia (Grasberg) and the increased number of smaller SX/EW operations throughout the world. It was this rapid expansion that led to oversupply and the low prices that prevailed from 1998-2002.
Total WW supply is expected to increase by a fairly large 0.8Mt or 7.0% in 2004 to 12.4Mt but by lesser amounts over the following two years.
Production increases in the second half of 2004 are looking to be over 400,000t higher that the first with increases expected to come from Grasberg (+193,000t), Escondida (+81,000t), Collahuasi (+76,000t), Olympic Dam (+18,000t), Telfer (+18,000t), Batu Hijau (+12,000t) and Palabora (+10,000t).
Chile remains the largest copper producing country as it has been for some time; it could speak for 19% of world primary production in 2003, comfortably ahead still of China at 11%. Japan maintains a large copper smelting industry, importing concentrates from most of the major mines around the world.
Fig 20. World Primary Copper Production 2003
Chile 19%
China11%
Japan9%
USA9%Russia
6%
Germany 4%
Other30%
Australia3%
Peru3%
Sth Korea 3%
Poland 3%
Source: Global Mining Research
Matrix Metals Limited July 2004
page 25 of 32 Copyright © 2004 by Aegis Equities Holdings Pty Limited. All Rights Reserved.
Copper movements from the former Centrally Planned Economies (CPE) have turned from substantial surpluses into sizeable deficits. The CPEs have become a large source of consumption by the WW producers and in 2004 the net volume crossing into the CPE borders is expected to be some 320,000t. The increasing trend is expected to continue over the next two years.
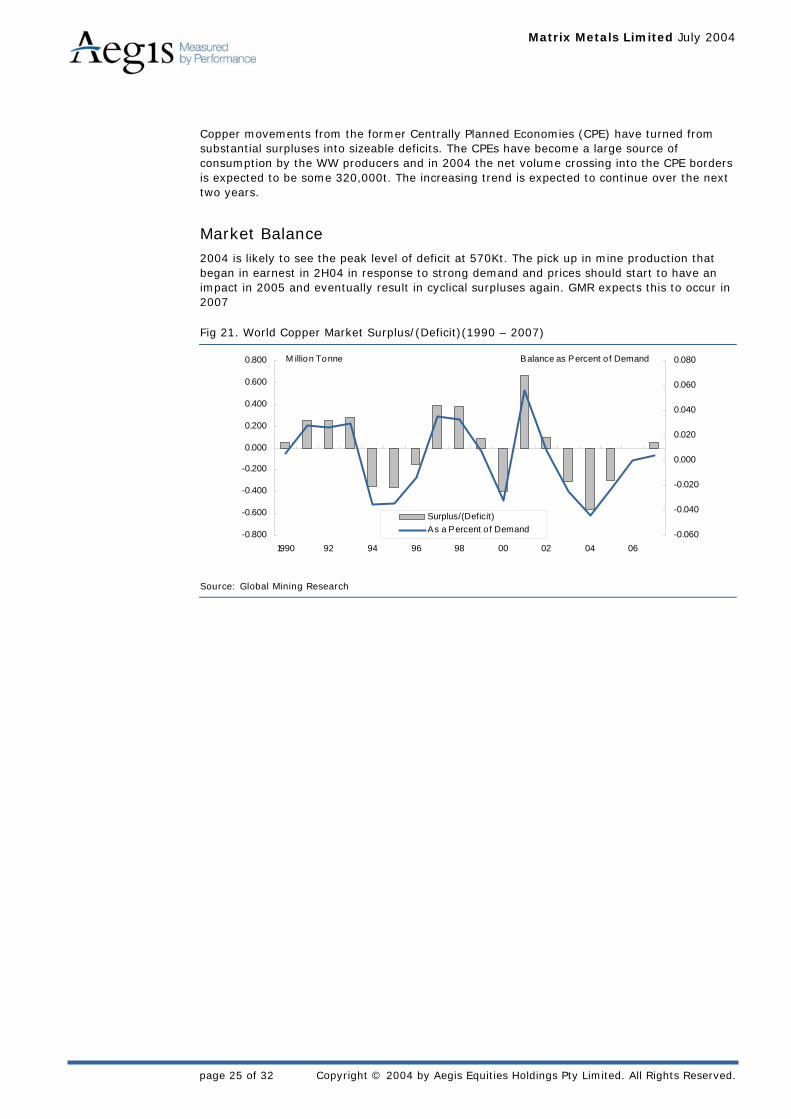
Market Balance 2004 is likely to see the peak level of deficit at 570Kt. The pick up in mine production that
began in earnest in 2H04 in response to strong demand and prices should start to have an impact in 2005 and eventually result in cyclical surpluses again. GMR expects this to occur in 2007
Fig 21. World Copper Market Surplus/(Deficit)(1990 – 2007)
-0.800
-0.600
-0.400
-0.200
0.000
0.200
0.400
0.600
0.800
1990 92 94 96 98 00 02 04 06-0.060
-0.040
-0.020
0.000
0.020
0.040
0.060
0.080
Surplus/(Deficit) As a Percent o f Demand
M illion Tonne Balance as Percent o f Demand
Source: Global Mining Research

Matrix Metals Limited July 2004
page 26 of 32 Copyright © 2004 by Aegis Equities Holdings Pty Limited. All Rights Reserved.
6. Financial Forecasts Our earnings projections for the company (as summarised on Page 27) assume the start up
of the White Range Project but do not include production from the Mt Watson or Mt Cuthbert. The financial position of the company is facing a transformation as indicated by a comparison of the results for FY03 and FY04E with FY05 and FY06 forecasts.
Revenue and earnings Revenues are to be derived from the sale of product from the White Range treatment plant
which will take the form of plates of LME Grade A copper cathode. As was the case for Mt Cuthbert, copper will be priced in US dollars according to the ruling LME Price at the time, or in terms of our modelling at our forecast copper prices.
The project is expected to come on stream at a time of high copper prices which are forecast to generate strong revenues and earnings in the early years of operation. Revenue is forecastto reach $60M in FY06 and decline in subsequent years as a function of the forecast copper price.
It is likely that financing of the project will require hedging of the A$ value of the copper pricebut we have not assumed any hedging in our forecasts.
The Base Case has production climbing to full capacity in the June Half 2006 of 15,000t, allowing for the leach cycle time. The discovery of additional ore reserves which is likely to be the case, may result in higher production that the Base Case. The quick ramp up in pre tax profit to the heights of $23.2M in FY06 (Fig 22) should lead to very strong after tax profits of $22.8m or 4.0 cps. Existing tax losses will negate tax in FY05 and FY06.
Finance MRX is well advanced on discussions with a number of parties for the provision of debt
funding for White Range. We would imagine that a robust project like White Range would attract keen interest from financiers. We have assumed 60% or $17M of the $28M estimated capital cost of the project, will be sought as project debt.
Cash Flow Significant operating cash flow of $23M is forecast to be generated in FY06 from White Range
and this will assist the development of a second major project at Mt Watson. Our projections show that funds will be available for the development of a geared Mt Watson as well as healthy ongoing exploration and tenement acquisition activities.
Dividend payments are not in focus at the present time. The company’s prime strategy is to develop its existing copper resources and seek acquisitions, rather then to look to return funds to shareholders. This may change if super profits are registered, in excess of our predictions in circumstances, for instance, of higher copper prices and or new mineral discoveries.
Balance Sheet MRX has a strong balance sheet at this stage of its evolution, courtesy of prudent operational
and financial management during the difficult years and the ability to attract equity funds in recent times. Cash at the end of June 2004 is estimated at $21.0M.
Over the next 12 months cash levels will be reduced, in the absence of further corporate fundraising, as planned activities are carried out. If all goes to plan, FY06 will be the beginning of a new era as revenues build, operating earnings quickly emerge and net assets increase substantially.

Matrix Metals Limited July 2004
page 27 of 32 Copyright © 2004 by Aegis Equities Holdings Pty Limited. All Rights Reserved.
Fig 22. Profit & Loss, Cash Flow, Balance Sheet Projections ($M)
FY03A FY04E FY05F FY06F FY07F
Sales Revenue 1.0 0.4 4.5 60.0 46.2
EBIT -2.8 -2.9 1.9 24.5 12.7
Net Interest expense 0.0 0.4 0.8 -1.3 1.4
Pre-tax profit (pre abn's) -2.8 -2.5 2.7 23.2 14.1
Tax expense 0.0 0.0 -0.1 -0.4 -3.0
Net profit after tax -2.8 -2.5 2.6 22.8 11.0
EPS (cents) -1.0 -0.6 0.5 4.0 1.9
Cash Flow FY03A FY04E FY05F FY06F FY07F
Operating Cashflow -3.2 -2.2 2.4 23.1 16.2
Required capex -0.5 -2.1 -28.5 -0.2 -0.4
Acquisitions / capex -1.3 -2.1 -0.5 -0.5 -0.5
Free cashflow -4.9 -6.4 -26.6 22.4 15.3
Debt increase/(reduction) -0.7 -14.9 26.6 -22.4 -17.1
Equity 7.0 25.2 0.0 0.0 1.8
Net cash flow 1.4 3.9 0.0 0.0 0.0
Balance Sheet FY03A FY04E FY05F FY06F FY07F
Cash & short term deposits 2.3 21.0 0.0 16.8 33.9
Total assets 14.8 36.3 44.5 62.8 76.4
Current borrowings 0.0 0.0 0.0 0.0 0.0
Non-current borrowings 0.1 0.0 5.6 0.0 0.0
Total liabilities 1.1 0.0 5.7 1.1 1.9
Total shareholders equity 13.7 36.2 38.8 61.6 74.5
Source: Aegis
Matrix Metals Limited July 2004
page 28 of 32 Copyright © 2004 by Aegis Equities Holdings Pty Limited. All Rights Reserved.
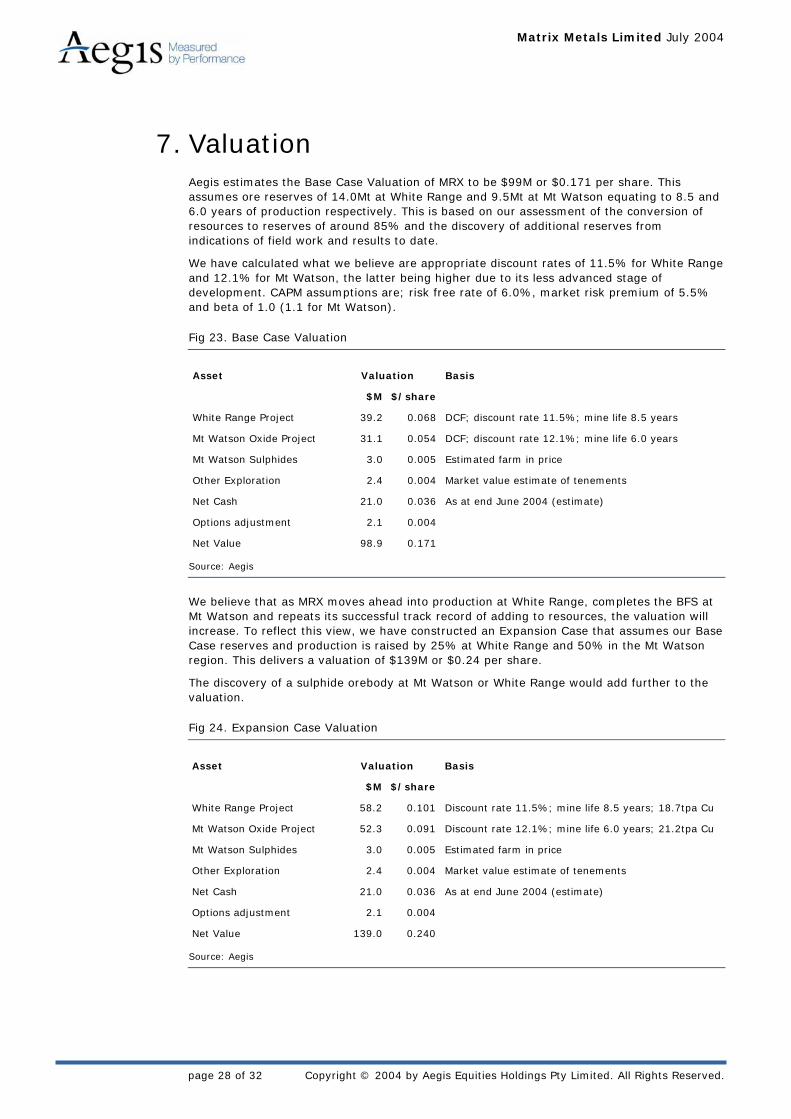
7. Valuation Aegis estimates the Base Case Valuation of MRX to be $99M or $0.171 per share. This
assumes ore reserves of 14.0Mt at White Range and 9.5Mt at Mt Watson equating to 8.5 and 6.0 years of production respectively. This is based on our assessment of the conversion of resources to reserves of around 85% and the discovery of additional reserves from indications of field work and results to date.
We have calculated what we believe are appropriate discount rates of 11.5% for White Range and 12.1% for Mt Watson, the latter being higher due to its less advanced stage of development. CAPM assumptions are; risk free rate of 6.0%, market risk premium of 5.5% and beta of 1.0 (1.1 for Mt Watson).
Fig 23. Base Case Valuation
Asset Valuation Basis
$M $/share
White Range Project 39.2 0.068 DCF; discount rate 11.5%; mine life 8.5 years
Mt Watson Oxide Project 31.1 0.054 DCF; discount rate 12.1%; mine life 6.0 years
Mt Watson Sulphides 3.0 0.005 Estimated farm in price
Other Exploration 2.4 0.004 Market value estimate of tenements
Net Cash 21.0 0.036 As at end June 2004 (estimate)
Options adjustment 2.1 0.004
Net Value 98.9 0.171
Source: Aegis
We believe that as MRX moves ahead into production at White Range, completes the BFS at Mt Watson and repeats its successful track record of adding to resources, the valuation will increase. To reflect this view, we have constructed an Expansion Case that assumes our Base Case reserves and production is raised by 25% at White Range and 50% in the Mt Watson region. This delivers a valuation of $139M or $0.24 per share.
The discovery of a sulphide orebody at Mt Watson or White Range would add further to the valuation.
Fig 24. Expansion Case Valuation
Asset Valuation Basis
$M $/share
White Range Project 58.2 0.101 Discount rate 11.5%; mine life 8.5 years; 18.7tpa Cu
Mt Watson Oxide Project 52.3 0.091 Discount rate 12.1%; mine life 6.0 years; 21.2tpa Cu
Mt Watson Sulphides 3.0 0.005 Estimated farm in price
Other Exploration 2.4 0.004 Market value estimate of tenements
Net Cash 21.0 0.036 As at end June 2004 (estimate)
Options adjustment 2.1 0.004
Net Value 139.0 0.240
Source: Aegis

Matrix Metals Limited July 2004
page 29 of 32 Copyright © 2004 by Aegis Equities Holdings Pty Limited. All Rights Reserved.
The sensitivity analysis on our Base Case Valuation highlights the upside (and possible
downside) to the valuation due to changes in the main variables. The valuation is particularly sensitive to copper price and exchange rate forecasts but also has high leverage to increases in reserves/production.
Fig 25. Sensitivity analysis
Factor Variance (+/-) $M $/share % Base Case (+/-)
Resource/Production 10% 110.7 0.205 20%
Copper Price 10% 128.0 0.237 38%
Exchange rate 10% 127.0 0.235 37%
Cash operating costs 10% 116.7 0.216 26%
Source: Aegis

Matrix Metals Limited July 2004
page 30 of 32 Copyright © 2004 by Aegis Equities Holdings Pty Limited. All Rights Reserved.
This page has been intentionally left blank

Matrix Metals Limited July 2004
page 31 of 32 Copyright © 2004 by Aegis Equities Holdings Pty Limited. All Rights Reserved.
Peter Leodaritsis Managing Director Phone: 61 2 8296 1100 [email protected]
Vince Gordon Chief Operating Officer Phone: 61 2 8296 1155 [email protected]
David Brownie Head of Business Development Phone: 61 2 8296 1108 [email protected]
Damien Klassen Head of Retail Equities Phone: 61 2 8296 1104 [email protected]
Johan Hedstrom Head of Research Phone: 61 2 8296 1157 [email protected]
RESEARCH
RESOURCES
Johan Hedstrom Phone:61 2 8296 1157 [email protected]
Peter Chapman Phone: 61 2 8296 1132 [email protected]
Chris Sabin Phone: 61 2 8296 1156 [email protected]
TELECOMMUNICATIONS, MEDIA & TECHNOLOGY
Ken Fleming Phone: 61 2 8296 1100 [email protected]
Julia Hall Phone:61 2 8296 1100 [email protected]
Rodney Lay Phone:61 2 8296 1106 [email protected]
Eilidh Calderwood Phone:61 2 8296 1162 [email protected]
Shanaz Cassim Phone: 61 2 8296 1130 [email protected]
INDUSTRIALS
Anne Barnett Phone: 61 2 8296 1100 [email protected]
Peter Chilton Phone: 61 2 8296 1127 [email protected]
Anthony Farnham Phone:61 2 8296 1150 [email protected]
Richard Wolff Phone:61 2 8296 1166 [email protected]
Danny Younis Phone: 61 2 8296 1107 [email protected]
DATA SERVICES
Radek Zeleny Phone:61 2 8296 1168 [email protected]
MANAGED INVESTMENTS
Angela Ashton Phone: 61 2 8296 1182 [email protected]
FINANCIALS
Peter Rae Phone:61 2 8296 1151 [email protected]
Peter Leodaritsis Phone:61 2 8296 1101 [email protected]
Ravi Reddy Phone:61 2 8296 1165 [email protected]
PROPERTY TRUSTS
Paul Nielsen Phone: 61 2 8296 1113 [email protected]
LIFE SCIENCES
John Kessell Phone: 61 2 8296 1152 [email protected]
RESEARCH PRODUCTION
Renata Meleo Phone: 61 2 8296 1129 [email protected]
Sharon Loaiza Phone: 61 2 8296 1131 [email protected]
INFORMATION TECHNOLOGY
Jeremy Ngo Phone:61 2 8296 1154 [email protected]
Steven Ham Phone:61 2 8296 1125 [email protected]
Evan Ferris Phone:61 2 8296 1116 [email protected]
Anderson Lau Phone:61 2 8296 1160 [email protected]
Ian Kennedy Phone:61 2 8296 1122 [email protected]
SALES
David Brownie Business Development Manager Phone: 61 2 8296 1108 [email protected]
Ian Gibson Business Development Manager Phone: 61 2 8296 1100 ian.gibson @aer.com.au
Felicity Peedom Client Service Manager Phone: 61 2 8296 1170 [email protected]
Richard Wolff Institutional Client Manager Phone:61 2 8296 1166 [email protected]
Ken Fleming Business Development Manager Phone: 61 2 8296 1100 [email protected]
Connie Sammut General Enquiries Phone: 61 2 8296 1100 [email protected]

Project1 28/6/04 1:08 PM Page 1
Level 6, 33 York Street Sydney NSW 2000 AustraliaLocked Bag 7 Australia SquareSydney NSW 1215Phone 61 2 8296 1100 Fax 61 2 9299 3777ABN 72 085 293 910www.aer.com.au
AUSTRALIAN
Troy Resources NL
July 2004
A growing gold producer in Australia and Brazil
EQUITIES ANALYSIS
ASX Code (TRY)