project& data understanding
TRANSCRIPT

Project& Data
Understanding

Summary of this lesson
„... the goal of the project understanding phase is to assess the main
objective, the potential benefits, as well as the constraints, assumptions,
and risks”
How do we identify the main objective of a project, and plan the
approach?
*This lesson refers to chapter 3 and part of chapter 4 of the GIDS book
Guide to Intelligent Data Science Second Edition, 2020 2
Content of this lesson
− Some Classic Use Cases
− Project Understanding
− ETL: Extraction, Transformation Loading
− Data Understanding
− Describing your Data
− Finding Patterns
− Finding Models
− Finding Predictors
− A tiny bit of History
− One final word of Warning: Correlation vs. Causality
Guide to Intelligent Data Science Second Edition, 2020 3
Some Classic Use Cases
Guide to Intelligent Data Science Second Edition, 2020 4

Churn Prediction
− Churn Prediction: will a customer quit the contract?
Model
CRM SystemData about your customer▪ Demographics▪ Behavior▪ Revenues
▪ Churn Prediction▪ Upselling Likelihood▪ Product Propensity /NBO▪ Campaign Management▪ Customer Segmentation▪ …
Guide to Intelligent Data Science Second Edition, 2020 5

Customer Segmentation
− Customer Segmentation: which groups of customers am I serving?
Model
CRM SystemData about your customer▪ Demographics▪ Behavior▪ Revenues
▪ Churn Prediction▪ Upselling Likelihood▪ Product Propensity /NBO▪ Campaign Management▪ Customer Segmentation▪ …
Guide to Intelligent Data Science Second Edition, 2020 6
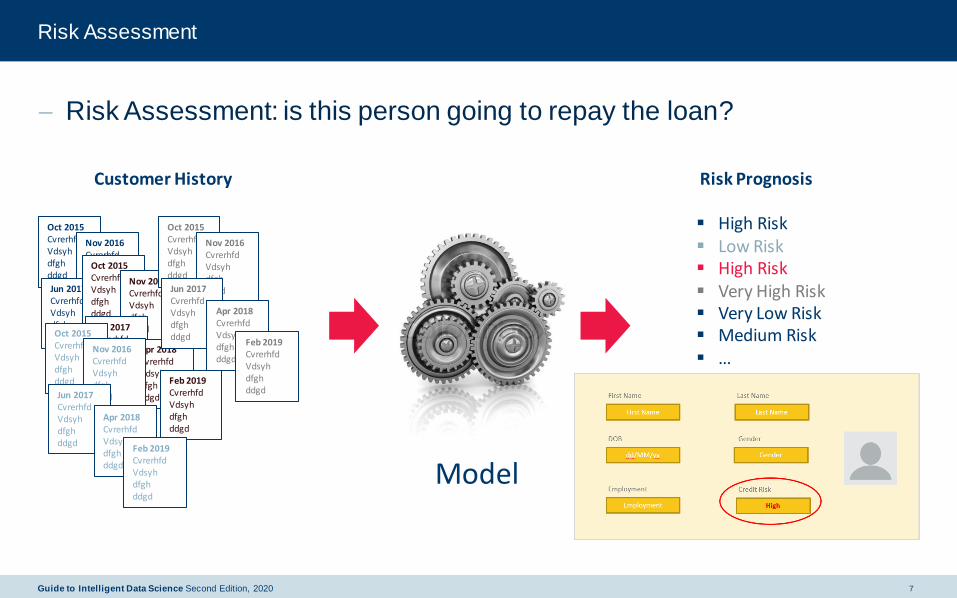
Risk Assessment
− Risk Assessment: is this person going to repay the loan?
Model
Oct 2015CvrerhfdVdsyhdfghddgd
Nov 2016CvrerhfdVdsyhdfghddgdJun 2017
CvrerhfdVdsyhdfghddgd
Apr 2018CvrerhfdVdsyhdfghddgd
Feb 2019CvrerhfdVdsyhdfghddgd
Customer History
Oct 2015CvrerhfdVdsyhdfghddgd
Nov 2016CvrerhfdVdsyhdfghddgdJun 2017
CvrerhfdVdsyhdfghddgd
Apr 2018CvrerhfdVdsyhdfghddgd
Feb 2019CvrerhfdVdsyhdfghddgd
Oct 2015CvrerhfdVdsyhdfghddgd
Nov 2016CvrerhfdVdsyhdfghddgdJun 2017
CvrerhfdVdsyhdfghddgd
Apr 2018CvrerhfdVdsyhdfghddgd
Feb 2019CvrerhfdVdsyhdfghddgd
Oct 2015CvrerhfdVdsyhdfghddgd
Nov 2016CvrerhfdVdsyhdfghddgdJun 2017
CvrerhfdVdsyhdfghddgd
Apr 2018CvrerhfdVdsyhdfghddgd
Feb 2019CvrerhfdVdsyhdfghddgd
▪ High Risk▪ Low Risk▪ High Risk▪ Very High Risk▪ Very Low Risk▪ Medium Risk▪ …
Risk Prognosis
Guide to Intelligent Data Science Second Edition, 2020 7

Demand Prediction
− How many taxis do I need in NYC on Wednesday at noon?
− Or how many kW will be required tomorrow at 6am in London?
− Or how many customers will come tonight to my restaurant?
Model
Guide to Intelligent Data Science Second Edition, 2020 8

Recommendation Engines / Market Basket Analysis
− Recommendation Engines: People who bought this item were often
interested in this other items.
Model
Recommendation
IF ➔
Guide to Intelligent Data Science Second Edition, 2020 9

Fraud Detection
− Fraud Detection: Is this transaction legitimate or is it a fraud?
Transactions▪ Trx 1▪ Trx 2▪ Trx 3▪ Trx 4▪ Trx 5▪ Trx 6▪ …
Suspicious Transaction
Model
Guide to Intelligent Data Science Second Edition, 2020 10

Sentiment Analysis
− Sentiment Analysis: how can I know what people are thinking?
Guide to Intelligent Data Science Second Edition, 2020 11

Anomaly Detection
Predicting mechanical failure as late as possible but before it happens
Only some Spectral Time Series show the break down
A1-SV3 [0, 100] Hz
A1-SV3 [500, 600] HzBreaking point
July 21, 2008
31 August 2007
Training Set
Predictive
Maintenance
via REST
Guide to Intelligent Data Science Second Edition, 2020 12

Compound Search
Are there other compounds having this substructure and being a dopaminergic antagonist?
Guide to Intelligent Data Science Second Edition, 2020 13

Project Understanding
Guide to Intelligent Data Science Second Edition, 2020 14

Determine the Project Objective
− What is the primary objective?
− What are the criteria for success?
− These are difficult to define
− The project owner & the analysis speak different languages
Problem source Project owner perspective Analyst perspective
Communication Project owner does not understand the technical terms of the analyst
Analyst does not understand the terms of the domain of the project owner
Lack of understanding Project owner was not sure what the analyst could do or achieveModels of analyst were different from what the project owner envisioned
Analyst found it hard to understand how to help the project owner
Organization Requirements had to be adopted in later stages as problems with the data became evident
Project owner was an unpredictable group (not so concerned with the project)
Guide to Intelligent Data Science Second Edition, 2020 15

Cognitive maps
− Tool to sketch
− Beliefs
− Experiences
− Known factors
− How they influence
each other
Guide to Intelligent Data Science Second Edition, 2020 16

Cognitive maps
− How often will a certain
product be found in a
basket?
− Directly influenced by
factors around it
− E.g., affordability
− Indirectly influenced by
other factors
− E.g., size of household
− Postive or negative
correlation
Guide to Intelligent Data Science Second Edition, 2020 17

Clarifying the Primary Objectives
− Once the solution is identified
− Explore advantages & disadvantages
− Is the goal
− Precise enough?
− Actionable?
Objective Increase revenues (per campaign and/or per customer) in direct mailing campaigns by personalized offer and individual customer selection
Deliverable Software that automatically selects a specified number of customers from the database to whom the mailing shall be sent, runtime max. half-day for database of current size
Success criteria Improve order rate by 5% or total revenues by 5%, measured within 4 weeks after mailing was sent, compared to rate of last 3 mailings
Guide to Intelligent Data Science Second Edition, 2020 18

Assess the Situation
− Will this be a successful data analysis project?
− Examine the following:
− Requirements and constraints− Model requirements (e.g., explanatory model)
− Ethical, political, and legal issues (e.g., must exclude gender, race, and/or age)
− Technical constrains
− Assumptions− Representativeness (the sample represents the whole population)
− Informativeness (influencing factors should be included in the model)
− Good data quality
− Presence of external factors
Guide to Intelligent Data Science Second Edition, 2020 19

Determine Analysis Goals
Select models and techniques with the following properties
− Interpretability
− The model can be understood / interpreted
− Reproducibility / stability
− Similar model performance every time the analysis is carried out
− Model flexibility / adequacy
− The model can adapt to more complicated situations
− Runtime
− Strict runtime requirements may limit computationally intensive approaches
− Interestingness / use of expert knowledge
− Experts may already know the finings from the analysis
Guide to Intelligent Data Science Second Edition, 2020 20
ETL: Extraction,
Transformation,
Loading
Guide to Intelligent Data Science Second Edition, 2020 21

ETL
Getting the data in not always easy:
− Different resources: flat files, different databases, excel spreadsheets, ...
− Integration is cumbersome: Missing/not unique IDs, wrong entries, ...
− Sometimes also privacy concerns (not all data in one location)
Data needs to be transformed:
− Type conversions
− Missing value correction/clean up/imputation
− Generation of new values (e.g. convert year of birth into age)
Guide to Intelligent Data Science Second Edition, 2020 22

ETL
− Three files:
− customers,
− products,
− shopping baskets.
− Can we load these file and create a new attribute “age”?
− Can we find out:
− how often each customer went shopping
− how much (s)he bought together (and on average)
Guide to Intelligent Data Science Second Edition, 2020 23

Data Loading and Preprocessing
− Database issues
− More details regarding pre-processing later:
− Normalization
− Binning
− Feature (and Data!) Reduction
− ...
The 80% RuleOver 80% of data analysts’ time is spent on loading and cleaning data.
Guide to Intelligent Data Science Second Edition, 2020 24

Data Understanding
Guide to Intelligent Data Science Second Edition, 2020 25

Data understanding
− Goal of the Data Understanding phase
− Gain general insights about the data that will potentially be helpful for the further steps in the data analysis process
− Reasons
− Never trust any data as long as you have not carried out some simple
plausibility checks.
− Results
− At the end of the data understanding phase, we know much better whether
the assumptions we made during the project understanding phase concerning representativeness, informativeness, data quality, and the presence or
absence of external factors are justified
Guide to Intelligent Data Science Second Edition, 2020 26

Attribute Understanding
− Data can usually be described in
terms of table or matrices
− Sometimes data are spread among different table that need to be
joined
No Sex Age Blood pr. Height Drug
1 male 20 normal 175,0 A
2 female 73 normal 172,2 B
3 female 37 high 163,8 A
4 male 33 low 171,4 B
5 female 48 high 165,9 A
6 male 29 normal 182,3 A
7 female 52 normal 167,2 B
8 male 42 low 177,2 B
9 male 61 normal 168,4 B
10 female 30 normal 174,9 A
Instances, records,
data objects, entries…
Attributes, features,
variables…
Guide to Intelligent Data Science Second Edition, 2020 27

Attribute Understanding
− Attributes differ for their scale type,
according to the type of values that
they can assume
− Three scale types:
• Categorical / Nominal
• Ordinal
• Numeric
No Sex Age Blood pr. Height Drug
1 male 20 normal 175,0 A
2 female 73 normal 172,2 B
3 female 37 high 163,8 A
4 male 33 low 171,4 B
5 female 48 high 165,9 A
6 male 29 normal 182,3 A
7 female 52 normal 167,2 B
8 male 42 low 177,2 B
9 male 61 normal 168,4 B
10 female 30 normal 174,9 A
NumericCategorical Ordinal
CategoricalNumeric
Guide to Intelligent Data Science Second Edition, 2020 28

Categorical Attributes
− Categorical (or Nominal) attributes have
a finite set of possible values
− Granularity must be taken into account
− Hierarchical structure of the categories
− e.g. shallow subdivision: food, non-food, drinks…
− further subdivision for drinks: water, beer, wine…
− Which level of granularity is appropriate?
− Dynamic Domain
− Some attributes have a fixed domain (e.g.
months)
− For other attributes the domain can change over
time (e.g. the products in a catalogue)
− Those attributes must be identified and handled
No Sex Age Blood pr. Height Drug
1 male 20 normal 175,0 A
2 female 73 normal 172,2 B
3 female 37 high 163,8 A
4 male 33 low 171,4 B
5 female 48 high 165,9 A
6 male 29 normal 182,3 A
7 female 52 normal 167,2 B
8 male 42 low 177,2 B
9 male 61 normal 168,4 B
10 female 30 normal 174,9 A
Categorical
Categorical
Guide to Intelligent Data Science Second Edition, 2020 29

Ordinal Attributes
− Ordinal attributes have an additional
linear ordering offered by the domain
− The ordering does not provide the
distance between two object
− e.g. for an attribute containing university degrees, we can state that a Ph.D is an
higher degree than a M.Sc. and that this is higher than a B.Sc..
No Sex Age Blood pr. Height Drug
1 male 20 normal 175,0 A
2 female 73 normal 172,2 B
3 female 37 high 163,8 A
4 male 33 low 171,4 B
5 female 48 high 165,9 A
6 male 29 normal 182,3 A
7 female 52 normal 167,2 B
8 male 42 low 177,2 B
9 male 61 normal 168,4 B
10 female 30 normal 174,9 A
Ordinal
Guide to Intelligent Data Science Second Edition, 2020 30
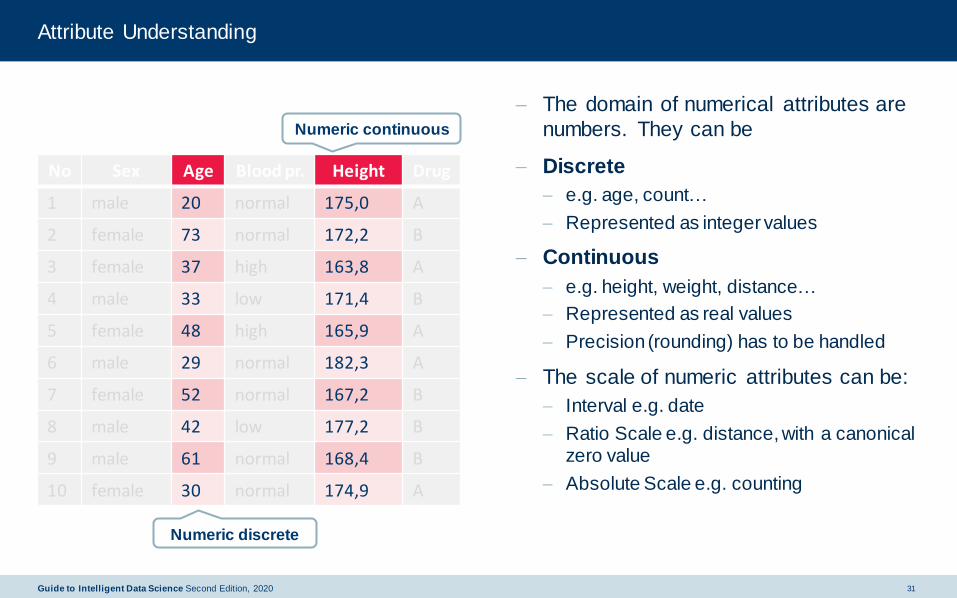
Attribute Understanding
− The domain of numerical attributes are
numbers. They can be
− Discrete
− e.g. age, count…
− Represented as integer values
− Continuous
− e.g. height, weight, distance…
− Represented as real values
− Precision (rounding) has to be handled
− The scale of numeric attributes can be:
− Interval e.g. date
− Ratio Scale e.g. distance, with a canonical zero value
− Absolute Scale e.g. counting
No Sex Age Blood pr. Height Drug
1 male 20 normal 175,0 A
2 female 73 normal 172,2 B
3 female 37 high 163,8 A
4 male 33 low 171,4 B
5 female 48 high 165,9 A
6 male 29 normal 182,3 A
7 female 52 normal 167,2 B
8 male 42 low 177,2 B
9 male 61 normal 168,4 B
10 female 30 normal 174,9 A
Numeric continuous
Numeric discrete
Guide to Intelligent Data Science Second Edition, 2020 31

Data Quality
− Data quality refers to how well the data fit their intended use
− There are various data quality dimensions
• Accuracy
• Completeness
• Unbalanced Data
• Timeliness
Garbage in, garbage out
Guide to Intelligent Data Science Second Edition, 2020 32

Accuracy
Syntactic
− The value might not be correct but it
belongs at least to the domain of the
corresponding attribute
− Easy to spot: verify values lying in
the domain
Semantic
− The value might be in the domain of
the corresponding attribute, but it is
not correct
− Hard or impossible to spot: double
check with other sources or check
“business rules”
Accuracy is defined as the closeness between the value in the data and
the true value.
e.g. “fmale” for the attribute Gender
and “-15” for the attribute Weight
violate the syntactic accuracy
e.g. “2090” for the attribute
YearOfBirth is (at least at the moment)
surely incorrect, therefore violates the
semantic accuracy
Guide to Intelligent Data Science Second Edition, 2020 33

Completeness
− Completeness with respect to attributes
− All the attributes have a value associated
− i.e. Missing Values (coming soon in next lessons)
− Missing values might not always be explicitly marked
− Completeness with respect to records
− The data set contains the necessary information required for the analysis
− Some rows might have been lost for various reasons (e.g. during DB migration)
− Sometimes data about a certain situation simply does not exist (e.g. data
about a failure that has never –yet- occurred)
− It is hard to obtain a reasonably wide dataset containing all the possible
combinations of data
Guide to Intelligent Data Science Second Edition, 2020 34

Unbalanced Data and Timeliness
Unbalanced Data
− Data regarding a certain situation might be underrepresented
− E.g. machine quality control: parts produced with flaws are – hopefully –
lower than the correct ones, therefore the corresponding data will be
way less
Timeliness
− Available data are too old to provide up to date information
− Often a problem in dynamically changing domains, where older data
might indicate trends that have vanished
Guide to Intelligent Data Science Second Edition, 2020 35

Describing your Data
Guide to Intelligent Data Science Second Edition, 2020 36
Looking at the Data
Familiarize yourself with the data
− Identify trends
− strange patterns
− outliers
− ...
Types of views
− Basic Statistics
− 1D: Histograms
− 2D: Scatterplots, Scatter Matrix, Multi Dimensional Scaling
− 3D Scatterplots
− 3D: Parallel Coordinates
Guide to Intelligent Data Science Second Edition, 2020 37

Visual Inspection: Example
− Let’s look at our data
− Can we find some connections between age and shopping cart size?
− Anything else that looks a bit odd? (...the age distribution, maybe?)
− Visualizations are a good way for first sanity checks
− Interactivity on a plot or among plots is very helpful
Guide to Intelligent Data Science Second Edition, 2020 38
Simple Descriptors
− Simple statistical descriptors, such as:
− range
− mean/median
− standard deviation
− nominal values and their frequencies
− ...
− can help to sanity check your data (and find dependencies that
otherwise might surprise you quite a bit afterwards!)
− Can we look at the range and other simple 1D descriptors?
− How about 2D correlations between attributes?
Guide to Intelligent Data Science Second Edition, 2020 39

Finding Patterns
Guide to Intelligent Data Science Second Edition, 2020 40

Finding Patterns
− Finding (significant?) patterns in data may reveal interesting
connections:
− Global patterns: groups of customers or products
− Clusters
− Local patterns: connections between products, sub populations of
customers (recommendation engines!)
− Subgroups
− Association Rules
Guide to Intelligent Data Science Second Edition, 2020 41
Example
− Can we find groups of similar customers?
− (and what does similarity mean, anyway?)
− Similarity
− Finding the right similarity metric is an art.
− (and what is a cluster anyway?)
− Distance based methods in high dimensions offer all sorts of interesting
surprises...
Guide to Intelligent Data Science Second Edition, 2020 42

KNIME workflow
− Screenshot of KNIME workflow with clustering
Guide to Intelligent Data Science Second Edition, 2020 43

Finding Models
Guide to Intelligent Data Science Second Edition, 2020 44

Finding Models
− Deriving models that describe (aspects of) the data:
− Rules
− Trees
− Typical (or really odd!) examples
− ...
− Models attempt to describe what is going on in the system that
“generated” the data.
− Example:
− Can we find a decision tree describing why certain customers buy so much?
Guide to Intelligent Data Science Second Edition, 2020 45

KNIME workflow
− Screenshot of KNIME workflow with decision tree
Guide to Intelligent Data Science Second Edition, 2020 46

Finding Predictors
Guide to Intelligent Data Science Second Edition, 2020 47

Finding Predictors
− Sometimes we want to find a model which we can use to later predict
the target variable(s):
− Predict future shopping behaviour
− Predict credit risk
− Predict activity of a chemical compound
− Predict tomorrow’s weather, stock market, ...
− And we may not care too much about actually understanding the model
itself.
Guide to Intelligent Data Science Second Edition, 2020 48

Brute Force Predictors
Brute Force Predictors
Very simple: look at your closest neighbour− Case based reasoning works that way
− Depends heavily on your distance function
− Does not work well with outliers/noise
Slightly better: look at a few of your neighbors− K Nearest Neighbor
− Works pretty well
− But pretty expensive to compute...
Even better: look at all neighbors, but weight them− Weighted K Nearest Neighbor
− Works even better
− Even more expensive...
Guide to Intelligent Data Science Second Edition, 2020 49

Other Predictors
− Decision Trees, Rules, ... (all of our models!)
− (Naïve) Bayes Classifiers
− Regression
− (Artificial) Neural Networks
− Support Vector Machines (Kernel Methods)
Guide to Intelligent Data Science Second Edition, 2020 50
Finding Predictors: Example
Can we predict the size of shopping-cart?
− Brute force: look at a (few) neighbor(s).
− Use our decision tree?...
What’s wrong with that approach?
Guide to Intelligent Data Science Second Edition, 2020 51

KNIME workflow
− Screenshot of KNIME workflow with a neural network
Guide to Intelligent Data Science Second Edition, 2020 52

Data Mining Systems
What kind of systems do we need?
− easy to use (also by non Data Mining Expert!)
− simple knowledge representation (understandable!)
− mergers of disciplines (machine learning, stats, databases, ...)
− (partial) automation of feedback (“Intelligent” Data Science!)
− quick turn-around (interactive!)
Guide to Intelligent Data Science Second Edition, 2020 53

A tiny bit of History
Guide to Intelligent Data Science Second Edition, 2020 54

History: Classical Data Analysis
− History: Classical Data Analysis
− Small, usually manually recorded data sets
− Calculation of correlation measures and statistical significance
measures.
− Calculations done with minimal to no compute support.
− Calculations later supported by basic calculation equipment
Guide to Intelligent Data Science Second Edition, 2020 55

History: Table based Analysis
− History: Table based Analysis
− Data points are stored in tables, often recorded in spread sheets
− Simple analyses performed automatically on demand (calculate mean,
add columns, ...)
− Visicalc, ...
Guide to Intelligent Data Science Second Edition, 2020 56

Today: Large Scale Mining
− Today: Large Scale Mining
− Data in various formats and from various sources
− manual analysis impossible
− efficient compute support essential
− analysis still question driven:
− find patterns of this type
− check correlations
− build model to predict this behaviour
Guide to Intelligent Data Science Second Edition, 2020 57
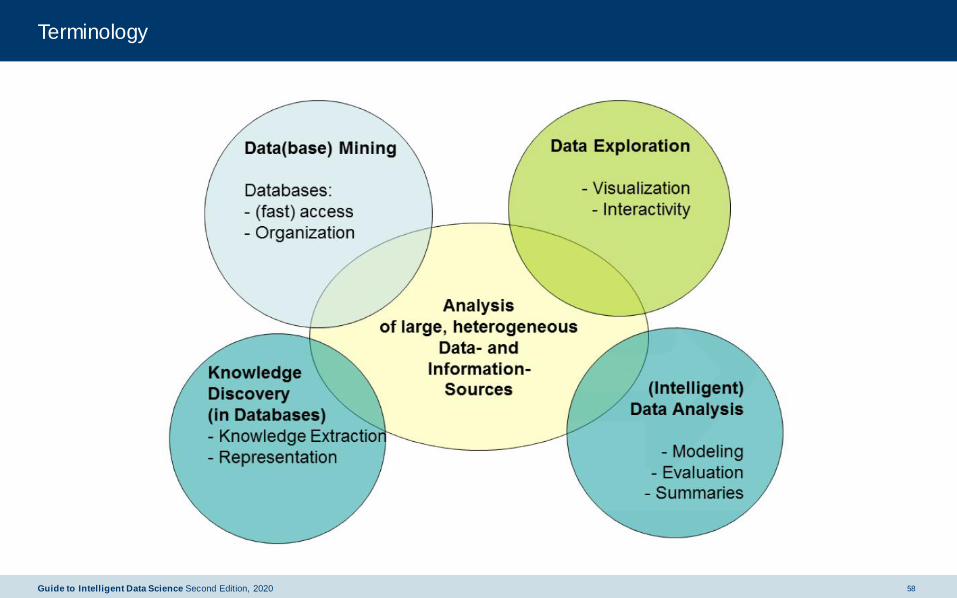
Terminology
Guide to Intelligent Data Science Second Edition, 2020 58

One final Word of Warning
Correlation Causality
Guide to Intelligent Data Science Second Edition, 2020 59

Correlation vs. Causality
Hypothesis: Storks bring babies
And the data?
Guide to Intelligent Data Science Second Edition, 2020 60

Correlation vs. Causality
Hypothesis: Storks bring babies
And the data?
Correlation is significant and positive!
Guide to Intelligent Data Science Second Edition, 2020 61

Hypothesis: Storks bring babies
And the data?
Correlation is significant and positive!
Correlation vs. Causality
Guide to Intelligent Data Science Second Edition, 2020 62

Simpson‘s Paradox
− Should I start smoking to live longer?
− Mortality Rate Study
Died Survived Total Rate
Smokers 139 443 582 23.9%
Non Smokers 230 502 732 31.4%
Total 369 945 1314 28.1%
Credit: http://www.significancemagazine.org/details/webexclusive/2671151/
Guide to Intelligent Data Science Second Edition, 2020 63

Simpson‘s Paradox
Mortality Rates by Age Distribution of Age by
Smoking Status
Credit: http://www.significancemagazine.org/details/webexclusive/2671151/
Simpsons-Paradox-A-Cautionary-Tale-in-Advanced-Analytics.html
Guide to Intelligent Data Science Second Edition, 2020 64

Simpson‘s Paradox
. . . does the overall tax rate go up, while all individual rates go down?
Tax Rate % of total income
Adjusted gross income 1974 1978 1974 1987
Under $5000 0.054 0.035 4.73 1.60
$5000 - $9999 0.093 0.072 16.63 9.89
$10000 - $14999 0.111 0.100 21.89 13.83
$15000 - $99999 0.160 0.159 53.40 69.62
$100000 and more 0.384 0.383 3.34 5.06
Total 0.141 0.152 100 100
Table Credit: Counting for Something by William S. Peters
Guide to Intelligent Data Science Second Edition, 2020 65

Correlation vs. Causality
and what about Chocolate and Nobel prices?
Image Credit: http://www.nejm.org/doi/full/10.1056/NEJMon1211064
Guide to Intelligent Data Science Second Edition, 2020 66

Do not trust your numbers!
Tymans’s Law
Any statistic that appears interesting is almost certainly a mistake.
Guide to Intelligent Data Science Second Edition, 2020 67

Summary
− The different kind of projects− Common Use Cases
− Search strategies
− The steps in project
understanding
− The different kinds of datasets
− The steps in data understanding− ETL
− Describing your Data
− Finding Patterns
− Finding Models
− Finding Predictors
− A tiny bit of History
− Correlation vs. Causality
Guide to Intelligent Data Science Second Edition, 2020 68

Guide to Intelligent Data Science Second Edition, 2020
Thank youGuide to Intelligent Data Science Second Edition, 2020
69