projection of the main macroeconomic indicators · national commission for strategy and prognosis 1...
TRANSCRIPT
NATIONAL COMMISSION FOR STRATEGY AND PROGNOSIS
PRELIMINARY SUMMER FORECAST 2018
PROJECTION OF THE MAIN MACROECONOMIC INDICATORS
2018 - 2022
- Iuly 2018 -
NATIONAL COMMISSION FOR STRATEGY AND PROGNOSIS
1
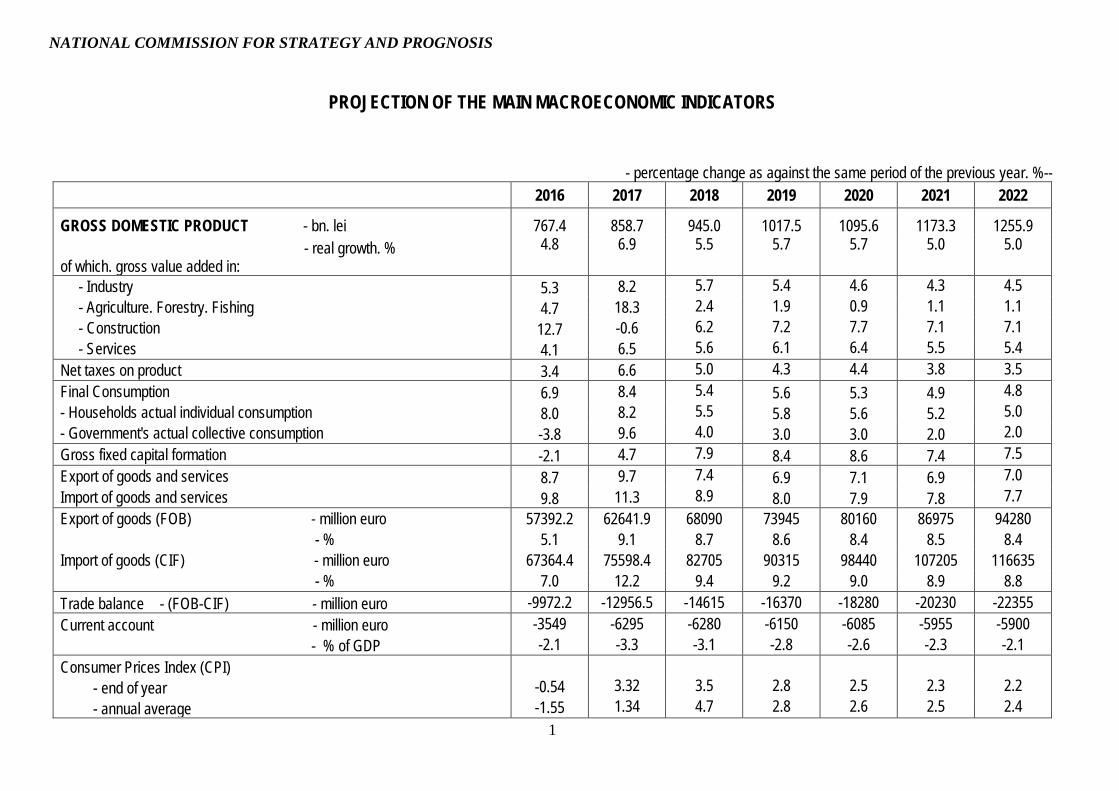
PROJECTION OF THE MAIN MACROECONOMIC INDICATORS
- percentage change as against the same period of the previous year. %-- 2016 2017 2018 2019 2020 2021 2022
GROSS DOMESTIC PRODUCT - bn. lei 767.4 858.7 945.0 1017.5 1095.6 1173.3 1255.9 - real growth. % of which. gross value added in:
4.8 6.9 5.5 5.7 5.7 5.0 5.0
- Industry 5.3 8.2 5.7 5.4 4.6 4.3 4.5 - Agriculture. Forestry. Fishing 4.7 18.3 2.4 1.9 0.9 1.1 1.1 - Construction 12.7 -0.6 6.2 7.2 7.7 7.1 7.1 - Services 4.1 6.5 5.6 6.1 6.4 5.5 5.4 Net taxes on product 3.4 6.6 5.0 4.3 4.4 3.8 3.5 Final Consumption 6.9 8.4 5.4 5.6 5.3 4.9 4.8 - Households actual individual consumption 8.0 8.2 5.5 5.8 5.6 5.2 5.0 - Government's actual collective consumption -3.8 9.6 4.0 3.0 3.0 2.0 2.0 Gross fixed capital formation -2.1 4.7 7.9 8.4 8.6 7.4 7.5 Export of goods and services 8.7 9.7 7.4 6.9 7.1 6.9 7.0 Import of goods and services 9.8 11.3 8.9 8.0 7.9 7.8 7.7 Export of goods (FOB) - million euro 57392.2 62641.9 68090 73945 80160 86975 94280 - % 5.1 9.1 8.7 8.6 8.4 8.5 8.4 Import of goods (CIF) - million euro 67364.4 75598.4 82705 90315 98440 107205 116635 - % 7.0 12.2 9.4 9.2 9.0 8.9 8.8 Trade balance - (FOB-CIF) - million euro -9972.2 -12956.5 -14615 -16370 -18280 -20230 -22355 Current account - million euro -3549 -6295 -6280 -6150 -6085 -5955 -5900 - % of GDP -2.1 -3.3 -3.1 -2.8 -2.6 -2.3 -2.1 Consumer Prices Index (CPI) - end of year -0.54 3.32 3.5 2.8 2.5 2.3 2.2 - annual average -1.55 1.34 4.7 2.8 2.6 2.5 2.4

NATIONAL COMMISSION FOR STRATEGY AND PROGNOSIS
2
2016 2017 2018 2019 2020 2021 2022 GDP Deflator 2.7 4.6 4.3 1.9 1.9 2.0 2.0 Average rate of exchange - lei/euro 4.4908 4.5681 4.65 4.62 4.60 4.58 4.56 Average number of employees - thou pers. 4759.4 4925*) 5138 5335 5530 5725 5907
- % 3.2 3.5*) 4.3 3.8 3.7 3.5 3.2 Number of registered unemployed (at the end of the year) - thou pers 418.2 351.1 347 341 312 325 321 - Registered unemployed rate. at the end of the year - % 4.8 4.0 3.8 3.7 3.4 3.5 3.4 Total employment (AMIGO) - thou pers. 8448.8 8670.3 8890 9030 9140 9240 9330 - % -1.0 2.6 2.5 1.6 1.2 1.1 1.0 Average number of employees (AMIGO) - thou pers. 6200.6 6389.9 6615 6835 7030 7220 7410 - % 2.3 3.1 3.5 3.3 2.9 2.7 2.6 Unemployment ILO (AMIGO) - thou pers. 529.9 449.5 445 440 430 425 420 - unemployment rate (ILO) - % 5.9 4.9 4.8 4.6 4.5 4.4 4.3 Average gross earnings - lei/month 2809 3256*) 4300 4657 5002 5362 5737 - % 9.9 15.9*) - 8.3 7.4 7.2 7.0 Monthly average net earnings - lei/month 2046 2373*) 2650 2873 3088 3313 3549 - % 10.1 16.0*) 11.7 8.4 7.5 7.3 7.1 Real earnings - % 11.8 14.5*) 6.7 5.4 4.8 4.7 4.6 Compensation of employees - % of GDP 34.4 36.0 37.0 38.0 39.1 40.0 40.3 Nominal unit labor cost - % 6.1 9.1 6.4 3.5 3.0 2.7 1.3 Real unit labor cost - % 3.3 4.3 2.0 1.6 1.1 0.7 -0.7 Gross domestic product per capita - lei 38940 43836 48524 52550 56911 61296 65928
- euro 8671 9596 10435 11374 12372 13383 14458 Gross domestic product - bill. euro 170.9 188.0 203.2 220.2 238.2 256.2 275.4 Gross national income - bill. euro 165.7 183.6 198.9 215.8 233.6 251.7 270.7 Potential gross domestic product - % 4.3 4.7 5.2 5.4 5.3 4.9 4.8
*) CNSP estimates based on monthly INS data. Notă: GDP data for 2016 is semifinal (NIS). . and those of 2017 are provisional (prov 2). Data series for the monthly average gross salary earnings up to 2017 are not
comparable to the forecast for the period 2018-2021; the forecast includes the transfer of social security contributions from the employer to the employee.

NATIONAL COMMISSION FOR STRATEGY AND PROGNOSIS
3
GROSS DOMESTIC PRODUCT BY BRANCHES
- Percentage changes as against the previous year. % - 2017 2018 2019 2020 2021 2022
GROSS DOMESTIC PRODUCT 6.9 5.5 5.7 5.7 5.0 5.0 Industry Production 8.5 5.4 5.2 4.5 4.3 4.4 Gross value added 8.2 5.7 5.4 4.6 4.3 4.5
Agriculture. forestry. fishery Production 15.7 2.5 2.0 1.1 1.0 1.0 Gross value added 18.3 2.4 1.9 0.9 1.1 1.1 Construction Production -2.7 6.0 7.0 7.4 7.0 7.0 Gross value added -0.6 6.2 7.2 7.7 7.1 7.1 Total services Production 7.5 6.0 6.3 6.6 5.7 5.5 Gross value added 6.5 5.6 6.1 6.4 5.5 5.4 Total economy Production 7.3 5.6 5.8 5.7 5.1 5.1 Gross value added 7.0 5.5 5.8 5.8 5.1 5.1
Net taxes on product 6.6 5.0 4.3 4.4 3.8 3.5

NATIONAL COMMISSION FOR STRATEGY AND PROGNOSIS
4
GROSS DOMESTIC PRODUCT BY BRANCHES
2017 2018 2019
BRANCHES Volume index
Price value 2016
Price index
Current price value
Volume index
Price value 2017
Price index
Current price value
Volume index
Price value 2018
Price index
Current price value
GROSS DOMESTIC PRODUCT 106.9 820.7 104.6 858.7 105.5 905.7 104.3 945.0 105.7 998.5 101.9 1017.5 Industry
Production 108.5 537.7 104.2 560.1 105.4 590.3 104.0 613.9 105.2 646.1 101.6 656.7 Intermediate consumption 108.7 338.9 103.9 352.2 105.2 370.5 103.9 384.8 105.1 404.6 101.5 410.8 Gross value added 108.2 198.9 104.6 207.9 105.7 219.8 104.3 229.1 105.4 241.5 101.8 245.9 Agriculture. forestry. fishery
Production 115.7 77.1 101.4 78.3 102.5 80.2 105.0 84.2 102.0 85.9 101.5 87.2 Intermediate consumption 113.3 40.3 101.4 40.9 102.6 41.9 104.9 44.0 102.1 44.9 101.3 45.5 Gross value added 118.3 36.9 101.5 37.4 102.4 38.3 105.1 40.3 101.9 41.0 101.7 41.7 Construction
Production 97.3 120.9 107.1 129.4 106.0 137.2 107.0 146.8 107.0 157.1 101.3 159.2 Intermediate consumption 96.0 74.6 106.0 79.1 105.9 83.8 106.8 89.5 107.0 95.7 101.1 96.8 Gross value added 99.4 46.3 108.7 50.3 106.2 53.4 107.3 57.3 107.2 61.4 101.6 62.4 Total services
Production 107.5 828.3 104.2 863.3 106.0 914.7 104.4 955.0 106.3 1015.2 101.9 1035.0 Intermediate consumption 108.7 372.9 102.2 380.9 106.4 405.2 104.1 421.8 106.6 449.5 101.8 457.6 Gross value added 106.5 455.4 105.9 482.4 105.6 509.5 104.6 533.2 106.1 565.7 102.1 577.4 Total economy
Production 107.3 1564.0 104.3 1631.0 105.6 1722.4 104.5 1799.9 105.8 1904.4 101.8 1938.1 Intermediate consumption 107.6 826.6 103.2 853.0 105.7 901.4 104.3 940.1 105.8 994.7 101.6 1010.7 Gross value added 107.0 737.4 105.5 778.0 105.5 821.0 104.7 859.9 105.8 909.7 101.9 927.4 Net taxes on product 106.6 83.3 96.8 80.7 105.0 84.7 100.5 85.1 104.3 88.8 101.4 90.1

NATIONAL COMMISSION FOR STRATEGY AND PROGNOSIS
5
2020 2021 2022
BRANCHES Volume index
Price value 2019
Price index
Current price value
Volume index
Price value 2020
Price index
Current price value
Volume index
Price value 2021
Price index
Current price value
GROSS DOMESTIC PRODUCT 105.7 1075.0 101.9 1095.6 105.0 1150.5 102.0 1173.3 105.0 1231.7 102.0 1255.9 Industry
Production 104.5 686.0 101.7 697.7 104.3 727.4 101.8 740.5 104.4 773.0 101.7 786.3 Intermediate consumption 104.3 428.6 101.7 435.7 104.2 454.1 101.8 462.0 104.3 482.1 101.7 490.1 Gross value added 104.6 257.4 101.8 262.0 104.3 273.3 101.9 278.4 104.5 291.0 101.8 296.2 Agriculture. forestry. fishery
Production 101.1 88.1 101.4 89.4 101.0 90.3 101.3 91.5 101.0 92.4 101.0 93.3 Intermediate consumption 101.2 46.0 101.3 46.6 100.9 47.1 101.2 47.7 100.9 48.1 100.9 48.5 Gross value added 100.9 42.1 101.5 42.7 101.1 43.2 101.4 43.8 101.1 44.3 101.1 44.8 Construction
Production 107.4 171.0 101.4 173.4 107.0 185.6 101.5 188.3 107.0 201.5 101.5 204.5 Intermediate consumption 107.3 103.8 101.3 105.2 106.9 112.5 101.4 114.1 106.9 122.0 101.5 123.7 Gross value added 107.7 67.2 101.5 68.2 107.1 73.1 101.6 74.3 107.1 79.6 101.6 80.8 Total services
Production 106.6 1103.5 102.0 1125.7 105.7 1189.9 102.1 1215.1 105.5 1282.5 102.1 1310.0 Intermediate consumption 106.9 489.2 101.9 498.5 105.9 528.1 102.1 539.0 105.7 569.9 102.1 581.8 Gross value added 106.4 614.3 102.1 627.1 105.5 661.8 102.2 676.1 105.4 712.6 102.2 728.2 Total economy
Production 105.7 2048.6 101.8 2086.2 105.1 2193.1 101.9 2235.3 105.1 2349.4 101.9 2394.1 Intermediate consumption 105.6 1067.6 101.7 1086.1 105.1 1141.7 101.8 1162.8 105.1 1222.0 101.8 1244.2 Gross value added 105.8 980.9 101.9 1000.1 105.1 1051.3 102.0 1072.6 105.1 1127.4 102.0 1150.0 Net taxes on product 104.4 94.1 101.5 95.5 103.8 99.1 101.6 100.7 103.5 104.3 101.6 106.0
NATIONAL COMMISSION FOR STRATEGY AND PROGNOSIS
6
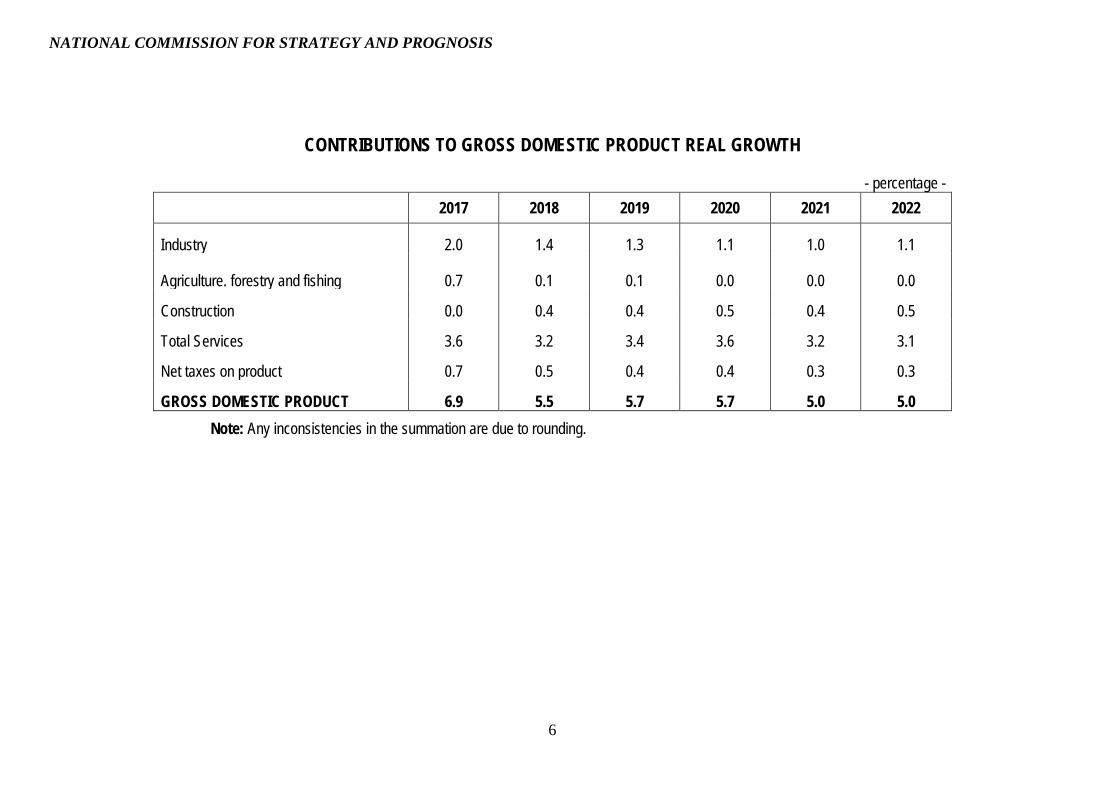
CONTRIBUTIONS TO GROSS DOMESTIC PRODUCT REAL GROWTH
- percentage - 2017 2018 2019 2020 2021 2022
Industry 2.0 1.4 1.3 1.1 1.0 1.1
Agriculture. forestry and fishing 0.7 0.1 0.1 0.0 0.0 0.0
Construction 0.0 0.4 0.4 0.5 0.4 0.5
Total Services 3.6 3.2 3.4 3.6 3.2 3.1
Net taxes on product 0.7 0.5 0.4 0.4 0.3 0.3
GROSS DOMESTIC PRODUCT 6.9 5.5 5.7 5.7 5.0 5.0 Note: Any inconsistencies in the summation are due to rounding.

NATIONAL COMMISSION FOR STRATEGY AND PROGNOSIS
7
STRUCTURE OF GROSS DOMESTIC PRODUCT BY BRANCHES
- % - 2017 2018 2019 2020 2021 2022
Industry 24.2 24.2 24.2 23.9 23.7 23.6
Agriculture. forestry and fishing 4.4 4.3 4.1 3.9 3.7 3.6
Construction 5.9 6.1 6.1 6.2 6.3 6.4
Total services 56.2 56.4 56.7 57.2 57.6 58.0
Net taxes on product 9.4 9.0 8.9 8.7 8.6 8.4
GROSS DOMESTIC PRODUCT 100.0 100.0 100.0 100.0 100.0 100.0 Note: The structure is calculated on the basis of nominal values. Any inconsistencies in the summation are due to rounding.
.

NATIONAL COMMISSION FOR STRATEGY AND PROGNOSIS
8
GROSS DOMESTIC PRODUCT BY EXPENDITURES
- Percentage changes as against the previous year. %- 2017 2018 2019 2020 2021 2022
GROSS DOMESTIC PRODUCT 6.9 5.5 5.7 5.7 5.0 5.0 Domestic demand 7.6 6.2 6.1 6.0 5.4 5.3 Final consumption 8.4 5.4 5.6 5.3 4.9 4.8 Households actual individual consumption 8.2 5.5 5.8 5.6 5.2 5.0 Household final consumption expenditure 10.2 5.6 6.1 5.8 5.5 5.4 -- purchases of new goods 10.5 6.3 8.0 7.7 7.0 7.0 -- services 8.5 4.5 6.5 6.2 5.8 5.4 -- self- consumption and farmer market 13.3 6.0 2.2 2.0 1.6 2.0 -- other services 10.2 5.0 2.5 2.2 2.5 2.5 Government's and NPISH individual consumption expenditure -6.0 4.8 4.0 3.6 2.7 2.3 Government's actual collective consumption 9.6 4.0 3.0 3.0 2.0 2.0 Gross capital formation 5.2 8.6 7.9 8.3 7.1 7.0 Gross fixed capital formation 4.7 7.9 8.4 8.6 7.4 7.5 Changes in stocks (Contribution GDP’s real growth) 0.2 0.3 0.0 0.0 0.0 0.0 Net export (Contribution to GDP’s real growth) -0.7 -0.8 -0.6 -0.5 -0.5 -0.4 Export of goods and services 9.7 7.4 6.9 7.1 6.9 7.0 Import of goods and services 11.3 8.9 8.0 7.9 7.8 7.7 Final consumption 8.4 5.4 5.6 5.3 4.9 4.8 Private consumption expenditure 10.1 5.6 6.1 5.8 5.5 5.4 Government consumption expenditure 1.0 4.5 3.5 3.2 2.3 2.1

NATIONAL COMMISSION FOR STRATEGY AND PROGNOSIS
9
GROSS DOMESTIC PRODUCT BY EXPENDITURE
- bn. lei and %- 2017 2018 2019
Volume
index
Price value 2016
Price index
Current price value
Volume index
Price value 2017
Price index
Current price value
Volume
index
Price value 2018
Price index
Current price value
GROSS DOMESTIC PRODUCT 106.9 820.7 104.6 858.7 105.5 905.7 104.3 945.0 105.7 998.5 101.9 1017.5 Domestic demand 107.6 833.2 105.2 876.9 106.2 931.0 103.5 963.8 106.1 1022.7 101.4 1036.8 Final consumption 108.4 641.3 104.0 667.1 105.4 703.0 104.3 733.3 105.6 774.0 101.5 785.4 Households actual individual consumption 108.2 581.1 103.4 600.7 105.5 634.0 104.0 659.4 105.8 697.9 101.4 707.8 Household final consumption expenditure 110.2 519.7 102.0 530.3 105.6 560.2 103.6 580.1 106.1 615.4 101.3 623.3 -- purchases of new goods 110.5 264.2 101.9 269.3 106.3 286.3 104.0 297.8 108.0 321.7 101.2 325.6 -- services 108.5 98.6 100.3 98.9 104.5 103.3 104.7 108.2 106.5 115.2 101.4 116.8 -- self- consumption and farmer market 113.3 36.4 100.3 36.5 106.0 38.7 102.5 39.7 102.2 40.6 101.0 41.0 -- other services 110.2 120.5 104.2 125.6 105.0 131.9 102.0 134.5 102.5 137.9 101.5 140.0 Government's and NPISH individual consumption
expenditure 94.0 61.3 114.8 70.4 104.8 73.8 107.5 79.3 104.0 82.5 102.4 84.5 Government's actual collective consumption 109.6 60.2 110.2 66.3 104.0 69.0 107.0 73.8 103.0 76.1 102.0 77.6 Gross capital formation 105.2 192.0 109.3 209.8 108.6 228.0 101.1 230.5 107.9 248.8 101.1 251.4 Gross fixed capital formation 104.7 183.2 105.7 193.6 107.9 209.0 105.0 219.5 108.4 238.0 100.8 239.9 Changes in stocks (Contribution GDP’s real growth) 0.2% 16.2 0.3% 11.0 0.0% 11.5 Net export (Contribution to GDP’s real growth) -0.7% -12.5 -18.2 -0.8% -25.3 -18.7 -0.6% -24.3 -19.3 Export of goods and services 109.7 345.8 102.9 355.7 107.4 382.0 102.1 390.1 106.9 417.1 99.7 415.7 Import of goods and services 111.3 358.4 104.4 374.0 108.9 407.3 100.4 408.8 108.0 441.4 98.6 435.0 Final consumption 108.4 641.3 104.0 667.1 105.4 703.0 104.3 733.3 105.6 774.0 101.5 785.4 Private consumption expenditure 110.1 526.4 102.0 537.0 105.6 567.1 103.5 587.2 106.1 622.8 101.3 630.9 Government consumption expenditure 101.0 114.9 113.2 130.0 104.5 135.9 107.5 146.0 103.5 151.2 102.2 154.6

NATIONAL COMMISSION FOR STRATEGY AND PROGNOSIS
10
2020 2021 2022
Volume
index
Price value 2019
Price index
Current price value
Volume index
Price value 2020
Price index
Current price value
Volume
index
Price value 2021
Price index
Current price value
GROSS DOMESTIC PRODUCT 105.7 1075.0 101.9 1095.6 105.0 1150.5 102.0 1173.3 105.0 1231.7 102.0 1255.9 Domestic demand 106.0 1099.4 101.3 1114.0 105.4 1174.3 101.4 1191.1 105.3 1254.4 101.5 1273.0 Final consumption 105.3 827.3 101.5 839.9 104.9 880.7 101.8 897.0 104.8 939.6 101.8 956.8 Households actual individual consumption 105.6 747.3 101.6 759.2 105.2 798.4 101.8 813.0 105.0 853.9 101.8 869.5 Household final consumption expenditure 105.8 659.8 101.5 669.5 105.5 706.3 101.7 718.6 105.4 757.4 101.7 770.6 -- purchases of new goods 107.7 350.8 101.2 355.0 107.0 380.0 101.5 385.7 107.0 412.5 101.5 418.6 -- services 106.2 124.1 101.4 125.9 105.8 133.2 101.6 135.3 105.4 142.6 101.6 144.9 -- self- consumption and farmer market 102.0 41.8 101.5 42.4 101.6 43.1 102.1 44.0 102.0 44.9 102.1 45.8 -- other services 102.2 143.1 102.2 146.3 102.5 150.0 102.4 153.6 102.5 157.4 102.4 161.1 Government's and NPISH individual consumption
expenditure 103.6 87.5 102.5 89.7 102.7 92.1 102.5 94.4 102.3 96.5 102.5 98.9 Government's actual collective consumption 103.0 79.9 101.0 80.7 102.0 82.3 102.0 84.0 102.0 85.7 102.0 87.4 Gross capital formation 108.3 272.1 100.7 274.0 107.1 293.6 100.2 294.1 107.0 314.8 100.4 316.1 Gross fixed capital formation 108.6 260.6 100.7 262.4 107.4 282.0 100.5 283.4 107.5 304.5 100.5 306.0 Changes in stocks (Contribution GDP’s real growth) 0.0% 11.6 0.0% 10.7 0.0% 10.1 Net export (Contribution to GDP’s real growth) -0.5% -24.4 -18.4 -0.5% -23.8 -17.8 -0.4% -22.7 -17.1 Export of goods and services 107.1 445.2 100.0 445.1 106.9 475.9 100.0 475.8 107.0 509.0 99.8 508.1 Import of goods and services 107.9 469.6 98.7 463.5 107.8 499.7 98.8 493.6 107.7 531.7 98.8 525.2 Final consumption 105.3 827.3 101.5 839.9 104.9 880.7 101.8 897.0 104.8 939.6 101.8 956.8 Private consumption expenditure 105.8 667.7 101.5 677.5 105.5 714.6 101.7 727.1 105.4 766.1 101.7 779.5 Government consumption expenditure 103.2 159.6 101.7 162.4 102.3 166.1 102.3 169.9 102.1 173.4 102.3 177.4

NATIONAL COMMISSION FOR STRATEGY AND PROGNOSIS
11
CONTRIBUTIONS TO REAL GDP GROWTH percent -
2017 2018 2019 2020 2021 2022 GROSS DOMESTIC PRODUCT 6.9 5.5 5.7 5.7 5.0 5.0 Domestic demand 7.7 6.3 6.2 6.2 5.5 5.4 Final consumption 6.5 4.2 4.3 4.1 3.7 3.6 Households actual individual consumption 5.8 3.9 4.1 3.9 3.6 3.5 Household final consumption expenditure 6.3 3.5 3.7 3.6 3.4 3.3 -- purchases of new goods 3.3 2.0 2.5 2.5 2.3 2.3 -- services 1.0 0.5 0.7 0.7 0.7 0.6 -- self- consumption and farmer market 0.6 0.3 0.1 0.1 0.1 0.1 -- other services 1.4 0.7 0.4 0.3 0.3 0.3 Government's and NPISH individual consumption expenditure -0.5 0.4 0.3 0.3 0.2 0.2 Government's actual collective consumption 0.7 0.3 0.2 0.2 0.1 0.1 Gross capital formation 1.2 2.1 1.9 2.0 1.8 1.8 Gross fixed capital formation 1.1 1.8 2.0 2.0 1.8 1.8 Changes in stocks (Contribution GDP’s real growth) 0.2 0.3 0.0 0.0 0.0 0.0 Net export (Contribution to GDP’s real growth) -0.7 -0.8 -0.6 -0.5 -0.5 -0.4 Export of goods and services 4.0 3.1 2.9 2.9 2.8 2.8 Import of goods and services 4.7 3.9 3.4 3.4 3.3 3.3 Final consumption 6.5 4.2 4.3 4.1 3.7 3.6 Private consumption expenditure 6.3 3.5 3.8 3.6 3.4 3.3 Government consumption expenditure 0.1 0.7 0.5 0.5 0.3 0.3
Note: Any inconsistencies in the summation are due to rounding

NATIONAL COMMISSION FOR STRATEGY AND PROGNOSIS
12
GROSS DOMESTIC PRODUCT BY EXPENDITURE - % -
2017 2018 2019 2020 2021 2022
GROSS DOMESTIC PRODUCT 100.0 100.0 100.0 100.0 100.0 100.0 Domestic demand 102.1 102.0 101.9 101.7 101.5 101.4 Final consumption 77.7 77.6 77.2 76.7 76.4 76.2 Households actual individual consumption 70.0 69.8 69.6 69.3 69.3 69.2 Household final consumption expenditure 61.8 61.4 61.3 61.1 61.2 61.4 -- purchases of new goods 31.4 31.5 32.0 32.4 32.9 33.3 -- services 11.5 11.4 11.5 11.5 11.5 11.5 -- self- consumption and farmer market 4.3 4.2 4.0 3.9 3.8 3.7 -- other services 14.6 14.2 13.8 13.4 13.1 12.8 Government's and NPISH individual consumption expenditure 8.2 8.4 8.3 8.2 8.0 7.9 Government's actual collective consumption 7.7 7.8 7.6 7.4 7.2 7.0 Gross capital formation 24.4 24.4 24.7 25.0 25.1 25.2 Gross fixed capital formation 22.6 23.2 23.6 24.0 24.2 24.4 Changes in stocks (Contribution GDP’s real growth) 1.9 1.2 1.1 1.1 0.9 0.8 Net export (Contribution to GDP’s real growth) -2.1 -2.0 -1.9 -1.7 -1.5 -1.4 Export of goods and services 41.4 41.3 40.9 40.6 40.6 40.5 Import of goods and services 43.6 43.3 42.8 42.3 42.1 41.8 Final consumption 77.7 77.6 77.2 76.7 76.4 76.2 Private consumption expenditure 62.5 62.1 62.0 61.8 62.0 62.1 Government consumption expenditure 15.1 15.5 15.2 14.8 14.5 14.1
Note: The structure has been computed based on nominal values. Any inconsistencies in the summation are due to rounding.

NATIONAL COMMISSION FOR STRATEGY AND PROGNOSIS
13
- INDUSTRIAL PRODUCTION *
- (gross series) - - percentage changes as compared to the previous year. % -
2016 2017 2018 2019 2020 2021
2022 Industry – total. of which: 3.1 7.8 5.4 5.2 4.5 4.3 4.5 a) Mining and quarrying: -11.7 10.2 3.6 4.2 2.8 3.4 3.8
Superior and inferior coal mining and preparation -9.7 11.8 1.5 2.2 1.8 0.0 -0.2 Crude oil and natural gas quarrying and preparation -10.0 5.3 0.8 1.5 0.6 1.0 1.3 Metaliferrous ores quarrying and preparation 11.4 -14.0 -12.0 -12.4 -18.6 -20.0 -22.0 Other extractive activities 3.9 7.0 -1.5 1.0 -3.0 -1.0 -0.5 Annex extraction services activities -33.3 40.2 20.3 16.0 13.7 12.5 12.3
b Manufacturing 4.8 8.4 6.0 5.8 5.1 4.7 4.9 food 9.2 1.8 3.5 4.5 4.6 4.4 5.2 beverages 3.4 6.5 6.8 7.2 6.8 5.7 5.5 tobacco products -0.3 -4.7 0.0 -0.4 -1.0 -1.4 -1.6 textile products manufacturing -0.4 6.5 5.7 6.1 5.8 5.5 5.4 clothing articles -0.6 -11.2 -6.0 -6.0 -6.3 -6.5 -6.6 leather goods and footwear -3.0 -1.7 -2.5 -2.2 -3.0 -3.4 -3.5 wood and wooden products manufacturing (excluding furniture
processing) -0.2 -3.3 -5.0 -6.3 -7.5 -8.0 -8.2 pulp. paper and paper products 14.0 9.8 3.8 2.8 1.0 0.5 0.3 publishing houses. polygraphy. recording and copying 3.1 20.1 3.5 10.8 5.5 4.5 4.3 petroleum. coal coking and treatment of nuclear fuels 8.6 0.0 6.5 5.5 5.2 5.5 6.0 chemical substances and products 0.5 5.8 5.6 5.0 4.2 3.7 3.5 pharmaceuticals -7.3 15.2 12.0 10.4 8.4 6.8 6.6 rubber and plastics products 4.3 6.9 5.8 5.6 4.3 3.0 2.8

NATIONAL COMMISSION FOR STRATEGY AND PROGNOSIS
14
2016 2017 2018 2019 2020 2021
2022 manufacturing of construction materials and other products of non-
metallic minerals 2.0 4.2 5.2 3.2 2.8 2.4 2.2 metallurgy 3.5 8.3 1.4 1.8 1.0 0.5 0.4 metallic constructions and metal products 2.8 7.8 4.6 5.8 5.0 4.5 4.3 manufacturing of computers and electrical and optical equipments 19.2 19.4 10.8 13.4 12.0 11.6 11.8 manufacturing of electric equipment 12.9 10.9 10.4 6.2 5.4 4.5 5.0 manufacturing of machinery. plant and equipment 0.0 38.2 20.5 11.8 10.2 8.8 8.8 manufacturing of means of road transport 11.6 17.0 10.4 10.0 8.7 8.5 8.3 manufacturing of means of transport not included at road transport -14.0 1.7 1.5 1.0 0.7 0.5 0.3 manufacturing of furniture 13.1 -2.0 0.5 1.4 1.7 2.0 2.3 other industrial activities not-classified elsewhere 2.3 8.7 3.5 11.3 11.2 9.0 8.8 - repair. maintenance and installation of machinery and equipment -3.3 0.8 0.0 3.2 3.2 2.8 2.6
c) Electric and thermal energy. gas and water. of which 0.5 3.4 2.2 1.7 1.8 2.0 2.2 production. transport and distribution of electric and thermal power.
gas. hot water and air conditioned 0.5 3.4 2.2 1.7 1.8 2.0 2.2 * According to NACE Rev 2

NATIONAL COMMISSION FOR STRATEGY AND PROGNOSIS
15
CONSTRUCTION WORKS VOLUME
by structure elements *
- Percentage changes as against the previous year. % - 2016 2017 2018 2019 2020 2021 2022
Construction works - total. of total. by structure elements:
-4.4 -5.6 5.0 7.0 7.4 7.2 6.8
New construction works -2.1 4.8 1.7 7.1 7.8 8.0 7.5 Capital repair works -23.7 -17.7 6.2 3.8 4.1 4.2 3.7 Maintenance and current repairs works 1.8 -25.2 15.2 8.1 7.9 8.1 6.8
CONSTRUCTION WORKS VOLUME by type of construction*
- Percentage changes as against the previous year. % -
2016 2017 2018 2019 2020 2021 2022
Construction works - total. of total. by type of construction
-4.4 -5.6 5.0 7.0 7.4 7.2 6.8
a) Buildings Residential buildings Non residential buildings
4.6 12.0 1.3
14.3 70.4 -12.7
-3.7 -17.2 9.0
6.7 7.0 6.5
7.0 7.8 6.3
7.1 7.9 6.4
6.5 7.3 5.8
b) Civil engineering -10.6 -21.7 14.5 7.4 7.8 8.2 8.4 * gross series - base year 2015

NATIONAL COMMISSION FOR STRATEGY AND PROGNOSIS
16
TRADE BALANCE
- mill euro -
2016 2017 2018 2019 2020 2021 2022
E X P O R T FOB 57392.2 62641.9 68090 73945 80160 86975 94280 Percentage changes as against the previous year. % 5.1 9.1 8.7 8.6 8.4 8.5 8.4
I M P O R T CIF 67364.4 75598.4 82705 90315 98440 107205 116635 Percentage changes as against the previous year. % 7.0 12.2 9.4 9.2 9.0 8.9 8.8
TRADE BALANCE EXPORT FOB - IMPORT CIF -9972.2 -12956.5 -14615 -16370 -18280 -20230 -22355
% of GDP -5.8 -6.9 -7.2 -7.4 -7.7 -7.9 -8.1

NATIONAL COMMISSION FOR STRATEGY AND PROGNOSIS
17
FOREIGN TRADE BY AREAS
- mill. euro -
2016 2017 2018 2019 2020 2021 2022
Export (FOB) 57392 62642 68090 73945 80160 86975 94280 Of which: Intra - EU 43080 47482 52185 57245 62560 68320 74485 Extra - EU 14312 15160 15905 16700 17600 18655 19795 Import (CIF) 67364 75598 82705 90315 98440 107205 116635 Of which: Intra - EU 51951 57279 62425 68110 74170 80655 87625 Extra - EU 15414 18319 20280 22205 24270 26550 29010 Trade Balance (FOB/CIF) -9972 -12957 -14615 -16370 -18280 -20230 -22355 Of which: Intra - EU -8870 -9798 -10240 -10865 -11610 -12335 -13140 Extra - EU -1102 -3159 -4375 -5505 -6670 -7895 -9215

NATIONAL COMMISSION FOR STRATEGY AND PROGNOSIS
18
FOREIGN TRADE BY AREAS
- Percentage changes as against the previous year. % -
2016 2017 2018 2019 2020 2021 2022 Export (FOB) 5.1 9.1 8.7 8.6 8.4 8.5 8.4 Of which: Intra - EU 7.0 10.2 9.9 9.7 9.3 9.2 9.0 Extra - EU -0.3 5.9 4.9 5.0 5.4 6.0 6.1 Import (CIF) 7.0 12.2 9.4 9.2 9.0 8.9 8.8 Of which: Intra - EU 6.9 10.3 9.0 9.1 8.9 8.7 8.6 Extra - EU 7.2 18.8 10.7 9.5 9.3 9.4 9.3

NATIONAL COMMISSION FOR STRATEGY AND PROGNOSIS
19
FOREIGN TRADE BY AREAS
- % -
2016 2017 2018 2019 2020 2021 2022 Export (FOB) 100 100 100 100 100 100 100 Of which: Intra - EU 75.1 75.8 76.6 77.4 78.0 78.6 79.0 Extra - EU 24.9 24.2 23.4 22.6 22.0 21.4 21.0 Import (CIF) 100 100 100 100 100 100 100 Of which: Intra - EU 77.1 75.8 75.5 75.4 75.3 75.2 75.1 Extra - EU 22.9 24.2 24.5 24.6 24.7 24.8 24.9 Trade Balance (FOB/CIF) 100 100 100 100 100 100 100 Of which: Intra - EU 89.0 75.6 70.1 66.4 63.5 61.0 58.8 Extra - EU 11.0 24.4 29.9 33.6 36.5 39.0 41.2

NATIONAL COMMISSION FOR STRATEGY AND PROGNOSIS
20
BALANCE OF PAYMENTS CURRENT ACCOUNT
- mill. euro -
2016 2017 2018 2019 2020 2021 2022 Current account -3549 -6295 -6280 -6150 -6085 -5955 -5900 Receipts 78038 85602 92540 99720 107110 114730 122655 Payments 81588 91896 98820 105870 113195 120685 128555 1. Goods and services balance -1584 -3979 -4015 -4170 -4030 -3925 -3790 Export 70180 77871 83880 89975 96700 103815 111350 Import 71763 81850 87895 94145 100730 107740 115140 1.1 Trade balance -9306 -11912 -13190 -14545 -15765 -17255 -18845 Export 52173 57186 61535 65935 70830 75925 81315 Import 61479 69098 74725 80480 86595 93180 100160 1.2 Balance of service 7722 7932 9175 10375 11735 13330 15055 Export 18007 20685 22345 24040 25870 27890 30035 Import 10284 12752 13170 13665 14135 14560 14980 2. Balance of primary incomes -4467 -4955 -4960 -4970 -4965 -4960 -5040 Receipts 2820 3232 3710 4115 4530 4815 4975 Payments 7286 8188 8670 9085 9495 9775 10015 3. Balance of secondary incomes 2500 2640 2695 2990 2910 2930 2930 Receipts 5039 4499 4950 5630 5880 6100 6330 Payments 2539 1859 2255 2640 2970 3170 3400 CURRENT ACCOUNT / GDP % -2.1 -3.3 -3.1 -2.8 -2.6 -2.3 -2.1 Note: According to the Balance of Payments Handbook and international investment position IMF-sixth edition (BPM6)

NATIONAL COMMISSION FOR STRATEGY AND PROGNOSIS
21
AVERAGE NUMBER OF EMPLOYEES. BY BRANCH
2016 2017*) 2018 2019 2020 2021 2022 Total economy - thou persons 4759.4 4925 5138 5335 5530 5725 5907 - Percentage change as against the previous year - % 3.2 3.5 4.3 3.8 3.7 3.5 3.2
Of which: Public sector*) – thou persons 894.2 910 928 940 948 955 960 - Percentage change as against the previous year - % 1.3 1.8 2.0 1.3 0.9 0.7 0.5 Private sector – thou persons 3865.2 4015 4210 4395 4582 4770 4947
- Percentage change as against the previous year - % 3.7 3.9 4.9 4.4 4.3 4.1 3.7
*)Estimates **) Data refers to the economic activity statistics (aggregated by the homogenous activity). according to CAEN REV.2 for public administration. education and health and social assistance (also including the education private sector - cca. 4.9%. respectively the health and social assistance - cca.12.8%). excluding army and assimilated personnel (Ministry of Defense. Ministry of Internal Affairs. Romanian Intelligence Service etc.).

NATIONAL COMMISSION FOR STRATEGY AND PROGNOSIS
22
EVOLUTION OF THE MAIN LABOUR FORCE INDICATORS - AMIGO
- thousand persons - 2016 2017 2018 2019 2020 2021 2022
Total active population 8978.6 9119.8 9335 9470 9570 9665 9750 - Active working age population (aged 15-64) 8695.7 8811.9 9030 9170 9280 9385 9480
Total inactive population 10799.3 10539.2 10215 9970 9765 9565 9380 - Inactive working age population (aged 15-64) 4567 4283 3900 3595 3330 3080 2835
Employment 8448.8 8670.3 8890 9030 9140 9240 9330 - Employment (aged 15-64) 8166.1 8363.0 8585 8730 8850 8960 9060
- Employees 6200.6 6389.9 6615 6835 7030 7220 7410 - Other employment 2248.1 2280.4 2275 2195 2110 2020 1920
ILO unemployed 529.9 449.5 445 440 430 425 420

NATIONAL COMMISSION FOR STRATEGY AND PROGNOSIS
23
EVOLUTION OF THE MAIN LABOUR FORCE INDICATORS - AMIGO
percentage changes as against the previous year - 2016 2017 2018 2019 2020 2021 2022
Total active population -2.0 1.6 2.4 1.4 1.1 1.0 0.9 - Active working age population (aged 15-64) -1.8 1.3 2.5 1.6 1.2 1.1 1.0
Total inactive population 0.9 -2.4 -3.1 -2.4 -2.1 -2.0 -1.9 - Inactive working age population (aged 15-64) 0.5 -6.2 -8.9 -7.8 -7.4 -7.5 -8.0
Employment -1.0 2.6 2.5 1.6 1.2 1.1 1.0 - Employment (aged 15-64) -0.8 2.4 2.7 1.7 1.4 1.2 1.1
- Employees 2.3 3.1 3.5 3.3 2.9 2.7 2.6 - Other employment -9.1 1.4 -0.2 -3.5 -3.9 -4.3 -5.0
ILO unemployed -15.1 -15.2 -1.0 -1.1 -2.3 -1.2 -1.2

NATIONAL COMMISSION FOR STRATEGY AND PROGNOSIS
24
EVOLUTION OF THE MAIN LABOUR FORCE INDICATORS - AMIGO
- % - 2016 2017 2018 2019 2020 2021 2022
Activity rate of the population aged 15 and over 53.7 54.9 56.6 57.8 58.7 59.7 60.6
Activity rate of the working age population (aged 15-64) 65.6 67.3 69.8 71.8 73.6 75.3 77.0
Employment rate of the population aged 15 and over 50.6 52.2 53.9 55.1 56.1 57.1 58.0
Employment rate of the working age population (aged 15-64) 61.6 63.9 66.4 68.4 70.2 71.9 73.6
ILO unemployment rate 5.9 4.9 4.8 4.6 4.5 4.4 4.3

NATIONAL COMMISSION FOR STRATEGY AND PROGNOSIS
25
EVOLUTION OF AVERAGE EARNING BY TOTAL ECONOMY
2016 2017 2018 2019 2020 2021 2022
Average gross monthly earnings ( lei) 2809 3256 4300 4657 5002 5362 5737
- percentage change as against the previous year 9.9 15.9 - 8.3 7.4 7.2 7.0
Average net monthly earnings ( lei ) 2046 2373 2650 2873 3088 3313 3549 - percentage change as against the previous year 10.1 16.0 11.7 8.4 7.5 7.3 7.1
Real earnings - % 11.8 14.5 6.7 5.4 4.8 4.7 4.6
Data series for monthly gross monthly earnings up to 2017 are not comparable to the forecast for the period 2018-2021; the forecast includes the transfer of social security contributions from the employer to the employee.

NATIONAL COMMISSION FOR STRATEGY AND PROGNOSIS
26
AVERAGE GROSS MONTHLY EARNINGS BY BRANCH
2016 2017 2018 2019 2020 2021 2022
Average gross monthly earnings - total economy - lei 2809 3256 4300 4657 5002 5362 5737 - Percentage change as against the previous year - % 9.9 15.9 - 8.3 7.4 7.2 7.0 Out of which: Public sector– lei 3156 3932 5337 5951 6314 6680 7101 - Percentage change as against the previous year - % 12.8 24.6 - 11.5 6.1 5.8 6.3 Private sector – lei 2729 3103 4052 4361 4695 5046 5406 - Percentage change as against the previous year - % 9.2 13.7 - 7.6 7.7 7.5 7.1
Note: Data refers to the economic activity statistics (aggregated by the homogenous activity). according to CAEN REV.2 for public administration. education and health and social assistance (also including the education private sector - cca. 4.9%. respectively the health and social assistance - cca.12.8%). excluding army and assimilated personnel (Ministry of Defense. Ministry of Internal Affairs. Romanian Intelligence Service etc.).

NATIONAL COMMISSION FOR STRATEGY AND PROGNOSIS
27
EVOLUTION OF PRICES AND EXCHANGE RATES
2016 2017 2018 2019 2020 2021 2022
Consumer prices ( increase %) – end of year -0.54 3.32 3.5 2.8 2.5 2.3 2.2
– annual average -1.55 1.34 4.7 2.8 2.6 2.5 2.4
Industrial production prices (increase %) – end of year 1.2 3.3 4.2 3.3 2.3 2.0 1.8
– annual average -1.8 3.5 4.5 3.8 2.6 2.3 2.1
Construction prices (increase %) – annual average 1.0 7.0 13.0 6.5 4.7 3.4 3.0
Exchange rate (lei/euro) – annual average 4.4908 4.5681 4.65 4.62 4.60 4.58 4.56
– Nominal appreciation (+)/depreciation (-)lei/euro (%) -1.02 -1.69 -1.8 0.6 0.4 0.4 0.4
– Real appreciation (+)/depreciation (-) lei/euro (%) -2.5 -0.37 2.9 3.5 3.0 2.9 2.8
Exchange rate (lei/US dollar) – annual average 4.0592 4.0525 3.91 3.88 3.87 3.85 3.83