projections for ministry of advanced education ... - cbc.ca · skill shortage groups registered...
TRANSCRIPT

Projections for Ministry of Advanced Education Skill Shortage Groups
November 2006

Skill Shortage Groups� Registered Nurse
� LPN
� Care Aide
� Community Health Worker
� Pharmacist
� Physiotherapist
� Occupational Therapist
� Speech Language Pathologist
� Diagnostic Medical Sonographer
� Medical Radiation Technologist
� Medical Technologist
Actual
2005 2006 2007 2008 2009 2010 2011 2012 2013 2014 2015 Total
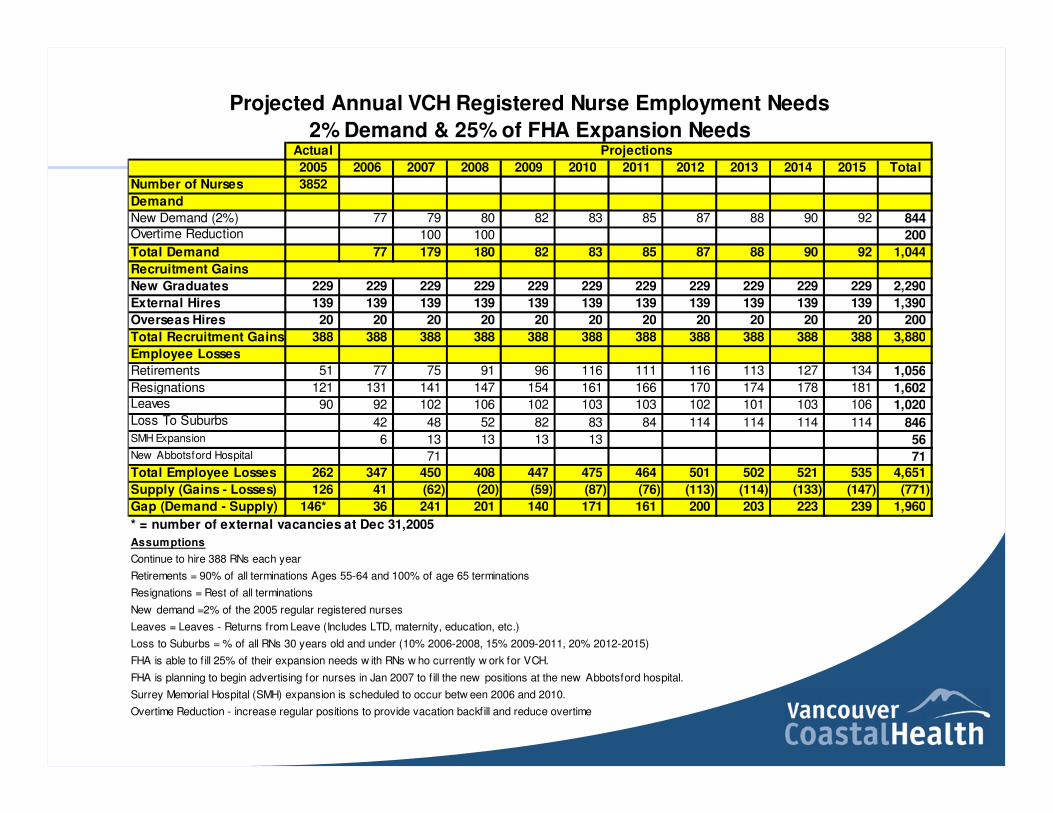
Number of Nurses 3852
Demand
New Demand (2%) 77 79 80 82 83 85 87 88 90 92 844
Overtime Reduction 100 100 200
Total Demand 77 179 180 82 83 85 87 88 90 92 1,044
Recruitment Gains
New Graduates 229 229 229 229 229 229 229 229 229 229 229 2,290
External Hires 139 139 139 139 139 139 139 139 139 139 139 1,390
Overseas Hires 20 20 20 20 20 20 20 20 20 20 20 200
Total Recruitment Gains 388 388 388 388 388 388 388 388 388 388 388 3,880
Employee Losses
Retirements 51 77 75 91 96 116 111 116 113 127 134 1,056
Resignations 121 131 141 147 154 161 166 170 174 178 181 1,602
Leaves 90 92 102 106 102 103 103 102 101 103 106 1,020
Loss To Suburbs 42 48 52 82 83 84 114 114 114 114 846 SMH Expansion 6 13 13 13 13 56 New Abbotsford Hospital 71 71
Total Employee Losses 262 347 450 408 447 475 464 501 502 521 535 4,651
Supply (Gains - Losses) 126 41 (62) (20) (59) (87) (76) (113) (114) (133) (147) (771)
Gap (Demand - Supply) 146* 36 241 201 140 171 161 200 203 223 239 1,960
* = number of external vacancies at Dec 31,2005
Assumptions
Continue to hire 388 RNs each year
Retirements = 90% of all terminations Ages 55-64 and 100% of age 65 terminations
Resignations = Rest of all terminations
New demand =2% of the 2005 regular registered nurses
Leaves = Leaves - Returns from Leave (Includes LTD, maternity, education, etc.)
Loss to Suburbs = % of all RNs 30 years old and under (10% 2006-2008, 15% 2009-2011, 20% 2012-2015)
FHA is able to f ill 25% of their expansion needs w ith RNs w ho currently w ork for VCH.
FHA is planning to begin advertising for nurses in Jan 2007 to f ill the new positions at the new Abbotsford hospital.
Surrey Memorial Hospital (SMH) expansion is scheduled to occur betw een 2006 and 2010.
Overtime Reduction - increase regular positions to provide vacation backfill and reduce overtime
Projected Annual VCH Registered Nurse Employment Needs
2% Demand & 25% of FHA Expansion NeedsProjections

Projected Annual VCH Registered Nurse Employment Needs
2% Demand & 25% Of FHA Expansion Needs
(Excludes Casuals)
2,500
3,000
3,500
4,000
4,500
5,000
5,500
2005 2006 2007 2008 2009 2010 2011 2012 2013 2014 2015
Em
plo
ye
es
Supply
DemandGap

Actual
2005 2006 2007 2008 2009 2010 2011 2012 2013 2014 2015 Total
Number of Staff 376
Demand
New Demand (2%) 8 8 8 8 8 8 8 8 8 8 80
Total Demand 8 8 8 8 8 8 8 8 8 8 80
Recruitment Gains
External Hires 29 29 29 29 29 29 29 29 29 29 29 290
New Graduates 39 39 39 39 39 39 39 39 39 39 39 390
Overseas Hires 0
Total Recruitment Gains 68 68 68 68 68 68 68 68 68 68 68 680
Employee Losses
Retirements 4 33 8 12 9 7 12 14 12 18 21 146
Resignations 26 26 26 26 26 26 26 26 26 26 26 260
Leaves 22 22 22 22 22 22 22 22 22 22 22 220
Total Employee Losses 52 81 56 60 57 55 60 62 60 66 69 626
Supply (Gains - Losses) 16 -13 12 8 11 13 8 6 8 2 -1 54
Gap (Demand - Supply) 13* 21 -4 0 -3 -5 0 2 0 6 9 39
* = number of external vacancies as of Dec 31, 2005
Assumptions
Continue to hire 68 LPNs each year
Retirements = everyone 60+ years of age
Resignations = Same as 2005
New Demand = 2% of aged active staff in 2005
Leaves = same as 2005 (Difference Betw een "Went On Leave" & "Return From Leave"
Projected Annual VCH LPN Employment Needs
(Excludes Casuals)
Projections
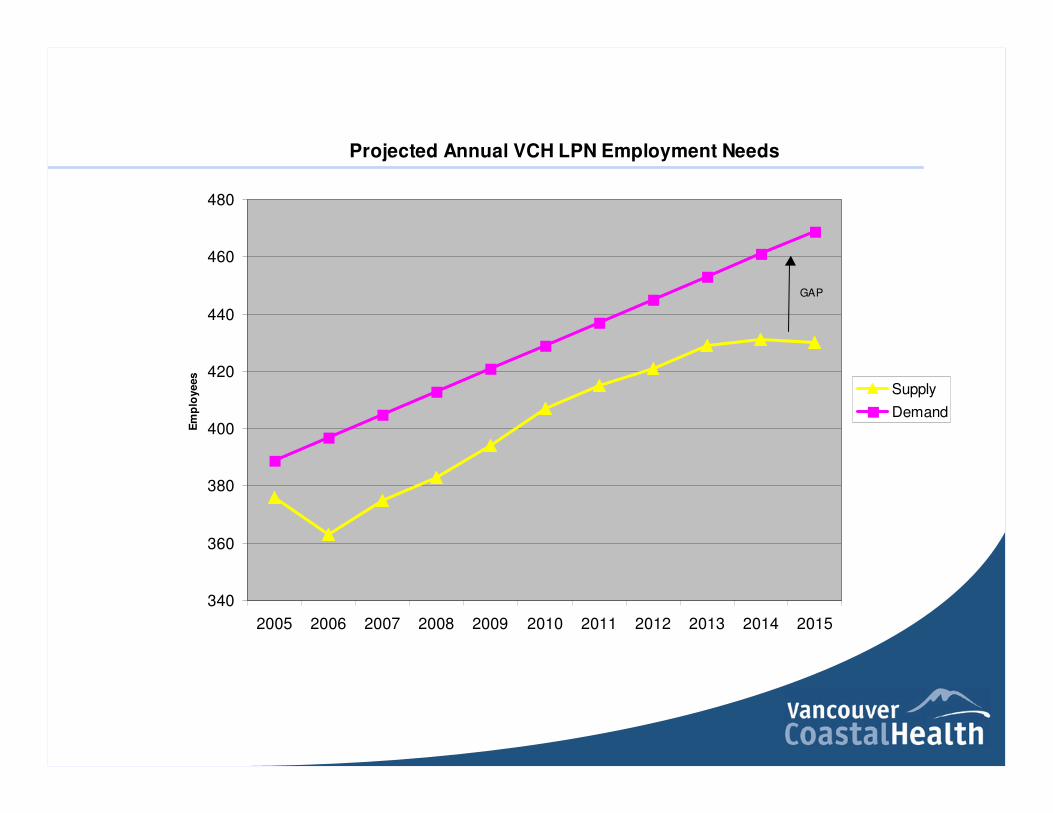
Projected Annual VCH LPN Employment Needs
340
360
380
400
420
440
460
480
2005 2006 2007 2008 2009 2010 2011 2012 2013 2014 2015
Em
plo
yees
Supply
Demand
GAP

Actual
2005 2006 2007 2008 2009 2010 2011 2012 2013 2014 2015 Total
Number of Staff 847
Demand
New Demand (2%) 17 17 17 17 17 17 17 17 17 17 170
Total Demand 17 17 17 17 17 17 17 17 17 17 170
Recruitment Gains
External Hires 28 28 28 28 28 28 28 28 28 28 28 280
New Graduates 4 4 4 4 4 4 4 4 4 4 4 40
Overseas Hires 0
Total Recruitment Gains 32 32 32 32 32 32 32 32 32 32 32 320
Employee Losses
Retirements 10 76 20 35 38 37 42 29 53 47 49 426
Resignations 26 26 26 26 26 26 26 26 26 26 26 260
Leaves 23 23 23 23 23 23 23 23 23 23 23 230
Total Employee Losses 59 125 69 84 87 86 91 78 102 96 98 916
Supply (Gains - Losses) -27 -93 -37 -52 -55 -54 -59 -46 -70 -64 -66 -596
Gap (Demand - Supply) 3* 110 54 69 72 71 76 63 87 81 83 769
* = number of external vacancies as of Dec 31, 2005
Assumptions
Continue to hire 32 Care Aides each year
Retirements = All staff 60+ years old
Resignations = Same as 2005
New Demand = 2% of aged active staff in 2005
Leaves = same as 2005 (Difference Betw een "Went On Leave" & "Return From Leave")
Projected Annual VCH Care Aide Employment Needs
(Excludes Casuals)
Projections

Projected Annual VCH Care Aide Employment Needs
0
200
400
600
800
1000
1200
2005 2006 2007 2008 2009 2010 2011 2012 2013 2014 2015
Em
plo
yees
Supply
Demand
GAP

Actual
2005 2006 2007 2008 2009 2010 2011 2012 2013 2014 2015 Total
Number of Staff 345
Demand
New Demand (2%) 7 7 7 7 7 7 7 7 7 7 70
Total Demand 7 7 7 7 7 7 7 7 7 7 70
Recruitment Gains
External Hires 9 9 9 9 9 9 9 9 9 9 9 90
New Graduates 5 5 5 5 5 5 5 5 5 5 5 50
Overseas Hires 0
Total Recruitment Gains 14 14 14 14 14 14 14 14 14 14 14 140
Employee Losses
Retirements 7 54 11 21 14 17 15 22 18 18 15 205
Resignations 10 10 10 10 10 10 10 10 10 10 10 100
Leaves 8 8 8 8 8 8 8 8 8 8 8 80
Total Employee Losses 25 72 29 39 32 35 33 40 36 36 33 385
Supply (Gains - Losses) -11 -58 -15 -25 -18 -21 -19 -26 -22 -22 -19 -245
Gap (Demand - Supply) 1* 65 22 32 25 28 26 33 29 29 26 316
* = number of external vacancies as of Dec 31, 2005
Assumptions
Continue to hire 14 Community Health Workers each year
Retirements = everyone 60+ years of age
Resignations = same as 2005
New Demand = 2% of aged active staff in 2005
Leaves = same as 2005 (Difference Betw een "Went On Leave" & "Return From Leave")
Projections
Projected Annual VCH Community Health Worker Employment Needs
(Excludes Casuals)

Projected Annual VCH Community Health Worker Employment
Needs
0
50
100
150
200
250
300
350
400
450
2005 2006 2007 2008 2009 2010 2011 2012 2013 2014 2015
Em
plo
yees
Supply
Demand
GAP

Actual
2005 2006 2007 2008 2009 2010 2011 2012 2013 2014 2015 Total
Number of Staff 122
Demand
New Demand (2%) 2 2 2 2 2 2 2 2 2 2 20
Total Demand 2 2 2 2 2 2 2 2 2 2 20
Recruitment Gains
External Hires 12 12 12 12 12 12 12 12 12 12 12 120
New Graduates 4 4 4 4 4 4 4 4 4 4 4 40
Overseas Hires 2 2 2 2 2 2 2 2 2 2 2 20
Total Recruitment Gains 18 18 18 18 18 18 18 18 18 18 18 180
Employee Losses
Retirements 1 1 1 3 4 2 2 1 4 4 6 28
Resignations 10 10 10 10 10 10 10 10 10 10 10 100
Leaves 8 8 8 8 8 8 8 8 8 8 8 80
Total Employee Losses 19 19 19 21 22 20 20 19 22 22 24 208
Supply (Gains - Losses) -1 -1 -1 -3 -4 -2 -2 -1 -4 -4 -6 -28
Gap (Demand - Supply) 1* 3 3 5 6 4 4 3 6 6 8 49
* = number of external vacancies as of Dec 31, 2005
Assumptions
Continue to hire 18 Pharmacists each year
Retirements = everyone 60+ years of age
Resignations = same as 2005
New Demand = 2% of aged active staff in 2005
Leaves = same as 2005 (Difference Betw een "Went On Leave" & "Return From Leave")
Projected Annual VCH Pharmacist Employment Needs
(Excludes Casuals)
Projections

Projected Annual VCH Pharmacist Employment Needs
80
90
100
110
120
130
140
150
2005 2006 2007 2008 2009 2010 2011 2012 2013 2014 2015
Em
plo
yees
Supply
Demand
GAP

Actual
2005 2006 2007 2008 2009 2010 2011 2012 2013 2014 2015 Total
Number of Staff 216
Demand
New Demand (2%) 4 4 4 4 4 4 4 4 4 4 40
Total Demand 4 4 4 4 4 4 4 4 4 4 40
Recruitment Gains
External Hires 18 18 18 18 18 18 18 18 18 18 18 180
New Graduates 9 9 9 9 9 9 9 9 9 9 9 90
Overseas Hires 1 1 1 1 1 1 1 1 1 1 1 10
Total Recruitment Gains 28 28 28 28 28 28 28 28 28 28 28 280
Employee Losses
Retirements 1 15 5 8 4 14 3 5 7 12 3 76
Resignations 19 19 19 19 19 19 19 19 19 19 19 190
Leaves 0 0 0 0 0 0 0 0 0 0 0 0
Total Employee Losses 20 34 24 27 23 33 22 24 26 31 22 266
Supply (Gains - Losses) 8 -6 4 1 5 -5 6 4 2 -3 6 14
Gap (Demand - Supply) 10* 10 0 3 -1 9 -2 0 2 7 -2 36
* = number of external vacancies as of Dec 31, 2005
Assumptions
Continue to hire 28 Physiotherapists each year
Retirements = everyone 60+ years of age
Resignations = same as 2005
New Demand = 2% of active staff in 2005
Leaves = same as 2005 (Difference Betw een "Went On Leave" & "Return From Leave")
Projected Annual VCH Physiotherapist Employment Needs
(Excludes Casuals)
Projections

Projected Annual VCH Physiotherapist Employment Needs
190
200
210
220
230
240
250
260
270
2005 2006 2007 2008 2009 2010 2011 2012 2013 2014 2015
Em
plo
ye
es
Supply
Demand
GAP

Actual
2005 2006 2007 2008 2009 2010 2011 2012 2013 2014 2015 Total
Number of Staff 239
Demand
New Demand (2%) 5 5 5 5 5 5 5 5 5 5 50
Total Demand 5 5 5 5 5 5 5 5 5 5 50
Recruitment Gains
External Hires 20 20 20 20 20 20 20 20 20 20 20 200
New Graduates 10 10 10 10 10 10 10 10 10 10 10 100
Overseas Hires 1 1 1 1 1 1 1 1 1 1 1 10
Total Recruitment Gains 31 31 31 31 31 31 31 31 31 31 31 310
Employee Losses
Retirements 2 6 3 2 9 9 8 6 8 6 10 67
Resignations 12 12 12 12 12 12 12 12 12 12 12 120
Leaves 6 6 6 6 6 6 6 6 6 6 6 60
Total Employee Losses 20 24 21 20 27 27 26 24 26 24 28 247
Supply (Gains - Losses) 11 7 10 11 4 4 5 7 5 7 3 63
Gap (Demand - Supply) 6* -2 -5 -6 1 1 0 -2 0 -2 2 -7
* = number of external vacancies as of Dec 31, 2005
Assumptions
Continue to hire 41 Occupational Therapistss each year
Retirements = everyone 60+ years of age
Resignations = same as 2005
New Demand = 2% of aged active staff in 2005
Leaves = same as 2005 (Difference Betw een "Went On Leave" & "Return From Leave")
Projected Annual VCH Occupational Therapist Employment Needs
(Excludes Casuals)
Projections

Projected Annual VCH Occupational Therapist Employment Needs
240
250
260
270
280
290
300
310
320
330
2005 2006 2007 2008 2009 2010 2011 2012 2013 2014 2015
Em
plo
yees
Supply
Demand
GAP

Actual
2005 2006 2007 2008 2009 2010 2011 2012 2013 2014 2015 Total
Number of Staff 65
Demand
New Demand (2%) 1 1 1 1 1 1 1 1 1 1 10
Total Demand 1 1 1 1 1 1 1 1 1 1 10
Recruitment Gains
External Hires 5 5 5 5 5 5 5 5 5 5 5 50
New Graduates 2 2 2 2 2 2 2 2 2 2 2 20
Overseas Hires 0 0 0 0 0 0 0 0 0 0 0 0
Total Recruitment Gains 7 7 7 7 7 7 7 7 7 7 7 70
Employee Losses
Retirements 0 1 3 0 1 1 1 2 0 2 1 12
Resignations 5 5 5 5 5 5 5 5 5 5 5 50
Leaves 0 0 0 0 0 0 0 0 0 0 0 0
Total Employee Losses 5 6 8 5 6 6 6 7 5 7 6 62
Supply (Gains - Losses) 2 1 -1 2 1 1 1 0 2 0 1 8
Gap (Demand - Supply) 1* 0 2 -1 0 0 0 1 -1 1 0 3
* = number of external vacancies as of Dec 31, 2005
Assumptions
Continue to hire 14 Speech Language Pathologists each year
Retirements = All staff 60+ years old
Resignations = Same as 2005
New Demand = 2% of aged active staff in 2005
Leaves = same as 2005 (Difference Betw een "Went On Leave" & "Return From Leave")
Projected Annual VCH Speech Language Pathologist Employment Needs
(Excludes Casuals)
Projections

Projected Annual VCH Speech Language Pathologist Employment Needs
60
62
64
66
68
70
72
74
76
78
2005 2006 2007 2008 2009 2010 2011 2012 2013 2014 2015
Em
plo
yees
Supply
Demand
GAP

Actual
2005 2006 2007 2008 2009 2010 2011 2012 2013 2014 2015 Total
Number of Staff 29
Demand
New Demand (2%) 1 1 1 1 1 1 1 1 1 1 1 11
Total Demand 1 1 1 1 1 1 1 1 1 1 1 11
Recruitment Gains
External Hires 1 1 1 1 1 1 1 1 1 1 1 11
New Graduates - - - - - - - - - - - -
Overseas Hires 0 0 0 0 0 0 0 0 0 0 0 0
Total Recruitment Gains 1 1 1 1 1 1 1 1 1 1 1 11
Employee Losses
Retirements 0 2 0 0 0 0 1 3 0 1 1 8
Resignations 3 3 3 3 3 3 3 3 3 3 3 33
Leaves -1 -1 -1 -1 -1 -1 -1 -1 -1 -1 -1 -11
Total Employee Losses 2 4 2 2 2 2 3 5 2 3 3 30
Supply (Gains - Losses) -1 -3 -1 -1 -1 -1 -2 -4 -1 -2 -2 -18
Gap (Demand - Supply) 0* 4 2 2 2 2 3 5 2 3 3 28
* = number of external vacancies as of Dec 31, 2005
Assumptions
Continue to hire 1 Diagnostic Medical Sonographer each year
Retirements = All staff 60+ years old
Resignations = Same as 2005
New Demand = 2% of aged active staff in 2005
Leaves = same as 2005 (Difference Betw een "Went On Leave" & "Return From Leave")
Projected Annual VCH Diagnostic Medical Sonographer Employment Needs
(Excludes Casuals)
Projections

Projected Annual VCH Diagnostic Medical Sonographer
Employment Needs
0
5
10
15
20
25
30
35
40
45
2005 2006 2007 2008 2009 2010 2011 2012 2013 2014 2015
Em
plo
yees
Supply
Demand
GAP

Actual
2005 2006 2007 2008 2009 2010 2011 2012 2013 2014 2015 Total
Number of Staff 178
Demand
New Demand (2%) 4 4 4 4 4 4 4 4 4 4 4 44
Total Demand 4 4 4 4 4 4 4 4 4 4 4 44
Recruitment Gains
External Hires 18 18 18 18 18 18 18 18 18 18 18 198
New Graduates - - - - - - - - - - - -
Overseas Hires 0 0 0 0 0 0 0 0 0 0 0 0
Total Recruitment Gains 18 18 18 18 18 18 18 18 18 18 18 198
Employee Losses
Retirements 0 12 3 3 3 3 6 1 4 5 4 44
Resignations 13 13 13 13 13 13 13 13 13 13 13 143
Leaves 0 0 0 0 0 0 0 0 0 0 0 0
Total Employee Losses 13 25 16 16 16 16 19 14 17 18 17 187
Supply (Gains - Losses) 5 -7 2 2 2 2 -1 4 1 0 1 6
Gap (Demand - Supply) 3* 11 2 2 2 2 5 0 3 4 3 37
* = number of external vacancies as of Dec 31, 2005
Assumptions
Continue to hire 18 Medical Radiation Technologists each year
Retirements = All staff 60+ years old
Resignations = Same as 2005
New Demand = 2% of aged active staff in 2005
Leaves = same as 2005 (Difference Betw een "Went On Leave" & "Return From Leave")
Projected Annual VCH Medical Radiation Technologist Employment Needs
(Excludes Casuals)
Projections

Projected Annual VCH Medical Radiation Technologist Employment
Needs
0
50
100
150
200
250
300
350
400
2005 2006 2007 2008 2009 2010 2011 2012 2013 2014 2015
Em
plo
yees
Supply
Demand
GAP

Actual
2005 2006 2007 2008 2009 2010 2011 2012 2013 2014 2015 Total
Number of Staff 260
Demand
New Demand (2%) 5 5 5 5 5 5 5 5 5 5 50
Total Demand 5 5 5 5 5 5 5 5 5 5 50
Recruitment Gains
External Hires 6 6 6 6 6 6 6 6 6 6 6 60
New Graduates 1 1 1 1 1 1 1 1 1 1 1 10
Overseas Hires 0
Total Recruitment Gains 7 7 7 7 7 7 7 7 7 7 7 70
Employee Losses
Retirements 6 25 6 12 8 15 13 9 15 11 10 124
Resignations 11 11 11 11 11 11 11 11 11 11 11 110
Leaves 5 5 5 5 5 5 5 5 5 5 5 50
Total Employee Losses 22 41 22 28 24 31 29 25 31 27 26 284
Supply (Gains - Losses) -15 -34 -15 -21 -17 -24 -22 -18 -24 -20 -19 -214
Gap (Demand - Supply) 2* 39 20 26 22 29 27 23 29 25 24 266
* = number of external vacancies as of Dec 31, 2005
Assumptions
Continue to hire 7 Medical Technologists each year
Retirements = All staff 60+ years old
Resignations = Same as 2005
New Demand = 2% of aged active staff in 2005
Leaves = same as 2005 (Difference Betw een "Went On Leave" & "Return From Leave")
Projected Annual VCH Medical Technologist Employment Needs
(Excludes Casuals)
Projections

Projected Annual VCH Medical Technologist Employment Needs
0
50
100
150
200
250
300
350
2005 2006 2007 2008 2009 2010 2011 2012 2013 2014 2015
Em
plo
yees
Supply
Demand
GAP

Health Human Resources
Projected 2015 Shortfalls
All numbers exclude casual workers
85%46312260Medical Technologists
18%184225178Radiation Technologists
72%114029Diagnostic Sonographers
4%737665Speech Pathologists
Surplus402295239Occupational Therapists
14%230266216Physiotherapists
34%94143122Pharmacists
76%100416345Community Health Workers
75%2511020847Care Aides
8%430469376LPN
39%308150423852Registered Nurses
2015 Shortfall
2015 Forecast
2015 Required
Current Employed
For the employment category concerned, projected shortfalls in the far right column increase in the
Timeframe 2006-15.