projections managing partnership summit june 9 10, 2015 ... pmp summit... · 3 pmp vision for...
TRANSCRIPT
1
Projections Managing Partnership Summit
June 9 – 10, 2015
Portland, OR
Table of Contents I. Introduction ........................................................................................................................ 2
II. Overview of BLS Occupational Separations Methodology Change .................................... 4
III. Demonstration of BLS Occupational Separations Methodology Change………………………… 5
IV. How to Communicate this Methodological Change to
Your Administrator, LMI Director, or Projections User? ..................................................... 6
V. Analysts Roundtable Discussion Regarding Separations Methodology Change ................ 7
VI. Projections Suite Installation .............................................................................................. 7
VII. Projections Suite Database Backup .................................................................................... 8
VIII. Reviewing Projections Inputs .............................................................................................. 8
IX. Handling Non-Covered Employment .................................................................................. 9
X. State Examples of Step-Ahead Adjustment to Base Year of Employment ....................... 10
2
I. Introduction The Projections Managing Partnership (PMP) hosted a summit for projections analysts from June 9-10, 2015 in Portland, Oregon. The event provided a forum for PMP Summit participants to review accomplishments, industry developments, and emerging best practices since last year’s Summit in Pittsburgh, Pennsylvania. Participants focused on preparing for the Bureau of Labor Statistics’ (BLS) Occupational Separations methodology change, installing the Projections Suite software, backing-up the Projections Suite database, reviewing projections inputs for industry and occupational employment projections, handling non-covered employment, and stepping ahead base-year adjustments to long-term employment projections. The Summit also provided participants the opportunity to discuss how best to communicate the BLS methodology change to customers and consider resources for new analyst training. In all attendance included 55 projections analysts from 39 states and U.S. territories. Ron Kelly from the LMI Institute facilitated the Summit’s program and discussions. Welcome and History
Alexandra Hall, Colorado LMI Director and PMP Board Chair, welcomed PMP members with a brief history of the organization. She stated that the PMP is determined to host an annual conference for analysts to exchange ideas and concerns around projections practices. Subsequently, PMP partnered with the LMI Institute to strengthen the projections infrastructure created by states, for states, and with funding assistance from the Employment Training Administration (ETA). The 2014 PMP Summit focused on improving projections process improvement; Insight into the Projections Suite software and Report Manager application; Providing feedback to the potential BLS Occupational Separations methodology change; understanding better the implications of healthcare reform, healthcare sector industry projections, and skills-based projections. 2015 PMP Summit Areas of Interest:
Reviewing, demonstrating, and communicating BLS Occupational Separations methodology changes
Feedback on the BLS Occupational Separations methodology
General projections knowledge and process improvement
Installing and backing up data for the Projections Suite software
Reviewing inputs for short-term, long-term industry and occupational projections
Handling Non-Covered employment
Options for adjusting the base year for long-term employment projections
3
PMP Vision for Implementing BLS Occupational Separations Methodology Change
Alexandra Hall reviewed the history and formation of the Projections Management Partnership (PMP). Hall highlighted the recent PMP accomplishments within the Board of Directors and subcommittees. Of important note, PMP members decided that a Projections User subcommittee would help analysts better understand the needs and concerns of their customers. Additionally, PMP members decided that a Projections Step-Ahead subcommittee would provide states with options for implementing step-ahead adjustments to the base year of long-term occupational projections. The LMI Institute will continue to help facilitate both subcommittees’ priorities and deliverables. Board of Directors The PMP’s Board of Directors continues to prioritize strategic planning for the organization. Notably, since last year’s Summit, the Board has launched the support.projectionscentral.com website. The Board of Directors continues to focus on training and technical concerns, upgrading the Projections Suite, enhancing PMP communications, and better meeting the needs of customers. Standing Committees Communications Committee The Communications committee, chaired by Ohio LMI Director Coretta Pettway, emphasizes improving communication with analysts, LMI Directors, federal partners, and customers. It focuses on marketing available products to the user community. Since last year’s PMP Summit, the Committee assisted the Utah staff with content development for the launching of support.projectionscentral.com. Currently, the Communications committee is working closely with BLS on communicating the BLS Occupational Separations methodology to analysts, LMI Directors, and the general public. Concurrently, the committee has piloted the Projections User subcommittee purposed with providing occasional feedback on customer need and concerns over projections data. Information Technology Committee The Information Technology committee, chaired by Arizona LMI Director Paul Shannon, focuses on improving projections-related software to ensure that it delivers the most accurate data to analysts. Since last year’s PMP Summit, the IT committee has launched the support.projectionscentral.com which provides training resources, technical assistance, and a vehicle for dialogue between projections analysts. The Committee is currently focused on evaluating the impact of the BLS Occupational Separations methodology to the Projections Suite, assessing the need for additional training, and planning for the 2014-2024 projections cycle. Product and Process Innovation Committee The Product and Process Innovation committee, chaired by Oregon LMI Director Graham Slater, focuses on technical matters related to projections outputs and the processes that the PMP recommends to develop said outputs. The goal of this committee is to provide guidance for states to create the highest quality and most relevant projections data for customers. Since last year’s PMP Summit, this committee has formed the Step-Ahead Base Year Adjustment subcommittee with the goal of providing options for states to adjust the base year for long-term employment projections. In addition, the PP&I committee has been focused on better understanding the implications and possible alternatives to the BLS Occupational Separations methodology.
4
Training Committee The Training committee, chaired by North Carolina LMI Director Jacqueline Keener, ensures that training and technical assistance is available to help analysts keep up to date with software and procedural changes. It has also developed training on special topics, as well as opportunities for web-based peer learning among analysts. Since last year’s PMP Summit, the Committee has developed 2015 PMP Summit Agenda in Portland, Oregon. Additionally, the Training Committee has conducted a “Projections Analysts Training Needs Survey” which has provided insight into the desired technical assistance and concerns for analysts. The Committee has also begun conducting “open-line” training webinars, intended to allow the exchange of analysts’ ideas and feedback on various topics. Currently, the Training committee is focused on evaluating additional training for analysts in response to the BLS Occupational Separations methodology implementation. Subcommittees Step-Ahead Base Year Adjustment Subcommittee The Step-Ahead Base Year Adjustment subcommittee, chaired by Florida Projections Analyst Stephen Birch, has been tasked with exploring different methodologies for states’ to implement in adjusting the base-year to their long-term employment projections. The Subcommittee has identified at least (3) options for adjusting long term projections. State examples have been offered by Colorado, Florida, and Tennessee. Projections User Group Subcommittee The Projections User Group subcommittee, led by Ohio LMI Director, Coretta Pettway, serves as a sounding board for the PMP to better ensure responsiveness to the needs of priority customer groups. The primary purpose of the committee is to serve as a feedback loop for the board of directors, committees, and projections analysts nationally, as well as in response to process and methodology concerns implemented or proposed by the PMP.
II. Overview of BLS Occupational Separations Methodology Change
Background
In March 2015, the Bureau of Labor Statistics (BLS) announced their decision to adopt the Occupational Separations (Separations) methodology; replacing the current Replacement Rate (Replacements) methodology. The new Occupational Separations methodology will change how projections analysts calculate occupational transfers and labor force exists; ultimately impacting each state’s total number of job openings. The Summit’s first session entailed a presentation by Michael Wolf from BLS reviewing the implications of the BLS Occupational Separations methodology. Michael’s goals were to highlight how the Separations methodology will address the shortcomings of the current Replacements methodology and to outline the next steps for implementation.
5
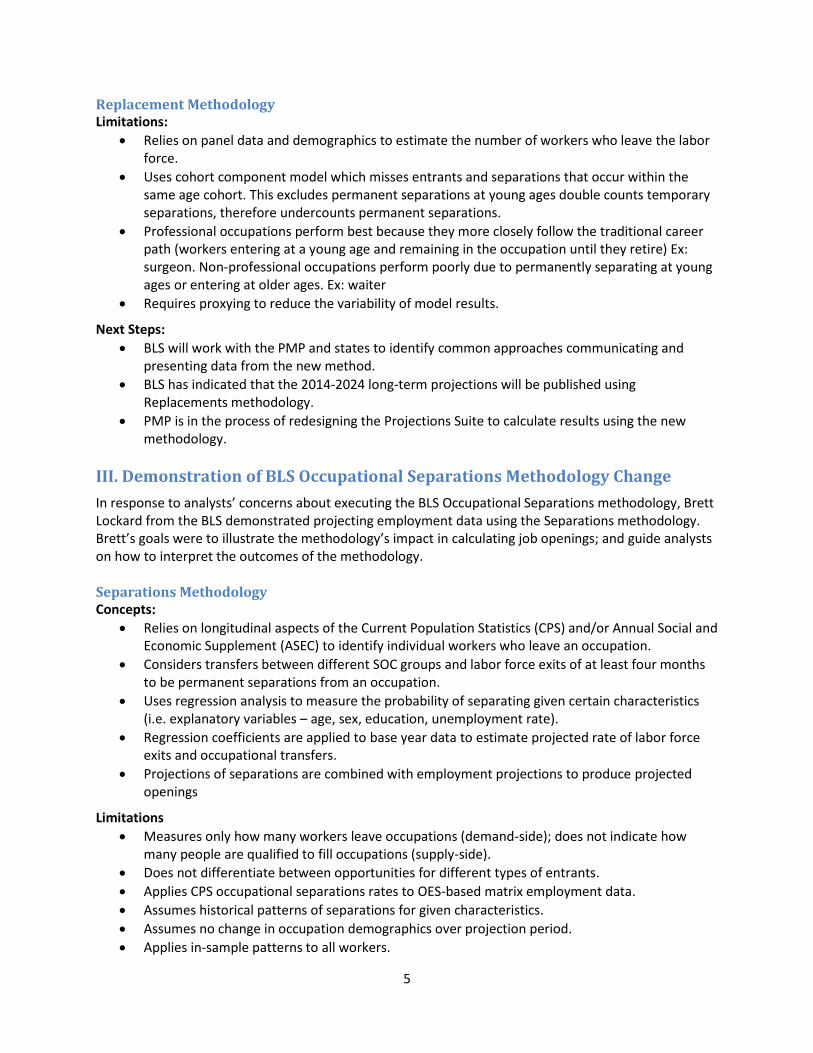
Replacement Methodology Limitations:
Relies on panel data and demographics to estimate the number of workers who leave the labor force.
Uses cohort component model which misses entrants and separations that occur within the same age cohort. This excludes permanent separations at young ages double counts temporary separations, therefore undercounts permanent separations.
Professional occupations perform best because they more closely follow the traditional career path (workers entering at a young age and remaining in the occupation until they retire) Ex: surgeon. Non-professional occupations perform poorly due to permanently separating at young ages or entering at older ages. Ex: waiter
Requires proxying to reduce the variability of model results.
Next Steps:
BLS will work with the PMP and states to identify common approaches communicating and presenting data from the new method.
BLS has indicated that the 2014-2024 long-term projections will be published using Replacements methodology.
PMP is in the process of redesigning the Projections Suite to calculate results using the new methodology.
III. Demonstration of BLS Occupational Separations Methodology Change
In response to analysts’ concerns about executing the BLS Occupational Separations methodology, Brett Lockard from the BLS demonstrated projecting employment data using the Separations methodology. Brett’s goals were to illustrate the methodology’s impact in calculating job openings; and guide analysts on how to interpret the outcomes of the methodology. Separations Methodology Concepts:
Relies on longitudinal aspects of the Current Population Statistics (CPS) and/or Annual Social and Economic Supplement (ASEC) to identify individual workers who leave an occupation.
Considers transfers between different SOC groups and labor force exits of at least four months to be permanent separations from an occupation.
Uses regression analysis to measure the probability of separating given certain characteristics (i.e. explanatory variables – age, sex, education, unemployment rate).
Regression coefficients are applied to base year data to estimate projected rate of labor force exits and occupational transfers.
Projections of separations are combined with employment projections to produce projected openings
Limitations
Measures only how many workers leave occupations (demand-side); does not indicate how many people are qualified to fill occupations (supply-side).
Does not differentiate between opportunities for different types of entrants.
Applies CPS occupational separations rates to OES-based matrix employment data.
Assumes historical patterns of separations for given characteristics.
Assumes no change in occupation demographics over projection period.
Applies in-sample patterns to all workers.
6
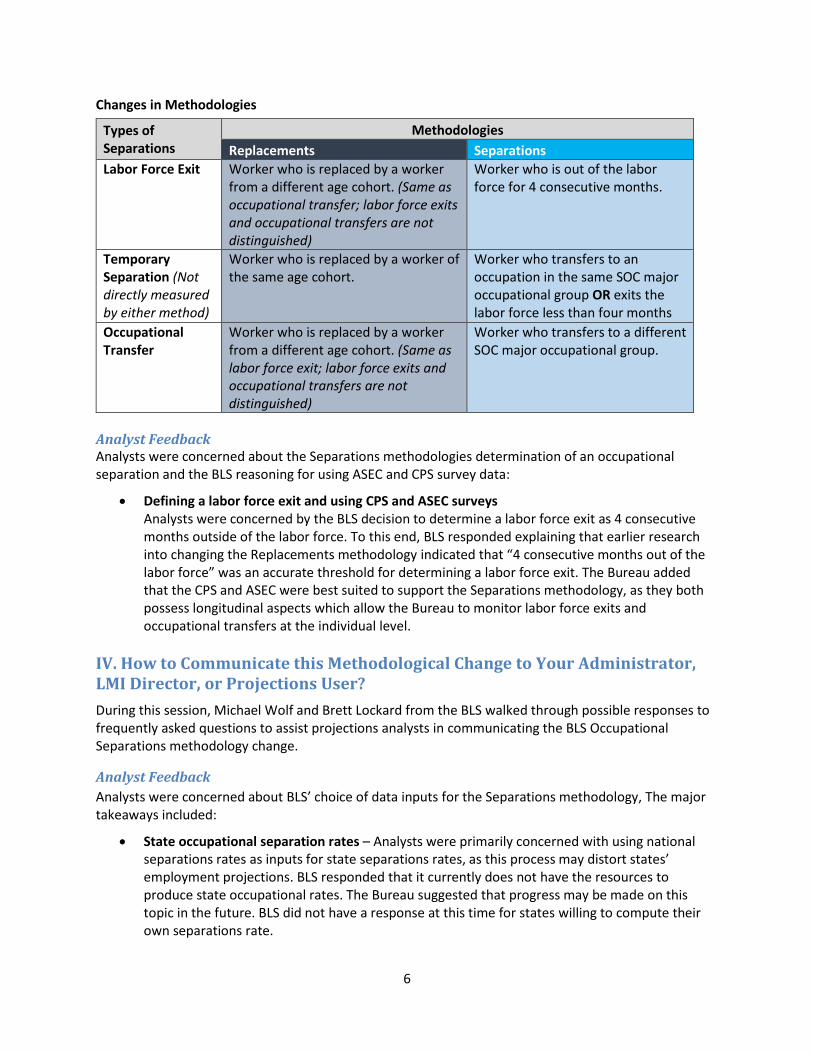
Changes in Methodologies
Analyst Feedback Analysts were concerned about the Separations methodologies determination of an occupational separation and the BLS reasoning for using ASEC and CPS survey data:
Defining a labor force exit and using CPS and ASEC surveys Analysts were concerned by the BLS decision to determine a labor force exit as 4 consecutive months outside of the labor force. To this end, BLS responded explaining that earlier research into changing the Replacements methodology indicated that “4 consecutive months out of the labor force” was an accurate threshold for determining a labor force exit. The Bureau added that the CPS and ASEC were best suited to support the Separations methodology, as they both possess longitudinal aspects which allow the Bureau to monitor labor force exits and occupational transfers at the individual level.
IV. How to Communicate this Methodological Change to Your Administrator, LMI Director, or Projections User?
During this session, Michael Wolf and Brett Lockard from the BLS walked through possible responses to frequently asked questions to assist projections analysts in communicating the BLS Occupational Separations methodology change.
Analyst Feedback
Analysts were concerned about BLS’ choice of data inputs for the Separations methodology, The major takeaways included:
State occupational separation rates – Analysts were primarily concerned with using national separations rates as inputs for state separations rates, as this process may distort states’ employment projections. BLS responded that it currently does not have the resources to produce state occupational rates. The Bureau suggested that progress may be made on this topic in the future. BLS did not have a response at this time for states willing to compute their own separations rate.
Types of Separations
Methodologies
Replacements Separations
Labor Force Exit Worker who is replaced by a worker from a different age cohort. (Same as occupational transfer; labor force exits and occupational transfers are not distinguished)
Worker who is out of the labor force for 4 consecutive months.
Temporary Separation (Not directly measured by either method)
Worker who is replaced by a worker of the same age cohort.
Worker who transfers to an occupation in the same SOC major occupational group OR exits the labor force less than four months
Occupational Transfer
Worker who is replaced by a worker from a different age cohort. (Same as labor force exit; labor force exits and occupational transfers are not distinguished)
Worker who transfers to a different SOC major occupational group.
7
Counting seasonal workers as temporary transfers – Analysts noted that constructions workers unemployed during winter month may be staggered in their reentry into the labor force; sometimes reentering beyond the 1 year window to be counted as an occupational transfer – according to the ASEC – and therefore counted as permanent separations. To this point, acknowledged this instance may occur, however, noted that such instances will not have a significant impact overall on state employment projections.
V. Analysts Roundtable Discussion Regarding Occupational Separations Methodology Change
The roundtable discussion was an opportunity for analysts to share questions and thoughts about the Separations methodology and to bring up other topics that may not have been included on the agenda. Several questions and comments were about technical issues and communicating the Separations methodology but the key takeaways are as follows: State-specific occupational separation rates Currently, national occupational separation rates are used to calculate states’ long-term employment projections. Analysts are concerned about what resources are available to compute their own occupational separations rate. Benchmarking the separations methodology The Separations methodology has yet to be compared on a large-scale to the Replacements methodology. Analysts want the opportunity to test the Separations methodology in order to see how the change will impact their state’s employment projections. Communicating outcomes from separations methodology Governments consider employment projections to determine department appropriations. BLS expects under the Separations methodology, that the frequency of occupational separations will be much higher, in comparison to the Replacements methodology. Analysts seek guidance on communicating dramatic changes, reeducating administrators, and rebutting critics of the Separations methodology. New projections analyst training LMI Directors and experienced projections analysts have limited resources and time available to train new analysts on how to use the Projections Suite software. Analysts discussed the need and value of in-person training and its impact on new analyst training.
VI. Projections Suite Installation During this session, presenter Steve Brock (UT) walked analysts through installing the Projections Suite software. Steven’s goal was to help analysts avoid the common pitfalls of installing the Projections Suite software. The major takeaways from the session include:
Permissions – The most common pitfall for installing the Projections Suite software relates analyst’s lack of adequate privileges, permissions or rights to either download, install, and/or host the Projections Suite software on their local or network servers. To this end, Steven recommended analysts establish a 3-way partnership between state LMI shops, projections analysts, and state IT departments.

8
VII. Projections Suite Database Backup This section covered procedures to recover, restore, and backup Projections Suite (PS). Steve Brock recommended some of the necessary permissions, software, and support for analysts when backing up and restoring older versions of their PS database. Steven’s recommendations for analysts included:
Permission to download and save files to local and network drives.
Download MS SQL Server Management Studio (MSSMS).
Communicate with your State IT department.
Build a relationship with Utah staff.
Post to support.projectionscentral.com.
Analyst Feedback
Analysts’ concerns about installing and backing-up data for the Projections Suite database included:
Where to save the backup file Steven recommended saving older version on local drives. Back-up file command does not execute Analysts were advised to be sure they had the necessary permissions to save database back-up files locally, to save files of a certain size, and are pasting the file location URL properly to the Projections Suite installation interface. Multi-user configuration for multiple projections analysts George Putnam (IL) asked attendees if the frequency and uploading of Projections Suite updates had been burdensome. Analysts responded in the negative. Steven Brock asked the audience how often analysts were given permanent rights to receive updates. The audience responded in the positive. George Putnam asked the audience if the multi-user/machine scenario had been a successful resolution for states with multiple projections analysts. Analysts responded in the positive but noted the difficulties state LMI shops encountered initially when communicating with their state IT departments.
VIII. Reviewing Projections Inputs Stephen Birch (FL), George Putnam (IL), and Brian Pulliam (AR) outlined best practices for identifying data inputs for short/long-term industry and occupational employment projections. Each presenter offered recommendations for inputs for both industry and occupational projections.
Long-Term Industry Projections – Stephen Birch, FL Stephen’s recommendations included:
Use publicly available federal data (Census, BLS, BEA) to create a longitudinal database – a vital component for regression analysis.
Historical industry and economic indicator series is available at: support.projectionscentral.com.
Other sources for projections inputs included: state Governor’s Office, Department of Revenue, and St. Louis Federal Reserve.

9
Short-Term Industry Projections – George Putnam, IL George’s recommendations included:
Use the same data source for the short-term industry projections as the long-term.
Use unrounded employment estimates for the short-term industry projections to reduce the margin of error.
Confirm consistency of industry structure/historical employment between long-term and short-term output files.
Occupational employment projections – Brian Pulliam, AR Brian’s recommendations included:
If no adjustments/edits are made to the last quarter short-term or projections year long-term data, analysts should use Method 1; if adjustments/edits are made use Method 2.
Add Non-covered industry employment into your Excel file before importing to Projections Suite; add it in the ICT edit screen.
Overriding confidentiality flags when the occupation’s employment is self-employed: exceptions are (a) is the self-employment cell flagged (b) overriding would create secondary disclosure issues.
IX. Handling Non-Covered Employment The session was prepared in part by Anthony Hayden (NY), and presented by Martha Wettemann (TN) and Christopher Vaughn (TN). This session touched upon some of the sources and best practices for projecting non-covered employment. Presenters offered a definition of “non-covered employment”, limitations to of the OES survey, and best practices for projection non-covered employment. Currently, there is no definitive set of procedures to project non-covered employment.
Non-covered employment Employment not included or not covered in the Occupational Employment Statistics (OES) survey.
Defining Non-Covered Employment – Chris Vaughn, TN Christopher offered data sources for projecting non-covered employment such as BLS Employment Projection program, CPS, CES, Census of Agriculture, ACS, etc.). Christopher highlighted the pitfalls of using OES data to project non-covered employment, and offered best practices for formatting data within the Projections Suite Software. Understanding Non-Covered Employment – Martha Wettemann, TN Martha identified the limitations of data sources (ACS, Census of Ag., CPS, and BEA, and etc.) used to compute non-covered employment. Martha also provided case examples of calculating state industry self-employed and unpaid family workers within the Projections Suite software.
Analyst Feedback
Analysts’ concerns for projecting non-covered employment included:
Sourcing agricultural occupations for ICT file.
Gaps within the time series and substituting data.
Michael Wolf (BLS) noted that BLS is trying to incorporate OES information into staffing patterns.
10
X. State Examples of Step-Ahead Adjustment to the Base Year of Employment This session offered guidance for states to adjust the base year of their long-term projections. This session featured presentations by Stephen Birch (FL), George Putnam (IL), Shannon Kerr (CO), and Martha Wettemann (TN). Presenters offered (3) options and (4) examples of states adjusting the base year of long term employment projections, strengths and weaknesses. The methodologies presented included:
Colorado’s Methodology – Shannon Kerr, CO Colorado uses the most recent completed calendar year’s annual average QCEW employment for the base, updates the other variables through the same period, changes the base year within the Projections Suite, and then adjusts for economic and industry trends as necessary. All projections are done in the projections suite except for some of the initial steps. CO does not estimate the base year, they substitute it with the previous year QCEW. Strengths: More current data. Methodology can spot economic and industry changes.
Weaknesses: Incongruities with other states, and problems applying staffing patterns. Florida’s Methodology – Stephen Birch, FL Florida employs a linear interpolation methodology which assumes constant growth. Adjustments made to the methodology are not science but rather subjective.
Strengths: The projection year never changes, so it always corresponds with the associated BLS projections – preventing confusion. Each 4-digit industry is reviewed by human eye, to ensure that each projected level is reasonable. Weaknesses: The methodology is also labor intensive and relies upon previous year Q4 data. This methodology runs into trouble also when sharp downturns and upturns occur during the interpolated year.
Short-Term Outcome – Long-Term Base Year Methodology – George Putnam & Robert Richards, NM George Putnam and Bob Richards discussed using the output from the short-term industry projections to serve as the base for the long-term industry projections. This methodology incorporates ¼ actuals and ¾ projected.
Strengths: Preserves the coherence and integration of Projections Suite software products; Requires only a single data process (no replication of processes for 5-10 year projections; Offers flexibility for analysts; Maintains data integrity/output consistency (industry side is consistent, and considering consistent occupational and staffing patterns produce consistent results.
Weaknesses: Requires consistent/identical industry detail between the short-term and long-term industry projections; Requires modifications including an annualized output file for the projected employment level and percentage change in the short-term industry module; requires an adjustment module (i.e. graphics, pattern displays) in the long-term industry module.

11
Tennessee’s Methodology – Martha Wettemann, TN Tennessee’s methodology mirrors the STIP-LTIP methodology. To do a step-ahead to base year 2012 from the 2010 to 2020 projections, it involved, for the state, using the base year for 2011 from the short term projections. Then the difference of 2011-2020 was multiplied by 1/9 in order to find the 2012 base year for the LTIP, using the most current year staffing patterns, and moving forward the target time period.
Strengths: Preserves the coherence and integration of Projections Suite software products; requires only a single data process (no replication of processes for 5-10 year projections); offers flexibility for analysts; maintains data integrity/output consistency (industry side is consistent, and using consistent occupational staffing patterns produces consistent results).
Weaknesses: Requires keeping consistent records of the base year as adjusted and not adjusted.
Analyst Feedback
Analysts’ concerns with adjusting the base year of employment for long-term employment projections included:
Advantages to Step Ahead Adjustment Long-term projections are the most demanded product from state LMI shops. The most common complaint for this data, is that it is published at least 2 years removed from the posted base year. Stepping ahead the base year of employment for long-term projections allows LMI shops to produce a more recent depiction of their states’ job environment. Due to time constraints and limited resources, projections analysts are concerned about increasing their workload to correct a described “messaging” issue. Benchmarking Step Ahead Adjustment Step-ahead adjustment has occurred in only a handful of states. Analysts want an opportunity to evaluate the outcomes of stepping ahead the base year of employment for long-term projections. A discussion amongst themselves revealed that analysts could look at layoff statistics and current employment statistics survey data to compare the accuracy of the modeling.
12
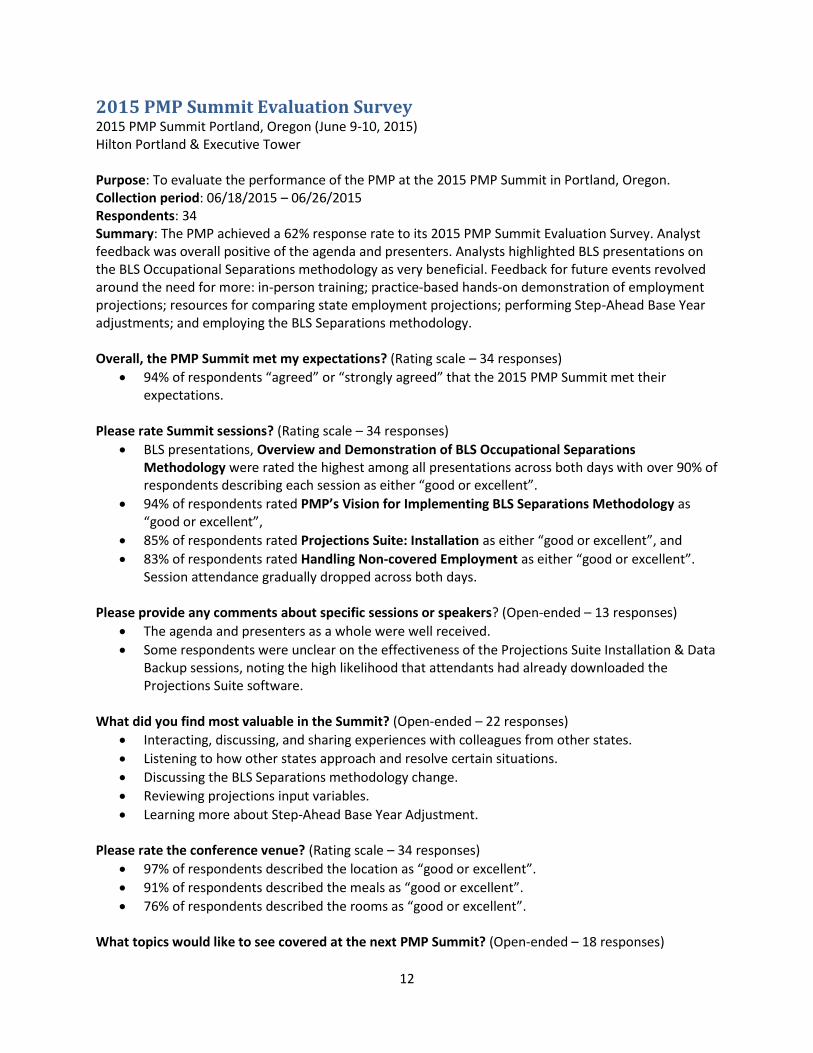
2015 PMP Summit Evaluation Survey 2015 PMP Summit Portland, Oregon (June 9-10, 2015) Hilton Portland & Executive Tower Purpose: To evaluate the performance of the PMP at the 2015 PMP Summit in Portland, Oregon. Collection period: 06/18/2015 – 06/26/2015 Respondents: 34 Summary: The PMP achieved a 62% response rate to its 2015 PMP Summit Evaluation Survey. Analyst feedback was overall positive of the agenda and presenters. Analysts highlighted BLS presentations on the BLS Occupational Separations methodology as very beneficial. Feedback for future events revolved around the need for more: in-person training; practice-based hands-on demonstration of employment projections; resources for comparing state employment projections; performing Step-Ahead Base Year adjustments; and employing the BLS Separations methodology. Overall, the PMP Summit met my expectations? (Rating scale – 34 responses)
94% of respondents “agreed” or “strongly agreed” that the 2015 PMP Summit met their expectations.
Please rate Summit sessions? (Rating scale – 34 responses)
BLS presentations, Overview and Demonstration of BLS Occupational Separations Methodology were rated the highest among all presentations across both days with over 90% of respondents describing each session as either “good or excellent”.
94% of respondents rated PMP’s Vision for Implementing BLS Separations Methodology as “good or excellent”,
85% of respondents rated Projections Suite: Installation as either “good or excellent”, and
83% of respondents rated Handling Non-covered Employment as either “good or excellent”. Session attendance gradually dropped across both days.
Please provide any comments about specific sessions or speakers? (Open-ended – 13 responses)
The agenda and presenters as a whole were well received.
Some respondents were unclear on the effectiveness of the Projections Suite Installation & Data Backup sessions, noting the high likelihood that attendants had already downloaded the Projections Suite software.
What did you find most valuable in the Summit? (Open-ended – 22 responses)
Interacting, discussing, and sharing experiences with colleagues from other states.
Listening to how other states approach and resolve certain situations.
Discussing the BLS Separations methodology change.
Reviewing projections input variables.
Learning more about Step-Ahead Base Year Adjustment. Please rate the conference venue? (Rating scale – 34 responses)
97% of respondents described the location as “good or excellent”.
91% of respondents described the meals as “good or excellent”.
76% of respondents described the rooms as “good or excellent”. What topics would like to see covered at the next PMP Summit? (Open-ended – 18 responses)
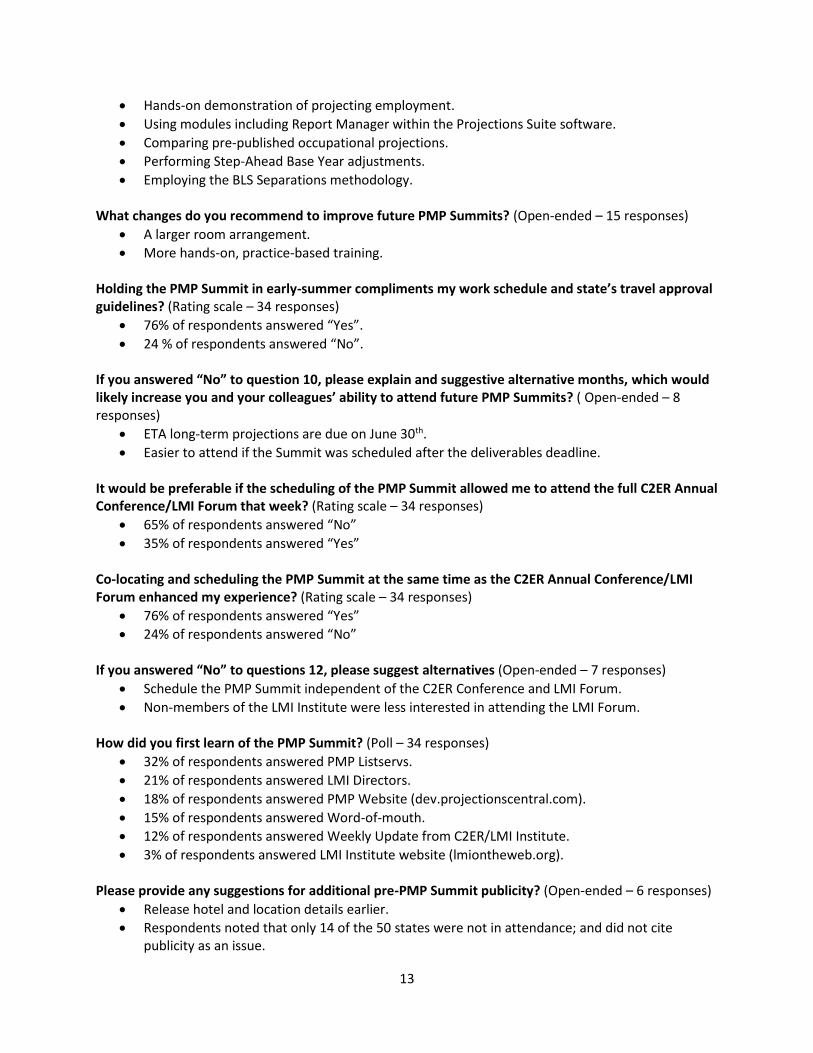
13
Hands-on demonstration of projecting employment.
Using modules including Report Manager within the Projections Suite software.
Comparing pre-published occupational projections.
Performing Step-Ahead Base Year adjustments.
Employing the BLS Separations methodology. What changes do you recommend to improve future PMP Summits? (Open-ended – 15 responses)
A larger room arrangement.
More hands-on, practice-based training.
Holding the PMP Summit in early-summer compliments my work schedule and state’s travel approval guidelines? (Rating scale – 34 responses)
76% of respondents answered “Yes”.
24 % of respondents answered “No”. If you answered “No” to question 10, please explain and suggestive alternative months, which would likely increase you and your colleagues’ ability to attend future PMP Summits? ( Open-ended – 8 responses)
ETA long-term projections are due on June 30th.
Easier to attend if the Summit was scheduled after the deliverables deadline. It would be preferable if the scheduling of the PMP Summit allowed me to attend the full C2ER Annual Conference/LMI Forum that week? (Rating scale – 34 responses)
65% of respondents answered “No”
35% of respondents answered “Yes” Co-locating and scheduling the PMP Summit at the same time as the C2ER Annual Conference/LMI Forum enhanced my experience? (Rating scale – 34 responses)
76% of respondents answered “Yes”
24% of respondents answered “No” If you answered “No” to questions 12, please suggest alternatives (Open-ended – 7 responses)
Schedule the PMP Summit independent of the C2ER Conference and LMI Forum.
Non-members of the LMI Institute were less interested in attending the LMI Forum. How did you first learn of the PMP Summit? (Poll – 34 responses)
32% of respondents answered PMP Listservs.
21% of respondents answered LMI Directors.
18% of respondents answered PMP Website (dev.projectionscentral.com).
15% of respondents answered Word-of-mouth.
12% of respondents answered Weekly Update from C2ER/LMI Institute.
3% of respondents answered LMI Institute website (lmiontheweb.org). Please provide any suggestions for additional pre-PMP Summit publicity? (Open-ended – 6 responses)
Release hotel and location details earlier.
Respondents noted that only 14 of the 50 states were not in attendance; and did not cite publicity as an issue.

14
Please provide any additional comments or suggestions? (Open-ended – 11 responses)
Co-locating the PMP Summit and the C2ER Conference and LMI Forum could serve as critical gathering in the WIOA 2014 era; that is mingling producers of training need forecasts with education/training providers.
Provide print-outs of the presentations to attendants beforehand, so they can follow along.
Provide hands-on training manual on how to evaluate the projections.
Larger room arrangements.