projects & automated meter reading -...
TRANSCRIPT

© Copyr igh t 2012 OSIso f t , LLC. 1

Presented by
© Copyr igh t 2012 OSIso f t , LLC.
PI Infrastructure Projects & Automated Meter Reading
Ian ScottWater Corporation

© Copyr igh t 2012 OSIso f t , LLC.
Ian [email protected] Systems Capability Manager Asset Management BranchWater Corporation629 Newcastle Street, Leederville, WA 6007
3

© Copyr igh t 2012 OSIso f t , LLC.
AGENDA
Drinking Water Quality Reporting
System Capability Matrix & Forecasting
Automated Meter Reading Pilot for Kalgoorlie
4

© Copyr igh t 2012 OSIso f t , LLC.
Water Corporation at a glance• One of the Australia’s largest water service providers
• State-wide responsibility
• Area of over 2.5 million km2
• World’s largest water supply area
• +$25 Billion Asset Base
• Serves population of 1.8 million
• More than 2,000 employees
• Annual revenue >$1.5 Billion
• Capital program - +$900M /yr
• Water to 300 cities and towns
• Wastewater to 100 cities and towns
5
© Copyr igh t 2012 OSIso f t , LLC.
REPORTING CRITICAL CONTROL POINT PERFORMANCE
6

© Copyr igh t 2012 OSIso f t , LLC.
Background• Maintain quality standards set by DoH across all water
sources based on NHMRC 1996 guidelines.
• Implement CCP barrier techniques at supply systems– Catchment controls– Spot sampling– SCADA controlled treatment at CCP sites
• Over 120 schemes need governance reporting in place
7
© Copyr igh t 2012 OSIso f t , LLC.
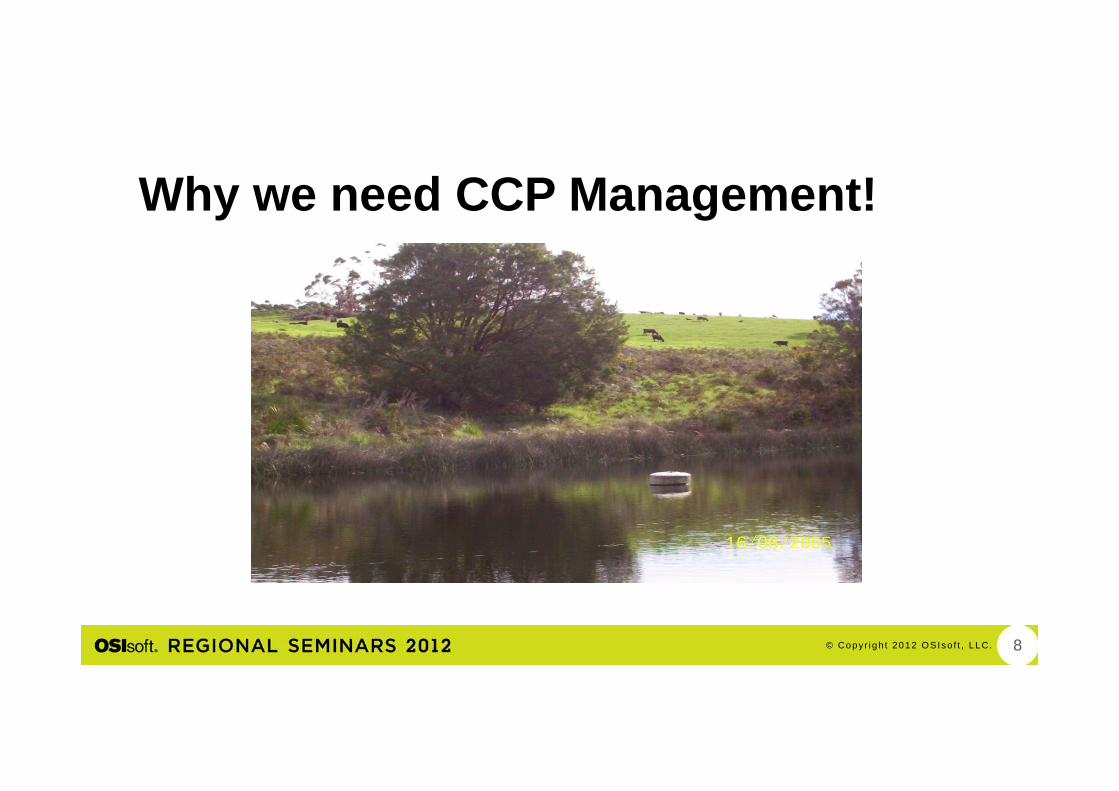
Why we need CCP Management!
8

© Copyr igh t 2012 OSIso f t , LLC.
Walpole Butlers Dam
9

© Copyr igh t 2012 OSIso f t , LLC.
Case Study: Walpole
10

© Copyr igh t 2012 OSIso f t , LLC.
Case Study: Walpole
11

© Copyr igh t 2012 OSIso f t , LLC.
Critical Control Points (CCPs)
• ‘An activity, procedure or process at which control can be applied and which is essential to prevent a hazard or reduce it to an acceptable level’
• Critical Limit Breaches– Represent loss of control of the process;– Indicate the existence of a possible immediate health risk.
12

© Copyr igh t 2012 OSIso f t , LLC.
CCP’s at the Water CorporationCCP Operational Parameter
Chlorination Chlorine residual at the chlorinator (mg/L)
Ultra Violet Disinfection UV dose (fluence) (mJ/cm2)
Filtration Turbidity at filter outlet (NTU)
Reverse Osmosis Desalination Conductivity (mS/m)
13
© Copyr igh t 2012 OSIso f t , LLC.
Business Drivers• Traditional CCP Management
– Has been operational &/or automatic (eg ‘Residual trim’ capability of Chlorination units)
– Vital to the protection of Public Health– From a governance perspective, provides only limited confidence in the
safety of the water.
• Standardised retrospective CCP performance assessment required– Individual sites vs Corporate standards– To inform improved resource allocation decisions– Allow acceptable levels of risk to be determined
14

© Copyr igh t 2012 OSIso f t , LLC.
Chlorination Response ActionsHypothetical Performance
0
0.5
1
1.5
2
2.5
3
3.5
0 12 24 36 48 60 72 84 96 108 120 132 144 156 168
Hours
Chl
orin
e Res
idua
ls (m
g/L)
1
2
3
4
High High alarm
out of spec
Low Low Alarm = Critical Limit
Nominal set point
High Alarm
Low Alarm
target range
15
No. Condition Concern Incident
1&2 Target Range Breach (High or Low Alarm) Residual out of spec. Local
3 Unacceptably high chlorine residuals (High High Alarm)
Loss of process control. Customer complaints. Breach ADWG if residual >5mg/L in retic
Significant
4 Critical Limit Breach (Low Low Alarm) Water may not be safe. Major

© Copyr igh t 2012 OSIso f t , LLC.
CCP– Performance Targets
0.000
0.500
1.000
1.500
2.000
2.500
3.000
1 34 67 100133166199232265298331364397430463496529562595628661694727760793826859892
16
Parameter Minimum acceptable performance
Chlorinator Critical Limit 98%
Ultra Violet Disinfection Critical Limit 98%
Conventional Filtration Critical Limit 99%
Membrane Filtration Critical limit 99%
Chlorinator Target Limit 90%
Ultra Violet Disinfection Target Limit 90%
Conventional Filtration Target Limit 95% (98% if filter to waste
Membrane Filtration Target limit 98%

© Copyr igh t 2012 OSIso f t , LLC.
Reporting Tool• Must analyse performance when unit is supposed to be
running. Ignore other data timeframes.
• Reports performance against target ranges and critical limits – As stipulated in the scheme Process Control Table (PCT) - this was
compiled based on existing operational best practice– Expressed as a % within specification– Number of alarms to have ‘sounded’ can also be presented
17

© Copyr igh t 2012 OSIso f t , LLC.
Solution Options• Data indicates process follows a repeatable
start/stop cycle - PI Batch????• PI Batch built under manufacturing model. The
theory is nothing happens until you turn on the machines.
• CCP water can be out of spec before process acts and will be excluded with PI Batch.
18

© Copyr igh t 2012 OSIso f t , LLC.
Solution Options cont..• Existing data quality tool (PI-AANT) was built for
data quality and aggregation purposes.• Expand the tool to handle complex event
process (CEP) calcs to output daily.• Build tools to report daily outputs in
ProcessBook and DataLink
19

© Copyr igh t 2012 OSIso f t , LLC.
Solution Architecture
PI-AFSQL Server
PI Archive Server
Qualified User
Data Visualisation Tool inside
ProcessBook
PI-ACE
Business Logicmapping forcalculations
PI-AF SDKPI-AF SDK
PI-SDK PI-OLEDB
SQL OLEDB
Calculation settingsand flags for dataerrors
Raw Data Input
Data extracts andcalculation results
GUI Aggregation Engine Configuration
Tool
ADMIN Use Only
Daily Calc Data
HierarchyDetails
AF StructureBuild

© Copyr igh t 2012 OSIso f t , LLC.
Solution: User Screens

© Copyr igh t 2012 OSIso f t , LLC.
Locality Barrier Tool – Summary Page
22
© Copyr igh t 2012 OSIso f t , LLC.
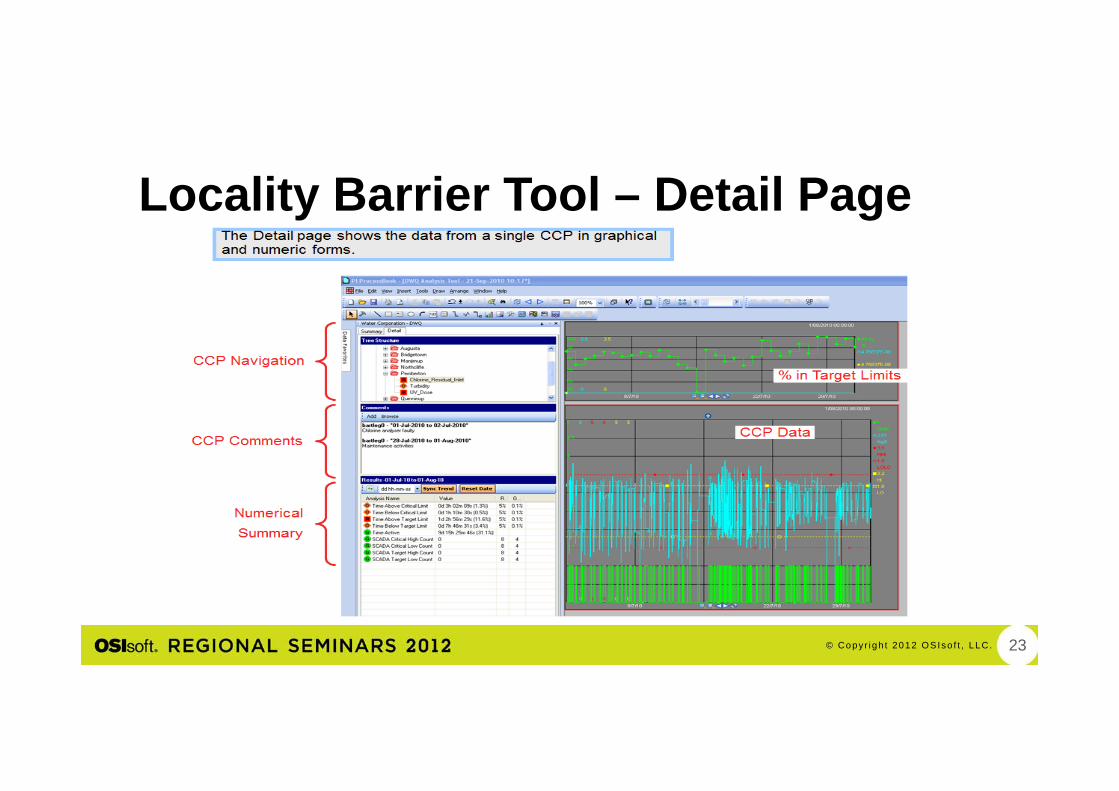
Locality Barrier Tool – Detail Page
23

© Copyr igh t 2012 OSIso f t , LLC.
Locality Barrier Tool – Detail Page -Trends
24

© Copyr igh t 2012 OSIso f t , LLC.
Locality Barrier Tool – Detail Page -Controls
25

© Copyr igh t 2012 OSIso f t , LLC.
Locality Barrier Tool – Reporting
26

© Copyr igh t 2012 OSIso f t , LLC.
Expected Benefits: Operational• Immediate alignment of the field operational targets with the
reported targets (from the PCT)
• An improved understanding of existing Process Control Point performance – e.g. Free Chlorine residuals in the reticulation
• Focus on alarms – why are they not triggering/responding when they should?– Alarm delays?
27

© Copyr igh t 2012 OSIso f t , LLC.
Expected Benefits: Process Improvements• UV Disinfection system audit
– Effectiveness of the operational and capital mitigation activities suggested by the audit can be measured.
• Chlorination inspection and upgrade program – Potential for targeting of on-site inspections & influencing prioritisation of funding for
upgrades– Validation of the improved performance of upgraded chlorinators
• Enhanced understanding of associated issues– Variability in feedback loop times– Inactivated/ Disregarded alarms – Alarm response– Configuration management
28

© Copyr igh t 2012 OSIso f t , LLC.
Expected Benefits: Managerial• Availability of improved information for water quality
governance committees. – Enables presentation of the ‘real’ level of water quality risk
in a clear, internally consistent manner. – Standardisation of management of critical water quality
barriers.
• Facilitates better management decisions– Accept the risk; or – Spend to mitigate it
29

© Copyr igh t 2012 OSIso f t , LLC.
Conclusion • Target is to deliver ‘safe’ water to customers 100% of the
time – Requires that the operational knowledge that has controlled the scheme for
many years be conveyed to management. – Requires that asset capability be fully understood
• Retrospective CCP reporting can be a crucial tool in effective management of water quality risks, through:– Enabling enhanced operator vigilance– Accurately informing management of existing public health risks– Aiding prioritisation of capital upgrades – Validating the effectiveness of CCP performance improvement measures. – Driving continuous improvement
30

© Copyr igh t 2012 OSIso f t , LLC.
Growth/Capacity Monitoring & Reporting
System Capability Forecasting
31

© Copyr igh t 2012 OSIso f t , LLC.
Current SituationGenerally;• We monitor and report our growth/capacity information in an ad-hoc and manual
manner• Inconsistent and multiple data sources exist• There is no single source of the “truth” re data and assumptions.• There are knowledge capability gaps for people undertaking the necessary tasks to
manage the area of growth and demand of our schemes.• Corporate Accountability Framework – There appears to be no one point of
accountability or responsibility for the scheme growth and demand management in the Corporation.
• The periods for analysis and/or data capture are not clear.• Lack of clarity in how we manage scheme growth and demand translates in to deficient
or inconsistent engagement with external parties.
32

© Copyr igh t 2012 OSIso f t , LLC.
Business DriversFailure to change will lead to;• Duplication of effort for analysis. Wasted effort.• Inconsistencies of information may be transferred into external reporting. We lose
credibility with stakeholders and breaching compliance limits. (eg. DoW, DoH, DEC)• Spending money in the wrong areas.• Loss of corporate knowledge if information is not captured for the future. • Poor planning timelines and increases to fast track projects.• Multiple methodologies for forecasting.• We will reduce our capacity to deliver services our customers.• We will lose the opportunity to manage our human resources better and to move from
a reactive (Based on history & incidents) to proactive (Based on forecasting & planning into the future) environment.
33

© Copyr igh t 2012 OSIso f t , LLC.
Whole of Project AimsTo overcome our existing challenges we need;• Better clarity of roles and responsibilities • “One-Best-Way” of undertaking the task of managing supply/demand of our schemes• Focus on growth/capacity (Capability) of the supply and demands of our schemes –
for the long term• To get ahead of the game – become proactive instead of reactive. (Requires a
change of culture)• To understand all information relating to growth, consumption and peaks.• To streamline and speed up delivery of information as current forms of forecasting
and performance monitoring are labour intensive and mainly adhoc.• Acceptance and use of a corporate system (application) that is robust and
standardised that can deliver relevant information consistently in a repeatable and transparent manner and is available for use by all.
34

© Copyr igh t 2012 OSIso f t , LLC.
Wastewater PS KPI Forecasting
• Provides Capability Mangers/OC/Planners a quick view of long-term performance of each asset.
• These KPI’s are not monitored by SCADA. • Each site is analysed using the same method – ”one best way”.• Predictive forecasting when design limits will be reached to
identify planning or capital expenditure timing.
35

© Copyr igh t 2012 OSIso f t , LLC.
Scheme Growth
36

© Copyr igh t 2012 OSIso f t , LLC.
Borefield Abstraction Reports
37
Water Year Start
1/10/2010
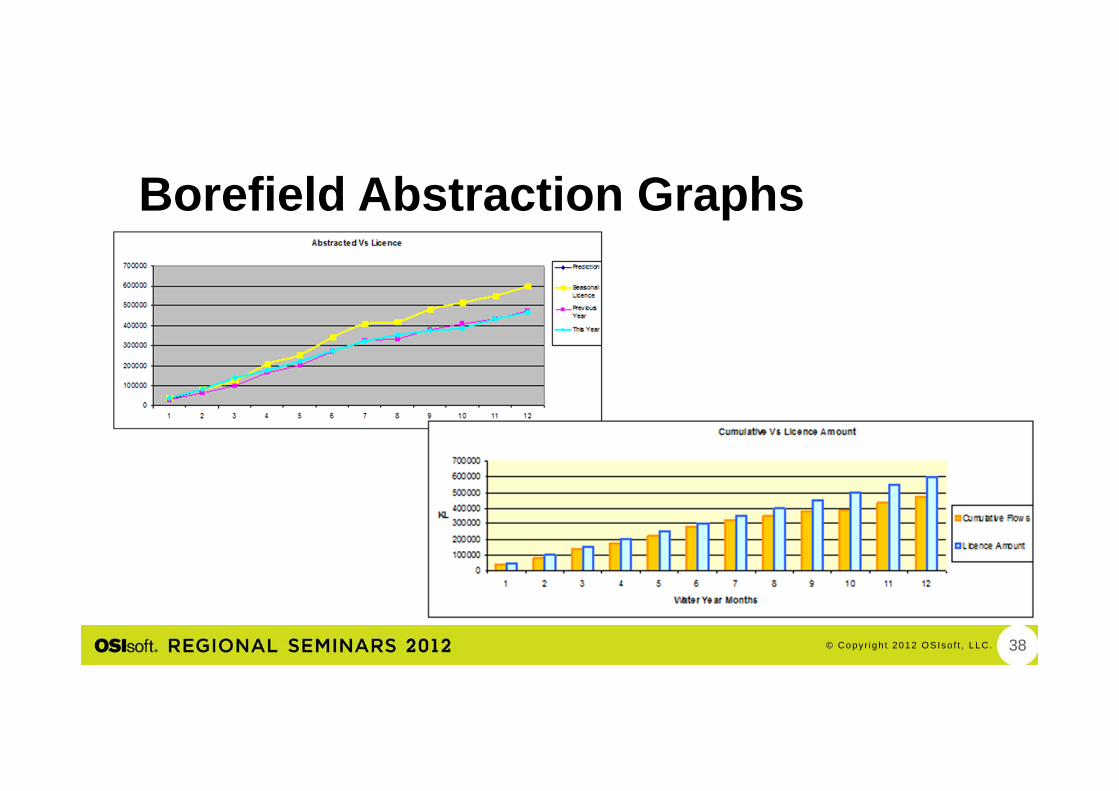
1/10/2010 Nov 2010 Dec 2010 Jan 2011 Feb 2011 Mar 2011 Apr 2011 May 2011 Jun 2011 Jul 2011 Aug 2011 Sep 2011Borefield Flows (Mth) 38613 42732 56655 36646 45881 54195 46944 33306 20925 9516 50236 30231
Cumulative Flows 38613 81345 138000 174646 220527 274722 321666 354972 375897 385413 435649 465880
Cumulative + Prediction 29775 81345 138000 174646 220527 274722 321666 354972 375897 385413 435649 465880
Previous Year 29775 33942 34083 67367 35341 70765 53577 8370 46721 27857 27099 40000
Previous Year Cumulative 29775 63717 97800 165167 200508 271273 324850 333220 379941 407798 434897 474897
Seasonally Adjusted Licence 37619 42883 43062 85114 44651 89407 67691 10575 59029 35195 34238 50537
Adjusted Lic Cumulative 37619 80502 123564 208677 253328 342735 410426 421001 480030 515225 549463 600000
Licence Amount 50000 100000 150000 200000 250000 300000 350000 400000 450000 500000 550000 600000
Licence Amount (Mth) 50000 50000 50000 50000 50000 50000 50000 50000 50000 50000 50000 50000
Increment in Borefield Flows 1.30 1.11 1.33 0.65 1.25 1.18 0.87 0.71 0.63 0.45 5.28 0.60
Data Validated (put "OK" if manually checked) OK
Within threshold or checked manually? OK OK OK OK OK OK OK OK OK OK OK OK
% of Licence Used (Cumulative) : 102.6% 101.0% 111.7% 83.7% 87.1% 80.2% 78.4% 84.3% 78.3% 74.8% 79.3% 77.6%
% of Licence Used (Mth Totals) : 102.6% 99.6% 131.6% 43.1% 102.8% 60.6% 69.4% 315.0% 35.4% 27.0% 146.7% 59.8%
KL's Used of Licence to Date : 0.0%
© Copyr igh t 2012 OSIso f t , LLC.
Borefield Abstraction Graphs
38

© Copyr igh t 2012 OSIso f t , LLC.
SCF Context Diagram
39
Planning Information
SWPP
Capital Prioritisation System
CPS
SCM - Application Context v06
Project Management Information System
PMIS
Asset Risk Assessment
ARA
System Capability Matrix
SCM
Capital Project Details
Asset Condition Assessments
ACA
Plant Maintenance Plans
SAP/PM
AssetManagement Plans
AMPS
Operating StrategyOperations SchedulesCatchment Management StrategyProcess Control TablesWater Safety PlanPlanning Solutions• Business Cases• System Reviews• Technical AdvicesAsset Data SheetsDrawings & SchematicsContingency Plans
Future Enhancements
System Risk Assessment Information
SRA
System Capability Forecasting
AQUA
Reporting Library
SCF
Maintenance of Infrastructure Assets
CDS PI
Capital Delivery System data.
Data Historian
Asset Management & Operations Support
Software
AMOSS
ODSS
Manual dataQuality samples
SCADA
Data Historian

© Copyr igh t 2012 OSIso f t , LLC.
Architecture Diagram
40
PI ACE/AF Server
PI Archive Server
Web Screens
ODSS Oracledatabase
SCADA
SQL Server
PI-AANT
OLEDB COM
CSV

© Copyr igh t 2012 OSIso f t , LLC.
AF Structure – Site Level
41

© Copyr igh t 2012 OSIso f t , LLC.
AF Structure – Measurement Level
42

© Copyr igh t 2012 OSIso f t , LLC.
SCM Main Screen
43
Microbes
Naegleria
Chem
DBP
Asthetics
ContSupply
Pressure/ Flow
Asset Perf
UnaccWater
Leaks & Bursts
Growth

© Copyr igh t 2012 OSIso f t , LLC.
Scheme Overview
44

© Copyr igh t 2012 OSIso f t , LLC.
SCF Asset Forecast
45

© Copyr igh t 2012 OSIso f t , LLC.
SCF Asset Forecast
46
© Copyr igh t 2012 OSIso f t , LLC.
Expected Benefits• Proactive, early identification of emerging issues• Removes arguments around data and methods of analysis.• Ability to plan and budget for other than capital solutions (Optioneering)• Improved justification of system risks and mitigation and/or project timing• Reduced turn-around time of planning after removing the need for data gathering and
review before commencement of planning.• Reporting of exceptions will provide a focus on emerging risks and issues for Asset
Managers based on measures rather than gut feel.• Consistency for growth and demand management will provide the transparency,
clarity and justification required for good decision making.• We will be able to supply reports related to growth and demand in a timely manner
with minimal effort and therefore support other agencies with information sharing.• The process and tools will support planning and acquisition with timing triggers.
47

© Copyr igh t 2012 OSIso f t , LLC.
Overview of EverBlu and AMR/AMI
48

© Copyr igh t 2012 OSIso f t , LLC.
Business Drivers• Major OSH risk to
personnel reading meters• Add value to customers
to inform them of leakage• Cost of delivering water
~5x $/kL than Perth• Infrastructure upgrades in
x$10M• Energy usage is one of
the largest for Water Corp
49

© Copyr igh t 2012 OSIso f t , LLC.
Reading Meters ManuallyThe reader would stand on the back of a truck and look over the fence to read the meters
50

© Copyr igh t 2012 OSIso f t , LLC.
Reading Meters ManuallyDogs inside the properties made it difficult to read over the fence and more dangerous to actually enter the property
51

The Potential Cost of a Leak in Kalgoorlie
Residential water use - on the lowest tiers without other usage
Litres per Hour
Litres per week
Litres per month
Litres per year Weekly cost
Monthly cost
Annual cost
5 840 3,600 43,800 $1.19 $4.77 $52.45
10 1,680 7,200 87,600 $2.38 $8.34 $104.90
20 3,360 14,400 175,200 $3.58 $16.69 $217.18
40 6,720 28,800 350,400 $8.34 $34.57 $548.15
60 10,080 43,200 525,600 $11.92 $51.26 $1,054
100 16,800 72,000 876,000 $20.26 $85.82 $2,812
200 33,600 144,000 1,752,000 $40.53 $171.25 $8,217

© Copyr igh t 2012 OSIso f t , LLC.
Project Overview• Automated meter reading (AMR) technologies were considered• A trial to install pulse capable meters and cybles on every property (13,500
meter) in Kalgoorlie-Boulder began in 2011• Joint funding through the federal government and Water Corp• AMR is simply a meter reading capability, normally a walk by or drive by
application• We can identify properties which have a continuous flow and the volume of that
flow• We advise the customer of the possible leak to have it quickly repaired• The intention is to make significant water savings by providing customers with
more information, so they can better understand their water use and associated costs
53
© Copyr igh t 2012 OSIso f t , LLC.
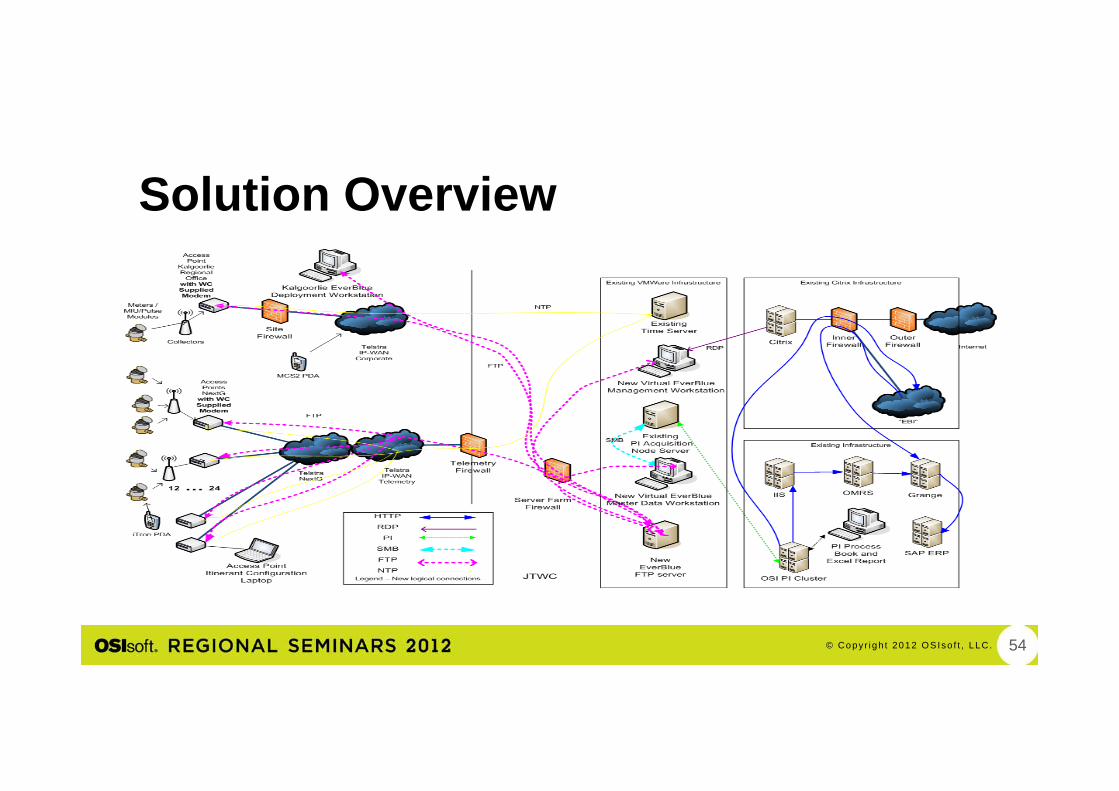
Solution Overview
54

© Copyr igh t 2012 OSIso f t , LLC.
Interfaces
55
Missing

© Copyr igh t 2012 OSIso f t , LLC.
Current Status• Itron chosen as the vendor using EverBlu system• 13,200 meters with cybles/pulse replaced since
January 2011• Primarily new meters have been installed• 17 Access Point sites• 450 Collectors• Project handover due for 30 June 2012
56

© Copyr igh t 2012 OSIso f t , LLC.
EverBlu• The EverBlu software is provided by Itron• It allows us to manage the system and meter data• We can view usage history and see where alarms were
triggered i.e. constant flow• Routes are created for walk-by reading• It is stored on one PC in Kalgoorlie and on two virtual
work stations. I.e. only 3 people can use it at once• You must get systems access to use a virtual work
station
57

© Copyr igh t 2012 OSIso f t , LLC.
Key Features - Performance• Index reliability is key
– Cyble detection is clearly the market reference for multi sensing incremental encoder technology
– > 4 M units in field since 1996• Battery lifetime
– 15 years (min 98,3%) – depending on working hour configuration• Compact
– Radio meter could be screwed in small pits / meter boundary boxes• Reading distance
– 1.5 km Line of sight reading distance– Itron radio “chip on board” design, radio link margin > 120dBm
58

© Copyr igh t 2012 OSIso f t , LLC.
EverBlu SoftwareAlerts related to blocked meters, abnormal network usage and leakages are reported
Using EverBlu Software, operators can get graphical analysis of the meter data
59

© Copyr igh t 2012 OSIso f t , LLC.
Detecting Reticulation Use - Monthly
60

© Copyr igh t 2012 OSIso f t , LLC.
Detecting Internal Leaks - Monthly
61

© Copyr igh t 2012 OSIso f t , LLC.
Alarms Types• Tamper• Dismount• Collector
Unreachable• Reverse Flow• Constant Flow
(leaks)
62

© Copyr igh t 2012 OSIso f t , LLC.
Alarms – Constant Flow (Leaks)
• The alarm is created when the meter records at least 2 L/hr for every hour in a 24 hour period
• This may indicate there is a leak• A spreadsheet is used to prioritise the leaks and send a leak letter• There may be continual use of water at the property• The minimum constant flow rate can be set to a higher rate i.e.
where a property operates 24 hours per day
63

© Copyr igh t 2012 OSIso f t , LLC.
Where Constant Flow is Not a Leak• The use of 2 L/hr does not always mean
that there is a leak – particularly during summer
• Evaporative Air Conditioners:– Mobile unit 3 L/hr– Ducted 3-4 outlets 20 L/hr– 5-7 outlets 25 L/hr– 8+ 45 L/hr
• Filling a pool over a day or several days may create an alarm
• We must find the right balance to ensure that we don’t advise there is a leak when the usage is legitimate, or delay when it is a leak
64

© Copyr igh t 2012 OSIso f t , LLC.
What Happens to the Data?• The data will be analysed on a daily basis by the
administrator• Leak letters will be sent for all leaks and recorded in
Grange – depending on set parameters• SAP work orders will be created for Tamper and
Dismount alarms to ensure reading accuracy• Meters with zero usage will be audited to ensure that the
cyble/pulse is registering usage• The administrator will update EverBlu to ensure that it is
in synch with Grange i.e. meter changes etc
65

© Copyr igh t 2012 OSIso f t , LLC.
System Limitations• Cybles
– clip on the cyble can be broken and there is no alarm for this– Easily damaged, i.e. by dogs, and costly to replace - $100– Serial number must be entered into EverBlu correctly to be part of the
network– Pulse calibration required – new to field crews
• Collectors– They have a reduced signal behind them when mounted on poles– They must be angled in the direction towards the meters with which it is
communicating.– The range can vary from 200m to 1.2km based on obstructions i.e.
buildings, fences, meter box etc66

© Copyr igh t 2012 OSIso f t , LLC.
System Limitations• Access Points
– The maximum of 1200 meters per Access Point is limited by data quantity. More likely 800.
– They must be secured in a box which reduces signal strength
– They must be at a powered site with maintenance access
– Site surveys to measure signal strength of the collectors are critical for Access Point Placement
67

© Copyr igh t 2012 OSIso f t , LLC.
Required Field Activities• Due to the number of alarms both usage and system
related there will be more property inspections required• Training is required to use the software and rectify
alarms• Staff roles and tasks will change with the new technology• Manual readings still required to validate cycle readings
68

© Copyr igh t 2012 OSIso f t , LLC.
Success Story• While the system is being set up and tested 172 leak letters have been
issued by the end December 2011 for leaks >30 L/hr.• In the same period the number of standard leak letters issued was:
– AR – 76– GR – 79– GS – 61– SW – 236– MW – 274– NW - 447
• It is expected when the system is fully operational the number of contacts will increase
• There are currently 2029 constant flow alarms activated in EverBlu >2 L/hr.
69

© Copyr igh t 2012 OSIso f t , LLC.
Success Story • Detected constant flow alarm of
1.5kL per hour – 25 litres per minute– 37kL per day
• Property was unoccupied • Contacted agent and had site
inspection • 170kL was lost due to the leak• Leak could have wasted 3700kL until
the next meter reading• Account would have been about
$21,000
70

© Copyr igh t 2012 OSIso f t , LLC.
Possible Use in the Future• Trial using Western Powers smart grid is proposed to begin later in 2012• Meters being installed in Karratha and Port Hedland as well as other remote
communities and towns• AMR meters are likely to be installed in other places where there are access
or OSH issue • Other different types of AMI meters with the technology built inside the
meter• Data gathering will be independent of a particular manufacturer. I.e. all data
will be stored in PI• Corporate Reporting systems will be developed for processing usage and
alarm data• My Water Portal under development for customers to see their own water
usage
71

© Copyr igh t 2012 OSIso f t , LLC.
Additional benefits• Water Zones being established for water loss
within reticulation and transfer pipelines.• Better determine customer water use patterns
on a weekly/monthly basis• Ability to optimise the scheme storage for a
given week.• Schedule maintenance windows during months
of low use
72
© Copyr igh t 2012 OSIso f t , LLC.
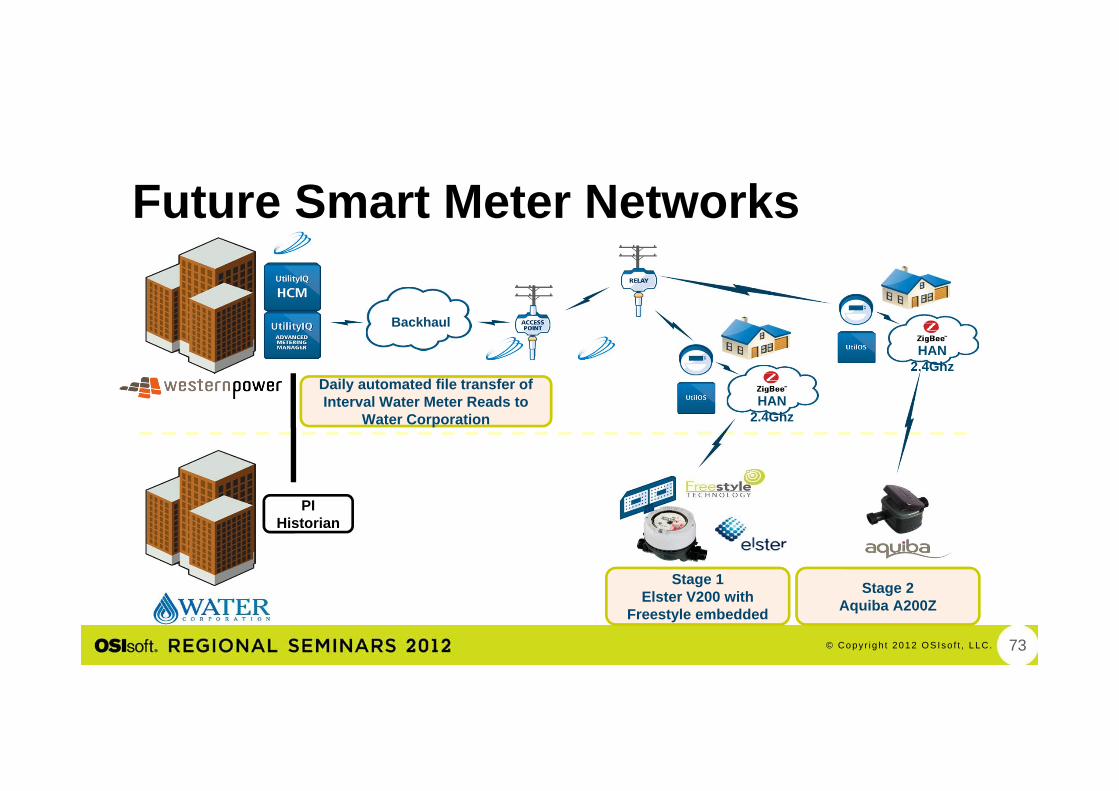
Future Smart Meter Networks
UI
HAN 2.4Ghz
Backhaul
PI Historian
HAN 2.4Ghz
Stage 1Elster V200 with
Freestyle embedded
Stage 2Aquiba A200Z
Daily automated file transfer of Interval Water Meter Reads to
Water Corporation
73

© Copyr igh t 2012 OSIso f t , LLC.
Brought to you by