projects to primarily address 'moving issues' · projects to primarily address...
TRANSCRIPT

» Calle M30, Madrid
BProjects to primarily address 'moving issues'
road space creationb1 Harbour, Cross City & Lane Cove Tunnels, Sydneyb2 A86 Tunnels, Parisb3 Clem Jones & M7 Motorway, Brisbaneb4 Fraser River Toll Crossings, Vancouverb5 Costanera Norte, Santiagob6 Urban Highways, Mexico Cityb7 The Big Dig, Bostonb8 LBJ/I-0365, Dallasb9 Gota Tunnel, Gothenburgb10 Hovenring, Eindhoven
road space re-allocation
b11 Cycle Superhighway, Copenhagenb12 Carrera 7, Bogotab13 LRT & Pedestrianisation, Strasbourgb14 Cycling Network & Hire, Strasbourgb15 Mobilien Bus Network, Parisb16 Ciclovia & Ciclorutas, Bogotab17 The Spui, The Hagueb18 Multi-Use Lanes, Barcelona
road space demand managementb19 N-VI HOV Lane, Madrid b20 Spitscoren, Rotterdamb21 Pico y Placa, Bogotab22 INSTANT, Bangaloreb23 Go520, Seattle


93roads − international case studies
Chapter B2 | Sydney Harbour Tunnel, Cross City Tunnel & Lane Cove Tunnel, Australia
Name of project: Sydney Harbour Tunnel, Cross City Tunnel & Lane Cove Tunnel Location: Sydney, AustraliaYear: 1992-2007*Cost: Harbour Tunnel, AUD$685 million, Cross City Tunnel, AUD$1 billion, Lane Cove Tunnel, AUD$1.1 billion
B1Reasons for the projects
The Sydney Harbour Tunnel was designed to provide a second road crossing of Sydney Harbour in order to relieve congestion issues experienced on the Sydney Harbour Bridge.
The Cross City Tunnel provides fast through access between the main Western and Eastern Distributor roads, allowing drivers to bypass the most congested roads in the city centre.
The Lane Cove Tunnel was designed to improve journey times between Sydney city centre and the newly-developed north west region of the city.
Short project description
The Sydney Harbour Tunnel is a twin tube 2.8km tunnel crossing under Sydney Harbour, and was built in 1992 in order to provide a second crossing of the harbour, and thus relieve some of the congestion issues on the original Sydney Harbour Bridge crossing.
The Cross City Tunnel is a 2.1km tunnel in the centre of the city that opened in 2005. It connects Darling Harbour with the Eastern Suburbs. The Cross City Tunnel is two separate tunnels, with slightly different alignments for each direction of travel. It was designed to alleviate congestion in the central business district area by allowing easier travel for drivers making trips through Sydney city centre.
The Lane Cove Tunnel was the last of these three tunnels to open, in 2007. It is a 3.6km twin-tube tunnel that links the M2 motorway, with Gore Hill Freeway, completing the Sydney Orbital motorway network. The purpose of the Lane Cove Tunnel was to connect the two motorways, reduce travel times for vehicles using the two motorways it connects to, and reduce congestion on local roads that had previously been used.
* Sydney Harbour Tunnel opened 1992; Cross City Tunnel opened 2005; Lane Cove Tunnel opened 2007.

94 roads − international case studies
Chapter B1 | Sydney Harbour Tunnel, Cross City Tunnel & Lane Cove Tunnel, Australia
city context
Sydney is the state capital of New South Wales, and is the most populated city in Australia, with over 4.6 million inhabitants living in the greater metropolitan area. The city lies on the south-eastern coast of Australia, on the Tasman Sea, with the city built on hills surrounding Sydney Harbour. Sydney is the most densely populated city in Australia, with an average density of over 2,000 people per km2. This figure rises to over 4,000 per km2 in Inner Sydney, the main city centre region.
Sydney is the financial and economic centre of Australia, with the focus having shifted from manufacturing to the services and information sectors in the 1980s.
transport policy context
The Roads 2000 plan, as developed in 1986 by the Roads and Maritime Services, followed on from a report conducted by the Commonwealth Bureau of Roads in 1975 which highlighted the need for significant investment in urban arterial road construction in the Sydney metropolitan area. In the intervening years of economic restraint, very little progress was achieved, and the Roads 2000 plan was laid out, with its main focus being a huge maintenance catch up in resurfacing highways, replacing bridges in rural areas and the 'introduction of innovative traffic measures' in the cities.
The largest component of the Roads 2000 plan was the Sydney Orbital, a new freeway/motorway route around Sydney, intended to link all the radial and inter-city freeways, while bypassing busy urban centres. This entailed connecting already built parts of the network, by building a number of new sections to be built and operated by private companies. The Sydney Harbour Tunnel was one of the first stages of the plan to be completed, with the Cross City and Lane Cove tunnels some of the last stages to be completed.
The Project
sydney harbour tunnel
The Sydney Harbour Tunnel is 2.3km in length and connects the Warringah Freeway on the northern side of Sydney Harbour to the Cahill Expressway, south
of the harbour. It includes a one kilometre section below the harbour constructed by the immersed tube method. The tunnel forms part of the Sydney Orbital motorway network, a 110km ring-road around Sydney, much of which was built by private companies and is tolled. The road was opened in August 1992.
The Sydney Harbour Tunnel project was developed in response to increasing traffic congestion on the Sydney Harbour Bridge and the surrounding roads. The Roads and Maritime Services agency identified an alternative cross-harbour route as a way to alleviate this congestion in their Roads 2000 (Sydney Orbital) plan.
The Harbour Tunnel operates a time-based tolling system for southbound travel only, with charges of AUD$4 at peak times, AUD$3 between peak periods, and AUD$2.50 after the evening peak. These are the same charges that are applied to travel on the Sydney Harbour Bridge. The tunnel has used electronic tolls exclusively since 2007. There are no toll booths and drivers are unable to pay cash. Instead, they pay via an electronic tag or pass, from which the toll is automatically deducted as the car passes a sensor.
figure B1.0
sydney harbour tunnel entrance
figure B1.1
sydney harbour tunnel route

95roads − international case studies
Chapter B2 | Sydney Harbour Tunnel, Cross City Tunnel & Lane Cove Tunnel, Australia
cross city tunnel
The Cross City Tunnel provides direct through access between the main Western and Eastern Distributor roads, allowing drivers to bypass the most congested roads in the city centre. Together with the harbour crossings, the Cross City Tunnel allows traffic to pass directly from the eastern suburbs to the northern parts of the central business district and then the northern suburbs. Construction began in January 2003, and the road was opened in August 2005.
The Cross City Tunnel was Sydney's first motorway with full electronic tolling.
The Cross City Tunnel operates fixed tolls throughout the day, with higher charges for vehicles taller than 2.8m and/or greater than 12.5m in length (AUD$9.74 compared to AUD$4.74 for smaller vehicles). Tolls on the Cross City Tunnel are adjusted quarterly in line with movements in the Consumer Price Index or a 0.75% minimum increase.
figure B1.2
cross city tunnel entrance
figure B1.3
cross city tunnel route

96 roads − international case studies
Chapter B1 | Sydney Harbour Tunnel, Cross City Tunnel & Lane Cove Tunnel, Australia
lane cove tunnel
The Lane Cove Tunnel is a 3.6 km twin tunnel motorway under Epping Road that links the M2 Motorway at North Ryde with the Gore Hill Freeway at Artarmon. It also forms part of the Sydney Orbital motorway network. The Roads and Maritime Services agency initiated the Lane Cove Tunnel project in response to a marked increase in traffic on roads in that area following the completion of another part of the Orbital network, the Gore Hill Freeway. The Lane Cove Tunnel was designed to divert traffic from this area, reduce travel times between the north-west and the city and provide a direct link between the north-west and The Sydney Orbital Network. Construction began in June 2004, and was completed in March 2007.
The Lane Cove Tunnel operates in the same way as the Cross City Tunnel, with charges for cars and motorcycles currently at AUD$2.93, with truck tolls at AUD$5.87. Lane Cove Tunnel tolls are also adjusted quarterly in the same fashion as for the Cross City Tunnel. Electronic tolls have been used since the tunnel opened in 2007.
Funding and implementation
sydney harbour tunnel
The Sydney Harbour Tunnel Company (SHTC), a consortium of the Tenix Group, Transfield, and Kumagai Gumi, were awarded the AUD$680 million contract in 1992, and will operate and maintain the Sydney Harbour Tunnel until August 2022 when it will be transferred to public ownership.
cross city tunnel
The Cross City Motorway consortium were chosen to design, construct, and operate the road in 2002. The travel operators faced challenges related to the high toll rate and the incompatibility of the toll system with other systems across the city. In December 2006, the consortium went into receivership, and the concession was bought by a consortium led by ABN-AMRO and Leighton Contractors in September 2007 for AUD$700 million. The new consortium will operate and maintain the tunnel until the end of the concession in 2030.
lane cove tunnel
The contract to build, fund and operate the Lane Cove Tunnel was won by a private sector group, the Lane Cove Tunnel Company consortium (now known as Connector Motorways), backed by AUD$540m of equity investments and AUD$1,140m of debt finance. Under the contract the consortium had to complete all work by 10 May 2007, and motorway tunnels and ramps were to be operated and maintained by the consortium until 10 January 2037. The company went into receivership in 2010, and the concession was
figure B1.4
lane cove tunnel entrance
figure B1.5
lane cove tunnel route

97roads − international case studies
Chapter B2 | Sydney Harbour Tunnel, Cross City Tunnel & Lane Cove Tunnel, Australia
bought in May 2010, by Transurban, a company that currently own a number of the toll roads on the Sydney Orbital network. They will operate and maintain the Lane Cove Tunnel until the end of the concession in 2037.
Impacts of the project
A post implementation review of the construction of both the Cross City and Lane Cove Tunnels was undertaken by the Regional Transport Authority (RTA), in order to review and refine the process for developing future private sector motorway projects.
Usage: Though both the Cross City and Lane Cove Tunnels were shown to have improved congestion and public transport viability, both also experienced lower traffic volumes than had been forecast. Lane Cove had been forecast to carry 100,000 vehicles per day, with 90,000 per day forecast for the Cross City Tunnel. In 2010, 55,000 vehicles were using the Lane Cove Tunnel each day. Traffic volumes for the Cross City Tunnel were lower, at 25,000 vehicles (which increased to 33,000 when periods of reduced tolls were in operation).
Traffic using the Sydney Harbour Tunnel is the highest of the three, at approximately 86,000 in 2005 and 90,000 in 2008 (figures reported every three years). This is still lower than the 113,000 forecast initially in 1987. Traffic volumes using the tunnel are just over half of the volume using the Sydney Harbour Bridge crossing (161,000 in 2005).
Mode share: An integral part of all three schemes was to increase public transport provision. This
mainly involved extra public transport lanes where capacity was released on roads surrounding the three schemes (not on the toll roads themselves). For example, a dedicated bus lane was introduced on the Sydney Harbour Bridge as part of the Sydney Harbour Tunnel project. This led to a marked improvement in the reliability and frequency of city-bound bus services, which in turn led to higher uptake of public transport services.
An additional 8km of pedestrian cycleway has also been constructed in the area surrounding the Lane Cove tunnel.
Journey times: Journey times have improved on all routes for private vehicles and public transport. The Lane Cove Tunnel was found to have reduced journey times for private vehicle traffic by 8 minutes on average. Similarly, the provision of 5.6km of bus lanes on nearby roads has seen a reduction of an average of 10 minutes in bus travel times.
Congestion: It was found that the Cross City Tunnel had helped to remove 45,000 vehicles per day from the central business district, resulting in reduced congestion, and that overall connectivity between the east and west areas of the city had greatly improved.
Improvements to road connectivity in the area surrounding the Lane Cove tunnel has seen traffic on local roads fall from 90,000 per day to 40,000.
Public acceptance/reaction
Information not obtained.

99roads − international case studies
Chapter B2 | A86 tunnel, Paris, France
Name of project: A86 tunnelLocation: Paris, FranceYear: 2003-2011Cost: €2.2 billion
Reasons for the project
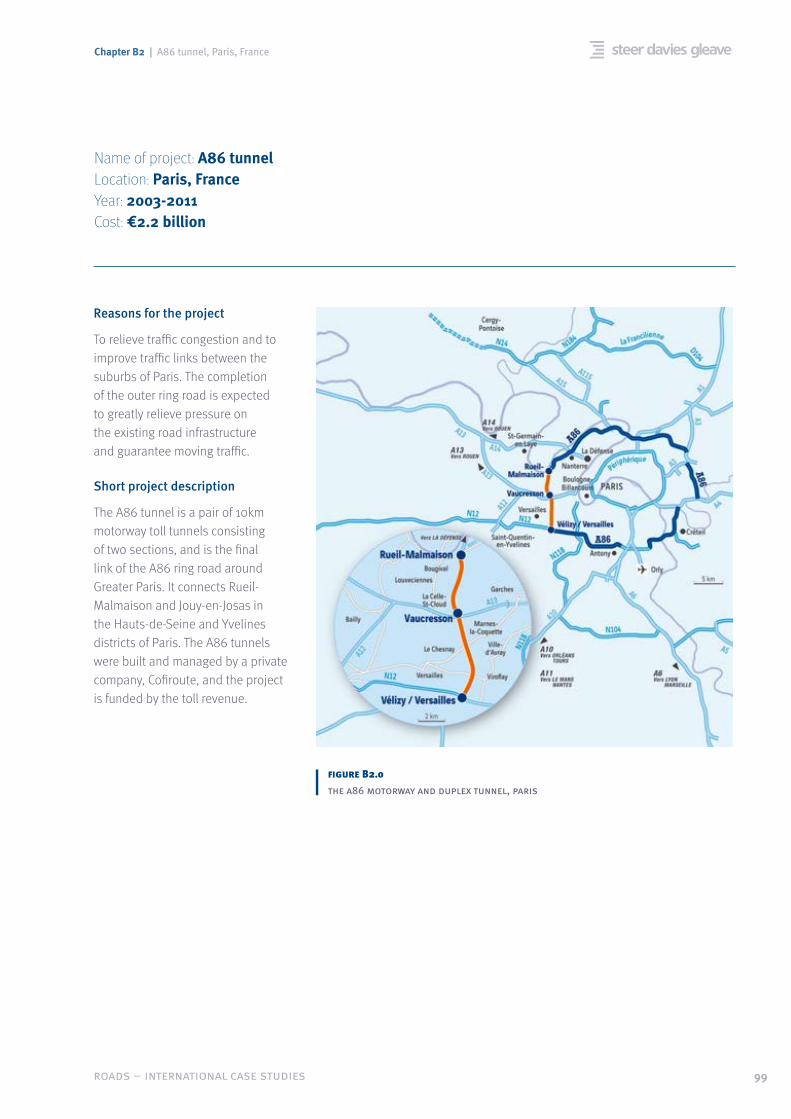
To relieve traffic congestion and to improve traffic links between the suburbs of Paris. The completion of the outer ring road is expected to greatly relieve pressure on the existing road infrastructure and guarantee moving traffic.
Short project description
The A86 tunnel is a pair of 10km motorway toll tunnels consisting of two sections, and is the final link of the A86 ring road around Greater Paris. It connects Rueil-Malmaison and Jouy-en-Josas in the Hauts-de-Seine and Yvelines districts of Paris. The A86 tunnels were built and managed by a private company, Cofiroute, and the project is funded by the toll revenue.
figure B2.0
the a86 motorway and duplex tunnel, paris

100 roads − international case studies
Chapter B2 | A86 tunnel, Paris, France
The Project
The A86 motorway is the second orbital ring road around Paris, and the distance from the city centre varies from 8km to 16km. The A86 is part of the four ring road system surrounding Paris and Ile-de-France. The A86 tunnel completes a ‘gap’ in the ring road.
The proposed route for the A86 featured a number of road building challenges. As a mainly residential area, it inlcuded important historical monuments in Versailles and protected woodlands. After rejecting 22 proposals, the A86 West underground solution was accepted as a viable solution.
The A86 West project involved two tunnels, the East and West tunnels. The East tunnel is exclusively for light vehicles with 2m-clearance height and features two decks, each with three lanes. Each level is independent of the other, watertight and with individual air ventilation systems. It features an intermediate intersection with the A13 motorway.
The West tunnel accepts all vehicles including HGVs, its smaller internal diameter allows for two carriageways, one in each direction with the same ventilation system being used.
The tunnels are tolled, and this is the only income for Cofiroute, who put a tariff policy in place favouring off peak journeys. To encourage the flow of traffic, toll rates are adjusted depending on the time a journey is made. For example, travelling from Versailles to Rueil-Malmaison during a week day rush hour (7am – 10pm) would cost €9 while the same journey between 6am - 7am costs €7, and between 10am - 4pm costs €6. Rates are regulated and approved by the State.
Electronic tolls are activated before entering the tunnel. Registered toll users receive a badge which is attached to the windscreen of the car. This is detected at the entrance and exit of the tunnel and allows drivers to pay based upon which part of the tunnel they used. It is not compulsory to subscribe to the electronic toll; infrequent users can use cash or card, but will not receive the discounted tolls granted to those with an electronic tag.
city context
Paris, situated in the Île-de-France region, is the capital and largest city of France. The population of the city is approximately 2.1 million and the entire population of the Paris metropolitan area is calculated to be in excess of 11.5 million inhabitants. The city is divided into 20 administrative districts (arrondissements) arranged in the form of a clockwise spiral starting in the middle on the Right Bank of the river Seine.
Home to La Défense, the largest business district in Europe, Paris produces more than a quarter of the gross domestic product of France. The city is also a major tourist destination.
transport policy context
The transportation system in Paris is very diverse, with a number of different modes providing extensive connectivity not only across the city centre, but in the city’s outer-lying suburbs and districts.
The city has a total of 14 Metro lines, of which 12 operate as routes connecting the city centre to outer suburbs, and two operate as lateral routes around the city centre. The Metro is supplemented by a number of other modes, including 5 RER (Réseau Express Régional) urban transit lines, that serve the outer parts of the Ile-de-France region (i.e. beyond the Metro termini), 6 Transilien suburban rail lines that serve areas not served by Metro or RER lines, 4 tramway lines in the outskirts of the city connecting to Metro and RER stations, and a large network of bus routes. In addition, 2007 saw the arrival of Velib, the city’s cycle hire scheme, which, with over 16,000 bicycles and 1,200 bicycle stations, is the second largest in the world.
Paris has a series of inner and outer ring roads (similar to the North and South Circular routes in London) that supplement a series of diametrically aligned motorways that feed into the city. Roads in the city, particularly the Boulevard Périphérique ring road, have suffered from significant congestion. (cont'd)

101roads − international case studies
Chapter B2 | A86 tunnel, Paris, France
The A86 tunnel was designed to meet specific safety requirements:
» The concept of the tunnel, two floors of traffic travelling in opposite directions that do not intersect, prevents collisions occurring inside the tunnel.
» Motorists are informed of traffic conditions through electronic message boards located every 400m along the tunnel.
» CCTV systems and automatic incident detection can detect a vehicle stopped within 10 seconds.
» 100 staff are permanently based at the tunnel.
» Safety shelters are located every 200m along the tunnels and can be accessed by all motorists.
An independent European investigation in 2010 (EuroTAP) audited safety in 26 tunnels in 13 countries, and the A86 tunnel was recognised as the safest.
Funding and implementation
The A86 project has been designed with 90% of the route being underground. The emergence of each shaft has been designed to fit into the landscape; the ramps are buried, vegetation surrounds the ventilation shafts, and access points have been designed to blend in with the local environment.
Tunnel boring for the first section was completed in October 2003 and fitting of the tunnel as well as remodelling the A13 toll plaza was started in April 2004. In June 2005 digging was started for the second section of tunnel, and completed in 2007.
The ventilation system for the first section was completed in 2006. The 4.5 km section between Rueil-Malmaison and the A13 motorway was opened in July 2009. The final section between the A13 and Jouy-en-Josas, was opened in January 2011. From 26th June to 31st August 2009, the tunnel was open daily from 6am to 10pm. Since 1st September 2009, the tunnel has been open 24 hours a day.
The A86 motorway, the 79km ring road around Paris, is funded and operated by the state, with the exception of the 10km tunnel section. The construction and maintenance of the tunnel was funded by a private company, Cofiroute. The section between Vérsailles and Rueil is tolled and is a source of income for Cofiroute, who will operate the concession until 2079. Cofiroute employ 100 staff on the concession.
In spite of the public transport provision available in the city, transport surveys carried out in the city in the late 1990s highlighted an alarming trend of increased private transport use, particularly in the inner and outer suburbs. At the same new laws came into force in France, stipulating that all conurbations with populations greater than 100,000 must prepare a form of urban travel plan, entitled a Plan de Déplacements Urbains or PDU. The Paris PDU was adopted at the end of 2000 for a five year period. At this time 61% of all trips within the city of Paris were made by public transport and 31% by car. However trips made between suburban locations were dominated by the car, which was used for 82% of trips.
The primary aim of the PDU was to achieve a 5% reduction in private vehicle use for travel inside Paris and the inner suburb departments, and between Paris and the other departments, and a 2% reduction for travel within the outer suburbs and between the inner and outer suburbs. In order to achieve this aim, the PDU targeted an increase of 2% in public transport use in the city as well as doubling the number of cyclists on the roads by 2006.
Historically, there have been many issues surrounding how best to reach a solution for the now A86 link, which saw the debate continue for more than 30 years. The construction of the Boulevard Peripherique, the inner ring road, and increasing parking for cars in the city resulted increased congestion. Paris is now pursuing a different policy of improving public transport, and improving transport links between the outer districts.
The A86 aims to redirect traffic from the city roads and reduce localised congestion.
transport policy context (cont'd)

102 roads − international case studies
Chapter B2 | A86 tunnel, Paris, France
figure B2.1
landscaped ventilation units
figure B2.2
toll entrance to the a86 duplex
Impacts of the project
Usage: After one year of operation, the first stretch of the tunnel between Rueil-Malmaison and the A13 motorway was carrying 12,000 to 13,000 vehicles per day, consistent with forecast levels. This figure increased to just under 20,000 in 2011, an increase of 66%.
Journey times: A journey from Rueil-Malmaison to Versailles has reduced to 10 minutes compared with 45 minutes previously using surface streets. The Jouy-en-Josas to Nanterre journey time is 10 to 15 minutes using the tunnel compared with 50 minutes to one hour using surface streets.
Air quality: The faster journey times seen of the A86 tunnel are claimed to also lead to fuel savings for drivers. INRETS calculated that a return journey from Rueil to Vaucresson would result in a fuel saving of 32% by using the A86 tunnel rather than the alternative surface streets.
Public realm: The project did not create any additional surface space but woodland areas, historical buildings and residential properties were unaffected along the route by using this tunnelling solution.
Road safety: Within 18 months of operation, only one injury accident has occurred in the tunnel. However, there have been suggestions that the tunnel is underused due to insufficient signposting and the fact that it does not appear on all sat nav programmes.
Public acceptance/reaction
Information not obtained.

103roads − international case studies
Chapter B3 | Clem Jones Tunnel , Brisbane, Australia
Name of project: Clem Jones Tunnel – M7 MotorwayLocation: Brisbane, AustraliaYear: 2006-2010*Cost: AUD$3.2 billion, forecast cost AUD$2.0 billion
Reasons for the project
To reduce the level of congestion on roads in the city centre, particularly through the business and entertainment districts, by constructing a tolled 4.8km tunnel through the centre of Brisbane.
Short project description
The CLEM7 tunnel is a 4.8km north-south tunnel that bypasses the city centre and crosses under the Brisbane river. It is the city’s first toll road with toll collection via electronic tags or automatic imaging of vehicle licence plates. The tunnel is part of a proposed new underground motorway (M7) through Brisbane which includes the Airport Link tunnel opened in July 2012.
figure B3.0
brisbane centre before the tunnel
* Construction began in 2006 and was completed in 2010.

104 roads − international case studies
Chapter B3 | Clem Jones Tunnel , Brisbane, Australia
city context
Brisbane is located on the eastern coast of Australia and is the capital city of the state of Queensland. It is the third largest city in Australia with an estimated 2.15 million inhabitants and a surrounding urban conurbation of more than 3 million. Brisbane is one of the fastest growing cities in Australia, with a population increase of 11.5% between 2006 and 2011. It is home to a prosperous financial centre that has enjoyed consistent economic growth in recent years.
The city is centred on a low-lying flood plain along the Brisbane river and is prone to flooding. Certain areas of the city however, such as the business district, sit in partially elevated areas. The city centre area covers approximately 1,367 km2, with a density of 770 people per km2. The level of density is comparable to density levels in the Sydney metropolitan region. There are a total of nine bridges that cross the Brisbane river in the city, of which one is for rail only, with a further four for pedestrians and cyclists only. The most recently constructed bridge, the Go Between which opened in late 2010, is currently operated as a toll bridge.
The Project
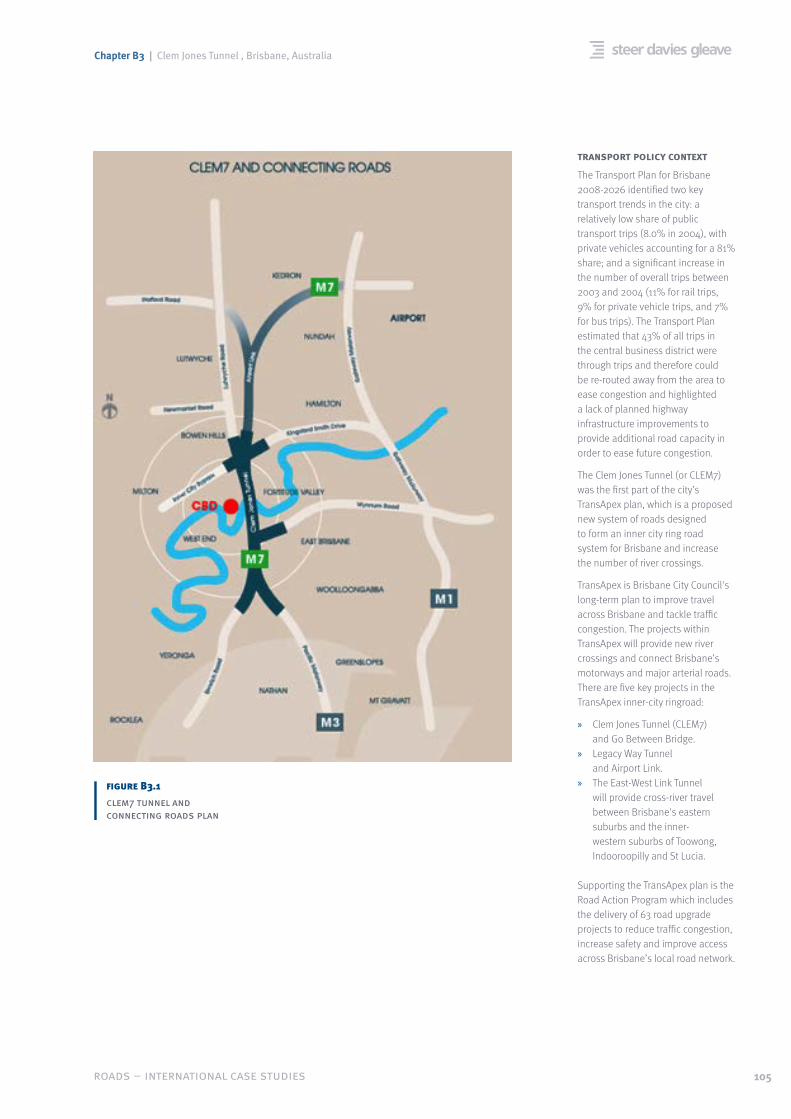
The CLEM7 tunnel is a 4.8km north-south tunnel that links five existing major motorways and arterial roads on the north and south sides of the Brisbane River, bypassing the city centre and crossing under the River. It consists of two parallel tunnels that are approximately 10 metres apart. The two tunnels are connected by 41 cross-passages that are spaced every 120 metres along the entire length of the road. The tunnel forms part of a proposed new underground motorway (M7) through Brisbane which incorporates the second phase of the TransApex program, the Airport Link tunnel, which opened in July 2012. The CLEM7 tunnel and the Airport Link are shown on Figure B3.1.
The tunnel is Brisbane’s first private toll road. Two systems for toll collection are used in the tunnel: electronic tag tolling and automatic imaging of licence plates for cars not fitted with the electronic tag.
For the first two weeks following the opening of the road, tolls were not charged. In April 2010, an introductory toll of AUD$2 per car was charged over a five week period, which was then extended to the end of 2010. As of August 2012, tolls for the road are AUD$4.05 per car and AUD$12 for heavy commercial vehicles. The Airport Link is operated by a different company and vehicles are tolled twice if they use the entire M7 motorway.
Funding and implementation
CLEM7 was delivered via a public private partnership arrangement. The concession was awarded to RiverCity Motorway to operate and maintain the road for 45 years, at which point the tunnel will be transferred to Brisbane City Council.
Construction commenced in September 2006. Tunnelling was completed in May 2009, and the tunnel was opened to traffic in March 2010. The total cost of the project is estimated to have been AUD$3.2 billion, compared with AUD$2 billion originally forecast.
105roads − international case studies
Chapter B3 | Clem Jones Tunnel , Brisbane, Australia
transport policy context
The Transport Plan for Brisbane 2008-2026 identified two key transport trends in the city: a relatively low share of public transport trips (8.0% in 2004), with private vehicles accounting for a 81% share; and a significant increase in the number of overall trips between 2003 and 2004 (11% for rail trips, 9% for private vehicle trips, and 7% for bus trips). The Transport Plan estimated that 43% of all trips in the central business district were through trips and therefore could be re-routed away from the area to ease congestion and highlighted a lack of planned highway infrastructure improvements to provide additional road capacity in order to ease future congestion.
The Clem Jones Tunnel (or CLEM7) was the first part of the city’s TransApex plan, which is a proposed new system of roads designed to form an inner city ring road system for Brisbane and increase the number of river crossings.
TransApex is Brisbane City Council's long-term plan to improve travel across Brisbane and tackle traffic congestion. The projects within TransApex will provide new river crossings and connect Brisbane’s motorways and major arterial roads. There are five key projects in the TransApex inner-city ringroad:
» Clem Jones Tunnel (CLEM7) and Go Between Bridge.
» Legacy Way Tunnel and Airport Link.
» The East-West Link Tunnel will provide cross-river travel between Brisbane's eastern suburbs and the inner-western suburbs of Toowong, Indooroopilly and St Lucia.
Supporting the TransApex plan is the Road Action Program which includes the delivery of 63 road upgrade projects to reduce traffic congestion, increase safety and improve access across Brisbane’s local road network.
figure B3.1
clem7 tunnel and connecting roads plan

106 roads − international case studies
Chapter B3 | Clem Jones Tunnel , Brisbane, Australia
Impacts of the project
Usage: In the first 2 weeks of the scheme, where toll charges were suspended, average daily traffic was around 59,000 vehicles. After the first month of introductory tolls, this figure fell to around 21,000, rising to 28,000 after six months. Two years after the tunnel was opened, average daily traffic was just under 22,000. Initial data from the week following the opening of the adjoining Airport Link road in July 2012 showed an increase in traffic in the CLEM7 tunnel to 32,000 daily vehicles using the tunnel.
The number of vehicles using the tunnel has consistently been significantly lower than that forecast and this is currently the subject of legal proceedings between the contractor and its advisors.
In February 2011 RiverCity Motorway went into receivership, but continue to operate the toll road.
Air quality: Quarterly monitoring of air quality and noise in the tunnel since its opening in 2010 has demonstrated that there has been minimal impact on air quality and noise pollution and that noise pollution is generally in keeping with local planning guidelines.
Public acceptance/reaction
Initial public response to the overall TransApex Plan was positive, with the scheme cited as being a significant reason for securing a win in the Lord Mayoral elections for the candidate who proposed it.
Support has declined in recent years, with many communities experiencing construction noise and air pollution. In total, LBB (construction company that built the tunnel) had recorded 912 complaints in the first two years of the construction. Of those, 335 related to noise, 166 to traffic, 135 to property damage and 77 to dust. The rest concerned vibration and other issues.
Local media also reported a large number of complaints that tolls were set much higher than the AUD$2 that was proposed in the Lord Mayor’s election manifesto. Tolls for the Clem7 were raised from the introductory AUD$2 to AUD$3.95 shortly after its opening. However, RiverCity Motorway returned to the AUD$2 toll following a decline in traffic.
figure B3.2
clem 7 tunnel after completion
after

107roads − international case studies
Chapter B4 | Fraser River Toll Crossings, Greater Vancouver, Canada
Name of project: Fraser River Toll CrossingsLocation: Greater Vancouver, CanadaYear: 2009-2013*Cost: CAD$800 million Golden Ears Bridge, CAD$1.6 billion Port Mann Bridge**
* Golden Ears Bridge opened 2009; Port Mann Bridge programmed to open 2013
Reasons for the project
Significant population growth in the northwest sector of the Greater Vancouver region has resulted in an increased demand for cross river traffic The Golden Ears Bridge was a new facility built to address this increased demand, reduce congestion on existing roads and bridges and improve accessibility to local industrial and commercial areas. It replaced a cross-river vehicular ferry.
The current Port Mann Bridge, built in 1964, crosses the Fraser River and connects the City of Coquitlam to the City of Surrey. The Port Mann Bridge has become highly congested - on average for 13 hours a day - due to significant population growth and an increase in vehicle and truck movement throughout the region. The planned new Port Mann Bridge is designed to accommodate and manage this growth.
Both bridges are aimed at congestion reduction by increasing capacity, and using tolls and public transport improvements to manage future demand.
Short project description
The Golden Ears Bridge, a six-lane electronic toll bridge of the Fraser River connecting Surrey and Langley with Maple Ridge, opened in 2009. This new link in the road network is the first electronic toll facility in western Canada and has had a major impact on travel time and travel patterns in the area.
The new Port Mann Bridge is part of the Port Mann Bridge/Highway 1 Improvement Project, which will include the construction of 10 traffic lanes on the bridge, 30 kilometres of High Occupancy Vehicle (HOV) lanes along Highway 1 and transit priority lanes. The bridge will also include pedestrian and cycle facilities (the current bridge does not allow pedestrians or cyclists). The bridge will be electronically tolled and is scheduled to be completed by early 2013.
figure B4.0
golden ears bridge

108 roads − international case studies
Chapter B4 | Fraser River Toll Crossings, Greater Vancouver, Canada
city context
Greater Vancouver, located on the west coast of Canada, is the third largest metropolitan area in Canada, with a population of 2.3 million. The region is among Canada’s largest industrial centres owing to its location on the Pacific Rim and at the terminus of transcontinental rail and highway routes. Port Metro Vancouver, Canada’s largest and busiest port, handles more than $75 billion worth of imports and exports each year. Vancouver is also a major tourist destination.
The population of the region grew by almost 200,000 people (9.3%) between 2006 and 2011 with further significant growth forecast (3.1 million by 2021).
transport policy context
An increase in population, significant economic growth, an increase in trade and tourism and a lack of investment in roads has resulted in Greater Vancouver’s road network becoming increasingly congested over the past decade.
In response to this, the Province of British Columbia’s Ministry of Transportation created the Gateway Program to ensure that current levels of road congestion are addressed and relieved. As such, the Gateway Program is designed to address the problem of growing regional congestion by:
» Improving roads, transit, and transportation infrastructure.
» Co-ordinating and guiding transportation infrastructure and service improvements.
» Incorporating all modes of transportation (i.e. transit, cycling, etc.) in all infrastructure improvement plans (i.e. Gateway Cycling Plan) and undertakings.
» Improving mobility and accessibility for all modes of transportation,
» Balancing transit, road and bridge improvements and investment.
» Continuing to promote a healthy, strong, and vibrant economy by relieving congestion along major and key commuter and trade routes.
The Gateway Program is complementary to other provincial and region-wide planning initiatives, such as the Provincial Transit Plan.
The Project
golden ears bridge
The Golden Ears Bridge is a new toll bridge across the Fraser River that connects Pitt Meadows and Maple Ridge to Surrey and Langley. The six-lane, 2.4km bridge provides separated pedestrian and bicycle facilities in each direction and the project also created 14 new kilometres of access roads.
Being a new link in the network and the first tolled facility in the region since the 1960s, the Golden Ears Bridge had a major impact on travel time and travel patterns in the area.
The tolls charged vary by vehicle type and payment arrangement. The toll ranges from CAD$2.95 for a registered car with a transponder to CAD$10.05 for an unregistered large truck. The toll applies to each trip across the bridge, in either direction. Exempt from the tolls are emergency vehicles, TransLink buses, Transit support and bridge maintenance vehicles.
figure B4.1
golden ears bridge location
109roads − international case studies
Chapter B4 | Fraser River Toll Crossings, Greater Vancouver, Canada
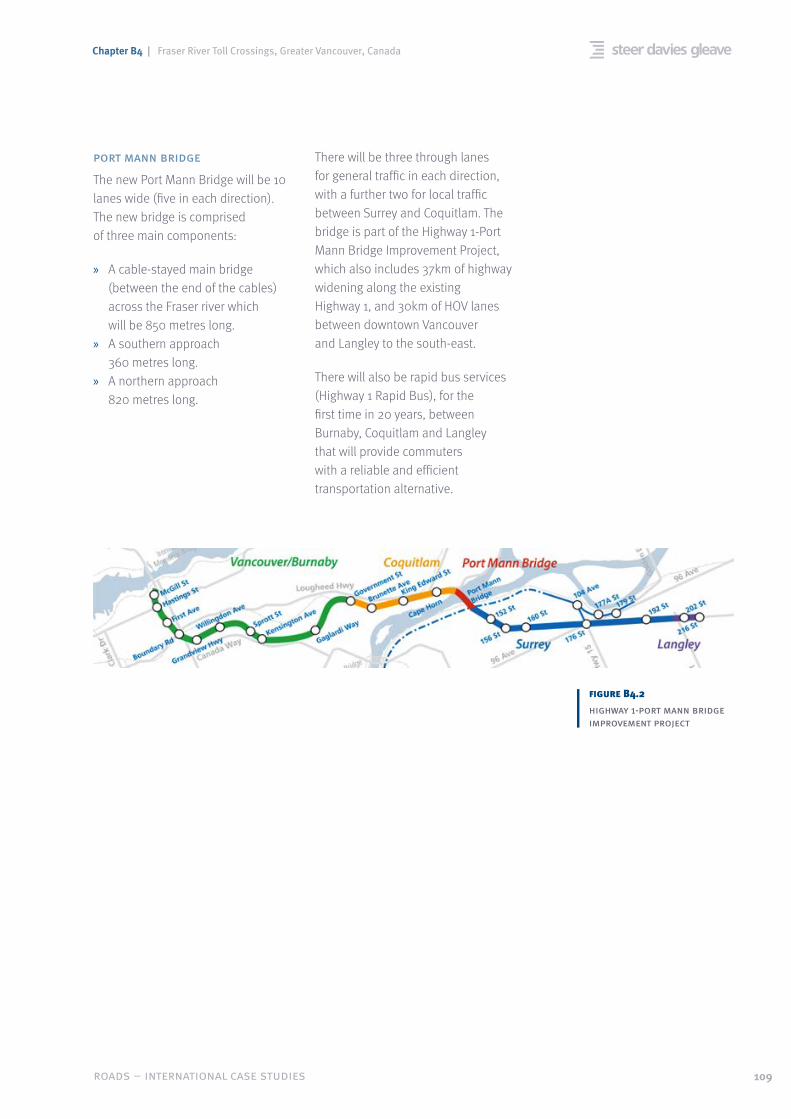
figure B4.2
highway 1-port mann bridge improvement project
port mann bridge
The new Port Mann Bridge will be 10 lanes wide (five in each direction). The new bridge is comprised of three main components:
» A cable-stayed main bridge (between the end of the cables) across the Fraser river which will be 850 metres long.
» A southern approach 360 metres long.
» A northern approach 820 metres long.
There will be three through lanes for general traffic in each direction, with a further two for local traffic between Surrey and Coquitlam. The bridge is part of the Highway 1-Port Mann Bridge Improvement Project, which also includes 37km of highway widening along the existing Highway 1, and 30km of HOV lanes between downtown Vancouver and Langley to the south-east.
There will also be rapid bus services (Highway 1 Rapid Bus), for the first time in 20 years, between Burnaby, Coquitlam and Langley that will provide commuters with a reliable and efficient transportation alternative.

110 roads − international case studies
Chapter B4 | Fraser River Toll Crossings, Greater Vancouver, Canada
Funding and implementation
golden ears bridge
The Golden Ears Bridge was developed as a public-private partnership by TransLink with the Golden Crossing General Partnership as the concessionaire under a 35.5 year design, build, finance, operate, maintain, and rehabilitate (DBFO) public-private partnership. The bridge is tolled and toll revenues were used to finance the project.
figure B4.3
golden ears bridge
port mann bridge
The Port Mann Bridge was intended to be delivered as a public-private partnership, but final terms with the preferred bidder were not agreed upon. As a result the Province of British Columbia’s Ministry of Transportation set up the Transportation Investment Corporation, a public agency tasked with implementing the Port Mann/Highway 1 Improvement Project. Transportation Investment Corporation will deliver and operate the Port Mann/Highway 1 Improvement Project, with the Kiewit-Flatiron General Partnership as the design-build constructor. The total project costs are currently forecast as CAD$3.3billion, with around half of that sum assigned to the construction of the Port Mann Bridge.
As with the Golden Ears Bridge, the new Port Mann Bridge will be funded by tolls and operate an electronic toll system, starting at CAD$3 per trip, with discount for registered carpools during peak periods and for large commercial vehicles that travel overnight. The tolling system is to be designed so that it is interoperable with the Golden Ears Bridge electronic toll.
Impacts of the project
The introduction of new highway capacity through these bridge projects has caused some controversy with a number of organisations lobbying to improve public transport throughout the region rather than build a new bridge, including a number of municipalities, the regional planning body (Metro Vancouver) and local environmental groups.

111roads − international case studies
Chapter B4 | Fraser River Toll Crossings, Greater Vancouver, Canada
golden ears bridge
Usage: While the bridge provides an important transportation link in the network and significant time and cost savings for commuters and goods movement, its status as the only tolled bridge in the region has remained a deterrent to some potential users with many drivers initially preferirng the longer travel distance and congestion of the alternate route over the Port Mann Bridge. Toll revenues in 2011 were CAD $33.7 million, 11% below projections. However with construction of the new Port Mann Bridge adding to delays and increased awareness of the alternative, the Golden Ears Bridge continues to experience considerable growth in traffic. The first three months of 2012 saw 2.41 million bridge crossings, a 12% increase compared to the same period the previous year. Daily usage is estimated at 30,000 vehicles per day.
Journey times: The bridge has greatly improved connections between the communities of Maple Ridge and Pitt Meadows and Surrey and Langley. Travel times between these communities have been reduced by twenty to thirty minutes as a result of the project, resulting in environmental benefits. However, thee are somewhat countered by the additional demand generated by the bridge.
Economic impact: In 2011, the Maple Ridge-Pitt Meadows area was considered the second-best real estate market in BC, with the completion of the bridge providing greater accessibility for both residents and companies relocating to a lower cost area. Although economic impacts of the bridge were estimated before construction, there has not been a before and after study.
port mann bridge
Usage: A significant unknown at this stage is the impact of the Port Mann Bridge project on traffic volumes and toll revenues on the Golden Ears Bridge and impacts on the other non-tolled bridges along the Fraser (Pattullo and Alex Fraser Bridges).
Journey times: Overall the bridge improvements have been designed to improve travel reliability and capacity on a critical link in the Greater Vancouver region.
The new Port Mann Bridge is designed to meet forecast capacity needs and reduce travel times by up to 30% while reducing emissions emitted from slow moving traffic.
Congestion: The introduction of the Rapid Bus scheme along the corridor is also expected to ease congestion levels, as commuters travelling from Langley and Coquitlam can choose to use the new 25-minute service each day rather than making the journey by car.
Mode share: The infrastructure improvements along the Port Mann Bridge will incorporate cycle and pedestrian facilities to ensure a comfortable and safe environment for walkers and cyclists, with improvements to accessibility for all users irrespective of travel mode. Roadway design improvements will further ensure vehicle, pedestrian, and cyclist safety along the corridor.
figure B4.4
port mann bridge rendering

112 roads − international case studies
Chapter B4 | Fraser River Toll Crossings, Greater Vancouver, Canada
Public acceptance/reaction
The fact that the Golden Ears Bridge is a new tolled river crossing means that the local population benefited from the new crossing and therefore reaction was generally positive. However, as the Port Mann Bridge represents introducing a toll on a current crossing (with upgraded facilities and increased capacity) it has been more controversial.
For Port Mann Bridge the proposed tolls have been announced recently and there are half the original proposed toll. This has been done to encourage drivers to sign-up for a bridge tolling account and to improve public perception. A number of organisations, such local municipalities, the regional planning body (Metro Vancouver) and local environmental groups, have also argued to improve public transport throughout the region rather than build more road capacity.
Finally the introduction of tolls on the Port Mann Bridge, in addition to Golden Ears Bridge, is raising the issue of regional tolls where, for example, lower tolls are applied across all Fraser River crossings rather than on a selected few.

113roads − international case studies
Chapter B5 | Costanera Norte, Santiago, Chile
Name of project: Costanera NorteLocation: Santiago, ChileYear: 2001-2005*Cost: USD$1.1 billion, forecast USD$611 million
* Construction started in November 2001 and was completed in April 2005.
Reasons for the project
Before construction of the toll road project, there was severe congestion on the Costanera Andres Bello road, one of the only roads to link the eastern suburbs to the centre. Despite measures such as peak-time changes in direction and SCOOT operation of traffic lights, speeds on the Costanera Andres Bello at certain times in the day averaged only 5km/h.
Short Project Description
The Costanera Norte toll road project was designed to increase the capacity between eastern suburbs and the centre of Santiago.
The concession included operating existing roads as well as constructing new ones to relieve congestion. Innovative toll systems are used to collect payment.
figure B5.0
costanera norte, context and configuration of the project

114 roads − international case studies
Chapter B5 | Costanera Norte, Santiago, Chile
city context
Santiago is the capital and largest city of Chile with a population of approximately seven million. Almost 50% of all Chileans live in the city. Santiago is located in the valley of Santiago and is crossed by the Mapocho River from east to west.
Over the last 20 years there has been a continuous and rapid growth in car ownership in the city, with a 4.8% average annual increase, starting from 320,000 cars in 1991 to roughly 1.3 million in 2011.
transport policy context
Toll roads in Chile are promoted by the Ministry of Publics Works. Since the 1990s the Ministry has sought to improve ageing infrastructure through the use of private funds in public-private partnership (PPP) type arrangements.
Toll road initiatives are not included in the master plan for Santiago (2000 – 10), which was focused on the promotion of public transport schemes and the definition of a set of projects, all of them with an emphasis on public transport solutions.
A full cross-city network of toll roads has been implemented using a Free Flow electronic toll collection system. This network includes the cross-town Costanera Norte and Autopista Central schemes and the ring road formed by Vespucio Norte and Sur. The final link in the ring road (Vespucio Oriente) is currently under development. This will provide a 10km toll road in a tunnel under the existing highway which would be reduced in scope. Further considerations are being given to the introduction of a congestion charging scheme in the eastern, more residential, part of the city.
The Project
The project includes 115 grade-separated junctions and 80 km of service roads, including entry/exit slip roads.
There are three broad land uses along the road. The east is mostly residential, home to the highest income population in the city (and the country), with high levels of car ownership. Business activities are concentrated in the central section, where most of the city’s public agencies and banks are located. The western section crosses lower income areas that host industrial activities, and connects with the international airport and the coast.
An innovative feature of Costanera Norte is the tolling system: Electronic Toll Collection (ETC). Vehicles use
an electronic tag or transponder that can be read from gantries over the road and the toll charged to the user’s account. In this way significant savings are achieved in construction costs, as there is no need to build extensive toll collection plazas in areas where space is at a premium. At the time of construction, the technology was only implemented successfully in two toll roads in the world: Highway 407 in Toronto and the Melbourne City Link.
Over 400,000 m2 of green areas were generated along the route, including sport and recreational areas for residents.
New retaining walls for the Mapocho River were built, improved and/or repaired.
figure B5.1
costanera norte, section in tunnel

115roads − international case studies
Chapter B5 | Costanera Norte, Santiago, Chile
Funding and implementation
The project was promoted by the Concessions Unit of the Ministry of Publics Works. In 2000, through an international open bidding process, a consortium consisting of Impregilo, Simest SpA, Fe Grande and Tecsa was awarded the contract to operate the road.
The concession was awarded under a shared risk option between the concessionaire and the public sector, which ensured a Minimum Income Guarantee. This was important in Chile at the time due to the 1998-2002 economic downturn, which reduced traffic levels to below forecast. The concession contract defines a range of values where this guarantee would apply. If revenues falls below the lower limit of the range, the government will pay the concessionaire an amount equivalent to that limit. When revenues are above the upper limit, the government and the concessionaire will share the excess amount.
The contract includes maintenance, refurbishment and operational responsibilities over a 33 year period.
figure B5.3
west section of the concession, after construction
after
figure B5.2
west section of the concession, before construction
before
116 roads − international case studies
Chapter B5 | Costanera Norte, Santiago, Chile
Impacts of the project
Congestion: A positive outcome of the project is the redistribution of the east-west traffic pattern, reducing congestion in central Santiago.
Air quality/ Environment: There have been reductions in air pollution and noise pollution and the water quality of the river has been improved by control of pollutant discharge into the river.
Public realm: The project resulted in the creation of new public space including 35,000 m2 of new green areas in the Providencia district and approximately 400,000 m2 of green areas in the western districts through the building of sports fields and other recreation facilities for residents.
Public acceptance/reaction
The project initially faced significant opposition due to the inclusion of existing roads into the concession.
Construction cost was a significant issue, increasing by more than 40% compared to the consortium’s initial bid.
In addition, real adjustments in user charges of 3.5% per annum are proving unpopular with users.
The Government has focused on the benefits of developing public roads through PPP contracts and the positive impacts to the city of Costanera Norte and other concessioned projects.

117roads − international case studies
Chapter B6 | Mexico City Urban Highways, Mexico
Name of project: Mexico City Urban Highways: Northern Urban Highway (Autopista Urbana Norte), Viaducto Elevado Bicentenario (VEB), Southern Urban Highway (Autopista Urbana Sur)Location: Mexico City, MexicoYear: 2008 to 2013 (estimated), first section of the Southern Urban Highway opened in August 2012Cost: *
Reasons for the project
The objective of the project was to increase capacity on congested urban roads by enhancing the capacity of major urban highway routes in order to:
» Reduce journey times. » Reduce emissions from
road vehicles. » Improve quality of life for
Mexico City residents.
Short project description
The Mexico City Urban Highways are a series of toll roads currently under construction in the north, south and central areas of the city. The roads are constructed along the alignment of existing road corridors and increase capacity by building new sections of highway on raised sections above the current road space. The new levels are tolled. Some sections of the roads also provide new links away from existing roads. A 5km tolled section of the southern urban highway is now open.
figure B6.0
northern urban highway
The Project
northern urban highway
The Northern Urban Highway will connect the north part of the city and its surrounding metropolitan areas with the central highways that run across the city from east to west. The Northern Urban Highway consists of nine km of six-lane highway built over the western side of the existing ring road (the “Periferico”). The Perifico was first built as an intra-urban route going from north to south.
Most of the Northern Urban Highway is an elevated road of six lanes, three in each direction as well as a 1.5 km section of tunnel.
The construction of the elevated section began in November 2011 and work is due to finish by June 2013.

118 roads − international case studies
Chapter B6 | Mexico City Urban Highways, Mexico
figure B6.1
viaducto elevado bicentenario, full project
city context
Mexico City’s Distrito Federal administrative area (covering the central area of Mexico City) has a population of 8.7 million people; the entire metropolitan area has a population of 21.3 million.
As the capital of Mexico, the city is a focus for the country’s industrial activity and accounts for around 20% of the country’s GDP. Mexico City is one of the most important financial centers in North America. Mexico was ranked the 10th largest country by the Word Bank in 2011 in terms of GDP output.
Mexico City has an approximate land area of around 1,485 square kilometres (573 square miles).
transport policy context
In Mexico City, the Mayor of the Distrito Federal Marcelo Ebrard has promoted a strongly infrastructure-focused transport policy. A major element of this policy has been the implementation of a network of “second storey” roads, elevated over existing major routes, and tolled using pre-paid payment cards.
The network, which currently involves elevated sections along the west and south sides of the city’s outer bypass, called the Periferico, is now entering operation.
The new routes are intended to be introduced alongside a number of complementary initiatives including new segregated public transport lanes using part of the existing ground-level motorway, a reorganisation of public transport services (accompanied by financing for further bus rapid transit schemes in the city) as well as funding for environmental improvements to the Bosque de Chapultepec (the city’s major park, bisected by the periferico), and new cycle lanes.
viaducto elevado bicentenario
The main objective of the Viaducto Elevado Bicentenario is to connect Mexico City with the northern metropolitan zones of the city, via 32 km of elevated tolled road and a connection with the Northern Urban Highway.
The project consists of three phases. The first is a 22 km reversible road, the second phase consists of a parallel road to the first one, and it will be built once the first one reaches its maximum capacity. The third phase consists of a 10 km stretch on both first and second parts, to join the “Mexico- Querétaro highway”.
The project was the first of its kind in Mexico to have a fully automated toll system and the highway lighting on its entire length is provided by solar energy.
southern urban highway
The Southern Urban Highway comprises a second storey for the south-western section of the Periferico over an 11km section, the first 5km of which were opened in August 2012.
The Southern Urban Highway aims to increase road capacity in the southern areas of the city. The road is 11.3km long and is expected to carry 36,000 vehicles a day when it comes into operation.
As with the other highways, it consists of elevated sections designed to maximise capacity along existing corridors. Due to traffic congestion and confined space along the route of the road, the sections of highway have been prefabricated off-site and are assembled on location. The first 5km section of the Southern Urban Highway has been operational since August 2012 and is open from 5am to 11pm daily. The toll is $1.87 Mexican Pesos per km.

119roads − international case studies
Chapter B6 | Mexico City Urban Highways, Mexico
Funding and Implementation
The funding of the project is a public/private scheme with the private sector taking construction and some revenue risk in return for annual payments from the public sector.
The toll road concessions include design, financing, construction and operation of the projects. The concessions last for 30 years and the client is the Mexico City government.
Tolls are collected via an in-car smart card. However, on the southern urban highway vehicles are currently required to stop at the card reader on entry and exit.
Impacts of the project
Usage: According to the local administration, daily usage on the opened section of the southern urban highway increased from 17,000 to 38,000 in the first month. However, local media had argued that the road is under used.
Journey time: The three projects are intended to allow users to save significant amounts of travel time. It is estimated that the average user’s journey time will reduce by about 50%. However, currently getting on and off the highway involves stopping at the card reader.
Congestion: The toll levels, which will be high by current Mexican standards, are likely to mean the absence of congestion on the tolled level. The critical element will be the level of congestion experienced by users in accessing and leaving the new lanes.
figure B6.2
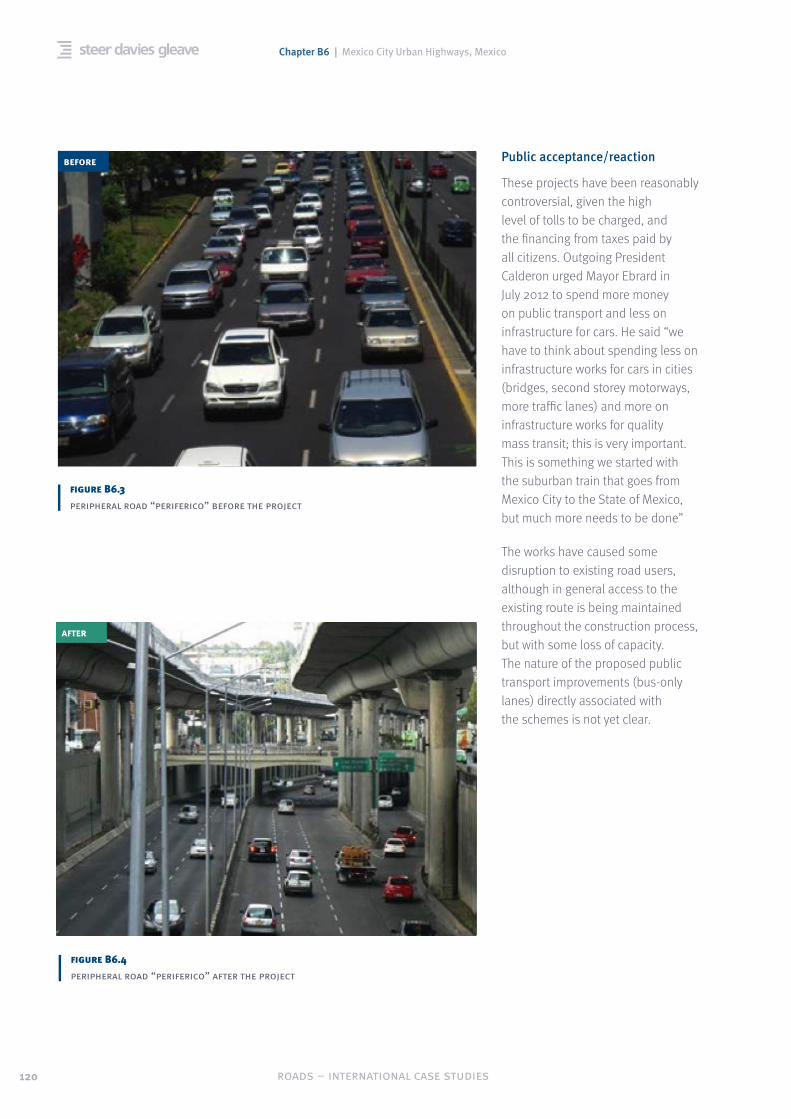
congested peripheral road before the project
before
120 roads − international case studies
Chapter B6 | Mexico City Urban Highways, Mexico
Public acceptance/reaction
These projects have been reasonably controversial, given the high level of tolls to be charged, and the financing from taxes paid by all citizens. Outgoing President Calderon urged Mayor Ebrard in July 2012 to spend more money on public transport and less on infrastructure for cars. He said “we have to think about spending less on infrastructure works for cars in cities (bridges, second storey motorways, more traffic lanes) and more on infrastructure works for quality mass transit; this is very important. This is something we started with the suburban train that goes from Mexico City to the State of Mexico, but much more needs to be done”
The works have caused some disruption to existing road users, although in general access to the existing route is being maintained throughout the construction process, but with some loss of capacity. The nature of the proposed public transport improvements (bus-only lanes) directly associated with the schemes is not yet clear.
figure B6.3
peripheral road “periferico” before the project
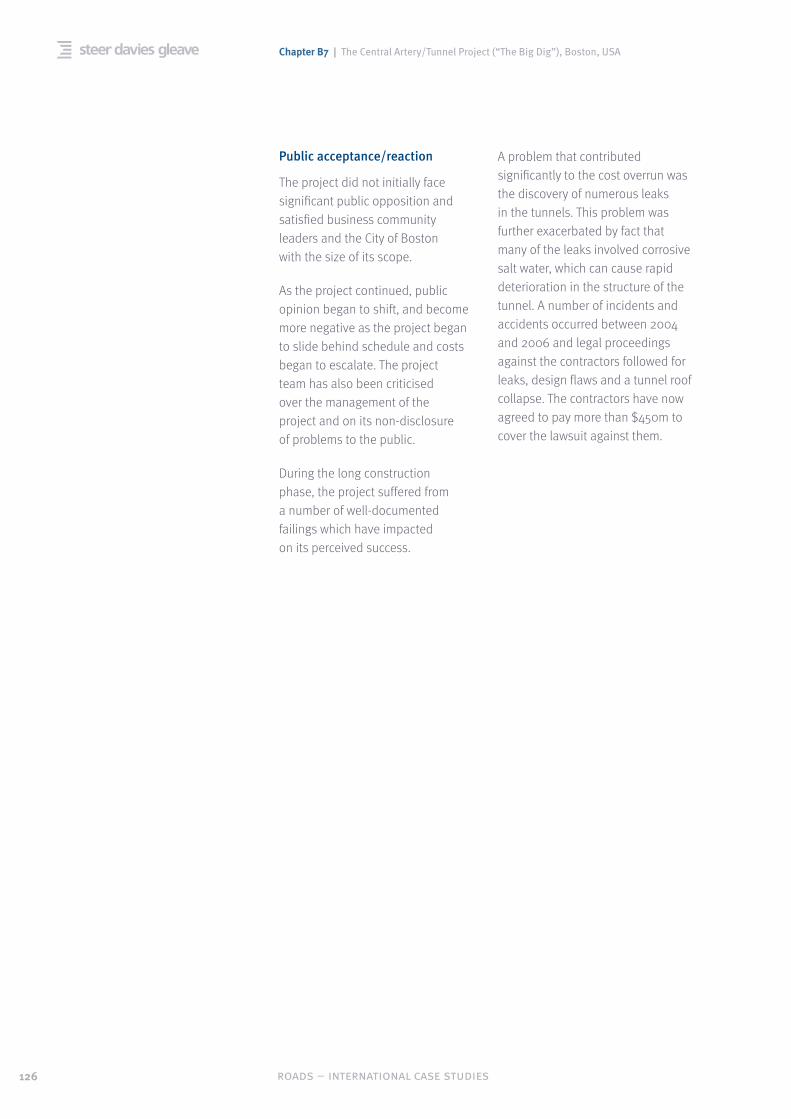
figure B6.4
peripheral road “periferico” after the project
after
before

121roads − international case studies
Chapter B7 | The Central Artery/Tunnel Project (“The Big Dig”), Boston, USA
Name of project: The Central Artery/Tunnel Project (“The Big Dig”)Location: Boston, USAYear: 1991-2007*Cost: USD$14.6-$24billion (estimated outturn in 2012), forecast costs in 1982 were USD$2.8 billion approx. USD$6.0 billion adjusted for inflation as of 2006.
B7
* Construction started in 1991 and was completed in December 2007
Reasons for the project
Before the project, the six-lane Central Artery highway ran though the centre of Boston along the eastern edge of the financial district. The project objectives were:
» Reduced travel times for road users by moving the highway underground and by redirecting airport trips.
» Improved access to Logan International Airport (an issue that business leaders were concerned about in addition to the congestion of the Central Artery highway).
» A more unified city by making the surrounding neighbourhoods easier to access from the city centre.
Short project description
The Central Artery/Tunnel Project (“The Big Dig”) is one of the USA's largest engineering projects on a major operational road network through the middle of the city of Boston.
The original highway carried around 75,000 vehicles per day when it opened in 1959 but by the early 1990s it was carrying
almost 200,000 vehicles and was one of the most congested highways in the United States.
Importantly, the highway cut off Boston’s North End and Waterfront neighbourhoods from downtown Boston and the financial district, severely impacting the economic viability of those areas.
The project consisted of two major components:
» Replacement of the previous six-lane elevated highway with an eight to 10-lane underground expressway directly underneath. The original Central Artery crossing over the Charles River was also replaced by two bridges connecting to Cambridge (on the north side).
» Extension of the I-90 (the Massachusetts Turnpike, Boston Extension) through a tunnel beneath South Boston and the Boston Harbour to Logan International Airport.
The area previously occupied by the highway was redeveloped for local access and a linear park of green spaces.

122 roads − international case studies
Chapter B7 | The Central Artery/Tunnel Project (“The Big Dig”), Boston, USA
city context
Boston, located on the east coast of the United States, is a major city with a metropolitan population of around 7.6 million in 2011. The city is the state capital of Massachusetts and home to more than 100 colleges and universities in the Greater Boston Area. Prominent industries include healthcare, finance, education, high-technology research and development and tourism.
The Big Dig project impacted the neighbourhoods of the financial district, Beacon Hill, the North End, Waterfront District, and Cambridge on the other side of the Charles River. All of those neighbourhoods, excluding the financial district, are primarily residential. The financial district is located next to downtown and to South Station, a major station linked both to the subway and also to half of the commuter rail system.
transport policy context
The original concept for the Big Dig was developed in the 1970s as part of the Boston Transportation Planning Review, which was responsible for analysing and redesigning the transit and highway system in the region. One of the key proposals was to replace the partly tunnelled, partly elevated decaying Central Artery freeway. The Big Dig was proposed to combine the need to replace the Central Artery with the wishes of major business leaders in the city, who wanted a third harbour tunnel in order to improve access from the downtown area to Logan International Airport.
The Project
The Big Dig project replaced Boston's deteriorating six-lane elevated Central Artery (I-93) with a new eight-to-ten lane underground highway and redirected a portion of the original traffic through the construction of the Ted Williams Tunnel, providing an alternative route to reach Boston’s Logan Airport from downtown. The original Central Artery crossing over the Charles River was also replaced by two bridges connecting to Cambridge (the Leonard P. Zakim Bunker Hill Bridge and the Leverett Circle Connector Bridge).
The Big Dig project built 161 miles of highway lanes in a 7.5 mile corridor, about half in tunnels, including four major highway interchanges. The Central Artery was expected to carry 245,000 vehicles per day by 2010 and the The Ted Williams Tunnel expected to carry 98,000 vehicles daily in 2010.
figure B7.0
construction sites of the big dig project

123roads − international case studies
Chapter B7 | The Central Artery/Tunnel Project (“The Big Dig”), Boston, USA
figure B7.1
aerial view of original central artery highway
figure B7.2
part of the rose kennedy greenway after the big dig
The Big Dig project moved the Central Artery highway underground and opened the core city centre to the surrounding neighbourhoods of the North End and the Waterfront District that were previously physically separated by the elevated highway infrastructure. The area previously occupied by the highway has been redeveloped into surface road, which provides access to local streets and to the highway, and the Rose Kennedy Greenway, a ribbon of parks.
The project created more than 45 parks and major public plazas. Major shoreline restoration was undertaken in the Charles River Basin, Fort Point Channel, Rumney Marsh and Spectacle Island as well as in significant stretches of the Boston Harborwalk.

124 roads − international case studies
Chapter B7 | The Central Artery/Tunnel Project (“The Big Dig”), Boston, USA
Funding and implementation
The project took considerably longer and cost considerably more than forecast. In 1989 the project was estimated to be completed by 1998. In reality it took seven years longer and was not completed until 2005. The project was publicly funded, split between Massachusetts State and the Federal government. It is estimated that, once federal reimbursements are complete, they will have contributed around half of the full cost.
The cost of the project when completed in December 2007 was said to be USD$14.8 billion. However, the actual cost of the project was made public in July 2012 by the Massachusetts Department of Transportation who estimated the final cost was more than USD$24billion. The state currently pays over USD$100 million annually in debt service for the project which is likely to continue till 2038. It owes about USD$9.3 billion in both principal and interest.
Due to the scale of the project the need to provide access to the city throughout construction ultimately consumed more than a quarter of the total project budget.
The construction was complex due to the need to build the tunnel without endangering the existing elevated highway above. Horizontal braces were used across the width of the tunnel, allowing the elevated highway's struts to be cut away and then lowered onto the new braces. The project also involved significant underground utility relocation. In total 29 miles of gas, electric, telephone, sewer, water, and other utility lines were moved.
The following stages of work were carried out:
» 1982 to 1986: Planning and preparatory work underway.
» 1987: Congress approves initial funding and scope of project. Building acquisition and business relocation process begins.
» 1988 to 1989: Final design process and environmental review.
» 1990: Congress allocates $755 million to project.
» 1991: Federal Highway Administration gives construction approval. Construction begins on Ted Williams Tunnel and South Boston Haul Road.
» 1993: South Boston Haul Road opens.
» 1994: Charles River Crossing design revised and approved.
» 1995: Ted Williams Tunnel opens to commercial traffic.
» 1998: Construction begins on the Charles River Crossing.
» 1999: New Broadway Bridge opens. Leverett Circle. Connector Bridge opens.
» 2002: Leonard P. Zakim Bunker Hill Bridge completed.
» 2003: I-90 Connector from South Boston to Rt. 1A in East Boston, I-93 northbound and southbound open.
» 2004: Dismantling of the elevated Central Artery (I-93).
» 2005: Full opening of I-93 South. » 2006: Substantial completion
of the Central Artery Tunnel Project. Spectacle Island Park opens to the public.
» 2007: Restoration of Boston city streets. Continued construction of the Rose Kennedy Greenway and other parks.
figure B7.3
dealing with utilities during construction

125roads − international case studies
Chapter B7 | The Central Artery/Tunnel Project (“The Big Dig”), Boston, USA
Impacts of the project
As part of the Big Dig project, an Operations Control Centre was also built to monitor traffic and incidents. The system uses more than 35,000 data collection points and 430 video cameras to monitor the highway and is also used for fire detection and response, security, ventilation, lighting, and air quality.
Journey times: Travel times for residents from the south and west of Boston traveling down town have decreased by 42% to 74%.
Congestion: According to an independent study entitled Economic Impacts of the Massachusetts Turnpike Authority and the Central Artery/Third Harbor Tunnel Project, overall traffic flow has improved by 62% compared to previous (1995) levels when measured by the reduction of vehicle-hours of travel. Overall traffic volume grew by 23.5% percent since 1995, although significant volume was diverted from the original highway with the construction of the tunnel to Logan Airport.
Air quality: City-wide carbon monoxide levels were reduced by 12% due to reductions in congestion. Overall noise levels are now much lower for surrounding residential and commercial properties.
Public realm: The project also created more than 300 acres of new parks and open space, including 27 acres where the existing elevated highway stood, 105 acres at Spectacle Island, 40 acres along the Charles River, and 7 acres as part of an expanded Memorial Stadium Park in East Boston. Three quarters of the 27 downtown acres will remain open. The rest were set aside for development of retail, commercial, and housing in low-rise buildings.
Economic impact: Largely as a result of the Big Dig, the Waterfront District has seen significant development and has been targeted for redevelopment by the Boston Redevelopment Authority. The mayor has branded this area the Innovation District, and in the 12 months preceding March 2011, at least 29 new companies have relocated there. The downtown area has revitalized as well - commercial properties along the original Artery highway have seen an increase in value by 79% in 15 years, as compared to the citywide average of 41%. While stores and building entrances used to face away from the highway, they now open up towards the road and park.
126 roads − international case studies
Chapter B7 | The Central Artery/Tunnel Project (“The Big Dig”), Boston, USA
Public acceptance/reaction
The project did not initially face significant public opposition and satisfied business community leaders and the City of Boston with the size of its scope.
As the project continued, public opinion began to shift, and become more negative as the project began to slide behind schedule and costs began to escalate. The project team has also been criticised over the management of the project and on its non-disclosure of problems to the public.
During the long construction phase, the project suffered from a number of well-documented failings which have impacted on its perceived success.
A problem that contributed significantly to the cost overrun was the discovery of numerous leaks in the tunnels. This problem was further exacerbated by fact that many of the leaks involved corrosive salt water, which can cause rapid deterioration in the structure of the tunnel. A number of incidents and accidents occurred between 2004 and 2006 and legal proceedings against the contractors followed for leaks, design flaws and a tunnel roof collapse. The contractors have now agreed to pay more than $450m to cover the lawsuit against them.

127roads − international case studies
Chapter B8 | Dallas LBJ/I-365 Managed Roads, USA
Name of project: Dallas LBJ/I-365 Managed RoadsLocation: Dallas, USAYear: 2011-2016*Cost: USD$3.2 billion
* Construction started in early 2011 with the project programmed to be completed in 2016.
Reasons for the project
In 1969 I-635 was built to accommodate 180,000 vehicles per day. In 2009, average daily traffic counts exceed 270,000 vehicles. Future corridor traffic demand is estimated to exceed 450,000 vehicles by the year 2020. The project objectives are:
» Congestion relief. » Safety improvement. » Air quality improvement
Short Project Description
The LBJ/I-365 corridor is located in north Dallas County extending from SH121 to Interstate 20. The LBJ/I-365 project will introduce additional tolled lanes within the existing motorway through creation of six new subsurface lanes. The lanes are “managed” through variable tolling with tolls based on a number of factors including the time of day, traffic volumes, vehicle type and vehicle occupancy. Drivers have the choice of using the existing lanes or paying for faster journey times in the tolled lanes. In this way the project attempts to maximise the available capacity, improve the reliability of the motorway and monitor conditions throughout the day to achieve improved travel times.
The project works include:
» Construction of six new managed lanes (mostly subsurface).
» Construction of six new elevated managed lanes.
» Reconstruction of the eight existing lanes and four parallel access road lanes along I-635.
figure B8.0
current congestion in dallas

128 roads − international case studies
Chapter B8 | Dallas LBJ/I-365 Managed Roads, USA
city context
Dallas is the ninth most populous city in the United States of America and the third most populous city in the state of Texas. The Dallas/Fort Worth area is the fourth-largest metropolitan area in the USA. The city covers an area of 999.3 km2 with 1.2 million people living in the city and 6.4 million people living in the metropolitan area.
transport policy context
The city of Dallas is at the centre of a large number of major motorways — Interstates 20, 30, 35E, and 45 all run through the city. The centre of the motorway system is the downtown motorway loop, made up of Interstate 30 on the south, Interstate 35E on the west, Spur 366 on the north, and Interstate 345 on the east. Interstate 635 (I-365) is a 37 miles (60 km) long partial loop around Dallas between Interstate 20 in Balch Springs, Texas and State Highway 121 at the north entrance of the Dallas-Fort Worth International Airport in Grapevine, Texas. It is known locally as the Lyndon B. Johnson Freeway, or "LBJ" (named after the president).
The North Central Texas Council of Governments is the metropolitan planning organisation for the Dallas/Fort Worth metropolitan area and is responsible for the preparation and maintenance of the metropolitan transportation plan for the region.
Mobility 2035 is the Metropolitan Transportation Plan for north central Texas and is a “multimodal blueprint for transportation systems and services aimed at meeting the mobility needs of the Dallas-Fort Worth Metropolitan Area through the next 25 years”.
The Project
The LBJ Express, Interstate 635 (LBJ/I-365) in Dallas/Fort Worth, Texas, is a very congested motorway. Originally built in 1969, it was designed to carry 180,000 vehicles, by 2009 was carrying 270,000 vehicles with forecast use by 2020 over 450,000 vehicles per day. The motorway currently suffers from severe congestion all day, not just the peak periods.
The managed lanes project will introduce additional capacity for the I-365. The managed lanes concept aims to optimise motorway efficiency through variable pricing and variable
timing of lane use of alternative toll lanes within the same corridor as the normal, i.e. un-tolled, carriageway.
Works proposed for the project include:
» Construction of six new managed lanes (mostly subsurface) along I-635 from I-35E to US 75.
» Construction of six new elevated managed lanes along I-35E from Loop 12 to the I-35E/I-635 interchange.
» Reconstruction of the eight existing lanes and four parallel access road lanes along I-635.
» The project will be built within the existing right of way of I-635.
figure B8.1
the lbj/i-365 motorway

129roads − international case studies
Chapter B8 | Dallas LBJ/I-365 Managed Roads, USA
Tolls will be charged at different rates, depending on:
» Traffic conditions as they change during the day (higher toll rate during higher congestion to maintain 50 mph traffic speed).
» Type of vehicle (3 axle pays more than 2 axle).
» Number of passengers in the vehicle (two or more passengers are considered HOV and pay half price during peak travel periods).
Public transport vehicles are exempt from the toll. The North Central Texas Council of Governments (the local metropolitan planning organisation) is still considering the registering and monitoring of vehicles planning to use the managed lanes, enforcement and discount policy. It is likely that a pre-registration system will be implemented in order to register as a ‘valid vehicle’. Discounts for High Occupancy Vehicles may be available for vehicles with 3+
figure B8.2
proposed managed lanes concept
passengers and be in the order of 50% during peak hours.
When completed, the project is promoted as having one of the most comprehensive managed HOV lane systems in the country. Drivers in the corridor will have the choice of paying a toll to use the managed lanes or traveling for free on the general purpose lanes. Variable pricing is expected to result in faster and more reliable travel times.
The I-365 project sits within the LBJ Express Project. The aim of the LBJ Express Project is to deliver approximately 14 miles of local access roads, general purpose and tolled managed lanes. The project also completes a continuous frontage road system along I-635 between the Dallas North Tollway and I-35E. The project is scheduled to be complete in 2016, and will be maintained and operated by the group until 2061.

130 roads − international case studies
Chapter B8 | Dallas LBJ/I-365 Managed Roads, USA
Funding and implementation
The project has had a long gestation with the LBJ Corridor Study beginning in 1987.
In February 2009, the Texas Transportation Commission awarded the DBFO concessions for the LBJ Express Project to LBJ Development Infrastructure Group (LBJIG), which will finance, design, construct, operate and maintain the 13-mile corridor for 52 years. The concession agreement began in September 2009. At the end of the lease term, the operation and maintenance responsibility for the roadway will be returned to Texas Department of Transportation.
LBJIG has contracted with the North Texas Tollway Authority to collect tolls on the LBJ Express. After subtracting administrative costs, remaining toll revenues will be used to pay debt service, maintenance, and operations. Any revenue left will be LBJIG's profit from the project. To the extent that toll revenues exceed specified levels, LBJIG will share profits with Texas Department of Transportation based upon an agreed internal rate of return for equity.
Construction phasing for the project is a significant issue with the need to maintain traffic flow of approximately 250,000 vehicles per day. The Texas Department of Transportation requires all urban projects that require lane closures to be done only during “off peak” hours and all inner city projects at night between rush hours. This is due to air quality issues.
The construction sequencing developed by the contractor follows the basic approach of constructing the improvements simultaneously from the outside-in (frontage roads, then general purpose lanes, then managed lanes), and from the top-down (same sequence). The major construction phases are:
» Phases 1&2: Construct noise walls, utility relocations, drainage trunk lines and new/reconstructed frontage roads along the new right-of-way lines. Construct cross road overpass bridges and permanent/temporary widening to the outside of the existing general purpose lanes.
» Phase 3: Shift general purpose lanes traffic to the outside of the existing pavement, construct the managed lanes and overhang structures in the center.
» Phase 4: Shift general purpose lanes into final configuration and complete all ramps between the general purpose lanes and frontage roads.
The contractors claim that several significant benefits result from this outside-in and top-down approach including:
» Frontage roads and cross street overpasses will be completed during the first two phases, which should minimise local impacts, relieve some congestion early in the project, and provide improved and unimpeded access to neighborhoods, pedestrians and businesses for the remaining duration of construction.

131roads − international case studies
Chapter B8 | Dallas LBJ/I-365 Managed Roads, USA
» At least two frontage road lanes will remain open during peak hours of all phases of construction.
» Four general purpose lanes remain in operation throughout the construction period.
» No major crossovers are proposed, meaning the traffic flow pattern for the eastbound and westbound GPL will remain in the existing configuration throughout construction. This minimises the impact to motorists and improve safety.
USD$445 million of public funds made from the State of Texas has contributed towards the costs of the project.
When the project opens to traffic, tolls are estimated to range from USD$0.15 per mile during low traffic volumes to USD$0.55 per mile during peak periods.
The roles for the operational management of the motorway will be:
» Region will set tolling policy and the concessionaire will implement the toll policy.
» North Texas Tollway Authority will collect tolls and manage the toll tag accounts.
» The Texas Department of Transportation will retain ownership and conduct oversight of the project to include review and periodically audit managed toll lane operations for compliance.
Impacts of the project
The project is currently under construction.
Public acceptance/reaction
The project is currently under construction. A project website provides details of traffic closures and other information about the project (www.lbjexpress.com/). A mobile app and Facebook project page are also maintained.
The contractors have weekly traffic management coordination meetings with all parties (including funders, highway authorities, city authorities, emergency services, etc.). These meetings discuss lane closures and upcoming construction activities to manage the traffic flows and minimise disruption.


133roads − international case studies
Chapter B9 | Göta Tunnel, Gothenburg, Sweden, 2000-2006
Name of project: Göta TunnelLocation: Gothenburg, SwedenYear: 2000-2006* Cost: SEK 3.5 billion
Reasons for the project
Traffic in the region had been growing at a rate of 2% per annum. Lack of road capacity was acting as a barrier to development, particularly in the south riverside area of central Gothenburg. Building the tunnel was intended to relieve congestion and improve permeability in this part of the city. Other reasoning behind the project involved reducing noise and air pollution and reducing the number of road accidents.
Short project description
The Göta tunnel is 1.6km long and part of a new 3km road link on Highway 45. The tunnel carries 65,000 vehicles a day under the historic centre of Gothenburg.
* Planning started in the 1990s, construction began in 2000 and the tunnel opened to traffic in 2006.
figure B9.0
route of the göta tunnel

134 roads − international case studies
Chapter B9 | Göta Tunnel, Gothenburg, Sweden, 2000-2006
city context
Gothenburg is the second largest city in Sweden with a population of 0.5 million (and approximately 0.9 million in the metropolitan area). It is located on the west coast at the mouth of the river Göta. The urban area sprawls along the banks of the Göta river and arterial roads (E20, E45) serving the central area.
Gothenburg is historically a trading city based around its port and today, is the largest harbour in Scandinavia. The city also has a strong manufacturing and industrial sector, with companies such as Volvo Cars and Ericsson located there.
The city has been engaged in a process since the 1970s, of opening up to the river and providing new residential, business and cultural areas within/near Gothenburg city centre. A total of 15 sections on the northern and southern banks are being developed, some are finished and others are only arriving at the drawing board. The main section on the southern bank “Södra Älvstranden”, covering an area of 1500 m long and approximately 150 m wide nearest the city centre, was previously dominated by traffic, but has been freed up by the Göta tunnel.
transport policy context
Gothenburg has problems with city centre congestion, owing to the shape of the road network, limited bridging points on the Göta river and high levels of in-commuting by car. The Göta tunnel is part of the wider “Götaleden” project, which is intended to open up the central riverside area to development. The tunnel aims to relieve congestion in the city centre (by tunnelling beneath the historic core) and improve access to the development areas.on the southern river bank.
The city is now introducing congestion charging around the city centre, including highway E45 going through the Göta tunnel.
The Project
The Göta tunnel consists of two bores each carrying up to three lanes of traffic. The two bores are linked by 15 transverse tunnels along its length.
The tunnel consists of three sections – the central bore and the entry and exit sections. The central bore was blasted through rock and the entry and exit sections built using the ‘cut and cover’ technique.
figure B9.1
the göta tunnel
The tunnel aims to both relieve congestion in the city centre (by tunnelling beneath the historic core) and to improve access to development areas. New link roads were constructed at either end of the tunnel section connecting to the existing surface highway and the local road network.
A 3km long local road with single lanes for traffic, separate cycle roads and pedestrian routes have been built along the river on the road space reallocated from the old highway. The tunnel also freed up space which allows for the redevelopment of the river side.

135roads − international case studies
Chapter B9 | Göta Tunnel, Gothenburg, Sweden, 2000-2006
Funding and implementation
The project was funded wholly by the public sector (75% from central government, 25% from the City of Gothenburg) and constructed through conventional contracts.
Planning for the tunnel began in the 1990s. Construction began in 2000 and was completed in 2006.
Impacts of the project
Mode Share: The tram extension through the development area has just been approved for completion in 2015. When complete, the area will be served by 36 tram services per direction in the peak hour. The area is also served by several bus routes, with 50 services per direction in the peak hour on the busiest section, and includes two local ferry ports, which are planned to be served by 20 ferries an hour when the development is finished.
The tunnel project includes a cycle road along the river connected to the city’s main cycle network, which will be kept as part of the planned development.
It is expected that cycling/walking and public transport mode shares will be high, although there are no current estimates.
Highway and Public Transport Journey Times: The journey time has been significantly reduced as the tunnel provides a direct route avoiding the previous multiple signalled junctions, as well as an increase in capacity.
Congestion: Congestion in the town centre has been reduced, with 80% of the traffic that previously used the surface roads now using the tunnel. The traffic level on the roads parallel to the tunnel is now approximately 10,000 vehicles daily. However, there are higher traffic levels on the local roads around the entrances to the tunnel and Gothenburg is struggling with city centre congestion, and is therefore introducing congestion charging in January 2013.
Air quality and environment: The rerouting of traffic has led to reductions in air pollution in the new development area along the river. However, as the tunnel air is not filtered or mechanically removed, the construction of the tunnel has
led to significant local pollution around its entrances. The overall effect on air quality has been limited.
The planned development aims to be a model for sustainable city developments, so will focus on environmentally friendly building materials, waste management, energy use and low emission transportation.
Road Safety: Before the construction of the tunnel the highway E45 through Gothenburg had a high accident rate, particularly involving vulnerable road users. As there are very few accidents occurring in the tunnel, the number of accidents on this section of the E45 has been reduced.
figure B9.2
gothenburg historic centre

136 roads − international case studies
Chapter B9 | Göta Tunnel, Gothenburg, Sweden, 2000-2006
Regeneration: The project freed up land for redevelopment between the river and the town centre. The detailed planning of this area has only recently been undertaken, with the plan going through the political approval process during winter 2012. The plan involves approximately 400 residential units and 30,000m2 for business, notably hotel, offices, restaurants and shops. This development will in time link to other developments along the river.
The rerouting of traffic has led to reductions in noise pollution in the new development area along the river. Analysis shows that the noise levels in the planned development will lie within Gothenburg’s noise criteria of 65 dBA outside buildings.
Physical Accessibility: The tunnel opened up the access between the town centre and the river, including to planned developments in the “Södra Älvstranden“ area.
Daily Usage: Currently 55,000 vehicles use the tunnel each day, approximately 85% of its maximum daily capacity.
Public acceptance/reaction
Although the tunnel is well used and the planned developments well received by the general public, the project’s planning process has been criticised by the Gothenburg City Environmental Department for having had unclear objectives, and therefore limited impact on air pollution and city centre congestion.
They also criticised the design of the tunnel entrance points and the integration with the local road network and the insufficient planning for the use of the freed up areas which is only now being done six years later.

137roads − international case studies
Chapter B10 | Hovenring, Eindhoven, Netherlands
Reasons for the project
The development of the surrounding area meant that an intersection in the A2 motorway needed changing in order to cope with growing vehicular, cycle and pedestrian traffic.
Eindhoven City council refrain from building cyclist underpasses as a policy and did not want a level crossing roundabout, so a new solution was required.
The opportunity was taken to create a new city landmark, at what is a key entrance to the city of Eindhoven from the A2 motorway
Short project description
The Hovenring is a circular cable-stayed bridge that carries pedestrians,cyclists and light mopeds that reach up to 20km/hr above the road traffic at the busy Heerbaan/Meerenakkerweg junction on the edge of Eindhoven. The intersection is located strategically in between future high-graded residential areas, business areas and high tech campuses that make an important contribution to the development of Brainport Eindhoven. For this reason, the intersection and its pedestrian and cyclist flyover were designed as a new landmark for the city, incorporating a 70m high pylon and lighting displays.
Project: Hovenring, suspended cycle roundaboutLocation: Eindhoven, NetherlandsYear: 2011 - 2012Cost: € 6.267 million B10
figure B10.0
the hovenring

138 roads − international case studies
Chapter B10 | Hovenring, Eindhoven, Netherlands
city context
Eindhoven is a municipality and city located in the province of North Brabant in the south of the Netherlands. Its population, including adjacent Veldhoven is 261,000, making it the fifth-largest city of the Netherlands.
Eindhoven is one of the most important locations for the HIGH TECH knowledge and manufacturing industry in the Netherlands, and home to companies such as Philips, TomTom and the Eindhoven University of Technology.
The Project
The bridge structure consists of a 70-metre high pylon, 24 steel cables and a circular bridge deck, and is made out of steel. The cables are attached to the inner side of the bridge deck, where the bridge deck connects to the circular counter weight. This prevents torsion within the bridge deck. The M-shaped supports near the approach spans also ensure stability.
Spatial integration was one of the challenges of the design process. The existing infrastructure and buildings
set the boundaries for the gradients of the slopes leading up to the roundabout. As space was limited, it was decided to lower the ground level of the intersection underneath by 1.5m, allowing for a comfortable slope for pedestrians and cyclists.
The road junction below the Hovenring was also adapted to improve traffic flow. Originally a roundabout, the junction was converted into a 4 way junction with traffic lights. A detection system is fitted into the junction controlling and monitoring the traffic around the Hovenring.
after
before
figure B10.2
the redesigned junction
figure B10.1
the intersection prior to the hovenring

139roads − international case studies
Chapter B10 | Hovenring, Eindhoven, Netherlands
transport policy context
There is a strong focus on accessibility of new developments in the Netherlands such that they must be easily accessible from a regional perspective. Growth in urban areas has been located adjacent to existing motorways, radial urban areas and the railway network. The key reasons for the development of the Hovenring are the wider regional development projects of Meerhoven district and Brainport Avenue.
Meerhoven The district of Meerhoven is the latest city expansion of Eindhoven, built to facilitate the growth of the city. The district, located to the west of the city and the A2 motorway, has been under construction since 1997. The first houses in Meerhoven were completed in 1999, and as of January 1st 2011 there were almost 9,000 residents. Construction of the district is now almost complete, and all homes have been sold prior to completion.
Meerhoven consists of several residential areas and is part of a conservation area heavily focused on nature and sustainability, being surrounded by forests and wetlands. Transport was integrated into the design of the district, including 30km-zones, traffic in the district restricted to residents, and a Park and Ride system. (cont'd)
Funding and implementation
Construction began in February 2011.
The Hovering junction was completely closed to all traffic for 28 weeks from the 14 June 2011 for construction to take place. Modelling was carried out to determine whether part closure or full closure of the junction would cause less disruption. It was decided that fully closing the junction to all traffic would allow for a quicker construction period.
The suspension bridge was opened in December 2011, but had to be closed almost immediately after delivery due to unexpected vibrations in the cables caused by the wind. An engineering investigation into the problem was undertaken over several weeks and determined that the problem was vortices of wind forming in
the lee of the cables, causing far heavier vibrations than expected during design. A solution was found by applying additional dampers on the cables. Unfortunately this caused a delay of one month in the opening of the bridge.
The bridge was opened to the public in June 2012.
The Hovenring project was publicly funded through various regional bodies, including:
» The City of Eindhoven. » The Province of Noord-Brabant. » SRE - the Eindhoven
Regional Government. » BBZOB - the ‘Better Access
Southeast Brabant’ project, an institution formed of the 23 road authorities in Southeast Brabant and the Eindhoven Regional Government.
figure B10.3
the suspended hovenring

140 roads − international case studies
Chapter B10 | Hovenring, Eindhoven, Netherlands
road before construction (mvh/day)
2020 (mvh/day)
Grasdreef 5,800 24,600
Noord-brabantlaan 26,300 28,100
Heerbaan 20,500 21,400
Heistraat 6,600 16,400
Impacts of the project
The project has only very recently opened so data regarding impacts is relatively limited. However, usage is being monitored.
Mode share: The Hovenring has provided a segregated crossing for pedestrians and cyclists above the motor traffic at the junction, where previously all modes shared the ground level roundabout.
Highway and Public Transport Journey times: The Hovenring links pedestrians and cyclists to the Slow Lane, which is a new off road cycle route being built to connect key employment locations along the A2 corridor.
Congestion: The traffic flow at the junction is monitored and managed by an electronic system. The detection system can react to individual events, and manage traffic flows accordingly to reduce congestion.
Public realm: The chosen design was selected to be an attractive and iconic symbol of the city and to enhance the public realm.
Road safety: Cyclists are now separated from the main road traffic at this busy junction, reducing the risk of accidents occurring.
Crime / security: Eindhoven council refrain from building underpasses for personal safety reasons. The Hovenring was designed to be very open plan, well lit and visible.
Economic impact: The Hovenring was designed to support access to the wider developments of the Meerhoven community district and Brainport high-tech industry development area.
Physical accessibility: The road under the junction was lowered by 1.5m in order to keep the cycle ramps at a low incline so as not to discourage pedestrians and cyclists from using the Hovenring.
Daily usage: Table S10.0 shows how traffic on the four roads intersecting under the Hovenring is expected to grow. Growth is particularly high on the road leading directly from the Meerhoven district (Grasdreef) and onwards into the city centre (Heistraat). Traffic flows following the construction of the Hovenring project have not yet been monitored due to construction works still taking place in the surrounding areas.
transport policy context (cont'd)
To access Eindhoven city centre, residents of Meerhoven must cross numerous busy roads. The Hovenring provides a safe crossing.for pedestrians and cyclists across one of the main feeder routes into the city from the Western districts. The Hovenring links pedestrians and cyclists to the ‘Slow Lane’, a 32km long super-cycle way being built through the Brainport Avenue regeneration project along the A2 corridor.
Brainport AvenueBrainport Avenue is the name given to the major redevelopment of the area around the A2 – as an international location for high-tech knowledge and manufacturing industry. Again, there is a strong focus on recreation and nature preservation. Projects include the ‘Slow Lane’ a 32km long super-cycle way connecting the economic locations in the region, such as campuses and business parks.
table B10.0
traffic projections on the intersecting roads beneath the hovenring

141roads − international case studies
Chapter B10 | Hovenring, Eindhoven, Netherlands
Cycle and pedestrian usage was not monitored prior to the construction of the Hovenring, however manual counts of cyclists and mopeds using the Hovenring are now being taken. There is currently no automatic cycle counter installed on the Hovenring, but this is planned for the future. Manual counts taken in October 2012 show an average of 500 cyclists/mopeds using the Hovenring during the morning rush hour. The number of cyclists using the Hovenring is expected to increase in the future due to the developments taking place in the surrounding areas. The Hovenring is already one of the busiest cycling routes in Eindhoven.
Public acceptance/reaction
Consultation evenings were held with residents and businesses to discuss accessibility during the construction work, and this fed into the decision to close the entire road for a shorter time, rather than close part of the road for longer. Those attending could submit questions and suggestions about the planned construction and traffic diversions. Social media was actively used during construction and a live traffic team kept residents up to date with the construction using Twitter and a website.
