proliferation of sms & mms in pakistan with emphasis on ... · the mobile messaging market...
TRANSCRIPT
PAKISTAN TELECOMMUNICATION AUTHORITY
Proliferation of SMS & MMS in Pakistan with emphasis on Premium Rate SMS services
SMS/MMS Report 2012
11/12/2012
This study report gives the data usage for SMS, MMS, and other value added services over SMS in Pakistan during the year 2011, with essential insight into innovations in SMS and its comparison with Over the Top (OTT) SMS texting.

EXECUTIVE SUMMARY
Pakistan’s Telecommunication is one of the fastest growing industries in Pakistan. PTA monitors the growth of industry for various regulatory purposes. The telecom sector registered positive growth in all of its Key Performance Indicators (KPIs), with teledensity touching 68.39%. The number of mobile subscribers at the close of year 2011 stood at 112.9 million, Mobilink contributed a share of 30.3% , chased by Telenor (24.9%), Ufone (18.9%), Warid (13.5%) and Zong (12.3%). In Pakistan, like the other regions of the world, SMS has become a nationwide phenomenon due to its simplicity (i.e. user interface), affordability and ubiquity. SMS option is included with all subscriber packages, works with every single mobile phone type, and is interoperable with any cellular network of Pakistan. Operators, aggregators and other concerned parties are constantly seeking new and sophisticated ways to enable meaningful experiences for their target consumers through premium and value added services over SMS.
Total SMS generated during the year 2011 were 237.58 billion. Person to Person (P2P) SMS, the most popular SMS type in Pakistan touched the peak of 236.85 Billion. Analysis reveals that during 2011, on average a mobile subscriber is estimatedly generated 175 P2P SMS per month.
M/s Telenor generated the highest P2P SMS traffic during the year, closely followed by M/s Mobilink. Out of the 236.85Bi, almost 48% of the total P2P SMS were ON-NET , i.e. within operator’s own network. Again, Telenor generated highest number of P2P ONNET SMS. The trend, demand and comparative market has lead to the price of ‘bundled package offers’ to be as low as Rs.1 to Rs. 1.50 for 100 SMS per day.
The mobile messaging market generated an amount of Rs.12.4 Billion (12,345,375,247 being the precise value) in 2011. This revenue includes the revenues collected from P2P SMS, MMS, A2P and P2A revenues.
The P2P SMS were the main contributor in terms of revenues. Around 89.8% of the total revenues were from P2P SMS. Around 2.8% of total revenues were MMS revenues while premium SMS (A2P and P2A) contributed 7.4% into the total revenue. Operators are offering attractive value added applications for the users on premium rates. This segment of mobile business is gaining momentum with every passing day. Short messaging has turned out to be a great economic potential for operators and a useful application for consumers. Among the Popular Premium rate services ‘Music Tunes’ are the most used application in both PULL as well as PUSH services. Altogether, 64% of the popular premium rate SMS services used in Pakistan were music tunes, followed by missed call alerts (MCA), which is 20%. It is followed by cricket alerts that are 4%. There is still a great potential for the experts to explore in premium rate SMS services.
Over the Top Texting (OTT) services are gaining momentum as they are almost free, all that a consumer has to pay is the data connection charge. However, when compared to SMS, the SMS is ubiquitious. With an SMS one can reach almost any handset in the world. On the contrary OTT services are fragmented by different services, that cannot communicate with each other and limited to communication within the forum. Inter operability of these segments is still a question mark.

1. INTRODUCTION
In Pakistan, total SMS generated during the year 2011 were 237.58 billion, having a SIM base of 112.9 million. These messages include the P2P SMS (On-Net, Off-Net, Bundled, Flat rate, International SMS), & P2A SMS. The A2P are not included.
For P2P SMS, the A2P and P2A traffic, the revenues generated from mobile messages during 2011 amounted to Rs.12 Billion (Rs. 11,999,620,667).
Total Multimedia messages (MMS) generated were 431.493 million against the revenues of Rs. 345.8 million.
The A2P subscription requests by subscribers, on three of the mobile networks with 61.53% of total subscribers, were 865.1 million1. -
The P2P SMS were the main contributor in terms of revenues. 89.8% of the total revenues was generated from P2P SMS. Around 2.8% of total revenues were MMS revenues and premium SMS (A2P and P2A) contributed 7.4% into the total messaging revenues.
Worldwide, 7.8 trillion2 SMS messages were exchanged in 2011. It is expected to reach 9.6 trillion for the year 20122 . By 2013 worldwide SMS revenue is forecasted to break the USD 150 billion mark, and will continue to grow for the next two years. However, Informa3 forecasts that SMS’s share of global mobile messaging traffic will fall from 64.1 percent in 2011, to 42.1 percent in 2016, as it will loose share to mobile instant messaging (IM) and other Over the Top (OTT) applications.
2. P2P SMS in Pakistan
In Pakistan, SMS is one of the most popular data traffic till date. The revenues generated by SMS are quite higher than the data and the MMS revenues. The prime reason being that due to the bundled charges, per SMS rate is almost negligible to flat (non-bundled) rates which are still comparatively higher.
Total domestic person-to-person (P2P)4 SMS generated in Pakistan during the year 2011 were 236.9 Billion (236,852,086,592)5.
Subscribers of M/s Telenor & M/s Mobilink lead the person-to-person (P2P) SMS race by generating 26.5% and 26.4% of the total SMSs , followed closely by M/s Ufone.
1 M/s Warid & M/s Telenor did not provide A2P subscription requests generated on their network during 2011. 2 Portio Research (Febuary 2012): http://mobithinking.com/mobile‐marketing‐tools/latest‐mobile‐stats/c#mobilemessaging 3 http://blogs.informatandm.com/4971/press‐release‐sms‐will‐remain‐more‐popular‐than‐mobile‐messaging‐apps‐over‐next‐five‐years/ 4 Note: It does not include international SMS. 5 This Mobile originated P2P SMS does not include International SMS. Four months data of one of the operators was missing, hence that was calculated/estimated from available data.

SN12345
T
Following
S. No
Opera
1 2 3 4 5 Table 1
g Graph show
2.1.
The total subover the totmaximum m
Graph
010203040506070
Billion
s
ator
Telenor Mobilink Ufone Zong Warid
ws the P2P SM
Subsc
bscribers in Pal subscriber
market share in
2
00000000
Mobilink
62.6
Oper
0
10
20
30
40
Millions
Annual(Billion) 62.7 62.6 57.8 27,9 25.7
MS on each op
riber Bas
Pakistan by thr base of eacn terms of sub
Telenor
61 62.77
rator's P
Mobilink T
34.21
Subscrib
l P2P SMS ) 78 61 83 92 72
perator’s netw
se
he end of Decech operator bbscriber base.
Ufone
57.83
P2P SMS
Telenor U
28.13
ber Base
PerceP2P S
work.
ember 2011 wby the end of.
Warid
25.72
S in 2011
Ufone Wa
21.37
e By Dec
entage ShaSMS
26.5% 26.4% 24.4% 11.8% 10.7%
were 112.9 mf December 2
Zong
27.92
1
arid Zong
15.29 13
c 2011
are of
million (112,872011 shows
g
3.87
75,586). A glthat Mobilin
limpse nk had

2.2. P2P SMS Per Subscriber Per Month
The Average number of person-to-person (P2P) SMS Per Subscriber Per month shows the popularity of SMS usage on a network. From the total number of P2P SMS generated, it is evident that on average a mobile subscriber is generating 175 SMS per month.
Average P2P SMS per subscriber per Month 1 Average P2P SMS per Subscriber per Month 174.9 2 Average P2P SMS per Subscriber per Day 5.8 Table 2
According to Portio Research (05 April 2012)6,
“Our research shows average SMS-per-person-per-month in China was 99 SMS per month during 2011, compared to the same figure for India at just 53. In the USA the figure reached an astounding 617, compared to average usage across the entire Latin America region of just 69 SMS per month. SMS usage per month was just 22 messages per-month in Brazil in 2011”.
Total SMS per Person per Month Countries SMS-per-person-per-month in 2011 China 99 India 53 USA 617 Latin America 69 Brazil 22 Note: Portio Research (05 April 2012 ) 7
Table 3
Calculating the SMS-per-Subscriber-per-Day for each Pakistani cellular operator reveals the Network Popularity for the network. As per the analysis, M/s Ufone subscribers are sending an average of eight(8) P2P SMS per day which is the highest when compared against other operators. In contrast, the subscribers of M/s Warid are sending less than five(5) SMS per day while other operators lie in between Ufone and Warid. Following table shows the calculated average number of P2P SMS per subscriber per day.
Table 4
6 http://www.portioresearch.com/blog/2012/04/pricing‐voice‐and‐sms.aspx Portio Research (05 April 2012 ) 7 http://www.portioresearch.com/blog/2012/04/pricing‐voice‐and‐sms.aspx Portio Research (05 April 2012 )
Operators Avg. No. of P2P SMS per Subscriber Per Day
Ufone 7.5 Telenor 6.2 Zong 5.6 Mobilink 5.1 Warid 4.7

The SMSSMS acrand its m
The ‘NuTelenor day. M/s
Billion
s
2.3.
S originated aross all the op
minimum for M
umber of on-nturned out to
s Telenor is fo
On‐Net
Telenor Ufone Mobilink Zong Warid
Table 5
0
5
10
15
20
25
30
35
Mobili
Opera
On-Net
and terminateperators wereM/s Ufone, w
net P2P SMSo have a maxiollowed by M
P2P SMS T
Pt53544
nk Teleno
tor's On
t SMS
ed on the same on-net. The which was arou
S per subscribimum on-net
M/s Ufone and
Traffic Per
Percentage oto total P2P S51.91 % 39.39 % 55.23 % 42.11 % 47.95 %
r Ufone
n Net P2
me network arpercentage ound forty (40
ber per day’ sutilization i.
d then Mobilin
r Subscribe
of P2P On NeSMS Traffic
Warid
P SMS in
re said to be of On-net SM0%) percent.
shows daily oe. more than nk with minut
er
et Traffic AvSMDa
Zong
n 2011
on-net SMS. MS turned out
on-net SMS ethree (3.22)
te difference.
vg. No. of P2MS per Subay
Almost 48.2to be highest
exchanges wion-net SMS
2P On Net scriber per
3.22 2.96 2.81 2.35 2.24
2% of the totat for M/s Mo
ith in the opeper Subscrib
al P2P obilink
erator. ber per

Total IntMillion (
M/S Ufo
On avera
Note8
8 The Int’l
Millions
Millions
2.4.
ternational SM(429,673,642)
one sent the hi
age around 35
l SMS of zong f
0
50
100
150
200
250
Ufo
Intern
‐5 10 15 20 25 30 35 40 45
Monthw
Interna
MS destined ).
ighest numbe
5.8 million SM
for the first fou
one Mobil
ational O
wise Inte
ational O
to internation
er of SMS to I
MS were sent
ur months have
lnk Teleno
Outboun2011
rnationalIn 2011
Outbound
nal destinatio
International
monthly .
e been estimat
or Warid
nd MO S
l Outbou
d SMS fr
ns from Paki
destinations.
ted on the bas
Zong
SMS in
nd SMS
rom Pakis
istan during t
sis of provided
stan
the year 2011
data.
1 were approxx. 430
2.5. Bundled SMS
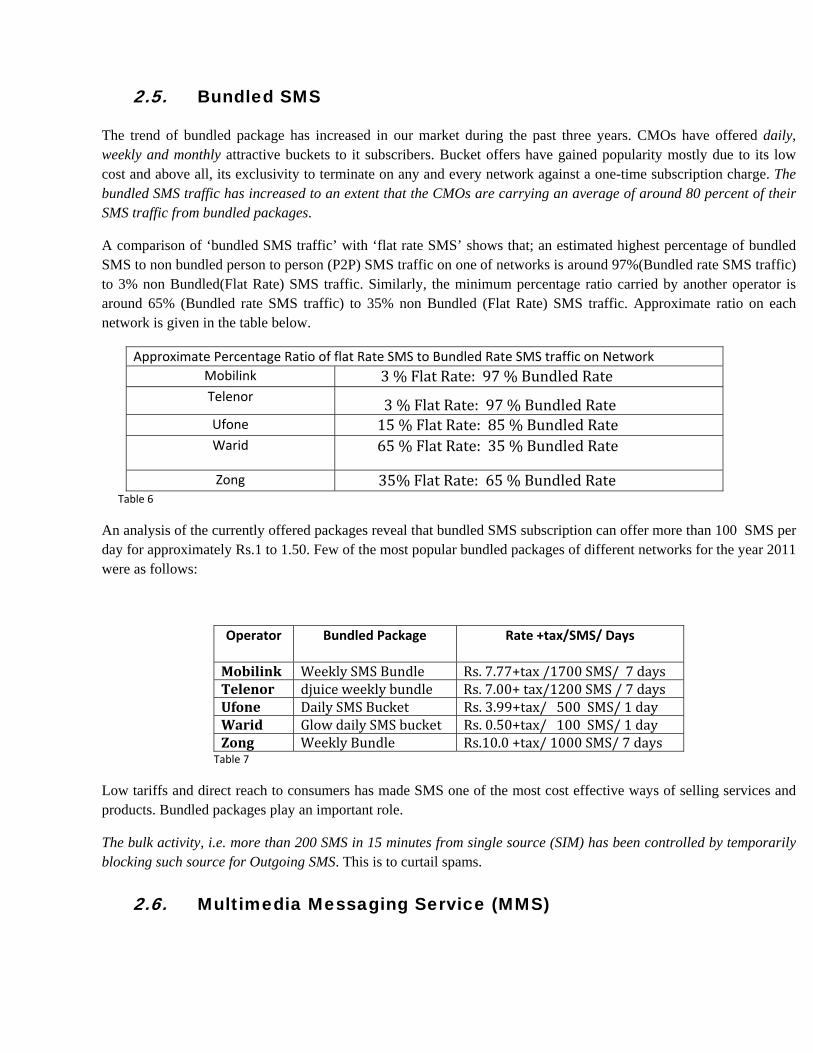
The trend of bundled package has increased in our market during the past three years. CMOs have offered daily, weekly and monthly attractive buckets to it subscribers. Bucket offers have gained popularity mostly due to its low cost and above all, its exclusivity to terminate on any and every network against a one-time subscription charge. The bundled SMS traffic has increased to an extent that the CMOs are carrying an average of around 80 percent of their SMS traffic from bundled packages.
A comparison of ‘bundled SMS traffic’ with ‘flat rate SMS’ shows that; an estimated highest percentage of bundled SMS to non bundled person to person (P2P) SMS traffic on one of networks is around 97%(Bundled rate SMS traffic) to 3% non Bundled(Flat Rate) SMS traffic. Similarly, the minimum percentage ratio carried by another operator is around 65% (Bundled rate SMS traffic) to 35% non Bundled (Flat Rate) SMS traffic. Approximate ratio on each network is given in the table below.
Approximate Percentage Ratio of flat Rate SMS to Bundled Rate SMS traffic on Network Mobilink 3 % Flat Rate: 97 % Bundled Rate Telenor 3 % Flat Rate: 97 % Bundled Rate Ufone 15 % Flat Rate: 85 % Bundled Rate Warid 65 % Flat Rate: 35 % Bundled Rate
Zong 35% Flat Rate: 65 % Bundled Rate Table 6
An analysis of the currently offered packages reveal that bundled SMS subscription can offer more than 100 SMS per day for approximately Rs.1 to 1.50. Few of the most popular bundled packages of different networks for the year 2011 were as follows:
Operator Bundled Package Rate +tax/SMS/ Days
Mobilink Weekly SMS Bundle Rs. 7.77+tax /1700 SMS/ 7 daysTelenor djuice weekly bundle Rs. 7.00+ tax/1200 SMS / 7 daysUfone Daily SMS Bucket Rs. 3.99+tax/ 500 SMS/ 1 dayWarid Glow daily SMS bucket Rs. 0.50+tax/ 100 SMS/ 1 dayZong Weekly Bundle Rs.10.0 +tax/ 1000 SMS/ 7 days
Table 7
Low tariffs and direct reach to consumers has made SMS one of the most cost effective ways of selling services and products. Bundled packages play an important role.
The bulk activity, i.e. more than 200 SMS in 15 minutes from single source (SIM) has been controlled by temporarily blocking such source for Outgoing SMS. This is to curtail spams.
2.6. Multimedia Messaging Service (MMS)

MMS usage in Pakistan has not been able to catch with SMS usage. In Pakistan, the total MMS sent in the year 2011 were 100.8 million (100,793,994). The revenues generated from MMS were Rs. 345,754,580, which amounts to 2.8% of the total messaging revenues. All the operators offered MMS nationwide as well as to international destinations, except one operator
Worldwide, 207 billion MMS were sent in 2011 and have been forecasted to reach approximately 387.5 Billion by 2016 representing 1.7 percent of global messaging traffic.
The trend of email and instant messaging is growing rapidly since last few years. According to Portios Recent report (February 2012)9, 669.5 million people used mobile email in 2011 worldwide; this is expected to grow to 2.4 billion by 2016, i.e. more than three and half times (3.58) growth. The Instant Messaging(IM) is expected to outperform email and MMS, in future.
2.7. Premium Rate SMS/MMS (PSMS/PMMS) Premium Rate SMS/MMS is a Value added Messaging Service that carries a premium price above/below the flat/normal rate that is charged from the consumer. A2P and P2A are typical types of PSMS.
2.7.1. Application-to-person (A2P) & Person-to-Application (P2A) Messaging
Application to Person (A2P) is an SMS service where the SMS is sent by an application (software program on a computer/ server) to a mobile. It is also called “bulk push” or “bulk SMS”, since such SMS are typically sent out in large numbers.
A2P messaging includes messages from financial services, to or from an application, advertising, marketing, business administrations, ticketing, television voting etc.
In Pakistan, total A2P subscriptions from three of the operators, in the year 2011 were 865.1million10.
Number of P2A messages generated by subscribers to any application, on four of the mobile networks was 196.1 million11.
Approximate revenue generated from both A2P & P2A is Rs. 912.6 million that is almost 7.4% of the total messaging revenues.
Juniper Research (May 2011)12 on worldwide revenues: “Revenue from A2P SMS will exceed $70bn by 2016. Revenue from these types of messages will overtake that of P2P SMS during that year as the strategic focus for players within the mobile messaging ecosystem shifts from communication between individuals, to sending and receiving service-enabling messages”.
All operators are offering attractive applications which add creativity for users at low cost and high revenues for the operators.
9 http://mobithinking.com/mobile‐marketing‐tools/latest‐mobile‐stats/c 10 M/s Warid and M/s Telenor did not provide A2P data. 11 Warid regretted to provide A2P & P2A data 12 http://juniperresearch.com/viewpressrelease.php?pr=242 Juniper Research (May 2011)

Few of tschedulecustomeralerts, FoJob Alert
Some ofTunes, A(News, H
Differentpopular omobile n
ComparSMS ser
VideA
Voice<1
the most pope message brrs and the likootball Alertsts etc.
f the popular Antakshiri, TvHoroscopes, Q
t mobile opeon all networ
networks are a
MTU
WZ
Table 8
ring differenrvices as fol
Calenda1%
Antakshari<1%
Cricket Alert4%
eo Wicket Alerts<1%
Call blocker2%
e Mail1%
Popul
pular A2P aproadcasts fromkes, Info Servs, Chat, Faceb
P2A applicav Guide, ComQuotes, Jokes
rators reporterks, especiallyas follows
Mobilink Telenor Ufone
Warid Zong 8
nt entertainllows:
ar MMS<
ts
MisseAle20
lar Premiu
pplications arm their PC’s
vices, Religioubook SMS A
ations offeredmedy Portal, s, Fashion Up
ed different my on their Pul
Popular Services MobitunesSmart tunesUfone Info
Ring back tInfo Servic
nment subsc
S News<1% 0%Islamic
3
ed Call erts0%
um Service
re corporate Ss or handsetsus alerts, Gro
Alerts, SMS B
d by CMOs arMMS Newsdates), calend
most-used anll services. Fe
A2P
s Services
tone ces
criptions giv
c Portal3%
Islamic Alerts3%
Come
Tunes64%
es in Pakist
SMS, that ens to multipleoup SMS, SMBuddies, Busi
re: ‘Call & S, Prayer timindar, Guess the
nd popular seew of the mo
Popular
SMS Alerinfo servicInfo Sertoolkit (STRing backInfo Servi
ve a snap sh
edy Portal1%
Content Download
1%
Dictionary<1%
IQ Challeng<1%
tan in 2011
nables corpore recipients i
MS Scheduler,iness SMS, M
SMS’ Blockeng Alerts, SMe celebrity etc
rvices on theost popular A
P2A Servic
rts ces rvice & SITK) Menu k tone ices
hot of an ave
y
ge
1
rate users to i.e. their emp, Twitter on S
Missed Call a
r, Cricket AlMS Word Poc.
eir networks. A2P & P2A se
ces
IM
erage trend
send, managployees, regiSMS, SMS Calerts/Notifica
lerts, Video Aower, Info Se
Music tuneservices on dif
d of the prem
ge and istered
Cricket ations,
Alerts, ervices
s were fferent
mium

2.8. Location Based Services (LBS)
Location-based services (LBS) over the mobile, combine information about a user’s physical location from its online connectivity or through its location update in Mobile operator’s network. Alternately, LBS let users access relevant and up-to-date information about their surroundings, desirable services, inform the user of its whereabouts, and get instant access to maps and traffic information for their current location. Few of the location based services offered by M/s Telenor are Work Force Management and Location tracking service (TrackLive) that allows user to track its workforce and its company cars. M/s Ufone offer some LBS like UTrack, UTrack Find & UTrack Buddy Finder etc. Through these services, user can find its friends location, can request the location of any Ufone user, find its own Location, find your Place of interest - locate businesses like restaurants, boutiques, Banks, etc. within the area that he may be. Users can remain update on those MSISDNs, once allowed, to check their whereabouts by sending an SMS on ‘2002’. Mobilink offer ‘Ibuddy’, allowing subscribers of this service get SMS alerts whenever their friends are in a close proximity, ‘I Family’ that tracks and records the locations of all pre-approved family members on a predefined schedule., ‘I am Near’, which allows subscribers to locate businesses etc, and subscribers can also request location of friends (Consent required) and also check their current location, ‘I Sales fox’, this service would help meet the corporate sector requirements in terms of locating and tracking employees, fleet management of company’s cars fleet etc. M/s Zong and M/S Warid do not offer any location based service currently but they have this added service in their plan to offer to its customers. The implementation of LBS offers great potential for both business and consumers, however all this isn’t without challenges and concerns13, like privacy considerations, confidentiality, protection of personal and proprietary information. This can result in the creation of a very accurate and highly personal user profile, including most visited locations (habbbits) and other activities. In fact it raises questions of how, when and by whom this information can and should be used, leading to requirement of tighter regulations. Industry must take a mature look at possible fallouts and be similarly prepared to respond to these challenges involving the degree of user’s privacy that is being or could be violated.
3. MESSAGING REVENUES
3.1. Pakistan’s Messaging Revenues
During 2011 Pakistan’s Mobile Messaging Market generated revenues of around Rs.12.4 Billion (12,345,375,247). These include the revenues from P2P SMS, MMS and the A2P and P2A.
The P2P SMS were the main contributor in terms of revenues. 89.8% of the total revenues were from P2P SMS. Around 2.8% of total revenues were MMS revenues and premium SMS(A2P and P2A) contributed 7.4% into the total revenues.
13 http://www.fcc.gov/document/location‐based‐services‐report

3.2
The flaand no
3.3
The worlin 2016.
14 http://w(Febuary
2. P2P
at rates of SMw reached t
3. Glo
ldwide mobil
www.portiores2012)
3% 7%
Total
00.10.20.30.40.50.60.70.80.91
P SMS Fl
MS have deto close to ha
obal Mess
le messaging
search.com/en
90%
Messag
2006
0.98
SMS A
at Rates
creased to aalf a rupee [R
saging R
market was w
n/reports/curre
ging Reve
2007
0.89
Average Fl
s
almost half Rs 0.5] per S
Revenues
worth US$202
ent‐portfolio/m
enues
P2P Revenue
MMS Revenu
Sum of P2A aRev
2008 20
0.73
0
lat Rates(
in past five SMS over the
s:
2 billion in 2
mobile‐messag
es
ues
and A2P
09 2010
0.61 0.59
(Rs.) in Pa
years. It stae past five ye
01114 and is e
ging‐futures‐20
2011
9 0.59
akistan
arted with aears.
expected to re
012‐2016.aspx
around one r
each $310.2 b
Portio Researc
rupee
billion
ch

Comparing globally, Asia Pacific generated the highest mobile messaging revenues in 2011, maintaining the same trend as in Pakistan, and the contributors were SMS [63.5 %] followed by MMS [15.3 %], Mobile email [16.2 %] trailing by Mobile IM [5.0 %]15 .
A report from Informa16 predicts that the IM market will be worth around US$16 billion in 2016, of which mobile operators will take 54 percent of revenues and OTT messaging service providers, (such as WhatsApp and iMessage), will take 46 percent. Also in 2016 it is predicted that mobile e-mail and MMS will generate $32 and $20.7 billion in revenues respectively.
4. OTT MESSAGING SERVICE
OTT: “over the top” messaging are, services that run on data connection links obtained from mobile, and may not have anything to do with the mobile operator’s routing and forwarding.
OTT messaging services, also referred to as next-generation messaging services, offer Web-based messaging services to mobile users who subscribe to the same service (and/or use the same handset). These messages are free or almost free for the customer who have a web connection (e.g. WiFi) or a flat-rate mobile Web (Internet) package. The only cost to the user is the nominal charge for the data usage. While these services often earn some revenue for operators (e.g. mobile operators) who extend such services to OTT service providers but present a threat to the Cellular operators as OTT Service providers make the most of it due to their ever increasing data volumes.
Juniper report claimed that Mobile IM users worldwide will exceed 1.3 billion by 201617. This tripling of users within 5 years will be driven by the arrival of new OTT services, such as Apple’s iMessage, and continued growth of existing services, such as AOL’s AIM, Blackberry Messenger, Microsoft’s Windows Live, Skype and Yahoo! Messenger.
15 http://mobithinking.com/mobile‐marketing‐tools/latest‐mobile‐stats/c 16 http://blogs.informatandm.com/4971/press‐release‐sms‐will‐remain‐more‐popular‐than‐mobile‐messaging‐apps‐over‐next‐five‐years/ 17 http://www.juniperresearch.com/viewpressrelease.php?pr=248 Juniper Research (June 2011):
0.0%
10.0%
20.0%
30.0%
40.0%
50.0%
60.0%
70.0%
SMS MMS Mobile email IM
Asia Pacific Revenues in 2011

The IM services have some advantages, such as real-time communication and apparent absence of cost, but the disadvantage is that the market is fragmented by different service providers (AOL’s AIM, Blackberry Messenger, Microsoft’s Windows Live, Skype and Yahoo! Messenger) which so far are unable to communicate with each other, probably due to no regulations and due to race for acquiring as many subscriptions as possible ending up with one user subscribing to multiple such services, until they converge to a common standard.
The launch of these free Mobile IM services has been facilitated by the increasing number of smart phones in use, low-cost data packages (including availability of wi-fi feature) and the development of high speed mobile networks.
However, when compared to SMS, SMS being a standard evolving from GSMA forum standards is ubiquitous. With an SMS one can reach almost any handset in the world, as long as an associated cell number exists.
Cellular Service providers worldwide are feeling the threat from Over-The-Top message providers who end up cannibalizing revenues from their traditional service offerings, particularly when those third parties provide IP-based text messaging.
4.1. The popularity of OTT messaging services
Portio Research (Febuary 2012) 18: Over-the-Top (OTT) messaging traffic hit 3.5 trillion messages in 2011 and will continue to grow at a Compound Annual Growth Rate (CAGR) of 42.2 percent, forecasted to reach 20.3 trillion by the end of 2016.
Ovum (April 2012) predicts that network operators may lose upto $23bn in mobile messaging revenue in 2012, as they lose traffic to IP-based (OTT) social messaging services such as KakaoTalk (South Korea), WhatsApp, Twitter, Facebook etc.
Table 9
18 http://www.portioresearch.com/en/reports/current‐portfolio/mobile‐messaging‐futures‐2012‐2016.aspx 19 http://www.portioresearch.com/en/reports/current‐portfolio/mobile‐messaging‐futures‐2012‐2016.aspx 20 http://mobithinking.com/mobile‐marketing‐tools/latest‐mobile‐stats/c
Over-the-Top (OTT) messaging v SMS messaging.
OTT messages SMS messages MMS messages
2011 3,492 billion 7,844 billion 207 billion
2012 5,846 billion 8,600 billion 228 billion
2016 20,293 billion 9,554 billion 277 billion
Sources: Portio Research Febuary 201219
via: mobiThinking20

One of the biggest themes under discussion in the mobile messaging industry since 2011 is the issue of 'the Survival of SMS' and the booming rise of Over-the-Top (OTT) messaging services (or 'next generation' messaging services).
4.2. Difference between the OTT and SMS
There are essential differences between SMS and OTT messaging applications, and it's far more than just pricing.
SMS has achieved its considerable success primarily because of the simple accessible nature. Operators have ended up competing largely on price and bundle deals. All the five operators of Pakistan, like the United States and the Philippines, gave away vast bundles of SMS under attractive and competitive pricing.
OTT messaging services have gained momentum among mobile users due to factors including a rise in smartphone penetration, adoption of advanced networks providing high-speed Internet access, discounted and unlimited data plans, and the spread of application trends. The trend of these services will spread more rapidly with the increased trend of purchasing smartphones equipped with multi-lingual texting as well as translational capabilities by expert developers.
OTT applications are seen as a low cost solution, without obligated ‘Quality of Service’ requirements, fulfilling increased demand for P2P messaging. OTT apps worldwide are free, or “almost free”, and this could be the reason of vast spread of these services. These applications are free, the offer no sales revenues, no advertising revenues, no monthly usage charge to the service providers or the makers, the only benefits these services offer to their makers are device loyalty and the a significant consumer base they are building. Such huge customer base will ultimately be available for monetization purposes to become one of the most valuable web properties on the planet.
One may expect to see some level of interoperability within OTT applications, but this is only possible, if the vendors of comparatively less popular applications decide that providing connectivity/interoperability between each other would help them to compete against the players of most popular applications. This expectedly would be at the cost of taking away their independence and few dimensions of their business case. So competition isn’t about price. OTT are expectedly free at this stage just to increase the brand spread and brand loyalty.
0
5
10
15
20
25
2011 2012 2016
Messages Trillions
OTT Vs SMS vs MMS
OTT messages
SMS messages
MMS messages
With time new apps may become available, some free, some for a small charge, some ad-supported, many operator-owned (encouraged) and some specific-device-dependent.
It is very likely that, as the user base grows, vendors will look to either charge a small fee for usage – as in case of ‘Whatsapp a USD 0.99 charge per annum’, or generate revenue through advertising/sponsorship/promotions. OTT apps users will either have to start paying some amount per month for use (likely tied to volume of usage, through a multi-level system) or they will have to accept a certain level of advertising/sponsorship, or they will have to accept receiving regular promotion, one way or another.
OTT will not eliminate SMS completely. Both will grow together, along with online messaging using social networks such as Facebook and Twitter etc, increasing overall consumer P2P messaging. Consumers will continue to message using every platform available.
As the history of the technologies and applications tell that it eventually yields to another service/technology or application, SMS may also yield to new, attractive and economical services to compete advanced and next generation services. Attractive value added SMS could lead to a balance between SMS and OTT services.
5. MOBILE ADVERTISING
Mobile advertising targets users according to specified demographics. Business Artificial Intelligence when applied to Mobile Usage Trends, it classifies related mobile profiles and preferences and displays corresponding advertisements or identified preferential information, often commercial in nature, when consumers download and uses data services like games, applications (apps) or ring tones or when idle.
Mobile advertising is one of the potentially strong markets today. It allows one to reach the target market, get immediate results and monitor campaigns in just a click.
SMS/MMS Advertising
SMS/MMS advertising is defined as ad units that appear appended to other published content21. The ad unit can either be static (no action can be taken by the end user) or dynamic (user can act on the message e.g. by clicking or responding).
Through data-mining, service providers either sells their own inventory & package offers for A2P SMS messages or work with an SMS advertising network, which places advertising in existing SMS content feeds.
MMS ads, like SMS ads, are sent only to users that have opted in to receive them. Unlike SMS ads, MMS ads can include branding in the form of images, audio or video.
Search and Inquiry Services & ads
21 mmaglobal.com/files/mobileadoverview.pdf

Media publishers or search service providers use SMS and MMS to send information in response to user inquiries. These include directory inquiries based on relative location, phone numbers, price search services, or a large variety of other search-via-mobile services22. The inquiry is typically invoked by texting commands and/or keywords to short codes or selection through a pull-down menu. Ads can be inserted in the free space in the message, depending on the characters or size limit of the message.
5.1. Global Expenditure on mobile advertising and marketing worldwide
According to IAB and IHS Screen Digest (June 2012)23, global expenditure on mobile ads (search, display and messaging) in 2011 was US$5.3 billion, Searching drew maximum revenue worth $3.3 billion.
According to Gartner (June, 2012)24, global expenditure on mobile ads is forecasted to double every year reaching US$20.6 billion in 2015. Search ads and Location Based Ads (paid-for positioning on maps and increased reality apps) will deliver the highest revenue, while video/audio ads will see the fastest growth through 2015. Brand spending on mobile advertising will grow from 0.5 percent of the total advertising budget in 2010 to over 4 percent in 2015. 70 percent of mobile Ad budgets are spent on search advertising, with 30 percent spent on mobile display advertising. Google takes the lion’s share of combined search and display revenue with 70 percent market share. The other bigger mobile Ad networks are Millennial Media, Apple, Yahoo!, Microsoft and Jumptap etc. In 2010, Google declared its annual Mobile Ad revenue to be US$1 billion. It was estimated that Google’s US$1 billion gave it 70 percent of the global mobile ad market share.
5.2. Mobile advertising in Pakistan
The rise and spread of mobile ad consumption is majorly attributed to 3G/4G broadband networks, wide adoption of smartphones, and unlimited data plans. This allows advertisers to find alternative ways to reach consumers through mobile browsers, apps, SMS, and other platforms. The advent of these technologies will surely bring the mobile advertising in Pakistan as in other countries.
Currently the operators are just using advertising through SMS to promote their brand specific offers and latest packages. In-time realization is very important which only comes throughan always-on connectivity. Mobile Networks offer a tremendous potential as an advertising medium. Recognizing the need for accurate and comprehensive advertising plans to support and provide evidence for its future growth may be the target of future successful operators of Pakistan, who decide to win more spectrum for the forth coming spectrum auctions.
22 www.adexchanger.com/now...mobile/mobile‐display‐advertising 23 http://www.iab.net/about_the_iab/recent_press_releases/press_release_archive/press_release/pr‐060612_global 24 http://www.gartner.com/it/page.jsp?id=1726614

6. Recommendations 6.1. Mobile Operators should offer their own branded OTT services, backwardly compatible with
SMS, and integrated into their bundle plans so users purchase a messaging bundle including SMS, MMS and OTT for a set monthly or annual fee.
6.2. The consumers worldwide are shifting to the use of OTT apps, same trend will be followed here and hence SMS traffic will reduce resulting in reduced SMS revenues, so operators should think of attractive OTT services and alternates to maintain revenues.
6.3. There is a need for a comprehensive business model for the international apps that are being offered to local mobile customers, in the form of a policy in order to handle:-
• Government taxes, • National security and legal intercept • Foreign exchange transfer • Business venture with local operators
6.4. Currently the operators are just offering operator-specific marketing but need to plan for better offerings for their subscribers, (e.g. location based marketing for special offers in nearby shopping and food points). Operators should plan to offer a platform that allows their subscribers to opt for their area of interest to have marketing updates and messages on.
6.5. Location Based Services should be enhanced and extended to applications where the subscribers can easily PULL the location based information as and when required.
6.6. The Tariffs advertised on different media should be inclusive of taxes for the clarity and ease of users.
Feedback on the report may be send on [email protected]