promodag reports 10 for microsoft exchange … · 6 getting started with promodag reports how does...
TRANSCRIPT
PROMODAG REPORTS 10
FOR MICROSOFT EXCHANGE SERVER
Reporting on Exchange made simple!
Getting started

2 Getting started with PROMODAG Reports
COPYRIGHTS
Copyright @ 1999 - 2015 PROMODAG SA. All rights reserved.
Information in this document is subject to change without notice. The software described in this document is furnished under a license agreement or nondisclosure agreement. The software may be used or copied only in accordance with the terms of those agreements. No part of this publication may be reproduced, stored in a retrieval system, or transmitted in any form or any means electronic or mechanical, including photocopying and recording for any purpose other than the purchaser's personal use without the written permission of PROMODAG SA.
PROMODAG SA 22 bis, rue de la Réunion 75020 Paris France
http://www.promodag.com
Rev- 4 - 06/2015

Getting started with PROMODAG Reports 3
TABLE OF CONTENTS
Introducing PROMODAG Reports................................................................................................ 5
How does it work? Reports data sources ................................................................................... 6
Recommendations and best practises ...................................................................................... 10
Chapter 1 - Setting up your environment .................................................................................. 11
A - Requirements ....................................................................................................................... 11 B - Office 365 ............................................................................................................................. 14 C - Exchange Server 2007/2010/2013 ...................................................................................... 15 D - Exchange Server 2000/2003 ................................................................................................ 19 E - Internet Information Services (IIS) 6.0/7.0/8.0 ..................................................................... 21
Chapter 2 - Getting started ......................................................................................................... 23
A - Evaluating the product .......................................................................................................... 23 B - Installing the application ....................................................................................................... 23 C - Upgrading to a new version ................................................................................................. 24 D - Initial setup ........................................................................................................................... 24 E - Running your first report ....................................................................................................... 34
Chapter 3 - Automating and scheduling tasks ......................................................................... 41
A - Introducing batch files and report options files ..................................................................... 41 B - Automating and scheduling the collection of data and other actions ................................... 41 C - Automating and scheduling the generation of reports ......................................................... 47
Our customers top 10 favorite reports ...................................................................................... 51
1 - What is the mailbox breakdown by size? ............................................................................. 51 2 - Do users empty their Deleted items folder? [dynamic] ......................................................... 51 3 - What are the 10 largest mailboxes? ..................................................................................... 52 4 - What was the message breakdown by recipient count in the last 7 days? .......................... 52 5 - Who can access mailboxes? [dynamic] ................................................................................ 53 6 - What were the top 10 sending SMTP domains by message count in the last 7 days?........ 53 7 - How did internal traffic compare with Internet traffic for the last 7 days? ............................. 54 8 - What was the mailbox traffic growth in the last 7 days? ....................................................... 54 9 - What was the server traffic growth in the last 7 days? ......................................................... 55 10 - Who were the top 10 email senders in the last 7 days? ..................................................... 55
List of report templates ............................................................................................................... 56
1 - Storage ................................................................................................................................. 56 2 - Inventory ............................................................................................................................... 57 3 - Traffic Statistics .................................................................................................................... 57 4 - Mailbox Traffic....................................................................................................................... 58 5 - Mailbox Content .................................................................................................................... 59 6 - OWA Activity ......................................................................................................................... 60 7 - ActiveSync Activity ................................................................................................................ 60 8 - Public Folder Content ........................................................................................................... 60 9 - Server Traffic ........................................................................................................................ 61 10 - Internal Message Delivery .................................................................................................. 61

4 Getting started with PROMODAG Reports
11 - Traffic Optimization ............................................................................................................. 61 12 - Connector Flow ................................................................................................................... 62 13 - Billing .................................................................................................................................. 62
Support ......................................................................................................................................... 63
Index ............................................................................................................................................. 64
Getting started with PROMODAG Reports 5
About this guide
This guide is designed to provide a quick introduction to PROMODAG Reports for Microsoft Exchange Server, and it describes steps from getting started to producing the first report.
For more details about specific features of PROMODAG Reports, please refer to the online Help system.
Introducing PROMODAG Reports
PROMODAG Reports is an advanced and cost-effective reporting tool that enables Exchange Server administrators and IT managers to obtain valuable information about all aspects of their email system.
With its powerful and easy-to-understand features, PROMODAG Reports produces comprehensive reports that you can rely on to ensure better security, business continuity, and to improve Exchange organization performance.
PROMODAG Reports is easy to install and configure. Reports use native Exchange server data sources; so there is nothing to install on the server. The product collects and stores the necessary data into an Access or SQL Server database. You can choose from over 80 ready-made report templates and publish reports to various destinations in different formats. All operations can be easily automated and scheduled so you can set up the product and forget about it.

6 Getting started with PROMODAG Reports
How does it work? Reports data sources
PROMODAG Reports collects the information it needs from different native Exchange data sources.
Traffic reports are based on Exchange message tracking files previously imported into the database.
OWA and ActiveSync reports are based on IIS log files previously imported into the database.
Inventory reports are likewise based on the information retrieved during directory import.
On the other hand, all reports on mailbox/public folder content directly take their information from Exchange through a dynamic MAPI connection. Storage size reports (growth, comparison) are based on imported storage size data.
Getting started with PROMODAG Reports 7
What data
sources?
What for?
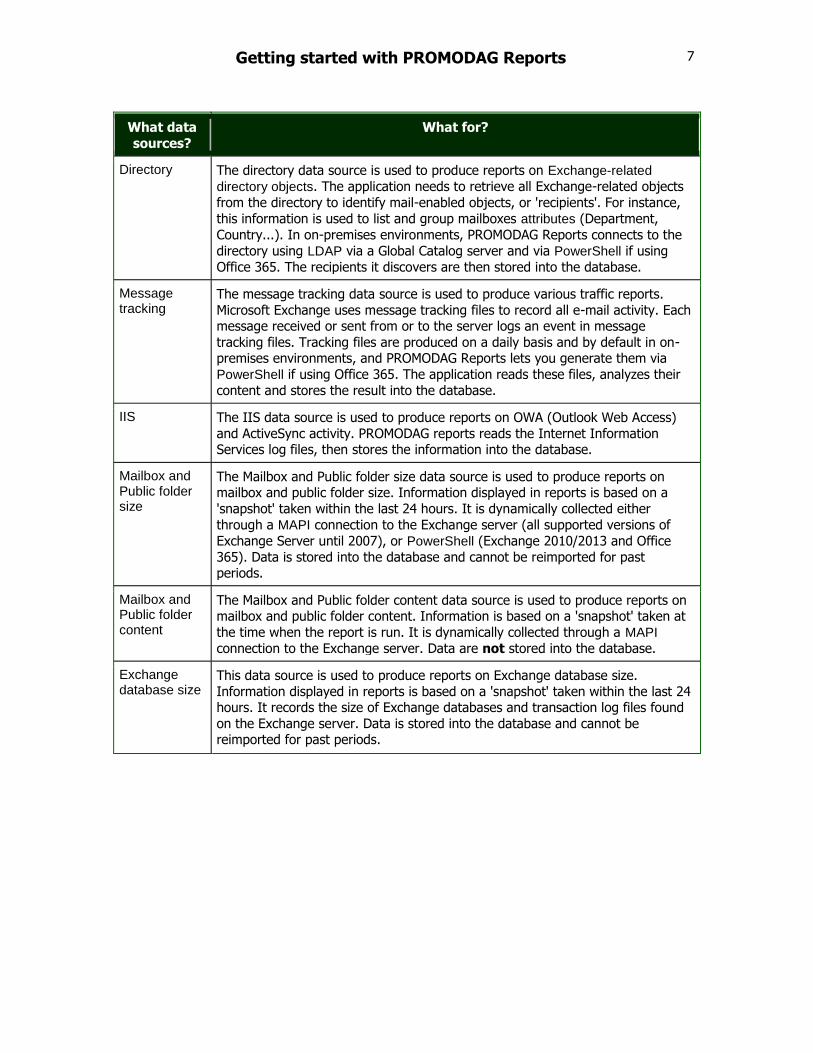
Directory The directory data source is used to produce reports on Exchange-related
directory objects. The application needs to retrieve all Exchange-related objects
from the directory to identify mail-enabled objects, or 'recipients'. For instance,
this information is used to list and group mailboxes attributes (Department,
Country...). In on-premises environments, PROMODAG Reports connects to the
directory using LDAP via a Global Catalog server and via PowerShell if using
Office 365. The recipients it discovers are then stored into the database.
Message tracking
The message tracking data source is used to produce various traffic reports.
Microsoft Exchange uses message tracking files to record all e-mail activity. Each message received or sent from or to the server logs an event in message
tracking files. Tracking files are produced on a daily basis and by default in on-premises environments, and PROMODAG Reports lets you generate them via
PowerShell if using Office 365. The application reads these files, analyzes their
content and stores the result into the database.
IIS The IIS data source is used to produce reports on OWA (Outlook Web Access)
and ActiveSync activity. PROMODAG reports reads the Internet Information Services log files, then stores the information into the database.
Mailbox and Public folder size
The Mailbox and Public folder size data source is used to produce reports on mailbox and public folder size. Information displayed in reports is based on a
'snapshot' taken within the last 24 hours. It is dynamically collected either
through a MAPI connection to the Exchange server (all supported versions of
Exchange Server until 2007), or PowerShell (Exchange 2010/2013 and Office
365). Data is stored into the database and cannot be reimported for past periods.
Mailbox and Public folder content
The Mailbox and Public folder content data source is used to produce reports on mailbox and public folder content. Information is based on a 'snapshot' taken at
the time when the report is run. It is dynamically collected through a MAPI
connection to the Exchange server. Data are not stored into the database.
Exchange database size
This data source is used to produce reports on Exchange database size.
Information displayed in reports is based on a 'snapshot' taken within the last 24 hours. It records the size of Exchange databases and transaction log files found
on the Exchange server. Data is stored into the database and cannot be reimported for past periods.
8 Getting started with PROMODAG Reports
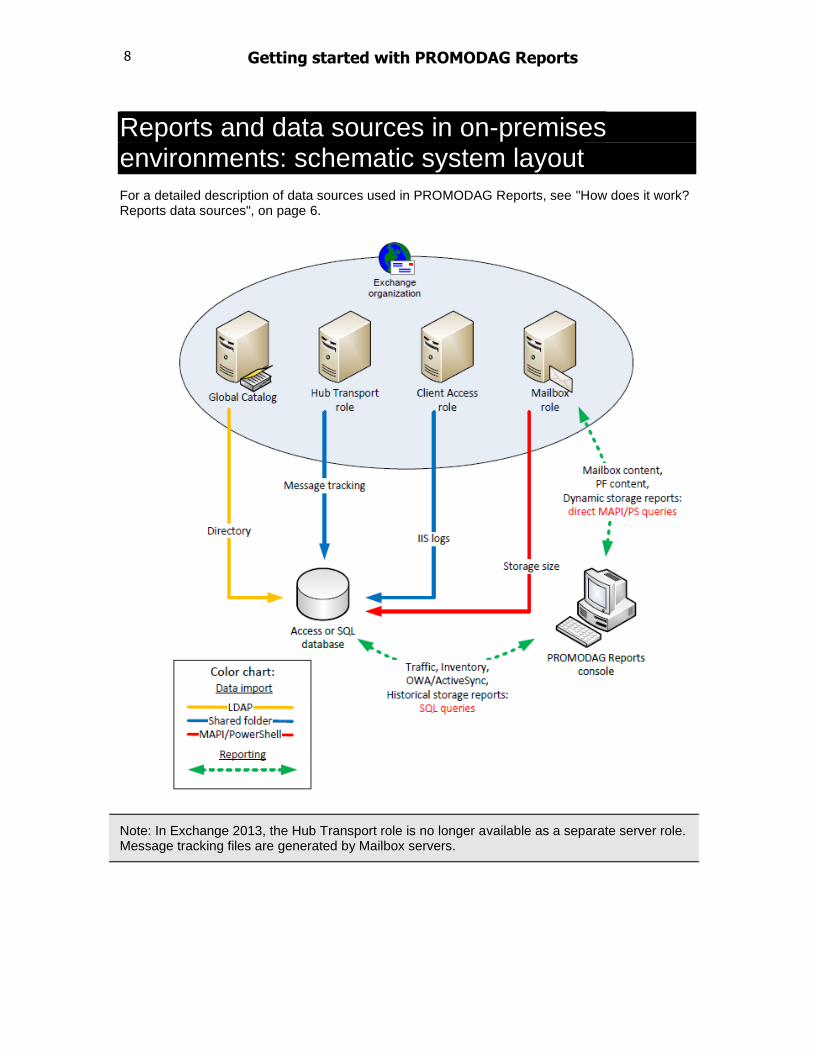
Reports and data sources in on-premises environments: schematic system layout
For a detailed description of data sources used in PROMODAG Reports, see "How does it work? Reports data sources", on page 6.
Note: In Exchange 2013, the Hub Transport role is no longer available as a separate server role. Message tracking files are generated by Mailbox servers.
Getting started with PROMODAG Reports 9
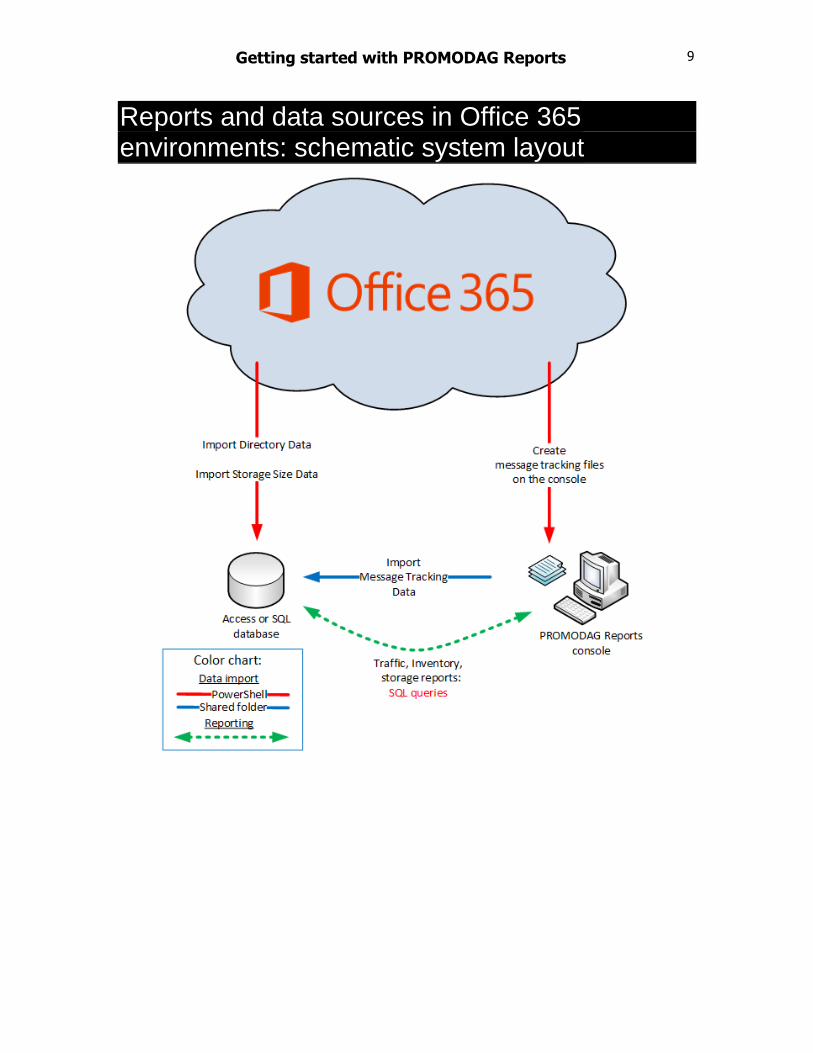
Reports and data sources in Office 365 environments: schematic system layout
Recommendations and best practises
This list is mostly based on experience supporting our customers around the world.
1. Installation
Carefully check the requirements and recommended settings before installing the product. For more details, see "Setting up your environment", on page 11 and following.
Do not install the product on an Exchange server. It may either not work at all, or work badly.
2. Permissions
Create a dedicated user account to run the product and grant it all the permissions it needs; not more, not less. For a detailed list of required permissions, see "Required permissions", on page 13.
Always use that account to start the application, also in batch mode. Avoid using a specific user account to access the directory, or the Exchange environment. Make it simple.
3. Database
Access database: For better performances, do not move the database to a shared resource and leave it on a local disk. Backup it regularly. Since an Access database is limited to 2 GB, purge and compact your database once it has approximately reached 1.8 GB in size, or create a new one.
SQL database: Do not create the database on a SQL server used by critical applications for it may impact their performance. Set the recovery model of the database to 'Simple'.
4. Task automation
Always set the user account dedicated to PROMODAG Reports to start your scheduled tasks.
Import data on a daily basis. The process is shorter and easier to monitor.
Import batch jobs should be scheduled from 1AM GMT/UTC onwards, after yesterday's logs have been closed.
Make sure that none of your tasks is scheduled to start at the same time as another one.
Do not create one batch per report or per action. Should you need to generate several reports on a daily basis, add them to one single batch file.
Activate email notifications in order to make sure that all batch jobs have completed successfully.
5. Troubleshooting
Check our Knowledge Base on http://www.promodag.com/Portal/KB/browse.aspx before sending a support request. It will provide you with helpful information and answers to FAQ's.
If you are experiencing a problem, check the change log on http://www.promodag.com/products/reports/changelogV9.aspx to verify that it has not been already corrected. Use the Help > Check for Updates option to verify that you are running the latest version and update your installation.
Use the Help > Technical Support Request option if possible. A written request that contains precise details will be dealt with faster than a voice message saying that something does not work.

Chapter 1 - Setting up your environment
The following topics describe how to configure the different data sources used by PROMODAG Reports depending on your version of Microsoft Exchange Server.
A - Requirements
1. Microsoft Exchange Server requirements
Supported versions (32 or 64-bit) of Microsoft Exchange Server are:
Office 365 (Exchange Online);
Any 32 or 64-bit version of the following On-Premises versions of Exchange:
2013,
2010,
2007,
2003.
Note: It is possible to use the product with a mix of different Exchange Server versions.
You do not need to install anything on the Exchange Server, or to modify anything in your Exchange organization.
2. Workstation requirements
Note: PROMODAG Reports can either be installed on a workstation or a server. It must not be installed on an Exchange server. Moreover, no Exchange component or administrative tool (such as Exchange System Manager) must be installed on the machine.
Workstation hardware and software requirements
Item Requirement
Processor A 2 GHz Intel Pentium Processor.
System memory 1 GB of system memory.
Disk space Sufficient disk space to store the database.
Supported operating systems One of the following operating systems (32 or 64-bit):
Windows 2012 R2,
Windows 8.1,
Windows Server 2012,
Windows 8,
Windows Server 2008 R2,
Windows 7,
Windows Server 2008,
Windows Vista SP2,
12 Getting started with PROMODAG Reports
Item Requirement
Windows Server 2003 SP2,
Windows XP SP3.
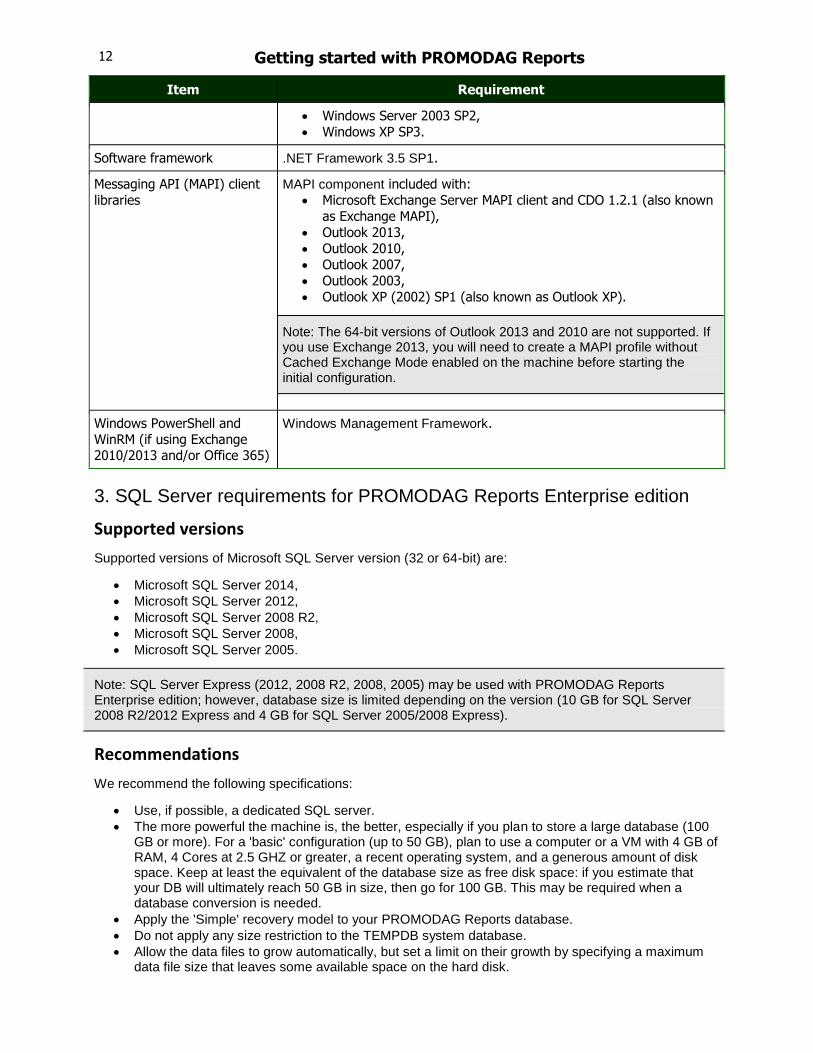
Software framework .NET Framework 3.5 SP1.
Messaging API (MAPI) client
libraries
MAPI component included with:
Microsoft Exchange Server MAPI client and CDO 1.2.1 (also known
as Exchange MAPI),
Outlook 2013,
Outlook 2010,
Outlook 2007,
Outlook 2003,
Outlook XP (2002) SP1 (also known as Outlook XP).
Note: The 64-bit versions of Outlook 2013 and 2010 are not supported. If you use Exchange 2013, you will need to create a MAPI profile without Cached Exchange Mode enabled on the machine before starting the initial configuration.
Windows PowerShell and
WinRM (if using Exchange 2010/2013 and/or Office 365)
Windows Management Framework.
3. SQL Server requirements for PROMODAG Reports Enterprise edition
Supported versions
Supported versions of Microsoft SQL Server version (32 or 64-bit) are:
Microsoft SQL Server 2014,
Microsoft SQL Server 2012,
Microsoft SQL Server 2008 R2,
Microsoft SQL Server 2008,
Microsoft SQL Server 2005.
Note: SQL Server Express (2012, 2008 R2, 2008, 2005) may be used with PROMODAG Reports Enterprise edition; however, database size is limited depending on the version (10 GB for SQL Server 2008 R2/2012 Express and 4 GB for SQL Server 2005/2008 Express).
Recommendations
We recommend the following specifications:
Use, if possible, a dedicated SQL server.
The more powerful the machine is, the better, especially if you plan to store a large database (100 GB or more). For a 'basic' configuration (up to 50 GB), plan to use a computer or a VM with 4 GB of RAM, 4 Cores at 2.5 GHZ or greater, a recent operating system, and a generous amount of disk space. Keep at least the equivalent of the database size as free disk space: if you estimate that your DB will ultimately reach 50 GB in size, then go for 100 GB. This may be required when a database conversion is needed.
Apply the 'Simple' recovery model to your PROMODAG Reports database.
Do not apply any size restriction to the TEMPDB system database.
Allow the data files to grow automatically, but set a limit on their growth by specifying a maximum data file size that leaves some available space on the hard disk.

Getting started with PROMODAG Reports 13
Permissions
For a detailed list of required SQL permissions, see "Required permissions", on page 13.
Data retention strategies
We recommend that you use one of the following data retention strategies:
Create a new SQL database every 1 or 2 years on 1st January, and archive the previous one.
Keep the same database, but regularly purge old data so that only the last 90, 180, 365 days are retained.
4. Required permissions
Notes: The 'PROMODAG workstation' is the computer on which PROMODAG Reports is installed. The 'PROMODAG account' is the service account that is used to start PROMODAG Reports.
PROMODAG account permissions
Version of Exchange
Data source Required permission What for?
All On-
premises versions
Directory Exchange 2010/2013:
Membership of the
Organization Management group;
Exchange 2000/2003 and 2007:
Membership of the Exchange
View-Only Administrators group.
See also: "Configuring the directory data
source ", on page 15.
"Configuring the directory data
source ", on page 19.
Import the directory, run
PowerShell commands
Mailbox and Public folder size
Reports on mailbox and
public folder size
Mailbox and Public folder content
Reports on mailbox and public folder content
Message tracking Read-Only permissions on message
tracking file directories .
Reports on email traffic
IIS Read-Only permissions on IIS log file directories.
Reports on OWA and ActiveSync activity
Exchange database size
Read-Only permissions on Mailbox and
Public Folder database files .
Import the size of Exchange
databases
Exchange
Online (Office 365)
Directory,
Message tracking, Mailbox and Public folder size
Membership of the Organization
Management group and Billing Admin or Service Admin role on the
organization.
Run PowerShell commands,
import the directory, reports on email traffic, reports on
mailbox and public folder size
Note: If UAC is enabled on the PROMODAG workstation, we recommend to run the application as Administrator.
14 Getting started with PROMODAG Reports
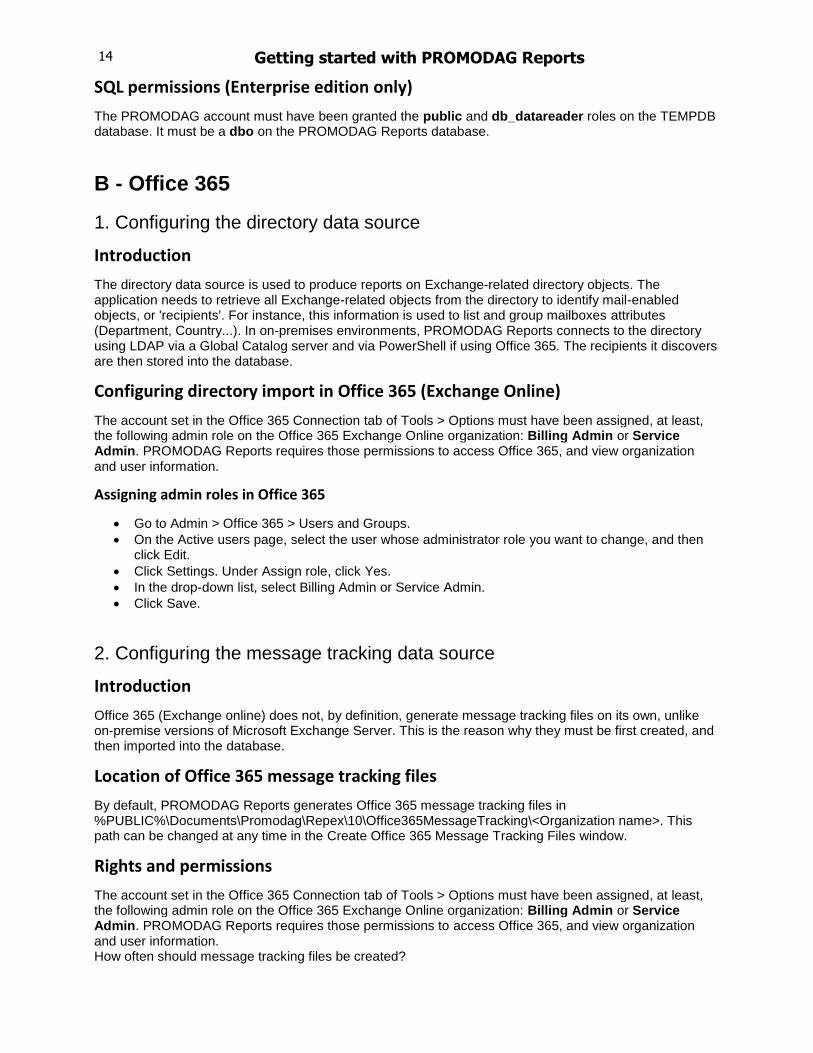
SQL permissions (Enterprise edition only)
The PROMODAG account must have been granted the public and db_datareader roles on the TEMPDB database. It must be a dbo on the PROMODAG Reports database.
B - Office 365
1. Configuring the directory data source
Introduction
The directory data source is used to produce reports on Exchange-related directory objects. The application needs to retrieve all Exchange-related objects from the directory to identify mail-enabled objects, or 'recipients'. For instance, this information is used to list and group mailboxes attributes (Department, Country...). In on-premises environments, PROMODAG Reports connects to the directory using LDAP via a Global Catalog server and via PowerShell if using Office 365. The recipients it discovers are then stored into the database.
Configuring directory import in Office 365 (Exchange Online)
The account set in the Office 365 Connection tab of Tools > Options must have been assigned, at least, the following admin role on the Office 365 Exchange Online organization: Billing Admin or Service Admin. PROMODAG Reports requires those permissions to access Office 365, and view organization and user information.
Assigning admin roles in Office 365
Go to Admin > Office 365 > Users and Groups.
On the Active users page, select the user whose administrator role you want to change, and then click Edit.
Click Settings. Under Assign role, click Yes.
In the drop-down list, select Billing Admin or Service Admin.
Click Save.
2. Configuring the message tracking data source
Introduction
Office 365 (Exchange online) does not, by definition, generate message tracking files on its own, unlike on-premise versions of Microsoft Exchange Server. This is the reason why they must be first created, and then imported into the database.
Location of Office 365 message tracking files
By default, PROMODAG Reports generates Office 365 message tracking files in %PUBLIC%\Documents\Promodag\Repex\10\Office365MessageTracking\<Organization name>. This path can be changed at any time in the Create Office 365 Message Tracking Files window.
Rights and permissions
The account set in the Office 365 Connection tab of Tools > Options must have been assigned, at least, the following admin role on the Office 365 Exchange Online organization: Billing Admin or Service Admin. PROMODAG Reports requires those permissions to access Office 365, and view organization and user information. How often should message tracking files be created?

Getting started with PROMODAG Reports 15
The data used to create message tracking files is only available from Office 365 for a short time. We recommend to automate this operation and to schedule it on a daily basis.
3. Configuring the Mailbox and public folder size data source
Introduction
The Mailbox and Public folder size data source is used to produce reports on mailbox and public folder size. Information displayed in reports is based on a 'snapshot' taken within the last 24 hours. It is dynamically collected either through PowerShell . Data is stored into the database and cannot be reimported for past periods.
Rights and permissions
The account set in the Office 365 Connection tab of Tools > Options must have been assigned, at least, the following admin role on the Office 365 Exchange Online organization: Billing Admin or Service Admin. PROMODAG Reports requires those permissions to import the size of mailboxes and public folders.
Assigning admin roles in Office 365
Go to Admin > Office 365 > Users and Groups.
On the Active users page, select the user whose administrator role you want to change, and then click Edit.
Click Settings. Under Assign role, click Yes.
In the drop-down list, select Billing Admin or Service Admin.
Click Save.
C - Exchange Server 2007/2010/2013
1. Configuring the directory data source
Introduction
The directory data source is used to produce reports on Exchange-related directory objects. The application needs to retrieve all Exchange-related objects from the directory to identify mail-enabled objects, or 'recipients'. For instance, this information is used to list and group mailboxes attributes (Department, Country...). In on-premises environments, PROMODAG Reports connects to the directory using LDAP via a Global Catalog server and via PowerShell if using Office 365. The recipients it discovers are then stored into the database.
Configuring directory import in Exchange 2007/2010/2013
You must use an account that has at least the following roles on the Exchange organization in order to be able to import the directory:
Organization Management role (Exchange 2010/2013)
Exchange View-Only Administrator role (Exchange 2007).
Enabling such permissions requires a Microsoft Exchange Server administrator role.
Exchange 2013:
In the Exchange Administration Center (EAC), navigate to Permissions > Admin Roles.
Select the Organization Management role group, and then click Edit.
In the Members section, click Add. Select the users, USGs, or other role groups you want to add to the role group, click Add, and then click OK.
Click Save to save the changes to the role group.

16 Getting started with PROMODAG Reports
Exchange 2010:
Add the user account into the Organization Management role group using Active Directory Users and Computers tool (ADUC). You will find this group in the Microsoft Exchange Security Group Organizational Unit.
Exchange 2007:
Start the Exchange Management Console tool.
Right-click Organization Configuration and select the Add Exchange Administrator option.
Select the user account used to start PROMODAG Reports (or the account defined in Server Properties, Security tab and set its role to Exchange View-Only Administrator.
2. Configuring the message tracking data source
Introduction
The message tracking data source is used to produce various traffic reports. Microsoft Exchange uses message tracking files to record all e-mail activity. Each message received or sent from or to the server logs an event in message tracking files. Tracking files are produced on a daily basis and by default in on-premises environments, and PROMODAG Reports lets you generate them via PowerShell if using Office 365. The application reads these files, analyzes their content and stores the result into the database.
Message tracking files and Exchange 2007/2010/2013 server roles
Only servers with a Transport or or Mailbox role installed generate message tracking files that can be used by PROMODAG Reports to produce reports on traffic.
Exchange 2013:
The application imports message tracking files from servers with the Mailbox role installed.
Up to Exchange 2013 CU2, the naming convention for log files in the message tracking log directory is:
MSGTRKMSyyyymmdd-n.log: contains traffic events (sent messages);
MSGTRKMDyyyymmdd-n.log: contains traffic events (received messages);
MSGTRKyyyymmdd-n.log: contains flow events.
The Exchange server generates at least 3 message tracking files a day.
This naming convention changes from Exchange CU3 onwards, for message tracking files are created hourly. The files described above are now named as follows:
MSGTRKMSyyyymmddhh-n.log;
MSGTRKMDyyyymmddhh-n.log;
MSGTRKyyyymmddhh-n.log.
The Exchange server now generates at least 72 message tracking files a day.
Exchange 2007/2010:
The application imports message tracking files from servers with the Hub Transport and Edge Transport roles installed. The name format of these files is MSGTRKyyyymmdd-n.log.
Note: PROMODAG Reports does not import the specific message tracking files generated on Mailbox servers, whose name contains an additional M: MSGTRKMyyyymmdd-n.log.
Location of message tracking files
By default, the Exchange server generates message tracking files in

Getting started with PROMODAG Reports 17
Exchange 2013: C:\Program Files\Microsoft\Exchange Server\V15\TransportRoles\Logs\MessageTracking,
Exchange 2010: C:\Program Files\Microsoft\Exchange Server\V14\TransportRoles\Logs\MessageTracking,
Exchange 2007: C:\Program Files\Microsoft\Exchange Server\TransportRoles\Logs\MessageTracking.
Those directories are not shared by default.
Rights and permissions
The user account used to start PROMODAG Reports (or the administrative account defined in Server Properties, Security tab) must have at least Read-Only access permissions to the message tracking files shared folder. This folder is not shared by default and PROMODAG Reports uses the following UNC paths to access it:
Exchange 2013: \\<Server>\C$Program Files\Microsoft\Exchange Server\V15\TransportRoles\Logs\MessageTracking,
Exchange 2010: \\<Server>\C$Program Files\Microsoft\Exchange Server\V14\TransportRoles\Logs\MessageTracking,
Exchange 2007: \\<Server>\C$\Program Files\Microsoft\Exchange Server\TransportRoles\Logs\MessageTracking.
This path reference the C$ shared resource that can only be accessed with administrative rights. Therefore, you can either use an administrative account to run PROMODAG Reports, or enter an administrative account name and password in Server Properties, Security tab.
If you cannot or if you do not wish to use an administrative share,
Set up a shared resource and configure its path in Server Properties, Message Tracking tab, or
Copy message tracking files into another folder on a local or network share and configure its path in the Server Properties, Message Tracking tab.
Note: Please make sure that you grant the required permissions if you decide to change the location of the message tracking files directory. For more information, please refer to Microsoft Technet.
Enabling message tracking
By default, message tracking is enabled on all Exchange 2007/2010 computers that have the Hub Transport, Mailbox, or Edge Transport server roles installed, and on Exchange 2013 Mailbox servers.
Note: Enabling or disabling message tracking in Exchange Management Console is only available from Exchange 2007 SP1 onwards.
How long are message tracking files retained?
By default, Microsoft Exchange Server keeps message tracking files for a duration of 30 days. For more information on how to enable message tracking in Exchange 2007/2010/2013, see the Microsoft Technet website.
3. Configuring the Mailbox and Public folder content data source
Introduction
The Mailbox and Public folder content data source is used to produce reports on mailbox and public folder content. Information is based on a 'snapshot' taken at the time when the report is run. It is dynamically collected through a MAPI connection to the Exchange server. Data are not stored into the database.

18 Getting started with PROMODAG Reports
Rights and permissions
You must be logged in with an account that has at least the View-Only Organization Management role (Exchange 2010/2013) or Exchange View Only Administrator role (Exchange 2007) on the Exchange organization in order to be able to access the content of mailboxes and public folders.
Specific requirements for Exchange 2013
You must create a MAPI profile without Cached Exchange Mode enabled on the workstation to be able to analyze mailboxes hosted on Exchange 2013.
4. Configuring the Mailbox and Public folder size data source
Introduction
The Mailbox and Public folder size data source is used to produce reports on mailbox and public folder size. Information displayed in reports is based on a 'snapshot' taken within the last 24 hours. It is dynamically collected either through a MAPI connection to the Exchange server (all supported versions of Exchange Server until 2007), or PowerShell (Exchange 2010/2013 and Office 365). Data is stored into the database and cannot be reimported for past periods.
Rights and permissions
You must use an account that has at least
The Organization Management role (Exchange 2010/2013) - it should be able to run PowerShell commands - or
The Exchange View Only Administrator role (Exchange 2007)
on the Exchange organization to import the size of mailboxes and public folders.
5. Configuring the Exchange database size data source
Introduction
This data source is used to produce reports on Exchange database size. Information displayed in reports is based on a 'snapshot' taken within the last 24 hours. It records the size of Exchange databases and transaction log files found on the Exchange server. Data is stored into the database and cannot be reimported for past periods.
Databases location
Exchange 2013
In Exchange 2013, public folder architecture uses specially designed mailboxes to store both the public folder hierarchy and the content. The default paths to mailbox databases when you install Exchange 2013 are:
C:\Program Files\Microsoft\Exchange Server\V15\Mailbox\<Mailbox database name>\<Mailbox database name.edb.
Exchange 2010
The default paths to mailbox and public folder databases when you install Exchange 2010 are:
C:\Program Files\Microsoft\Exchange Server\V14\Mailbox\<Mailbox database name>\<Mailbox database name.edb (for mailboxes)
C:\Program Files\Microsoft\Exchange Server\V14\Mailbox\<Public folder database name>\<Public folder database name>.edb (for public folders).

Getting started with PROMODAG Reports 19
Exchange 2007
The default paths to mailbox and public folder databases when you install Exchange 2007 are:
C:\Program Files\Microsoft\Exchange Server\Mailbox\First Storage Group\Mailbox database.edb (for mailboxes)
C:\Program Files\Microsoft\Exchange Server\Mailbox\First Storage Group\Public Folder database.edb (for public folders).
Note: Exchange 2013, 2010 and 2007 do not use .stm files.
Rights and permissions
The user account used to start PROMODAG Reports (or the administrative account defined in Server Properties, Security tab) must have at least Read-Only access permissions to the files containing Exchange databases (.edb files).
The folders that contain these files are not shared by default and PROMODAG Reports uses the following UNC paths to access them:
Exchange 2013: \\<Server>\C$\Program Files\Microsoft\Exchange Server\V15\Mailbox\<Mailbox database name>\
Exchange 2010: \\<Server>\C$\Program Files\Microsoft\Exchange Server\V14\Mailbox\<Mailbox database name> or <Public folder database name>\,
Exchange 2007: \\<Server>\C$\Program Files\Microsoft\Mailbox\First Storage Group\
These default paths can be changed in the Server Properties, Storage Size tab of PROMODAG Reports.
D - Exchange Server 2000/2003
1. Configuring the directory data source
Introduction
The directory data source is used to produce reports on Exchange-related directory objects. The application needs to retrieve all Exchange-related objects from the directory to identify mail-enabled objects, or 'recipients'. For instance, this information is used to list and group mailboxes attributes (Department, Country...). In on-premises environments, PROMODAG Reports connects to the directory using LDAP via a Global Catalog server and via PowerShell if using Office 365. The recipients it discovers are then stored into the database.
Configuring directory import in Exchange 2000/2003
You must be logged in with an account that has at least the Exchange View Only Administrator role on the Exchange organization in order to be able to import the directory.
Enabling such permission requires a Microsoft Exchange Server administrator role and can be setup with the Exchange System Manager tool.
Start Exchange System Manager.
Right-click the Exchange organization name.
Choose Delegate control.
Select the user account used to start PROMODAG Reports (or the account defined in Server Properties, Security tab) and set its role to Exchange View-Only Administrator.

20 Getting started with PROMODAG Reports
2. Configuring the message tracking data source
Introduction
The message tracking data source is used to produce various traffic reports. Microsoft Exchange uses message tracking files to record all e-mail activity. Each message received or sent from or to the server logs an event in message tracking files. Tracking files are produced on a daily basis and by default in on-premises environments, and PROMODAG Reports lets you generate them via PowerShell if using Office 365. The application reads these files, analyzes their content and stores the result into the database.
The application imports message tracking files from Back-End servers. The name format of these files is yyyymmdd.log.
Location of message tracking files
By default, PROMODAG Reports looks for message tracking files in the shared resource \\<server name>\server_name.log\, that points to the C:\Program Files\Exchsrvr\<server_name>. log folder of the Exchange 2000/2003 server. This default path can be changed in the Server Properties, Message Tracking tab of PROMODAG Reports.
Rights and permissions
The user account used to start PROMODAG Reports (or the administrative account defined in Server Properties, Security tab) must have at least Read-Only access permissions to the message tracking files shared folder.
Note: It is also possible to copy message tracking files on a local or a network share, and import them from there.
How long are message tracking files retained?
By default, Microsoft Exchange Server keeps message tracking files for a duration of 7 days. This default setting can be changed in the Log file maintenance parameters to accommodate different needs. For more information on how to enable message tracking in Exchange 2000/2003, see the Microsoft Knowledge Base or the Microsoft Technet website.
3. Configuring the Mailbox and Public folder content data source
Introduction
The Mailbox and Public folder content data source is used to produce reports on mailbox and public folder content. Information is based on a 'snapshot' taken at the time when the report is run. It is dynamically collected through a MAPI connection to the Exchange server. Data are not stored into the database.
Rights and permissions
You must be logged in with an account that has at least the Exchange View-Only Administrator role on the Exchange organization in order to be able to access the content of mailboxes and public folders.
4. Configuring the Mailbox and Public folder size data source
Introduction
The Mailbox and Public folder size data source is used to produce reports on mailbox and public folder size. Information displayed in reports is based on a 'snapshot' taken within the last 24 hours. It is dynamically collected either through a MAPI connection to the Exchange server (all supported versions of Exchange Server until 2007), or PowerShell (Exchange 2010/2013 and Office 365). Data is stored into the database and cannot be reimported for past periods.
Getting started with PROMODAG Reports 21
Rights and permissions
The user account used to start PROMODAG Reports (or the administrative account defined in Server Properties, Security tab ) must have been granted, at least, the Exchange View Only Administrator role on the Exchange organization in order to be able to import the size of mailboxes and public folders.
5. Configuring the Exchange database size data source
Introduction
This data source is used to produce reports on Exchange database size. Information displayed in reports is based on a 'snapshot' taken within the last 24 hours. It records the size of Exchange databases and transaction log files found on the Exchange server. Data is stored into the database and cannot be reimported for past periods.
Databases location
The default paths to mailbox and public folder databases when you install Exchange 2000/2003 are:
C:\Program Files\Exchsrvr\mdbdata\priv1.edb and C:\Program Files\Exchsrvr\mdbdata\priv1.stm (for mailboxes).
C:\Program Files\Exchsrvr\mdbdata\pub1.edb and C:\Program Files\Exchsrvr\mdbdata\pub1.stm (for public folders).
These default paths can be modified in Server properties, Storage Size tab.
Rights and permissions
The user account used to start PROMODAG Reports (or the administrative account defined in Server properties, Security tab) must have at least Read-Only access permissions to the files containing Exchange databases (.edb and .stm files).
E - Internet Information Services (IIS) 6.0/7.0/8.0
1. Configuring the Internet Information Services data source
Introduction
The IIS data source is used to produce reports on OWA (Outlook Web Access) and ActiveSync activity. PROMODAG reports reads the Internet Information Services log files, then stores the information into the database.
Location of IIS log files
By default, IIS generates log files files in
IIS 7.0/8.0: C:\inetpub\logs\LogFiles\W3SVC1\
IIS 6.0: C:\WINDOWS\system32\LogFiles\W3SVC1
Rights and permissions
The user account used to start PROMODAG Reports (or the administrative account defined in Server Properties, Security tab ) must have at least Read-Only access permissions to the Internet Information Services files shared folder. This folder is not shared by default and PROMODAG Reports uses the following UNC path to access it:
IIS 7.0/8.0: \\<Server>\C$\inetpub\logs\LogFiles\W3SVC1\

22 Getting started with PROMODAG Reports
IIS 6.0: \\<Server>\C$\WINDOWS\system32\LogFiles\W3SVC1\
This path references the C$ shared resource that can only be accessed with administrative rights. Therefore, you can either use an administrative account to run PROMODAG Reports, or enter an administrative account name and password in Server Properties, Security tab.
If you cannot or if you do not wish to use an administrative share,
Set up a shared resource and configure its path in PROMODAG Reports, or
Copy IIS log files into a local folder and configure its path in PROMODAG Reports. Enabling logging in IIS 7.0/8.0
Start the Internet Information Services Management UI.
Expand the server name, right-click Default Web Site for each OWA site, and select Properties.
In the Default Web Site Home page, double-click the Logging icon.
In the Logging page,
Verify that the Schedule radio button is selected and that the option is set to Daily.
Verify that the log file format selected is W3C and click the Select Fields button.
In the W3C Logging Fields page, confirm that at least the following logging options are selected:
Date (date)
Time (time)
Client IP address (c-ip)
User Name (cs-username)
Method (cs-method)
URI Stem (cs-uri-stem)
URI Query (cs-uri-query)
User Agent (cs(User-Agent)).
Enabling logging in IIS 6.0
Start the Internet Information Services (IIS) snap-in.
Expand the server name, right-click Default Web Site for each OWA site, and then select Properties.
In the Web Site tab,
Verify that the Enable logging checkbox is ticked,
Click the Properties button to access the Extended Logging Properties dialog box.
In the General Properties tab,
Verify that the New Log Time Period schedule is set to Daily or Hourly;
Click the Extended Properties tab.
In the Extended Propertiestab, confirm that at leastthe following logging options are selected:
Date (date)
Time (time)
Client IP address (c-ip)
User Name (cs-username)
Method (cs-method)
URI Stem (cs-uri-stem)
URI Query (cs-uri-query)
User Agent (cs(User-Agent)).

Chapter 2 - Getting started
A - Evaluating the product
You may evaluate any of the three editions of PROMODAG Reports for a period of up to 45 days from first installation. The only other limitation is that your reports on e-mail traffic or OWA and Active Sync activity can only cover a maximal period of 15 consecutive days.
You can indeed only import up to 15 consecutive days of Exchange message tracking files or IIS log files in evaluation mode, which explains the latter restriction (for more explanations, see: "How does it work? Reports data sources", on page 6).
Note: If you select a reporting period out of these bounds, you will obtain a 'No data match the selected period' warning message. This behavior is normal and expected.
There is no limitation to
The number of Exchange servers you can report on,
The number of report templates you can use - all options being available, or
The number of databases you can create
during your 45-day evaluation period.
B - Installing the application
Note: Please make sure that your workstation complies with all points listed in "Workstation requirements", on page 11 before proceeding with the installation process.
1. Installing PROMODAG Reports a. Go to http://www.promodag.com to download PROMODAG Reports. b. Choose a temporary directory to store the installation package. c. Double-click the installation package to start the installation process. d. Simply follow the instructions of the Configuration Wizard.
2. Uninstalling PROMODAG Reports
In Control Panel, click Add/Remove Programs (or Programs and Features) to remove PROMODAG Reports from your computer.
The installation directory is located, by default, in %PROGRAMFILES%\Promodag\Reports10. It is removed when the software is uninstalled. The application parameters, on the other hand, are recorded in other directories that are not removed when PROMODAG Reports is uninstalled or upgraded.
For more information about default paths for installation and settings, see the help file.

C - Upgrading to a new version
1. Presentation
In the version number of the software, the first number indicates a major version, for example version x. The number after the major version indicates a minor version, for example, version x.y. Finally, the last numbers indicate the build, for example x.y.zzzz.
A summary of changes and corrections implemented in the latest packages is available from the Support page of our website (see Change log).
2. How to obtain a newer version of the software
On the Help menu, point to Check for Updates in order to download and run the latest available cumulated update, or download the latest package from the Downloads page of our website.
To read more about the upgrade process, see the help file.
D - Initial setup
1. Selecting the right database format
What is that database for?
PROMODAG Reports requires a database in order to store the data it collects from native Exchange data sources . It will then use this data to generate reports. It is possible to create multiple databases.
Supported database types
The database must be created using PROMODAG Reports because of its specific structure . The product supports two different database management systems depending on the edition used in licensed or evaluation mode.
Microsoft Access
Best suited for small Exchange organization.
Usable with all editions of PROMODAG Reports.
The physical size limit set by Microsoft to Access 2000 database files is 2 GB (2,048 MB).
Installing Microsoft Access is not required.
No multi-user access.
The database file should be located on the same computer as PROMODAG Reports.
Microsoft SQL Server
Best suited for medium or large Exchange organization.
Requires the Enterprise edition of PROMODAG Reports.
The database size is only limited by disk space on the SQL Server.
An additional SQL Server license (not provided) may be required.
Multi-user access.
Performance is determined by the power of the SQL server.
Getting started with PROMODAG Reports 25
Note: SQL Server Express (2012, 2008 R2, 2008, 2005) may be used with PROMODAG Reports Enterprise edition; however, database size is limited depending on the version (10 GB for SQL Server 2008 R2/2012 Express and 4 GB for SQL Server 2005/2008 Express).
2. Starting the application
From the Start Menu, select Programs > Promodag > PROMODAG Reports 10 to start PROMODAG Reports.
Note: If UAC is enabled on the PROMODAG workstation, we recommend to run the application as Administrator.
You will first be prompted to select the type of Exchange organization you wish to analyze.
The configuration wizard provides a user-friendly interface to start with PROMODAG Reports. It automatically appears when the database is empty, and guides you through the first configuration of the product.
It provides you with instructions on:
1. Creating a new PROMODAG Reports database, 2. Establishing a connection to the directory, 3. Establishing a connection to Office 365 if applicable, 4. Selecting data sources to import depending on the reports you need:
a. Message tracking files, b. Internet Information Services log files, c. Storage size:
Mailbox size,
Database size,
Mailbox count per database,
Public folder size, 5. Starting the data import process.
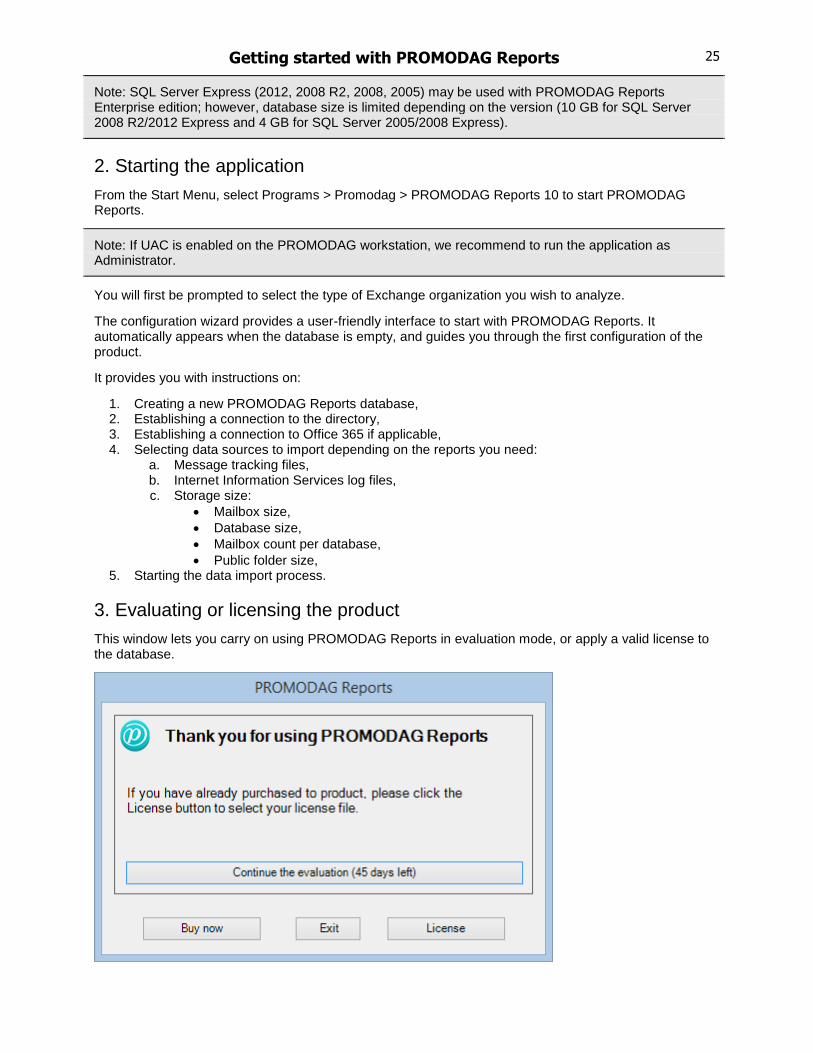
3. Evaluating or licensing the product
This window lets you carry on using PROMODAG Reports in evaluation mode, or apply a valid license to the database.
26 Getting started with PROMODAG Reports
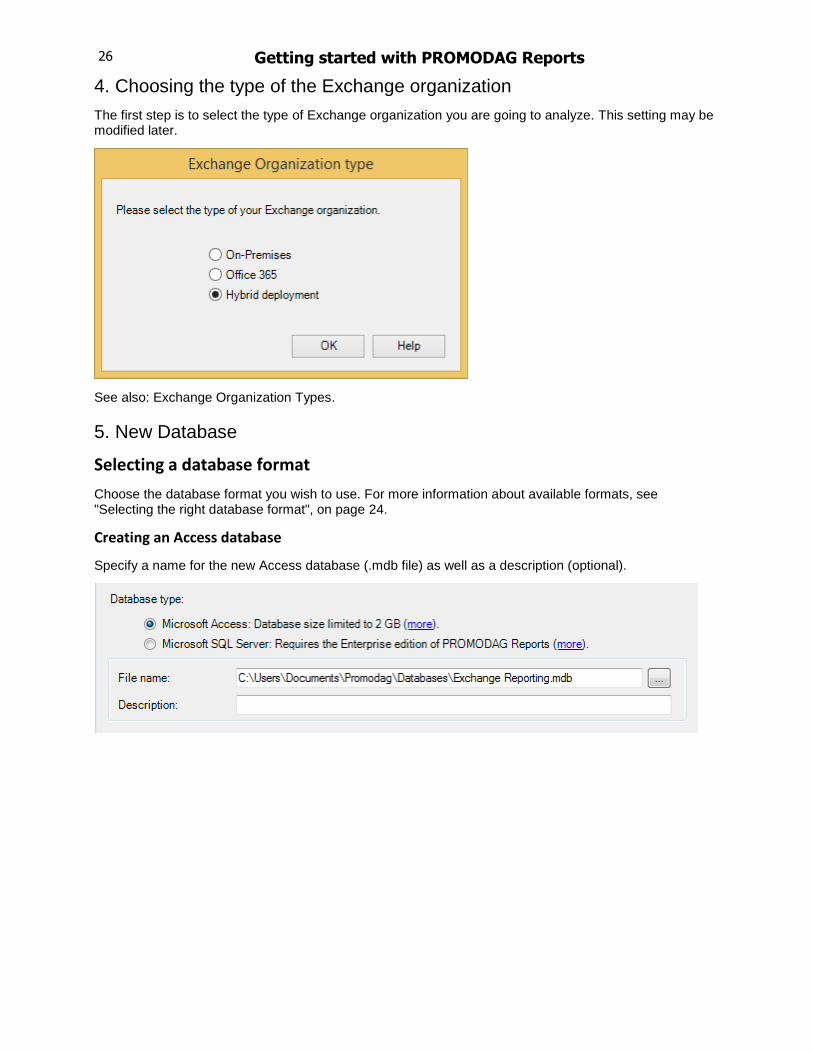
4. Choosing the type of the Exchange organization
The first step is to select the type of Exchange organization you are going to analyze. This setting may be modified later.
See also: Exchange Organization Types.
5. New Database
Selecting a database format
Choose the database format you wish to use. For more information about available formats, see "Selecting the right database format", on page 24.
Creating an Access database
Specify a name for the new Access database (.mdb file) as well as a description (optional).
Getting started with PROMODAG Reports 27
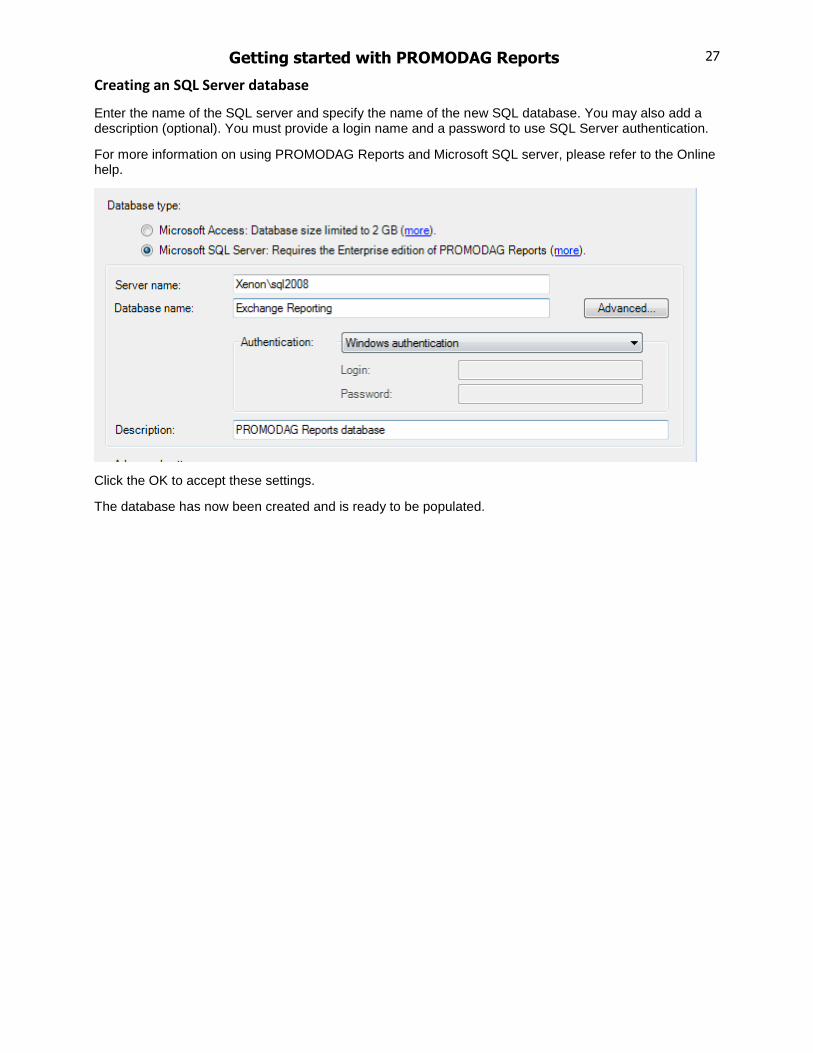
Creating an SQL Server database
Enter the name of the SQL server and specify the name of the new SQL database. You may also add a description (optional). You must provide a login name and a password to use SQL Server authentication.
For more information on using PROMODAG Reports and Microsoft SQL server, please refer to the Online help.
Click the OK to accept these settings.
The database has now been created and is ready to be populated.

28 Getting started with PROMODAG Reports
6. Configuring a connection to the directory
Note: This step only appears if you have chosen to analyze a type of organization that requires a connection to the directory, that is 'On-premises' or 'Hybrid deployment '.
PROMODAG Reports attempts to automatically discover a Global Catalog server, and then to establish a connection using LDAP.
The product needs specific permissions to connect to the directory in order to retrieve the structure of the Exchange organization, and all Exchange-related objects. Click the Next button to confirm your settings and move on to the next step.
Option Description
Global Catalog server Enter the name of the Global Catalog server. It will be used to import the
directory.
Click this button to retrieve automatically the name of a Global Catalog server.
Current account Check this radio button if the account you used to log in has sufficient
permissions to access the directory.
Specific account Check this radio button to specify an administrative account with the
permissions required to access the directory.
Check connection Click this link to test the LDAP connection to the Global Catalog server.

Getting started with PROMODAG Reports 29
7. Configuring a connection to Office 365
Note: This step only appears if you have chosen to analyze a type of organization that requires a connection to Office 365, that is 'Office 365' or 'Hybrid deployment '.
Enter the credentials of a Billing or Service admin account in Office 365. This will let PROMODAG Reports discover and import all Office 365 recipients into the database.
For more information about the requested permissions, see "Configuring the directory data source ", on page 14.
Click the Next button to confirm your settings and move on to the next step.

30 Getting started with PROMODAG Reports
8. Configuring the data source for traffic reports
PROMODAG Reports will use this data source to generate traffic reports. Select the servers whose message tracking files will be imported. The default date range covers the last 7 days.
You may specify the period to be imported:
Import from: Date of the first message tracking file to import.
To: Date of the last message tracking file to import.
Click the Next button to confirm your settings and move on to the next page. The location of message tracking files will be tested on each selected server.

Getting started with PROMODAG Reports 31
9. Configuring the data source for OWA and ActiveSync reports
PROMODAG Reports will use this data source to generate OWA and ActiveSync reports. Select the servers whose IIS log files will be imported. The default date range covers the last 7 days.
You may specify the period to be imported:
Import from: Date of the first message tracking file to import.
To: Date of the last message tracking file to import.
Click the Next button to confirm your settings and move on to the next page. The location of IIS log files will be tested on each selected server.

32 Getting started with PROMODAG Reports
10. Configuring the data source for storage size reports
PROMODAG Reports will use this data source to generate storage size reports. Select the servers whose storage size (mailbox and public folder size, Exchange database size) will be imported.
Click the Next button to confirm your settings and move on to the next page. The location of mailbox and public folder databases will be tested on each selected server.
The following storage size data can be selected for each server:
Storage size data Description
Mailbox size Import the size and item count for mailboxes hosted on the selected servers.
Database size Import the size of Exchange databases (.edb files and transaction log files) found
on the selected servers.
Note: This type of data is not imported from Office 365.
Mailbox count per
database
Import the mailbox count for mailboxes hosted on the selected servers.
Public folder size Import the size and item count for public folders hosted on the selected servers.

Getting started with PROMODAG Reports 33
11. Finalizing the configuration
The next step is also the last one. There is generally no need to run this wizard again: you will be able to directly modify in PROMODAG Reports the options you selected in the Configuration Wizard.
For more information about these options, please refer to our Online help.
Processing imports
Click the Finish button to start importing data. The complete process includes all previously configured steps, and can take some time depending on your selections.
Note: Import options may be saved in a batch file, so that the import process can be automated and scheduled at your convenience. See "Automating and scheduling the collection of data and other actions ", on page 41.
PROMODAG Reports
1. Imports recipients from the directory/Office 365, 2. Creates message tracking files (Office 365), 3. Imports message tracking data, 4. Imports IIS data, 5. Imports storage size data.
Each operation finishes off by displaying an operation report dialog box. A trace file is also recorded and can be used to troubleshoot possible errors or resolve various configuration issues. If you need to do so, use the Consult Trace Files option to view the content of the last trace files.
E - Running your first report
To illustrate the configuration method of a report, we are now going to run a sample report and try to address the following question: Who sent the most messages to Internet last week?
Our detailed requirements are to analyze last week's email Internet traffic for all mailboxes in our organization, and to get a report showing the top 5 senders, by number of sent messages, by department in our company.
1. Setting up the report:
Activity level of a group of mailboxes in a given period can be analyzed with to the Mailbox by Traffic Level report template. This template uses message tracking files imported into the database as data source.
Under the Templates menu, select Mailbox Traffic and then Mailbox by Traffic Level to open the report template option dialog box.
This dialog box includes a variety of tabs. Many of them are common to all reports. We are going to review them one by one and configure them in order to obtain the report that meets our requirements.
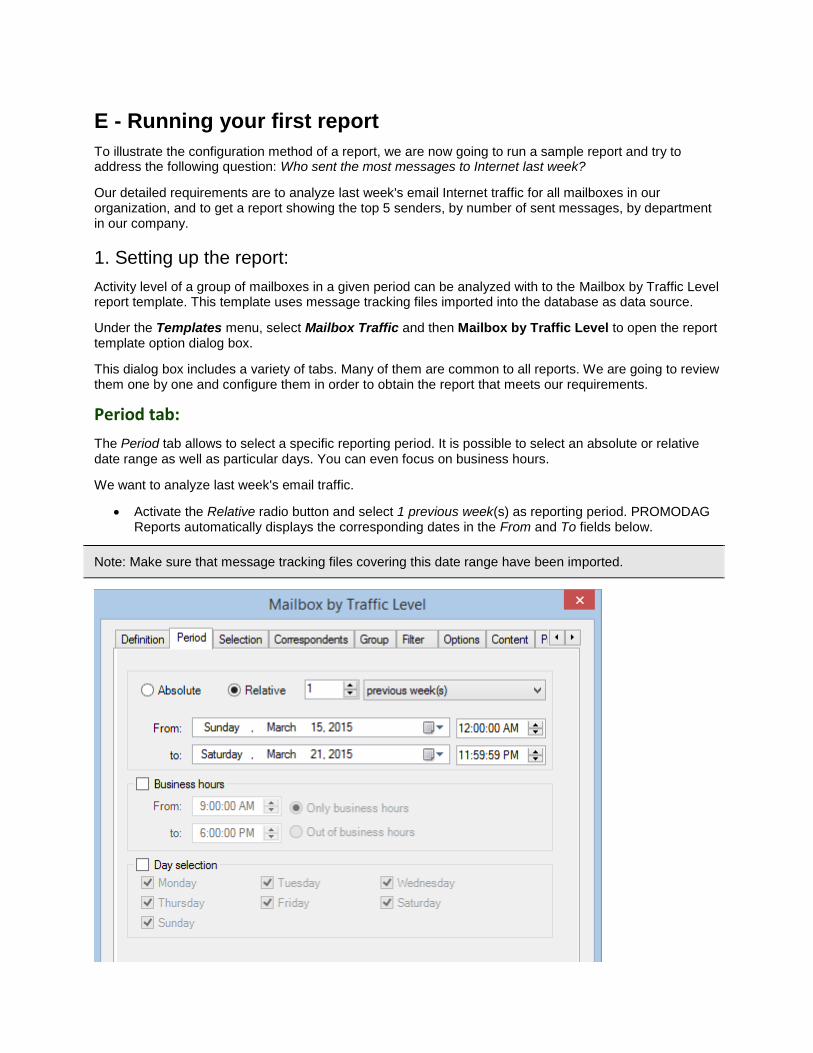
Period tab:
The Period tab allows to select a specific reporting period. It is possible to select an absolute or relative date range as well as particular days. You can even focus on business hours.
We want to analyze last week's email traffic.
Activate the Relative radio button and select 1 previous week(s) as reporting period. PROMODAG Reports automatically displays the corresponding dates in the From and To fields below.
Note: Make sure that message tracking files covering this date range have been imported.

Getting started with PROMODAG Reports 35
Selection tab:
The Selection tab allows to select the group of directory objects (mailboxes, public folders, servers...) on which PROMODAG Reports is going to report. For example, mailboxes can be selected using common AD attributes such as Company, Department or OU.
We are going to analyze the whole of our Exchange organization's mailbox traffic.
Select 'Mailbox' as recipient type and activate the All recipients of the selected types radio button.
Correspondents tab:
Use the Correspondents tab to select correspondents by address type, such as Administrative group (that is: internal traffic) or Internet domain (that is: external traffic).
We are interested, in this particular case, in displaying outbound message traffic (to Internet).
Activate the Some types radio button, then limit the address types to Internet messages only by selecting Internet domain like * in the selection grid.
36 Getting started with PROMODAG Reports
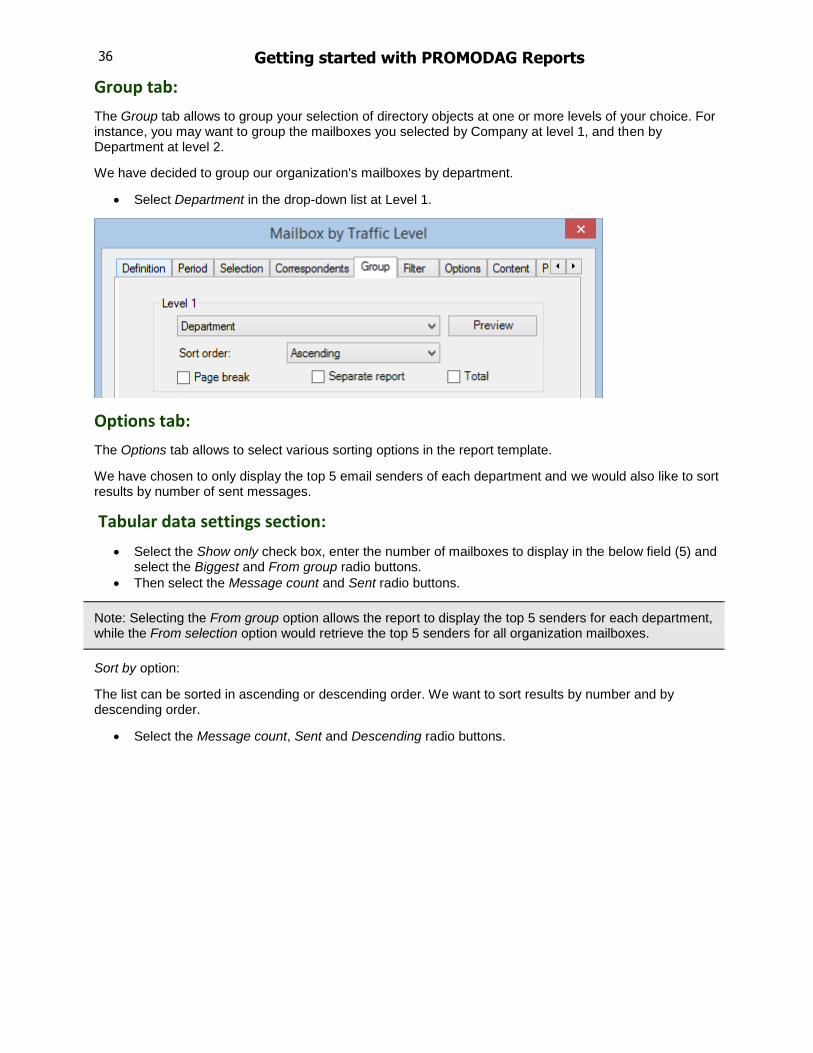
Group tab:
The Group tab allows to group your selection of directory objects at one or more levels of your choice. For instance, you may want to group the mailboxes you selected by Company at level 1, and then by Department at level 2.
We have decided to group our organization's mailboxes by department.
Select Department in the drop-down list at Level 1.
Options tab:
The Options tab allows to select various sorting options in the report template.
We have chosen to only display the top 5 email senders of each department and we would also like to sort results by number of sent messages.
Tabular data settings section:
Select the Show only check box, enter the number of mailboxes to display in the below field (5) and select the Biggest and From group radio buttons.
Then select the Message count and Sent radio buttons.
Note: Selecting the From group option allows the report to display the top 5 senders for each department, while the From selection option would retrieve the top 5 senders for all organization mailboxes.
Sort by option:
The list can be sorted in ascending or descending order. We want to sort results by number and by descending order.
Select the Message count, Sent and Descending radio buttons.
Getting started with PROMODAG Reports 37
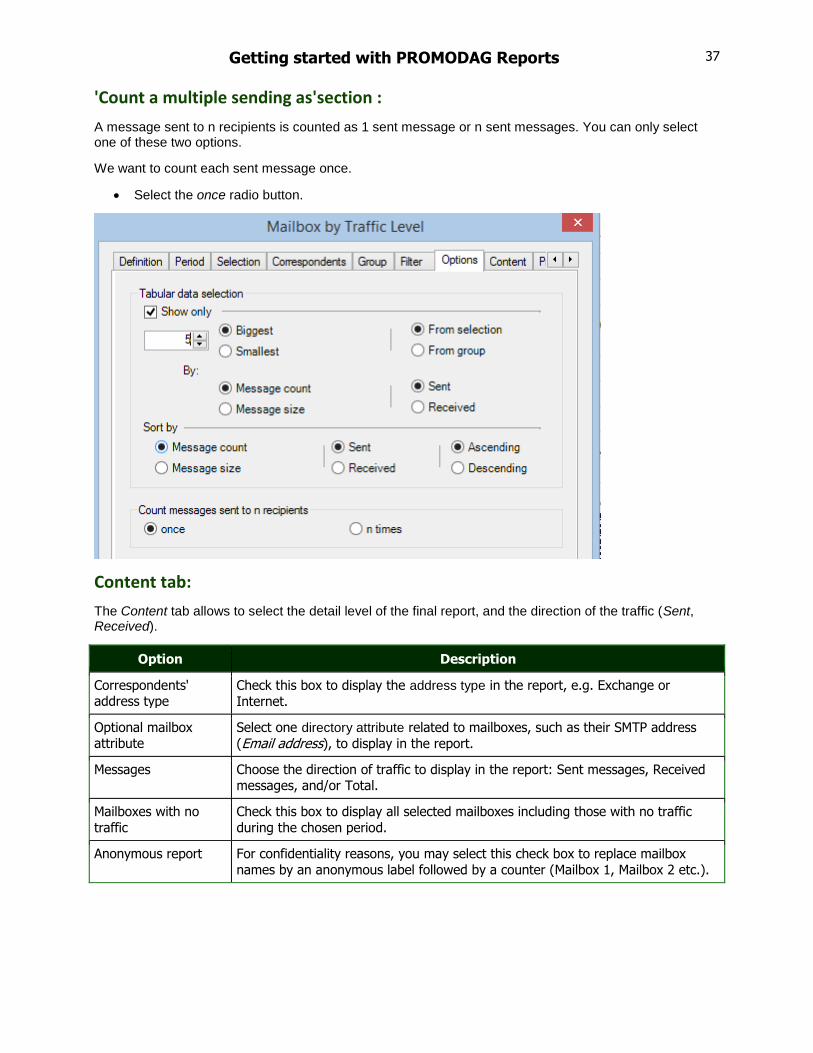
'Count a multiple sending as'section :
A message sent to n recipients is counted as 1 sent message or n sent messages. You can only select one of these two options.
We want to count each sent message once.
Select the once radio button.
Content tab:
The Content tab allows to select the detail level of the final report, and the direction of the traffic (Sent, Received).
Option Description
Correspondents' address type
Check this box to display the address type in the report, e.g. Exchange or
Internet.
Optional mailbox attribute
Select one directory attribute related to mailboxes, such as their SMTP address
(Email address), to display in the report.
Messages Choose the direction of traffic to display in the report: Sent messages, Received messages, and/or Total.
Mailboxes with no
traffic
Check this box to display all selected mailboxes including those with no traffic
during the chosen period.
Anonymous report For confidentiality reasons, you may select this check box to replace mailbox
names by an anonymous label followed by a counter (Mailbox 1, Mailbox 2 etc.).

38 Getting started with PROMODAG Reports
We only want to display sent messages.
Select the Sent check box.
Output tab:
The Output tab allows to choose the output destination and the format of your report.
Reports can be displayed on screen or exported under various formats.
We wish to output this report to screen.
Select Screen in the Destination drop-down list.
Note: Should you need to automate a report by including it in a batch file, you will have to select another destination than Screen in the Output tab, e.g. Disk file or Email recipient. Screen output is not available for automated reports.
Getting started with PROMODAG Reports 39
2. Generating the report:
Once all report options have been set, click the OK button to generate the report. PROMODAG Reports retrieves the information it needs in the database and queries it to produce the requested report. The report appears in a preview window.
This report displays the top 5 senders to Internet by department sorted by number of messages sent.
This previewed report can be printed or reloaded ( or buttons), but also exported or saved for later use.
3. Exporting the report
Click the button to export the report (or use the File > Export Report option).
Reports may be exported under various destinations (disk file, email recipient, Exchange folder or SharePoint), and under different formats (RPT, CSV, XLS, HTM, PDF, RTF or MHT).
For more information about file destinations and formats, see our Online help.
4. Saving the report
Click the button to save your report options in a file, or to save a 'snapshot' of your report.
Save Report Options
Select Save Report Options to save your options in a file.
A PROMODAG Report options file is a text file containing options for a custom report. Report options files contain a whole set of options for a given report, e.g. date, server, sorting order... The report option file extension is .pro.
This file can be
reused in a batch file - provided the destination selected in the Output tab is not Screen - if you should need to automate and schedule report generation (for more information, please refer to "Automating and scheduling the generation of reports", on page 47),
or saved in the Favorites menu.
The Favorites menu
This menu lists custom reports options files (or favorites) delivered as samples with the product.
These canned reports are organized in four categories:
Capacity Planning and Exchange Migration,
Chargeback,
Compliance,
Traffic Analysis and SLA Reporting.
Each of these favorites answers a question, for example: How many messages were sent to Internet in the last 7 days in the Traffic Analysis and SLA Reporting group.
You can add new entries to this menu yourself by selecting the Add to Favorites menu option when saving your custom reports, or even add your own categories by creating new sub-folders into the \Batches folder. For more information about custom reports, see Saving custom reports.
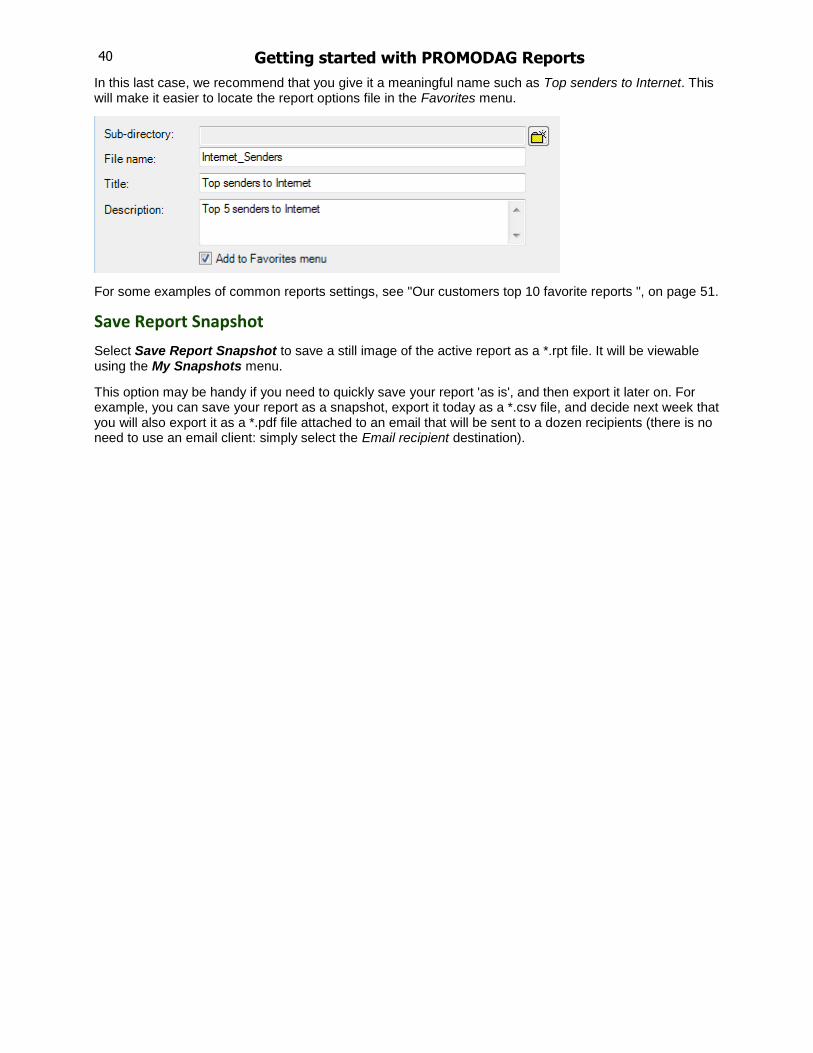
40 Getting started with PROMODAG Reports
In this last case, we recommend that you give it a meaningful name such as Top senders to Internet. This will make it easier to locate the report options file in the Favorites menu.
For some examples of common reports settings, see "Our customers top 10 favorite reports ", on page 51.
Save Report Snapshot
Select Save Report Snapshot to save a still image of the active report as a *.rpt file. It will be viewable using the My Snapshots menu.
This option may be handy if you need to quickly save your report 'as is', and then export it later on. For example, you can save your report as a snapshot, export it today as a *.csv file, and decide next week that you will also export it as a *.pdf file attached to an email that will be sent to a dozen recipients (there is no need to use an email client: simply select the Email recipient destination).
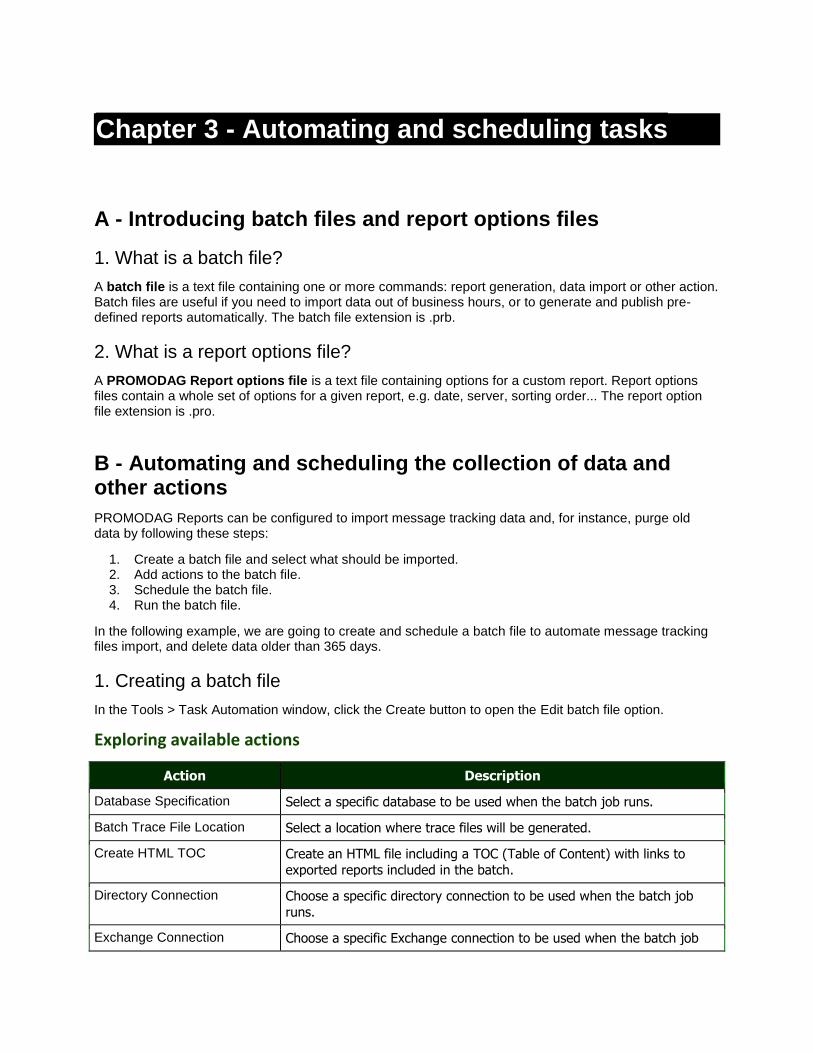
Chapter 3 - Automating and scheduling tasks
A - Introducing batch files and report options files
1. What is a batch file?
A batch file is a text file containing one or more commands: report generation, data import or other action. Batch files are useful if you need to import data out of business hours, or to generate and publish pre-defined reports automatically. The batch file extension is .prb.
2. What is a report options file?
A PROMODAG Report options file is a text file containing options for a custom report. Report options files contain a whole set of options for a given report, e.g. date, server, sorting order... The report option file extension is .pro.
B - Automating and scheduling the collection of data and other actions
PROMODAG Reports can be configured to import message tracking data and, for instance, purge old data by following these steps:
1. Create a batch file and select what should be imported. 2. Add actions to the batch file. 3. Schedule the batch file. 4. Run the batch file.
In the following example, we are going to create and schedule a batch file to automate message tracking files import, and delete data older than 365 days.
1. Creating a batch file
In the Tools > Task Automation window, click the Create button to open the Edit batch file option.
Exploring available actions
Action Description
Database Specification Select a specific database to be used when the batch job runs.
Batch Trace File Location Select a location where trace files will be generated.
Create HTML TOC Create an HTML file including a TOC (Table of Content) with links to
exported reports included in the batch.
Directory Connection Choose a specific directory connection to be used when the batch job
runs.
Exchange Connection Choose a specific Exchange connection to be used when the batch job

42 Getting started with PROMODAG Reports
Action Description
runs.
Purge Imported Data Purge old messages from the database.
Import Directory Data Import or update the directory.
Import Message Tracking Data
Import message tracking files.
Import IIS Data Import Internet Information Services log files.
Import Storage Size Data Import the size of mailboxes, public folders, Exchange databases and the mailbox count per Exchange database.
Create Office 365 Message Tracking Files
Create message tracking files by exporting data from Office 365.
Compact database Compact or shrink the database to reclaim unused disk space.

Getting started with PROMODAG Reports 43
2. Adding actions to the batch file
Select Import Message Tracking Data in the Actions tree, then click the button. The default settings will import messages tracking files for the selected servers from the last import date up to yesterday.
Click OK to apply your changes.
Note: By default, actions will be carried out on the last database opened, unless you specify which database must be used (action: Database specification).
You may decide that you only need one year of message tracking files in your database. PROMODAG Reports is able to clear automatically obsolete data.
Select Purge Message Tracking Data in the Actions tree, then click the button.
Select the server name to specify from which server(s) data must be cleared, and click the button to move it to the right pane - you can also double-click the server name. Data will then be deleted from all servers listed in the Selected server(s) pane.
Select the period to clear, and the type of data to remove. In this example, we chose to delete message tracking files and Internet Information Services files imported before the last 365 days.
Click OK to apply your changes.

44 Getting started with PROMODAG Reports
Finally, click the Save button to save your batch file. It is recommended to give it a meaningful name, for example Daily_Data_Import. Click OK to return to the Task Automation window.

Getting started with PROMODAG Reports 45
3. Scheduling the batch file
In the Task Automation window, select the batch you have just created and open the Schedule task option. In this example, we want to schedule the batch file 'Daily_Data_Import.prb'.
Click the Schedule button.
Select the scheduling options of your choice.
Click OK to create a new scheduled task and return to the Task Automation window.
46 Getting started with PROMODAG Reports
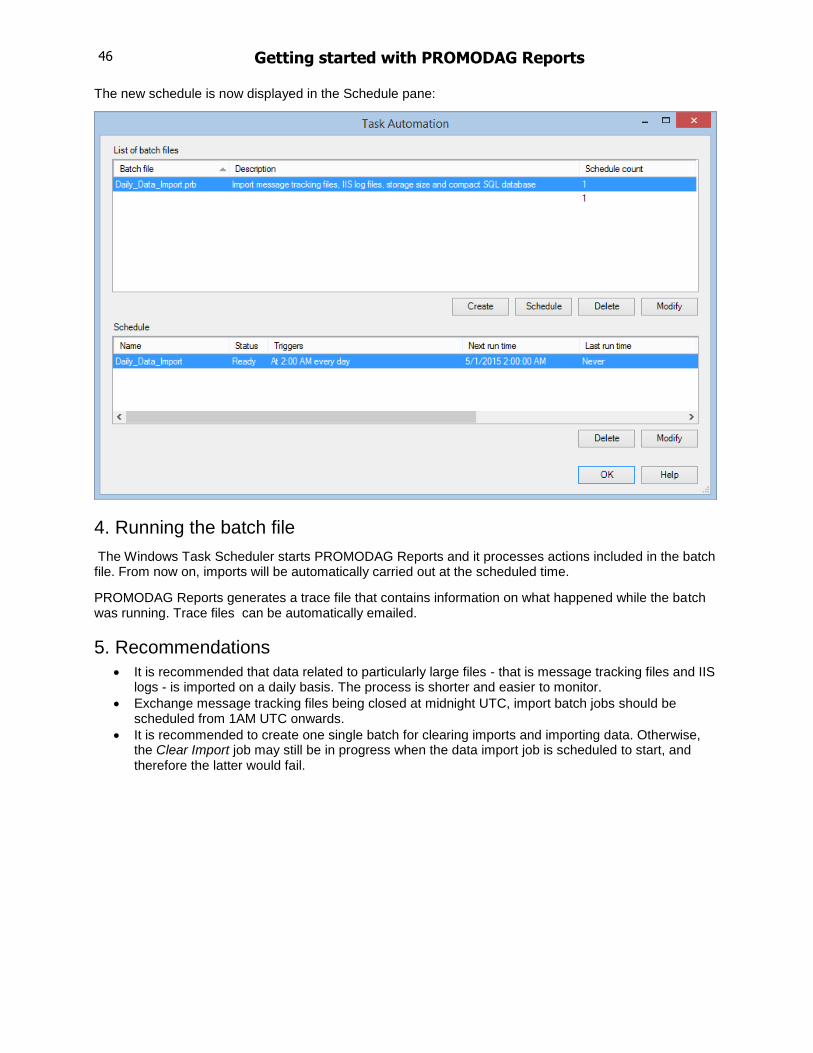
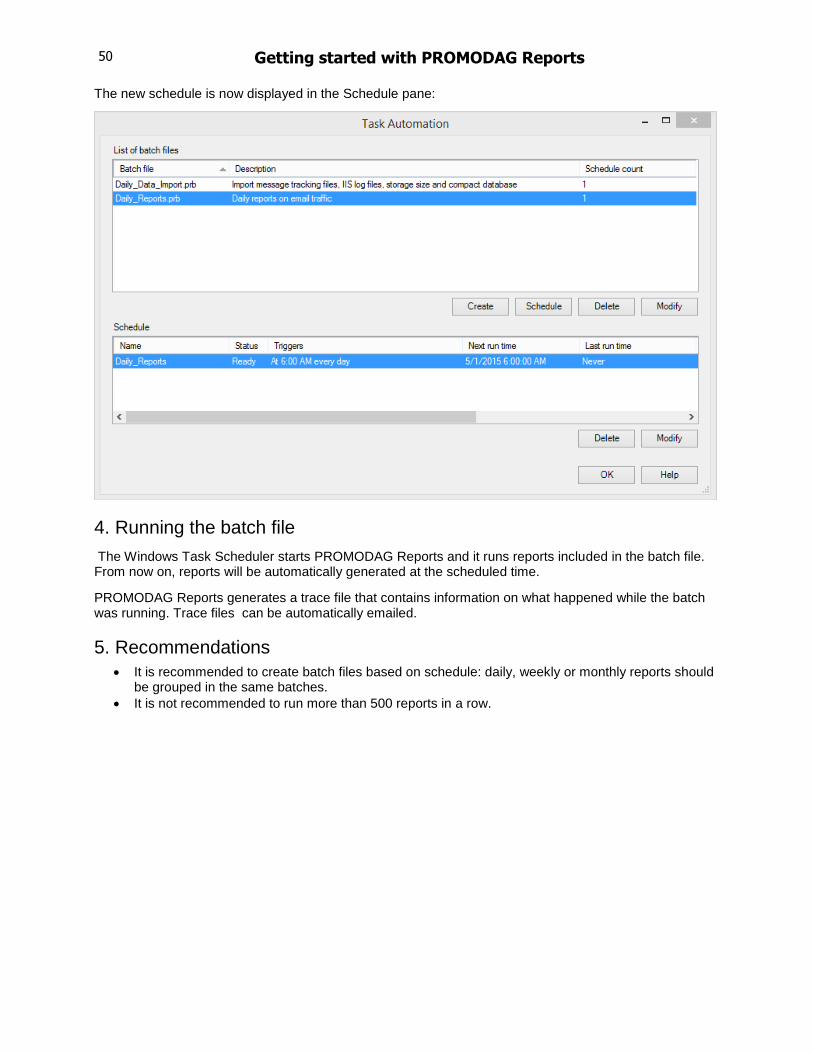
The new schedule is now displayed in the Schedule pane:
4. Running the batch file
The Windows Task Scheduler starts PROMODAG Reports and it processes actions included in the batch file. From now on, imports will be automatically carried out at the scheduled time.
PROMODAG Reports generates a trace file that contains information on what happened while the batch was running. Trace files can be automatically emailed.
5. Recommendations
It is recommended that data related to particularly large files - that is message tracking files and IIS logs - is imported on a daily basis. The process is shorter and easier to monitor.
Exchange message tracking files being closed at midnight UTC, import batch jobs should be scheduled from 1AM UTC onwards.
It is recommended to create one single batch for clearing imports and importing data. Otherwise, the Clear Import job may still be in progress when the data import job is scheduled to start, and therefore the latter would fail.
Getting started with PROMODAG Reports 47
C - Automating and scheduling the generation of reports
PROMODAG Reports can be configured to generate reports automatically by following these steps:
1. Create one or more custom report(s). 2. Create a batch file and add one or more of these custom report(s). 3. Schedule the batch file. 4. Run the batch file.
In the following example, we are going to create and schedule a batch file to automate the Mailbox by Traffic Level report we have learned to set up earlier (see "Running your first report", on page 34).
1. Creating a report options file
See the Save Report section above to review the method of creating report options files.
Note: Should you need to automate a report by including it in a batch file, you will have to select another destination than Screen in the Output tab, e.g. Disk file or Email recipient. Screen output is not available for automated reports.
2. Creating a batch file
In the Task Automation window, click the Create button to open the Edit batch file option.
Exploring the list of available reports
The lower part of the left pane of the Edit batch file window lists all custom reports available in the application.
Locate the Mailbox by Traffic Level report in the Available reports list.
Templates are sorted in the same order as in the Templates menu. Therefore, you will find Mailbox by Traffic Level in the Mailbox Traffic folder.

48 Getting started with PROMODAG Reports
Adding the Mailbox by Traffic Level report
Select the report options file entitled Top Internet senders and click the button to insert it into the right pane.
Finally, click the Save button to save your batch file.

Getting started with PROMODAG Reports 49
3. Scheduling the batch file
In the Task Automation window, select the batch you have just created and open the Schedule option. In this example, we want to schedule DailyReports.prb.
Click the Schedule button.
Select the scheduling options of your choice.
Click OK to create a new scheduled task and return to the Task Automation window.
50 Getting started with PROMODAG Reports
The new schedule is now displayed in the Schedule pane:
4. Running the batch file
The Windows Task Scheduler starts PROMODAG Reports and it runs reports included in the batch file. From now on, reports will be automatically generated at the scheduled time.
PROMODAG Reports generates a trace file that contains information on what happened while the batch was running. Trace files can be automatically emailed.
5. Recommendations
It is recommended to create batch files based on schedule: daily, weekly or monthly reports should be grouped in the same batches.
It is not recommended to run more than 500 reports in a row.

Getting started with PROMODAG Reports 51
Our customers top 10 favorite reports
The following pages describe in detail the settings of the ten reports that PROMODAG Reports users have requested the most so far.
Each table include an usage description of the report option file, its corresponding entry in the Favorites menu, its corresponding report template in the Templates menu, and eventually a tab-by-tab list of options to apply.
For more information on favorites, please refer to the following topic: Running your first report: Mailbox by Traffic Level.
1 - What is the mailbox breakdown by size?
Description: This report displays the distribution of mailboxes by size today.
Favorite: Capacity Planning and Exchange Migration > What is the mailbox breakdown by
size?
Report template: Storage > Mailbox Breakdown by Size
Options used:
Selection tab: All organization mailboxes
Group tab: Level 1: No grouping
Intervals tab: Define intervals: Size, Less than: 100 KB, 1 MB, 5 MB, 10 MB, 50 MB, 100 MB
Content tab: Include: Selected mailboxes and their archives, Separate
Presentation tab: Title: Breakdown of mailboxes by size on <Now|%M/%D/YYYY>; Display: 3D
graph; Size in MB: MegaBytes Output tab: Destination: Screen
2 - Do users empty their Deleted items folder? [dynamic]
Description: This report displays the item count and size in \Deleted items folders at the time when
the report was generated.
Favorite: Capacity Planning and Exchange Migration > Do users empty their Deleted items folder? [dynamic]
Report
template:
Mailbox Content > Mailbox Folder Size
Options used:
Selection tab: All organization mailboxes
Group tab: Level 1: No grouping
Folders tab: Sub-folders: selected; Deleted items (item count > 0)
Filter tab: Not used
Compose for tab: Not used
Content tab: Include: Selected mailboxes and their archives, Separate; Detail level: Mailbox
Presentation tab: Size in MB: MegaBytes
Output tab: Destination: Screen
52 Getting started with PROMODAG Reports
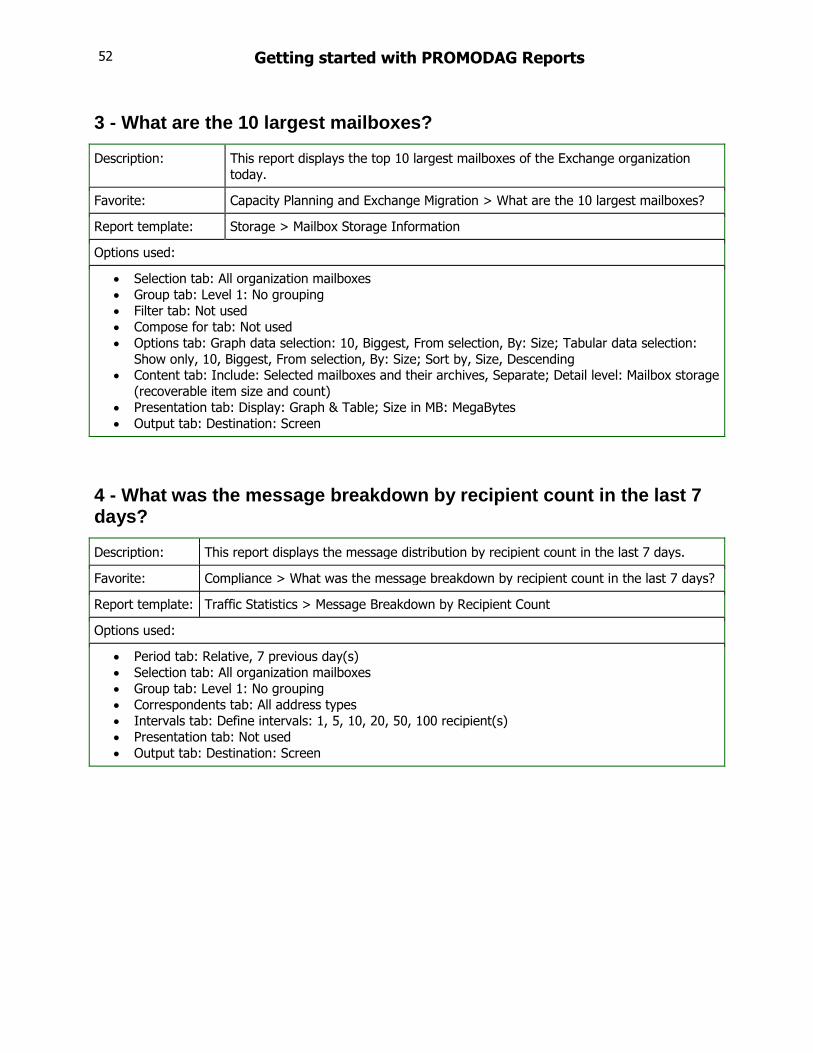
3 - What are the 10 largest mailboxes?
Description: This report displays the top 10 largest mailboxes of the Exchange organization
today.
Favorite: Capacity Planning and Exchange Migration > What are the 10 largest mailboxes?
Report template: Storage > Mailbox Storage Information
Options used:
Selection tab: All organization mailboxes
Group tab: Level 1: No grouping
Filter tab: Not used
Compose for tab: Not used
Options tab: Graph data selection: 10, Biggest, From selection, By: Size; Tabular data selection:
Show only, 10, Biggest, From selection, By: Size; Sort by, Size, Descending Content tab: Include: Selected mailboxes and their archives, Separate; Detail level: Mailbox storage
(recoverable item size and count)
Presentation tab: Display: Graph & Table; Size in MB: MegaBytes
Output tab: Destination: Screen
4 - What was the message breakdown by recipient count in the last 7 days?
Description: This report displays the message distribution by recipient count in the last 7 days.
Favorite: Compliance > What was the message breakdown by recipient count in the last 7 days?
Report template: Traffic Statistics > Message Breakdown by Recipient Count
Options used:
Period tab: Relative, 7 previous day(s)
Selection tab: All organization mailboxes
Group tab: Level 1: No grouping
Correspondents tab: All address types
Intervals tab: Define intervals: 1, 5, 10, 20, 50, 100 recipient(s)
Presentation tab: Not used
Output tab: Destination: Screen
Getting started with PROMODAG Reports 53
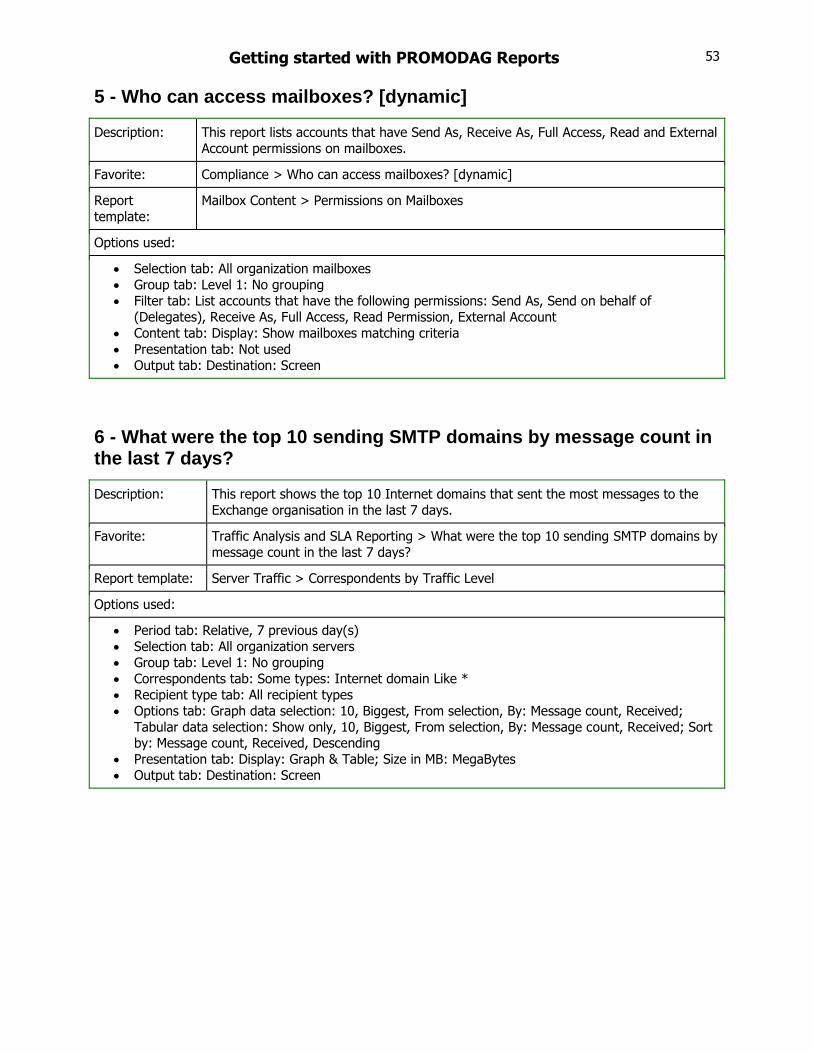
5 - Who can access mailboxes? [dynamic]
Description: This report lists accounts that have Send As, Receive As, Full Access, Read and External
Account permissions on mailboxes.
Favorite: Compliance > Who can access mailboxes? [dynamic]
Report
template:
Mailbox Content > Permissions on Mailboxes
Options used:
Selection tab: All organization mailboxes
Group tab: Level 1: No grouping
Filter tab: List accounts that have the following permissions: Send As, Send on behalf of
(Delegates), Receive As, Full Access, Read Permission, External Account
Content tab: Display: Show mailboxes matching criteria
Presentation tab: Not used
Output tab: Destination: Screen
6 - What were the top 10 sending SMTP domains by message count in the last 7 days?
Description: This report shows the top 10 Internet domains that sent the most messages to the
Exchange organisation in the last 7 days.
Favorite: Traffic Analysis and SLA Reporting > What were the top 10 sending SMTP domains by
message count in the last 7 days?
Report template: Server Traffic > Correspondents by Traffic Level
Options used:
Period tab: Relative, 7 previous day(s)
Selection tab: All organization servers
Group tab: Level 1: No grouping
Correspondents tab: Some types: Internet domain Like *
Recipient type tab: All recipient types
Options tab: Graph data selection: 10, Biggest, From selection, By: Message count, Received;
Tabular data selection: Show only, 10, Biggest, From selection, By: Message count, Received; Sort by: Message count, Received, Descending
Presentation tab: Display: Graph & Table; Size in MB: MegaBytes
Output tab: Destination: Screen

54 Getting started with PROMODAG Reports
7 - How did internal traffic compare with Internet traffic for the last 7 days?
Description: This report shows the respective parts of internal traffic (with Exchange) and external traffic (with Internet) in the last 7 days.
Favorite: Traffic Analysis and SLA Reporting > How did internal traffic compare with Internet
traffic for the last 7 days?
Report
template:
Server Traffic > Server Traffic Comparison by Type
Options used:
Period tab: Relative, 7 previous day(s)
Selection tab: All organization servers
Group tab: Level 1: No grouping
Correspondents tab: Some types: Administrative group Like *, Internet domain Like *
Recipient type tab: All recipient types
Options tab: Count messages sent to n recipients: once
Content tab: Detail level: Correspondents' address type
Presentation tab: Display: Graph & Table; Size in MB: MegaBytes
Output tab: Destination: Screen
8 - What was the mailbox traffic growth in the last 7 days?
Description: This report displays a graph showing the growth of mailbox traffic, both in size and
message count, in the last 7 days.
Favorite: Traffic Analysis and SLA Reporting > What was the mailbox traffic growth in the last 7
days?
Report template:
Mailbox Traffic > Mailbox Traffic Growth
Options used:
Period tab: Relative, 7 previous day(s); Time interval: Day(s)
Selection tab: Recipient type: Mailbox; All recipients of the selected types
Group tab: Level 1: No grouping
Correspondents tab: All address types
Options tab: Count messages sent to n recipients; Assign sent on behalf of messages: To the
delegate's mailbox
Content tab: Messages: Sent, Received
Presentation tab: Graph type: Curve; Size in MB: MegaBytes
Output tab: Destination: Screen

Getting started with PROMODAG Reports 55
9 - What was the server traffic growth in the last 7 days?
Description: This report displays a graph showing the growth of server traffic, both in size and
message count, in the last 7 days.
Favorite: Traffic Analysis and SLA Reporting > What was the server traffic growth in the last 7
days?
Report template:
Server Traffic > Server Traffic Growth
Options used:
Period tab: Relative, 7 previous day(s); Time intervals: Day(s)
Selection tab: All organization servers
Group tab: Level 1: No grouping
Correspondents tab: All address types
Recipient type tab: All recipient types
Options tab: Count messages sent to n recipients: once
Content tab: Detail level: Total
Presentation tab: Graph type: Histogram; Size in MB: MegaBytes
Output tab: Destination: Screen
10 - Who were the top 10 email senders in the last 7 days?
Description: This report displays the top 10 mailboxes by sent messages in the last 7 days.
Favorite: Traffic Analysis and SLA Reporting > Who were the top 10 email senders in the
last 7 days?
Report template: Mailbox Traffic > Mailbox by Traffic Level
Options used:
Period tab: Relative, 7 previous day(s)
Selection tab: Recipient type: Mailbox; All recipients of the selected types
Group tab: Level 1: No grouping
Correspondents tab: All address types
Filter tab: Not used
Options tab: Tabular data selection: Show only, 10, Biggest, From selection, By: Message count,
Sent; Sort by: Message count, Sent, Descending; Count messages sent to n recipients: once;
Assign sent on behalf of messages: To the delegate's mailbox Content tab: Messages: Sent
Presentation tab: Size in MB: MegaBytes
Output tab: Destination: Screen
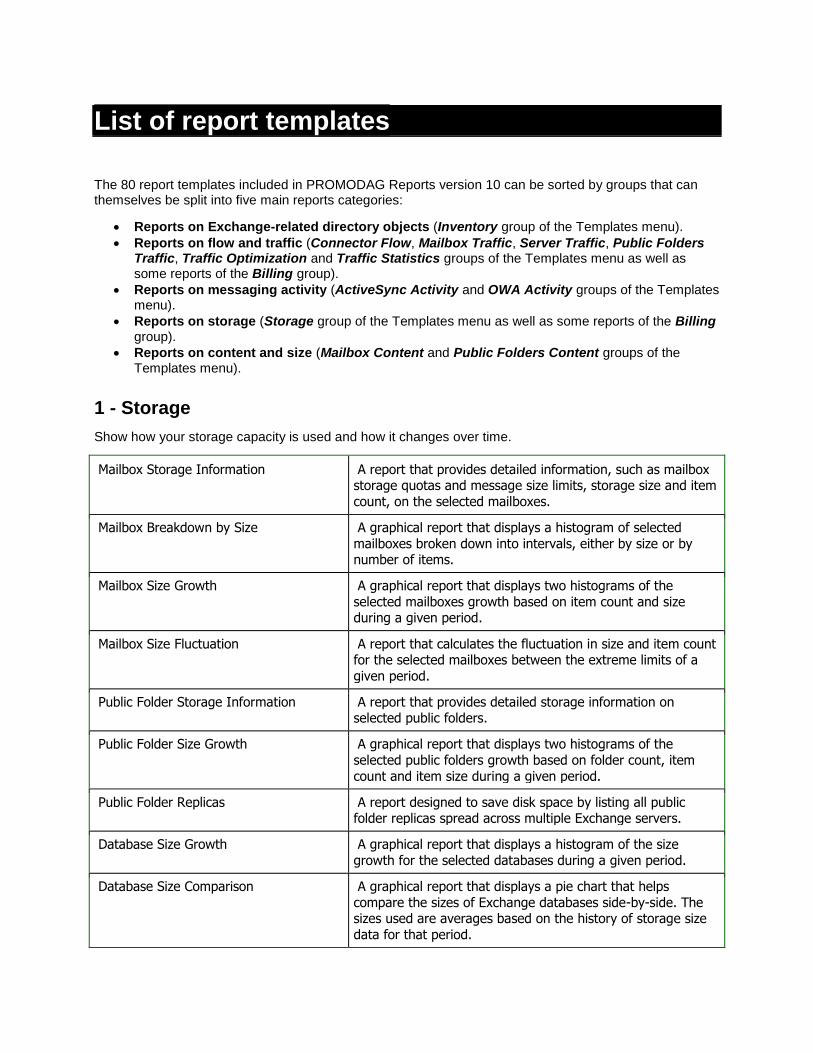
List of report templates
The 80 report templates included in PROMODAG Reports version 10 can be sorted by groups that can themselves be split into five main reports categories:
Reports on Exchange-related directory objects (Inventory group of the Templates menu).
Reports on flow and traffic (Connector Flow, Mailbox Traffic, Server Traffic, Public Folders Traffic, Traffic Optimization and Traffic Statistics groups of the Templates menu as well as some reports of the Billing group).
Reports on messaging activity (ActiveSync Activity and OWA Activity groups of the Templates menu).
Reports on storage (Storage group of the Templates menu as well as some reports of the Billing group).
Reports on content and size (Mailbox Content and Public Folders Content groups of the Templates menu).
1 - Storage
Show how your storage capacity is used and how it changes over time.
Mailbox Storage Information A report that provides detailed information, such as mailbox storage quotas and message size limits, storage size and item
count, on the selected mailboxes.
Mailbox Breakdown by Size A graphical report that displays a histogram of selected
mailboxes broken down into intervals, either by size or by number of items.
Mailbox Size Growth A graphical report that displays two histograms of the
selected mailboxes growth based on item count and size during a given period.
Mailbox Size Fluctuation A report that calculates the fluctuation in size and item count for the selected mailboxes between the extreme limits of a
given period.
Public Folder Storage Information A report that provides detailed storage information on selected public folders.
Public Folder Size Growth A graphical report that displays two histograms of the
selected public folders growth based on folder count, item
count and item size during a given period.
Public Folder Replicas A report designed to save disk space by listing all public folder replicas spread across multiple Exchange servers.
Database Size Growth A graphical report that displays a histogram of the size
growth for the selected databases during a given period.
Database Size Comparison A graphical report that displays a pie chart that helps
compare the sizes of Exchange databases side-by-side. The sizes used are averages based on the history of storage size
data for that period.

Getting started with PROMODAG Reports 57
2 - Inventory
List directory objects information.
Directory Objects A report that lists directory objects in a hierarchical
presentation.
Recipient Detail A report that displays the directory attributes of each
selected recipient.
Number of Recipients Grouped by Attributes
A report that counts mailboxes based on specific mailbox directory attributes.
Selected Attributes from Recipients A report that enables the choice of specific attributes related
to the selected recipients. Directory, traffic and storage
attributes are available for each recipient.
Distribution Groups A report that lists Exchange distribution groups and their members.
Recipients per SMTP Domain A report that lists, counts and groups recipients based on the
SMTP domain they belong to.
3 - Traffic Statistics
Get graphs showing traffic breakdown by days, hours, size of messages or number of recipients.
Mailbox Breakdown by Daily Traffic A graphical report that displays a histogram showing the
selected mailboxes broken down into intervals. Those intervals are based on the average count or size of the
messages that mailboxes sent or received over a given period of time.
Message Breakdown by Day of the Week A graphical report that displays a histogram showing the average count and size of messages per day of the week
during a given period.
Message Breakdown by Hour of the Day A graphical report that displays a line chart or a histogram showing the average message count and size per hour of the
day during a given period.
Message Breakdown by Size A graphical report that displays a histogram of messages
sent or received by selected mailboxes, broken down by size, during a given period.
Message Breakdown by Recipient Count A graphical report that displays a histogram of messages
sent or received by selected mailboxes, broken down by recipient count, during a given period.
Distribution Group Usage A report that shows the count and size of messages sent by internal users to distribution groups during a selected period.
Mail Contact Usage A report that shows the count and size of messages sent to
mail contacts during a selected period.
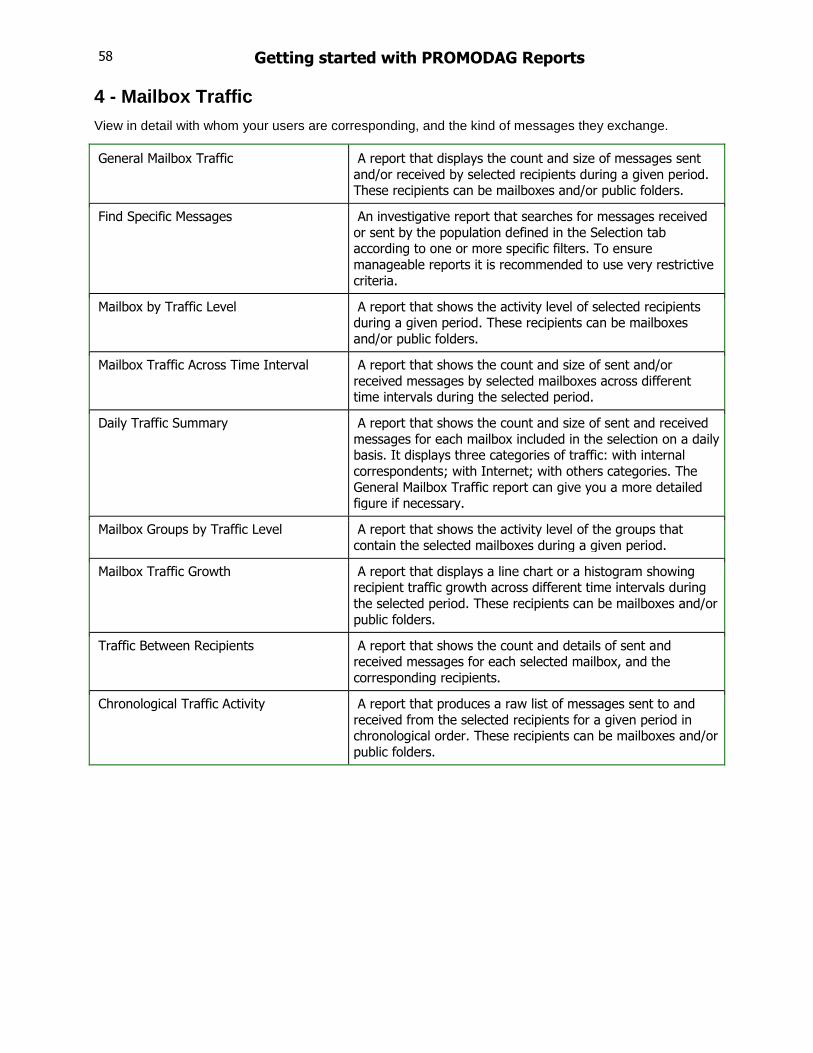
58 Getting started with PROMODAG Reports
4 - Mailbox Traffic
View in detail with whom your users are corresponding, and the kind of messages they exchange.
General Mailbox Traffic A report that displays the count and size of messages sent
and/or received by selected recipients during a given period. These recipients can be mailboxes and/or public folders.
Find Specific Messages An investigative report that searches for messages received
or sent by the population defined in the Selection tab according to one or more specific filters. To ensure
manageable reports it is recommended to use very restrictive
criteria.
Mailbox by Traffic Level A report that shows the activity level of selected recipients during a given period. These recipients can be mailboxes
and/or public folders.
Mailbox Traffic Across Time Interval A report that shows the count and size of sent and/or
received messages by selected mailboxes across different time intervals during the selected period.
Daily Traffic Summary A report that shows the count and size of sent and received
messages for each mailbox included in the selection on a daily basis. It displays three categories of traffic: with internal
correspondents; with Internet; with others categories. The
General Mailbox Traffic report can give you a more detailed figure if necessary.
Mailbox Groups by Traffic Level A report that shows the activity level of the groups that
contain the selected mailboxes during a given period.
Mailbox Traffic Growth A report that displays a line chart or a histogram showing recipient traffic growth across different time intervals during
the selected period. These recipients can be mailboxes and/or
public folders.
Traffic Between Recipients A report that shows the count and details of sent and received messages for each selected mailbox, and the
corresponding recipients.
Chronological Traffic Activity A report that produces a raw list of messages sent to and
received from the selected recipients for a given period in chronological order. These recipients can be mailboxes and/or
public folders.
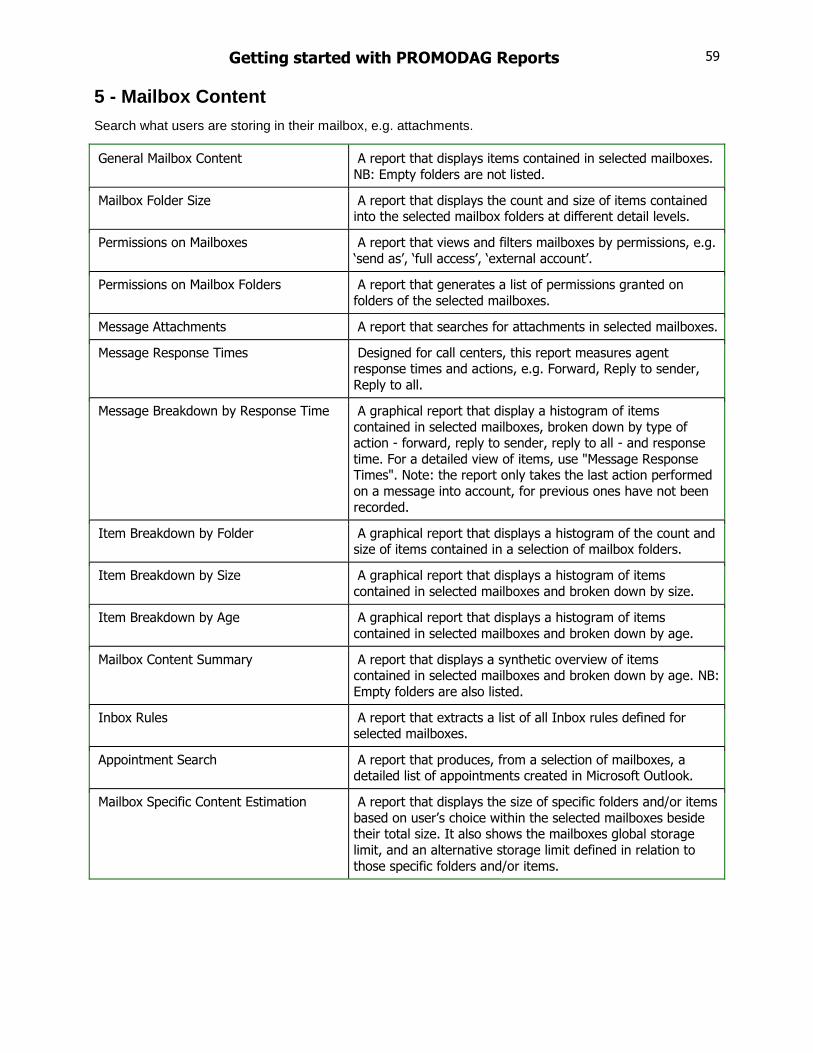
Getting started with PROMODAG Reports 59
5 - Mailbox Content
Search what users are storing in their mailbox, e.g. attachments.
General Mailbox Content A report that displays items contained in selected mailboxes.
NB: Empty folders are not listed.
Mailbox Folder Size A report that displays the count and size of items contained into the selected mailbox folders at different detail levels.
Permissions on Mailboxes A report that views and filters mailboxes by permissions, e.g.
‘send as’, ‘full access’, ‘external account’.
Permissions on Mailbox Folders A report that generates a list of permissions granted on
folders of the selected mailboxes.
Message Attachments A report that searches for attachments in selected mailboxes.
Message Response Times Designed for call centers, this report measures agent response times and actions, e.g. Forward, Reply to sender,
Reply to all.
Message Breakdown by Response Time A graphical report that display a histogram of items
contained in selected mailboxes, broken down by type of action - forward, reply to sender, reply to all - and response
time. For a detailed view of items, use "Message Response Times". Note: the report only takes the last action performed
on a message into account, for previous ones have not been
recorded.
Item Breakdown by Folder A graphical report that displays a histogram of the count and size of items contained in a selection of mailbox folders.
Item Breakdown by Size A graphical report that displays a histogram of items
contained in selected mailboxes and broken down by size.
Item Breakdown by Age A graphical report that displays a histogram of items
contained in selected mailboxes and broken down by age.
Mailbox Content Summary A report that displays a synthetic overview of items contained in selected mailboxes and broken down by age. NB:
Empty folders are also listed.
Inbox Rules A report that extracts a list of all Inbox rules defined for selected mailboxes.
Appointment Search A report that produces, from a selection of mailboxes, a detailed list of appointments created in Microsoft Outlook.
Mailbox Specific Content Estimation A report that displays the size of specific folders and/or items
based on user’s choice within the selected mailboxes beside their total size. It also shows the mailboxes global storage
limit, and an alternative storage limit defined in relation to
those specific folders and/or items.
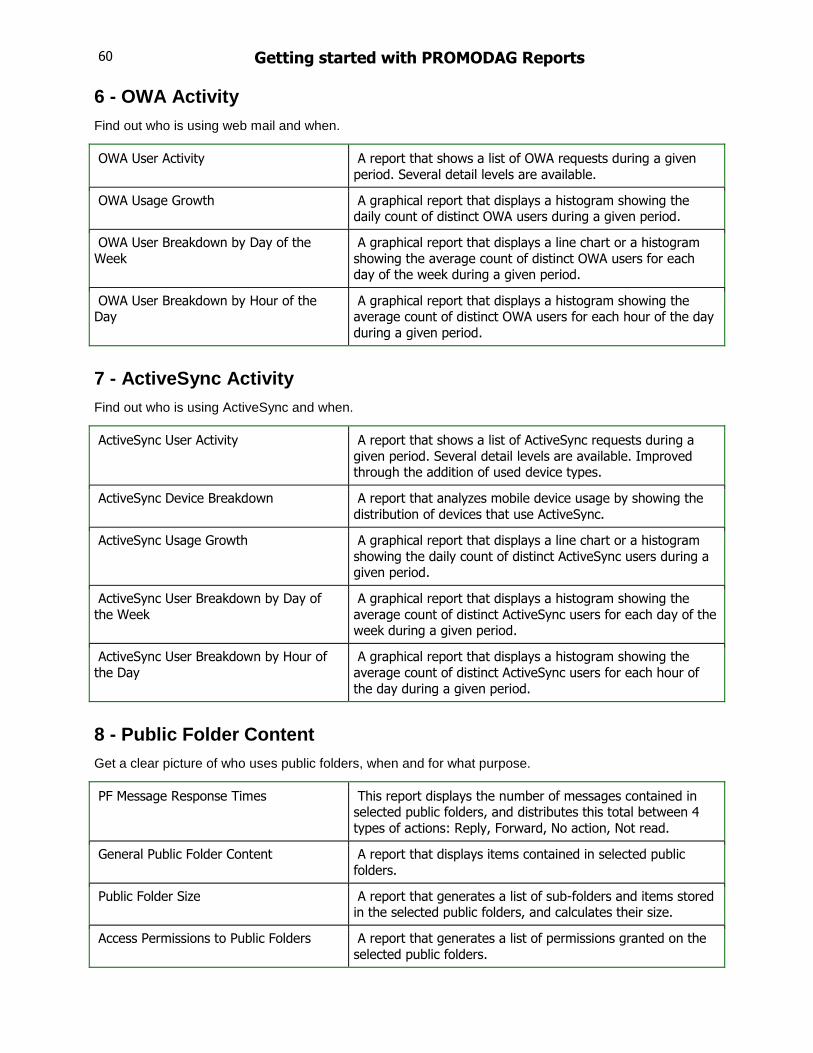
60 Getting started with PROMODAG Reports
6 - OWA Activity
Find out who is using web mail and when.
OWA User Activity A report that shows a list of OWA requests during a given
period. Several detail levels are available.
OWA Usage Growth A graphical report that displays a histogram showing the daily count of distinct OWA users during a given period.
OWA User Breakdown by Day of the
Week
A graphical report that displays a line chart or a histogram
showing the average count of distinct OWA users for each day of the week during a given period.
OWA User Breakdown by Hour of the Day
A graphical report that displays a histogram showing the average count of distinct OWA users for each hour of the day
during a given period.
7 - ActiveSync Activity
Find out who is using ActiveSync and when.
ActiveSync User Activity A report that shows a list of ActiveSync requests during a
given period. Several detail levels are available. Improved through the addition of used device types.
ActiveSync Device Breakdown A report that analyzes mobile device usage by showing the
distribution of devices that use ActiveSync.
ActiveSync Usage Growth A graphical report that displays a line chart or a histogram
showing the daily count of distinct ActiveSync users during a given period.
ActiveSync User Breakdown by Day of
the Week
A graphical report that displays a histogram showing the
average count of distinct ActiveSync users for each day of the week during a given period.
ActiveSync User Breakdown by Hour of
the Day
A graphical report that displays a histogram showing the
average count of distinct ActiveSync users for each hour of
the day during a given period.
8 - Public Folder Content
Get a clear picture of who uses public folders, when and for what purpose.
PF Message Response Times This report displays the number of messages contained in selected public folders, and distributes this total between 4
types of actions: Reply, Forward, No action, Not read.
General Public Folder Content A report that displays items contained in selected public
folders.
Public Folder Size A report that generates a list of sub-folders and items stored in the selected public folders, and calculates their size.
Access Permissions to Public Folders A report that generates a list of permissions granted on the
selected public folders.

Getting started with PROMODAG Reports 61
9 - Server Traffic
Display the type of traffic processed by servers.
Server Traffic Growth A graphical report that displays a line chart or a histogram
showing server traffic growth during a time frame. Some specific correspondent and recipient types can be selected.
Server Traffic Comparison by Correspondent
A graphical report that displays 4 pie charts showing the count and size of sent and received messages by address
type for the selected servers on a given period. Some specific recipient types can be selected.
Traffic Between Servers A report that displays the count and size of sent and received
messages for the selected servers, by recipient type.
Correspondents by Traffic Level A report that displays the count and size of sent and received
messages by domain or administrative group for a given period.
10 - Internal Message Delivery
Measure your service level agreement by calculating internal message delivery time.
Message Breakdown by Delivery Time A graphical report that displays a histogram of transmission
times broken down into duration intervals between two
Exchange servers during a given period.
Message Delivery Status A graphical report that produces two histograms showing the count and percentage of delivered and non-delivered
messages.
Message Delivery Detail An investigative report that displays a fully detailed list of
messages exchanged within the Exchange organization during a given period and grouped by time delivery. The information
provided includes MessageID.
11 - Traffic Optimization
How to optimize traffic.
SMTP Address Usage A report that dynamically searches in message tracking files
for e-mails whose sender or recipient address fields contain a particular e-mail address or domain name.
Non-Delivery Reports A report that lists Non-Delivery Reports messages,or NDR.
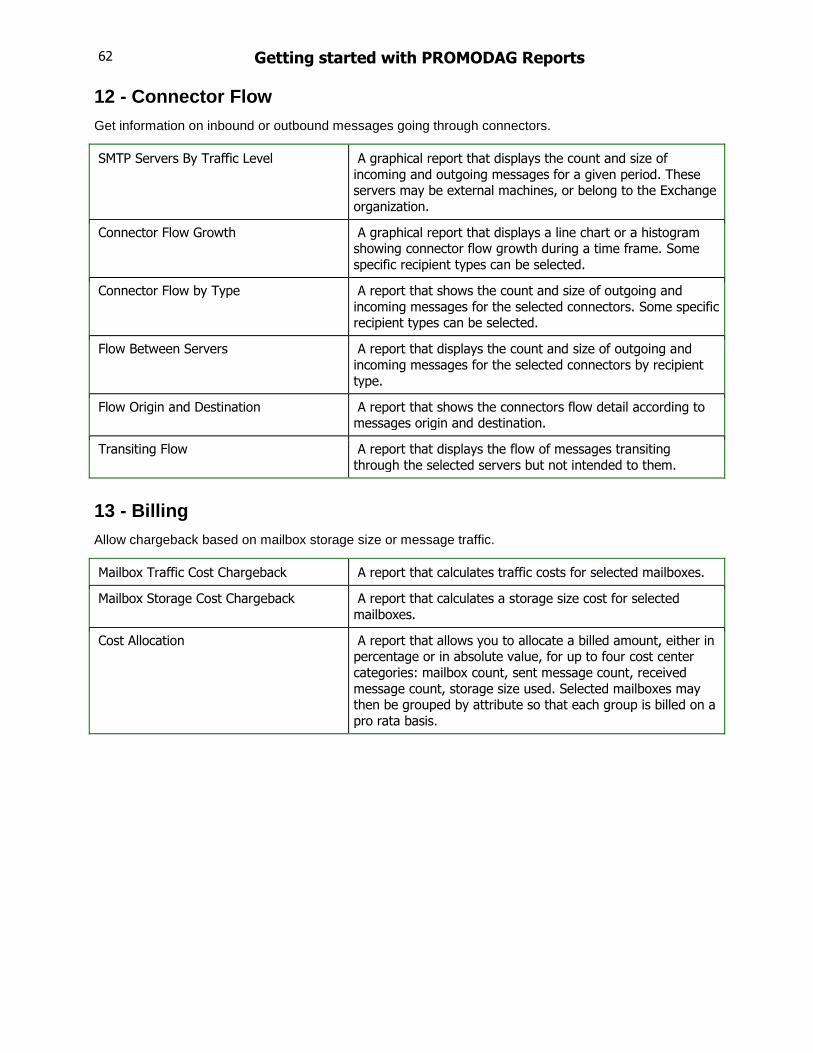
62 Getting started with PROMODAG Reports
12 - Connector Flow
Get information on inbound or outbound messages going through connectors.
SMTP Servers By Traffic Level A graphical report that displays the count and size of
incoming and outgoing messages for a given period. These servers may be external machines, or belong to the Exchange
organization.
Connector Flow Growth A graphical report that displays a line chart or a histogram showing connector flow growth during a time frame. Some
specific recipient types can be selected.
Connector Flow by Type A report that shows the count and size of outgoing and
incoming messages for the selected connectors. Some specific recipient types can be selected.
Flow Between Servers A report that displays the count and size of outgoing and
incoming messages for the selected connectors by recipient
type.
Flow Origin and Destination A report that shows the connectors flow detail according to messages origin and destination.
Transiting Flow A report that displays the flow of messages transiting
through the selected servers but not intended to them.
13 - Billing
Allow chargeback based on mailbox storage size or message traffic.
Mailbox Traffic Cost Chargeback A report that calculates traffic costs for selected mailboxes.
Mailbox Storage Cost Chargeback A report that calculates a storage size cost for selected
mailboxes.
Cost Allocation A report that allows you to allocate a billed amount, either in percentage or in absolute value, for up to four cost center
categories: mailbox count, sent message count, received
message count, storage size used. Selected mailboxes may then be grouped by attribute so that each group is billed on a
pro rata basis.

Getting started with PROMODAG Reports 63
Support
Your support options include:
Self-help resources
Please browse the following self-help resources before placing a support request, as they may indeed contain the solution to your problem and save your time:
1. This Quick Start Guide: it will give you the basic information needed to install, configure and start using the product.
2. The Online help (http://www.promodag.com/support/OnlineHelp/Repex.htm) will give you a more detailed information on PROMODAG Reports, from licensing to troubleshooting.
3. The Knowledge Base (http://www.promodag.com/Portal/KB/browse.aspx): it contains answers to common questions.
Email and over-the-phone software support
If you still have not found an answer to your question, you may submit a request to our Customer Support team under the following conditions:
You are evaluating the product: Support for PROMODAG Reports is free of charge during the 45-day trial period. However, you can submit up to 2 tickets via email at [email protected] (or use the Help > Technical Support Request option in the product).
You are an existing customer and your maintenance plan is currently valid: There is no limit to the number of technical support requests you can submit, either
a. via email at [email protected] (or use the Help > Technical Support Request option in the product), or
b. by phone: +33 1 53 27 66 60 or Toll Free (from USA only): 1(888) 696-5404.
You are an existing customer and your maintenance plan is no longer valid: You cannot submit any technical support request. However, you can subscribe at any time, just request a quotation from our sales department with your license number.
Note: We normally respond within 2 hours, but please allow 24 hours for us to respond to account for possible differences in international time zones. Our office hours are 10 AM to 7 PM UTC+1 (Paris), Monday to Friday.

64 Getting started with PROMODAG Reports
Index
Access database, 24
Create, 26
Anonymous report, 36
Automation
reports, 45
Batch file
Create, 40, 45
Definition, 40
Schedule, 43
Configuration
Directory connection, 28
Office 365 connection, 29
Content
Mailbox/Public folder, 17, 20
Count a multiple sending as 'n', 36
Data source
Directory, 7
Internet Information Server files, 7
OWA and ActiveSync, 30
Traffic reports, 29
Data sources
Storage size, 31
Database
Access format, 24
Create Access DB, 26
Create SQL Server DB, 26
management, 24
SQL format, 24
Exchange
Enabling Message Tracking Files, 17
Message Tracking Files location, 16, 20
Server roles (Exchange 2007/2010/2013), 16
Exchange On-Premises
Directory import, 15, 19
IIS log file import, 21
Mailbox/Public folder content, 17, 20
Message tracking file import, 16, 20
Storage size import, 18, 20, 21
Exchange Organization Type, 26
Exchange server
Requirements, 11
Favorites, 38
Import
Database size, 18
Directory, 14, 15, 19
IIS log files, 21
Mailbox/Database size, 21
Mailbox/Public folder size, 15, 18, 20
Message tracking files, 14, 16, 20
Information Store
Permissions, 19
Information Stores
Permissions, 21
Installation, 23
Internet Information Services
Enable logging, 22
Logs location, 21
Permissions, 21
Mailbox and Public Folder size
Permissions, 18, 21
Mailbox and Public Folders Content
Permissions, 18, 20
Mailbox size

Getting started with PROMODAG Reports 65
Permissions, 15
MAPI (Messaging Application Program Interface), 12
Message tracking files
Permissions, 17, 20
Message Tracking Files
Enable on the Exchange server, 17
Import schedule, 41
Office 365
Directory import, 14
Message tracking file import, 14
Storage size import, 15
Permissions
Information Stores, 19, 21
Internet Information Services, 21
Mailbox and Public Folder content, 18, 20
Mailbox and Public Folder size, 18, 21
Mailbox size, 15
Message tracking files, 17, 20
PROMODAG account
Requirements, 13
Report automation, 45
Report options file, 38, 40
Definition, 40
Requirements
Exchange server, 11
PROMODAG account, 13
SQL Server, 12
Workstation (hardware and software), 11
Schedule
Batch file, 43
Message Tracking Files import, 41
Server roles (Exchange 2007/2010/2013), 16
SQL Server
Requirements, 12
SQL Server database, 24
Create, 26
Support
Self-help resources, 60
Submit a request, 60
Tab
Correspondents, 34
Group, 35
Options, 35
Output, 37
Period, 33
Selection, 34
Wizard
Configuration, 25, 26, 28, 29, 30, 31
Report, 33