promote growth strategies aimed at evolution net sales, operating income, ordinary income and net...
TRANSCRIPT

1-5-1, Otemachi, Chiyoda-ku, Tokyo 100-8117, Japanhttp://www.mmc.co.jp/
This annual report is printed on recycled paper.
Printed in Japan
Annual Report 2008For the Year Ended March 31, 2008
Promote growth strategies
aimed at evolution
and innovation
Mitsubishi M
aterials Corporation Annual Report 2008

1
Established in 1950, Mitsubishi Materials Corporation is one of the world’s largest diversified materials companies. In addition to being a leader in metal smelting and refining, cement products and fabricated metals—notably Advanced Materials & Tools—Mitsubishi Materials is also a major supplier of Electronic Materials & Components.
The Company’s high-level research and development programs are instrumental in enabling it to maintain its dominant position in key markets.
Mitsubishi Materials comprises 227 subsidiaries and affiliates in 25 countries, employing 19,467 people.
Mitsubishi Materials at a Glance 2Message from the President 4New Medium-Term Management Plan “Break-through 1000” 5Review of Operations 8Research and Development 18CSR Promotion Structure 20Corporate Governance 21Management 22Financial Section 23Main Consolidated Subsidiaries and Affiliates 100International Network 101Corporate Data/Investor Information 103
Cautionary Statement with Respect to Forward-Looking StatementsStatements made in this annual report with respect to Mitsubishi Materials’ plans, strategies and beliefs, and other statements that are not historical facts, are forward-looking statements about the future performance of Mitsubishi Materials, which are based on management’s assumptions and beliefs in light of the information currently available to it, and involve risks and uncertainties. Potential risks and uncertainties include, without limitation, general economic conditions in Mitsubishi Materials’ markets; industrial market conditions; exchange rates, particularly between the yen and the U.S. dollar, and other currencies in which Mitsubishi Materials makes significant sales or in which Mitsubishi Materials’ assets and liabilities are denominated; and Mitsubishi Materials’ ability to continue to win acceptance of its products and services, which are offered in highly competitive markets characterized by continual new product introductions, rapid developments in technology and changing customer preferences.
NoteFractions less than one million yen have been omitted from the year ended March 31, 2007. As a result, the total amounts in Japanese yen and translated U.S. dollars shown in the consolidated financial statements and notes to the consolidated financial statements do not necessarily agree with the sum of the individual amounts.
Profile
Contents

Mitsubishi Materials at a Glance
2
Cement
Metals
Advanced Materials & Tools
From its beginnings as a developer of resources and producer of base metals, precious metals and coal, Mitsubishi Materials has evolved into a leading name in fabricated metals, silicon products, advanced materials, cement products and a variety of other cutting-edge products and services.
Sales(Billions of yen)
0
50
100
150
200
2004 2005 2006 2007 2008
Operating Profit(Billions of yen)
0
5
10
15
20
2004 2005 2006 2007 2008
Sales(Billions of yen)
0
200
400
600
800
2004 2005 2006 2007 2008
Operating Profit(Billions of yen)
0
10
20
30
40
50
2004 2005 2006 2007 2008
Sales(Billions of yen)
0
30
60
90
120
150
2004 2005 2006 2007 2008
Operating Profit(Billions of yen)
0
5
10
15
20
2004 2005 2006 2007 2008
Major Products and Services
• Portland cement• Cement-related products • Ready-mixed concrete• Building materials
Major Products and Services
• Copper smelting• Processed copper products
Major Products and Services
• Cemented carbide products• Sintered parts• High-performance alloy products• Diamond cutting tools

3
Electronic Materials & Components
Aluminum
Others
Sales(Billions of yen)
0
20
40
60
80
100
2004 2005 2006 2007 2008
Operating Profit(Billions of yen)
0
3
6
9
12
15
2004 2005 2006 2007 2008
Sales(Billions of yen)
0
50
100
150
200
2004 2005 2006 2007 2008
Operating Profit(Billions of yen)
0
2
4
6
8
2004 2005 2006 2007 2008
Sales(Billions of yen)
0
100
200
300
400
2004 2005 2006 2007 2008
Operating Profit(Billions of yen)
0
2
4
6
8
10
2004 2005 2006 2007 2008
Sales by Segment* (Fiscal 2008)(Billions of yen)
Others22.8%
Aluminum10.2%
Cement11.2%
Metals41.3%
Advanced Materials & Tools9.0%
Electronic Materials & Components5.5%
*Sales to unaffiliated customers *Before elimination
¥1,659.2billion
Operating Profit by Segment* (Fiscal 2008)(Billions of yen)
Others8.8%Aluminum4.9%
Cement12.8%
Metals42.4%
Advanced Materials & Tools17.8%
Electronic Materials & Components13.2%
¥108.5billion
Major Products and Services
• Electronic materials• Chemical products• Electronic components• Polycrystalline silicon
Major Products and Services
• Aluminum beverage cans• Rolled aluminum • Processed aluminum products
Major Products and Services
• Fossil fuels• Nuclear energy-related services• Precious metals• Resources-, environment- and recycling-related products• Real estate, etc.

Message from the President
4
Fourth Consecutive Year of Record-Breaking Fiscal ResultsThe operating environment in fiscal 2008, ended March 31, 2008, was generally favorable. Negative factors, primarily a downturn in demand for cement and rising prices for fuel and raw materials, exerted some pressure on earnings. However, the effect was more than compensated for by positive factors, such as persistently high prices for copper and other key materials and sustained demand from the automobile and information electronics sectors and silicon-using businesses.
Against this backdrop, the Mitsubishi Materials Group followed the blueprint created for “Break-through 1000,” the medium-term management plan launched in April 2007 and designed to turn the Group into a ¥100 billion organization. The “1000” comes from the Japanese term sen oku—1,000 hundred million—which translates into 100 billion.
Using “Break-through 1000” as a guide, we worked to reinforce and expand our four core businesses—Cement, Metals, Advanced Materials & Tools, and Electronic Materials & Components—to maximize their respective business models, thus realizing a management structure comparable to a four-wheel drive corporate vehicle capable of negotiating any business terrain. We also implemented measures such as the targeting of investment in three growth areas—automobiles, information electronics, and environment and recycling. Furthermore, we continued to build a stable profit structure that will support the achievement of a consolidated ordinary income which exceeds ¥100 billion, regardless of the operating conditions we may encounter.
To complement these efforts, we endeavored to cut costs and thereby mitigate the impact of rising prices of fuel and raw materials, while improving profitability and—seeking to realize a vertical value chain and strengthen nonconsolidated profitability—we embraced measures to realign or concentrate Group operations.
On the research and development front, we emphasized the allocation of management resources to the three growth fields and promoted new product development anchored on market needs.
As a result, net sales climbed 14.3% to ¥1,659.2 billion, and ordinary income jumped 26.9%, to ¥136.0 billion on a consolidated basis. Net income rose 4.0% to ¥74.2 billion, reflecting other income—such as gain on sales of marketable securities and investments in securities—and other expenses, largely from reserves to cover waste treatment.
Consolidated net sales, operating income, ordinary income and net income all reached new highs. Most notably, ordinary income achieved its sixth consecutive year of growth and fourth year of record-breaking results.
Achieving the Targets of “Break-through 1000”The current operating environment for the Group may pose some challenges. Although favorable conditions should continue to characterize the automotive- and silicon-related sectors, custom ore conditions on copper may worsen, fuel and raw material prices are likely to stay high—as will the yen—and a possible recession in the United States could adversely affect the supply and demand of finished products.
From this perspective, it is vital for the Group to lay an operating foundation that can support its drive to surpass consolidated ordinary income of ¥100 billion. This will be achieved through the steady implementation of the strategies outlined in “Break-through 1000.”
We will fully demonstrate the capabilities characteristic of a world-caliber producer of comprehensive basic materials and strive to be the strongest corporate group.
On behalf of the Company, I ask for the continued support and encouragement of all our stakeholders as we work toward new successes.
June 27, 2008
Akihiko IdePresident

New Medium-Term Management Plan “Break-through 1000”
5
Medium-Term Management Plan “Break-through 1000” Progress Report and OutlookIn April 2007, the Mitsubishi Materials Group embarked on “Break-through 1000,” a three-year medium-term management plan that runs until March 2010, and put into motion its four-wheel drive management system of the four core businesses, each operating under its own business model.
In fiscal 2008, the first year of this plan, concerted Groupwide efforts have already borne fruit, exemplified by favorable results in each business segment and record-breaking consolidated ordinary income. With continued emphasis on the concept of evolution and innovation, we will pursue strategic investments aimed at raising corporate value and reinforce growth drivers in each business segment to reach the goals of “Break-through 1000.”
Given the progress achieved as of March 31, 2008, we have revised numerical targets for the final year of “Break-through 1000.”
Fiscal 2008 Progress and Outlook for Fiscal 2009In fiscal 2008, consolidated ordinary income hit a record level, reflecting high copper prices and favorable contributions from the three growth areas—automobiles, information electronics, and environment and recycling—common to our four core businesses. In fiscal 2009, the operating climate may become inclement— chiefly because of higher coal prices, a worsening copper smelting margin and fears that lingering repercussions from the U.S. subprime mortgage crisis will trigger a global economic slowdown. Nevertheless, efforts to underpin sustainable growth in all business segments—primarily through an increase in domestic prices by the Cement business and improved downstream copper processing by the Metals business—should lead to consolidated ordinary income of more than ¥100 billion.
The FutureIn fiscal 2008, we identified the cornerstones of a solid medium- to long-term foundation for growth in each business segment, and allocated capital to fortify these drivers of corporate development. Specifically, we 1) strengthened the Group’s Cement business in the United States by turning Robertson’s Ready Mix, Ltd., into a consolidated subsidiary; 2) turned two copper companies into wholly owned subsidiaries and then merged them into a revitalized Mitsubishi Shindoh Co., Ltd.; 3) enhanced the operating base for the carbide insert business; and 4) boosted polycrystalline silicon output by 1,000 tons.
The accelerated pace of growth-oriented investment over the medium to long term will raise aggregate investment over the three years of “Break-through 1000” from ¥250 billion to ¥410 billion. Consequently, even though the operating environment may worsen for some businesses under the Group umbrella, we expect consolidated ordinary income to surpass ¥110 billion by March 2010, up from the earlier target of more than ¥100 billion.
The debt-to-equity ratio has also been revised upward, to 1.5 times as opposed to the previously announced 1.4 times, due to certain large-scale investments that happened concurrently. Nevertheless, we will undertake a review of the Group’s business portfolio and pursue other measures to elicit further improvement in our financial position.
Performance Target FY2008 (result) FY2009 (forecast) FY2010 (target)
Initial Plan Revised Plan
Ordinary income*1 ¥136.0 billion ¥100 billion ¥100 billion+ ¥110 billion+
ROA*2 7.5% 5.3% 5%+ 5%+
Debt-to-equity ratio 1.5 times 1.5 times 1.4 times 1.5 times
“Break-through 1000”: Revised Performance Targets
*1 Operating profit, plus non operating income and expense such as interest, dividend income and equity in earnings of affiliates*2 Ratio of ordinary income to total assets

New Medium-Term Management Plan
6
Cement
Metals
Acquire shares in Robertson’s Ready Mix, Ltd.Establish highly profitable constitution by focusing on high-growth markets
Integrate two rolled copper companies into Group operations Build stable earnings structure, well-balanced across up and downstream (mining, smelting and processing)
The Group’s Cement business in the United States was strengthened by turning Robertson’s Ready Mix, Ltd., into a consolidated subsidiary.
The basic Cement business strategies—to reinforce the profit structure in Japan, to demonstrate extensive capabilities, from cement production and import sales to the ready-mix concrete and aggregate business, in the U.S. market, and to expand activities, particularly in downstream operations—were designed to establish a major corporate presence in the Pacific Rim area.
As part of this plan, we invested about ¥90 billion through the consolidated subsidiary MCC Development Corp., (MCCD) to acquire an additional 36.7% equity stake in Robertson’s Ready Mix, Ltd., a leading provider of ready-mix concrete and construction aggregates based in California, for a total holding of 70%.
Demand for cement in the United States has entered an adjustment phase, largely due to subprime-related problems. But the medium- to long-term forecast is for growth, as an increase in population necessitates greater construction activity, at least in the public sector.
Through the additional equity stake in Robertson’s Ready Mix, Ltd., the Cement business will benefit performance-wise from the high profitability of this company and operation-wise by gaining a solid foothold in downstream operations in the promising market of southern California. We expect to see further expansion and reinforcement of the cement, ready-mix concrete and construction aggregate businesses in the United States.
The Metals business has endeavored to raise the added value of its products through vertical integration—that is, linking copper refining to copper processing—to establish the foundation for a stable profit structure.
In refining operations, we have acquired a sharper competitive edge at the global level by enhancing recycling activities which utilize the advantages of a proprietary continuous smelting process—“The Mitsubishi Process.”
In processing operations, we made Mitsubishi Shindoh and Sambo Copper Alloy Co., Ltd., wholly owned subsidiaries and then merged the two companies on April 1, 2008, with Mitsubishi Shindoh as the surviving company. The revitalized Mitsubishi Shindoh is now the largest manufacturer of copper alloy products in Japan, with 17% of the copper and copper alloy semis market and 25% of the copper and copper alloy strip market. The company aims to become the world’s top-rated copper processor in terms of development capability, product quality and profitability, by uniting the enhanced resources of development, technology and personnel of the Group.
Overview of equity stake purchase Equity stake: Acquired a further 36.7% share, bringing MCCD’s stake (from 33.3%) to 70% Acquisition period: Completed by March 31, 2008 Acquisition price: Around US$900 million
Merger-Derived Synergies Domestic No. 1 in copper and copper alloy semis volume (17% market share)Domestic No. 1 in copper and copper alloy strip production volume (25% market share)Source: Japan Copper and Brass Association (FY2007 data)
Advancement and Change to Growth Cushenbury Plant, Mitsubishi Cement Corp.
Lead frames <Copper processing products>
Copper anodes (balls)
New Medium-Term Management Plan
7
Advanced Materials & Tools
Electronic Materials & Components
Enhance manufacturing and sales of cemented carbide productsExpedite growth, focusing on automobiles, aviation, IT, and other growth fields
Increase production of polycrystalline silicon Further boost profitability by establishing a vertical value chain for silicon products
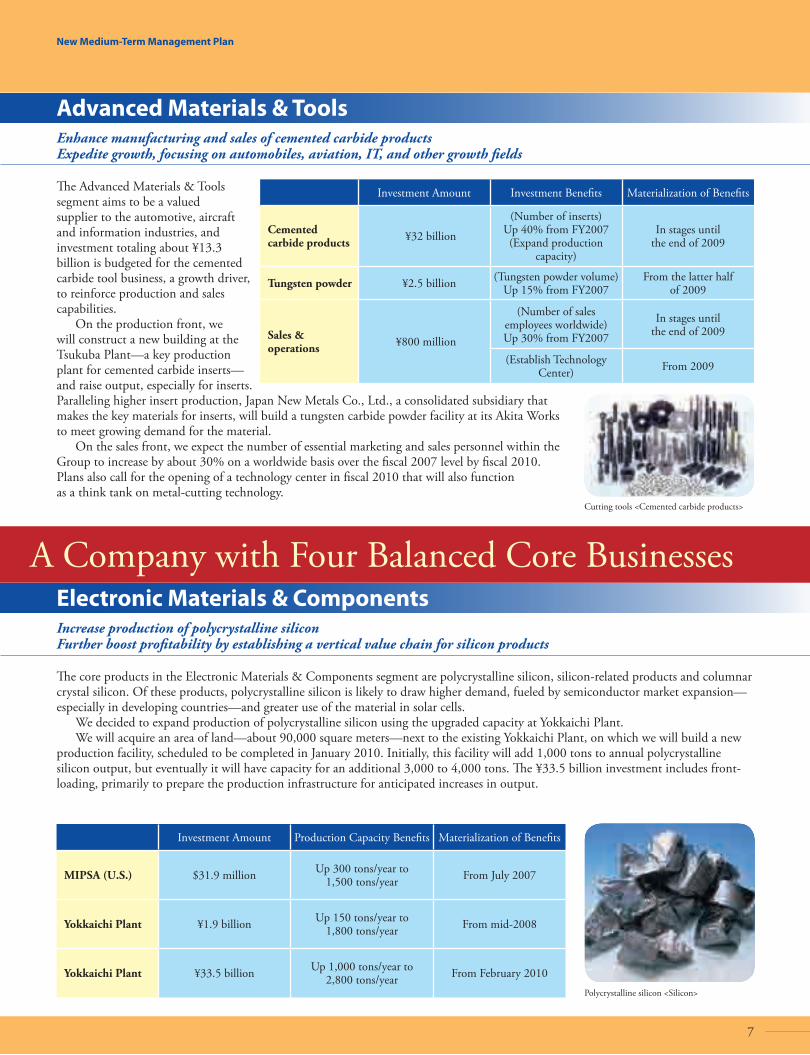
The Advanced Materials & Tools segment aims to be a valued supplier to the automotive, aircraft and information industries, and investment totaling about ¥13.3 billion is budgeted for the cemented carbide tool business, a growth driver, to reinforce production and sales capabilities.
On the production front, we will construct a new building at the Tsukuba Plant—a key production plant for cemented carbide inserts—and raise output, especially for inserts. Paralleling higher insert production, Japan New Metals Co., Ltd., a consolidated subsidiary that makes the key materials for inserts, will build a tungsten carbide powder facility at its Akita Works to meet growing demand for the material.
On the sales front, we expect the number of essential marketing and sales personnel within the Group to increase by about 30% on a worldwide basis over the fiscal 2007 level by fiscal 2010. Plans also call for the opening of a technology center in fiscal 2010 that will also function as a think tank on metal-cutting technology.
A Company with Four Balanced Core Businesses
Investment Amount Production Capacity Benefits Materialization of Benefits
MIPSA (U.S.) $31.9 million Up 300 tons/year to 1,500 tons/year From July 2007
Yokkaichi Plant ¥1.9 billion Up 150 tons/year to 1,800 tons/year From mid-2008
Yokkaichi Plant ¥33.5 billion Up 1,000 tons/year to 2,800 tons/year From February 2010
Investment Amount Investment Benefits Materialization of Benefits
Cemented carbide products ¥32 billion
(Number of inserts)Up 40% from FY2007(Expand production
capacity)
In stages until the end of 2009
Tungsten powder ¥2.5 billion (Tungsten powder volume)Up 15% from FY2007
From the latter half of 2009
Sales & operations ¥800 million
(Number of sales employees worldwide)Up 30% from FY2007
In stages until the end of 2009
(Establish Technology Center) From 2009
The core products in the Electronic Materials & Components segment are polycrystalline silicon, silicon-related products and columnar crystal silicon. Of these products, polycrystalline silicon is likely to draw higher demand, fueled by semiconductor market expansion—especially in developing countries—and greater use of the material in solar cells.
We decided to expand production of polycrystalline silicon using the upgraded capacity at Yokkaichi Plant. We will acquire an area of land—about 90,000 square meters—next to the existing Yokkaichi Plant, on which we will build a new
production facility, scheduled to be completed in January 2010. Initially, this facility will add 1,000 tons to annual polycrystalline silicon output, but eventually it will have capacity for an additional 3,000 to 4,000 tons. The ¥33.5 billion investment includes front-loading, primarily to prepare the production infrastructure for anticipated increases in output.
Cutting tools <Cemented carbide products>
Polycrystalline silicon <Silicon>

Review of Operations
8
Cement
Millions of yen Percentage change
2008 2007 2008/2007
Sales ¥185,074 ¥198,288 -6.7%
Operating profit 13,925 18,335 -24.1
Identifiable assets 268,847 280,368 -4.1
Depreciation 12,849 10,216 25.8
Capital expenditures 16,653 21,114 -21.1
DepreciationCapital expenditures(Millions of yen)
0
5,000
10,000
15,000
20,000
25,000
2007 2008
Establish highly profitable constitution by focusing on high-growth markets
Highlights
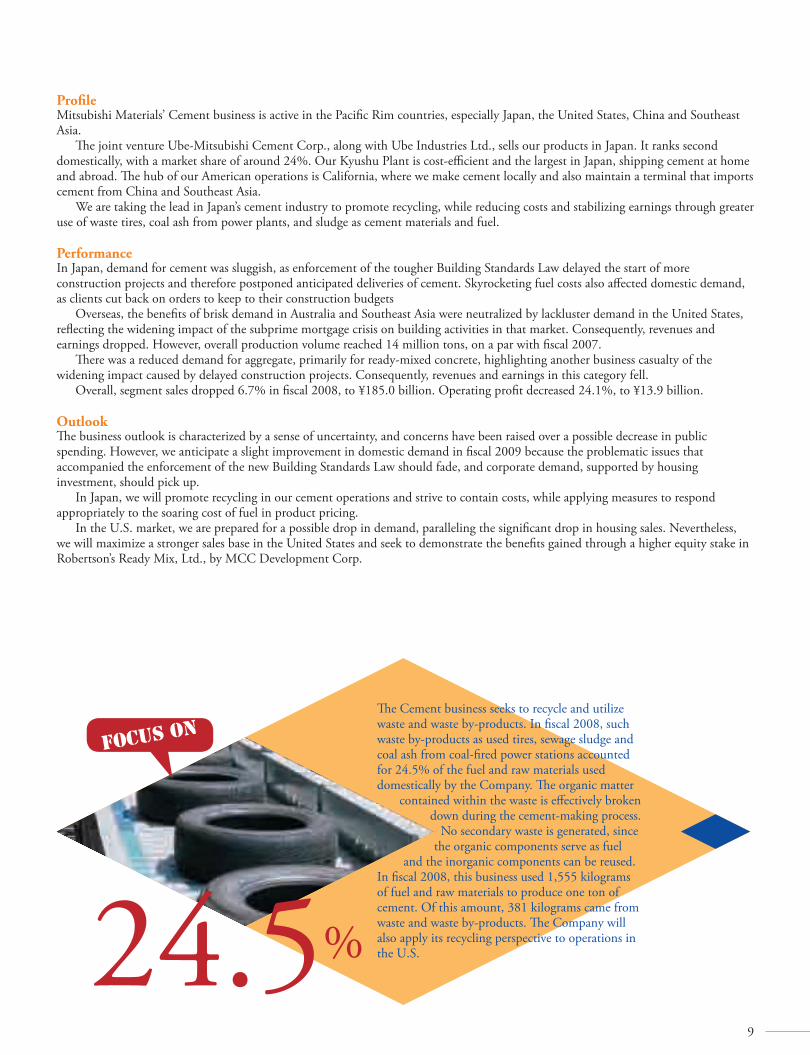
The Cement business seeks to recycle and utilize waste and waste by-products. In fiscal 2008, such waste by-products as used tires, sewage sludge and coal ash from coal-fired power stations accounted for 24.5% of the fuel and raw materials used domestically by the Company. The organic matter
contained within the waste is effectively broken down during the cement-making process.
No secondary waste is generated, since the organic components serve as fuel
and the inorganic components can be reused. In fiscal 2008, this business used 1,555 kilograms of fuel and raw materials to produce one ton of cement. Of this amount, 381 kilograms came from waste and waste by-products. The Company will also apply its recycling perspective to operations in the U.S.
9
ProfileMitsubishi Materials’ Cement business is active in the Pacific Rim countries, especially Japan, the United States, China and Southeast Asia.
The joint venture Ube-Mitsubishi Cement Corp., along with Ube Industries Ltd., sells our products in Japan. It ranks second domestically, with a market share of around 24%. Our Kyushu Plant is cost-efficient and the largest in Japan, shipping cement at home and abroad. The hub of our American operations is California, where we make cement locally and also maintain a terminal that imports cement from China and Southeast Asia.
We are taking the lead in Japan’s cement industry to promote recycling, while reducing costs and stabilizing earnings through greater use of waste tires, coal ash from power plants, and sludge as cement materials and fuel.
PerformanceIn Japan, demand for cement was sluggish, as enforcement of the tougher Building Standards Law delayed the start of more construction projects and therefore postponed anticipated deliveries of cement. Skyrocketing fuel costs also affected domestic demand, as clients cut back on orders to keep to their construction budgets
Overseas, the benefits of brisk demand in Australia and Southeast Asia were neutralized by lackluster demand in the United States, reflecting the widening impact of the subprime mortgage crisis on building activities in that market. Consequently, revenues and earnings dropped. However, overall production volume reached 14 million tons, on a par with fiscal 2007.
There was a reduced demand for aggregate, primarily for ready-mixed concrete, highlighting another business casualty of the widening impact caused by delayed construction projects. Consequently, revenues and earnings in this category fell.
Overall, segment sales dropped 6.7% in fiscal 2008, to ¥185.0 billion. Operating profit decreased 24.1%, to ¥13.9 billion.
OutlookThe business outlook is characterized by a sense of uncertainty, and concerns have been raised over a possible decrease in public spending. However, we anticipate a slight improvement in domestic demand in fiscal 2009 because the problematic issues that accompanied the enforcement of the new Building Standards Law should fade, and corporate demand, supported by housing investment, should pick up.
In Japan, we will promote recycling in our cement operations and strive to contain costs, while applying measures to respond appropriately to the soaring cost of fuel in product pricing.
In the U.S. market, we are prepared for a possible drop in demand, paralleling the significant drop in housing sales. Nevertheless, we will maximize a stronger sales base in the United States and seek to demonstrate the benefits gained through a higher equity stake in Robertson’s Ready Mix, Ltd., by MCC Development Corp.
Focus on
24.5%

Review of Operations
10
Metals
Millions of yen Percentage change
2008 2007 2008/2007
Sales ¥684,497 ¥598,921 14.3%
Operating profit 46,053 33,395 37.9
Identifiable assets 500,705 466,294 7.4
Depreciation 15,672 12,455 25.8
Capital expenditures 25,980 11,626 123.5
DepreciationCapital expenditures(Millions of yen)
0
5,000
10,000
15,000
20,000
25,000
30,000
2007 2008
Build stable earnings structure, well-balanced across up and downstream (mining, smelting, and processing)
Highlights
11
ProfileOur Metals business encompasses investments in copper mines, copper smelting and the production of processed copper products.
We have invested in four copper mines overseas. Our two domestic copper smelters produce a combined total of 340 thousand metric tons of copper cathode annually. Our
Indonesian smelter began operations in 1999 with a production capacity of 200 thousand metric tons of copper cathode per year, and the facility has since expanded maximum output to 270 thousand metric tons.
We developed the “Mitsubishi Process,” the world’s first continuous-smelting process for copper, which is both highly efficient and pollution free. In addition to plants in Japan, smelters in Canada, South Korea, Indonesia and India use this process.
We sell almost 80% of the copper cathode we make in Japan as processed copper to Group electric wire and rolled copper makers and other manufacturers in Japan and overseas. We use high-purity copper cathode in a special melting and casting process to make oxygen-free copper and copper alloy ingots. As a result of their superior quality, we enjoy a massive share of the global market for these products.
We are broadening applications of copper to rolled copper and the semiconductor and electronics fields. Smelting accounts for the bulk of profits from our Metals business, although processing has become a growing and stable source of earnings.
PerformanceAlthough the scheduled furnace shutdown at Naoshima Smelter limited available capacity, a trend toward higher prices and steady operations both at Naoshima Smelter and at PT. Smelting in Indonesia provided a basis for better revenues and earnings for the Metals business in fiscal 2008. Overall production of copper cathode reached 602 thousand metric tons, a year-on-year increase of 56 thousand metric tons.
In processed copper products, an upward shift in copper prices caused a drop in demand for copper billets and cakes, as well as wire rods used in making copper pipes and sheets. But revenues and earnings were up, largely because of brisk demand for copper balls used in plating processes as well as the first full-year contribution from Mitsubishi Shindoh Co., Ltd., which came under the scope of consolidation in October 2006.
Increased revenues and earnings on gold products reflected higher concentrations of gold abstracted from ore, as well as the surging price of gold on the market.
Consequently, segment sales climbed 14.3% in fiscal 2008, to ¥684.4 billion. Operating profit increased 37.9%, to ¥46.0 billion.
OutlookWe foresee a continued shortage of copper concentrates because major mines have not been able to boost production capacity to meet rising demand, especially in China and India. Concentrates purchasing terms could deteriorate considerably.
In the copper market, prices are likely to remain high, with a continuous flow of funds. However, the current link between supply and demand could disintegrate, amid fears of a global recession. As a result, the prospects for the market are unsettling.
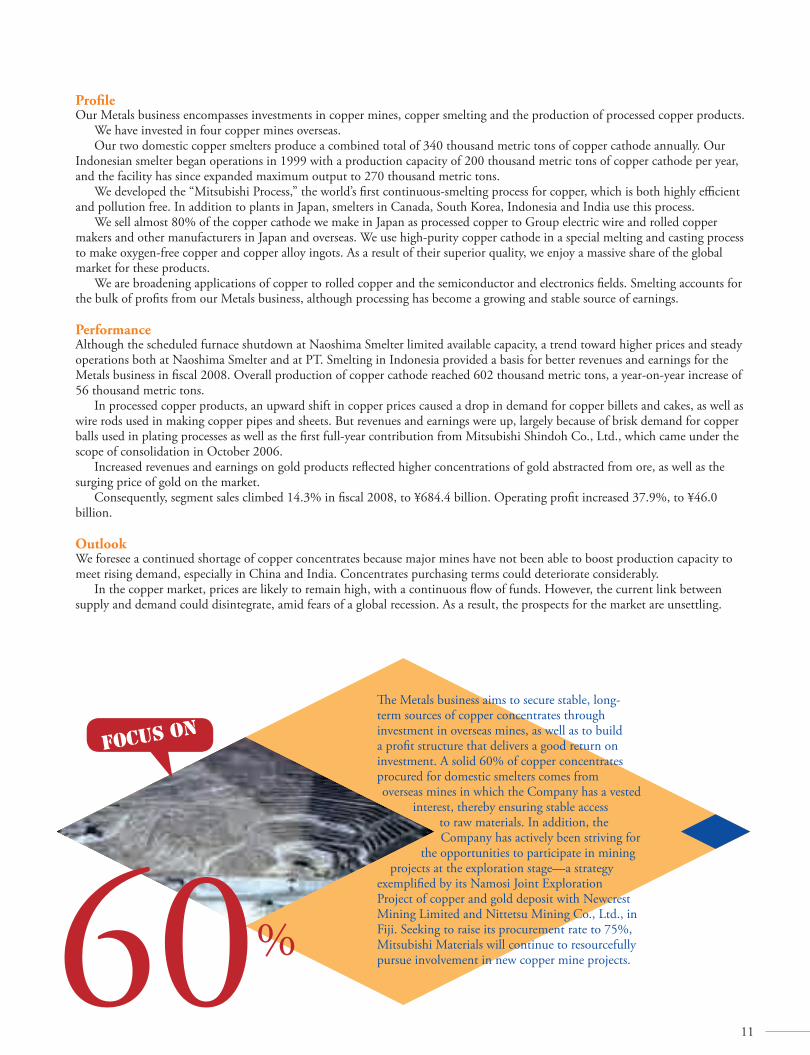
The Metals business aims to secure stable, long-term sources of copper concentrates through investment in overseas mines, as well as to build a profit structure that delivers a good return on investment. A solid 60% of copper concentrates procured for domestic smelters comes from overseas mines in which the Company has a vested
interest, thereby ensuring stable access to raw materials. In addition, the Company has actively been striving for
the opportunities to participate in mining projects at the exploration stage—a strategy
exemplified by its Namosi Joint Exploration Project of copper and gold deposit with Newcrest Mining Limited and Nittetsu Mining Co., Ltd., in Fiji. Seeking to raise its procurement rate to 75%, Mitsubishi Materials will continue to resourcefully pursue involvement in new copper mine projects.
Focus on
60%

Review of Operations
12
Advanced Materials & Tools
Millions of yen Percentage change
2008 2007 2008/2007
Sales ¥150,040 ¥138,095 8.6%
Operating profit 19,311 16,114 19.8
Identifiable assets 174,760 166,433 5.0
Depreciation 8,968 6,894 30.0
Capital expenditures 11,443 12,702 -9.9
DepreciationCapital expenditures(Millions of yen)
0
3,000
6,000
9,000
12,000
15,000
2007 2008
Expedite growth, focusing on automobiles, aviation, IT and other growth fields
Highlights
13
ProfileThis business segment covers cemented carbide products for metal-cutting machine tools, core parts for automobiles and electrical products, and high-performance materials that deliver superior resistance to heat, corrosion and wear for use in key, leading-edge industries, as well as diamond tools.
Cemented carbide tools account for more than 80% of segment earnings. In this product category, we lead the domestic market and have captured more than 10% of the global market.
PerformanceIn Japan, we encountered sluggish demand for cemented carbide tools used in the mold and die industry—a situation that was exacerbated by reduced capital spending by automakers, which represent a major market for these products. Overseas, we capitalized on thriving demand, especially in the BRICs—Brazil, Russia, India and China—as well as generally favorable conditions in Europe and the United States. As a result, revenues and earnings from the cemented carbide tool business improved from fiscal 2007.
Sales and profits from powder metallurgy products increased due to steady automotive-related demand.Demand for high-performance alloy products was good, not only from the electronics sector but also from our three mainstay
client groups—the aerospace, gas turbine and automotive sectors—which boosted revenues. However, unfavorable developments, particularly soaring prices for raw materials, led to lower earnings.
Segment performance reflects the challenges of the operating environment, as sales climbed 8.6% in fiscal 2008, to ¥150.0 billion, and operating profit increased 19.8%, to ¥19.3 billion.
OutlookAlthough we expect greater interest in cemented carbide tools from new sources of demand, including aircraft makers in Japan, the overall direction is uncertain. This is primarily because exporters, feeling the negative impact of the appreciation of the yen on profits, may restrict their plans for new or expanded facilities. In the United States, the subprime mortgage crisis has sparked fears of a recession, which would dilute demand if the economy does stall. Conversely, the demand in the BRICs should remain strong, thanks to brisk activity among automakers.
As for the business itself, we will reinforce our presence by demonstrating the advantages derived from the merging of Mitsubishi Materials Kobe Tools Co., Ltd., into our organization on October 1, 2007. We will also strive to identify the benefits of expanded production capacity—through capital investments—as quickly as possible, and utilize overseas operating bases more strategically to provide the foundations for a more extensive global presence.
Sales of high-performance alloy products will probably remain favorable, buoyed by steady demand from the aircraft, gas turbine and automotive sectors. We will strive to secure orders from aircraft makers and wherever possible reflect the higher cost of raw materials in our product prices.
Focus on
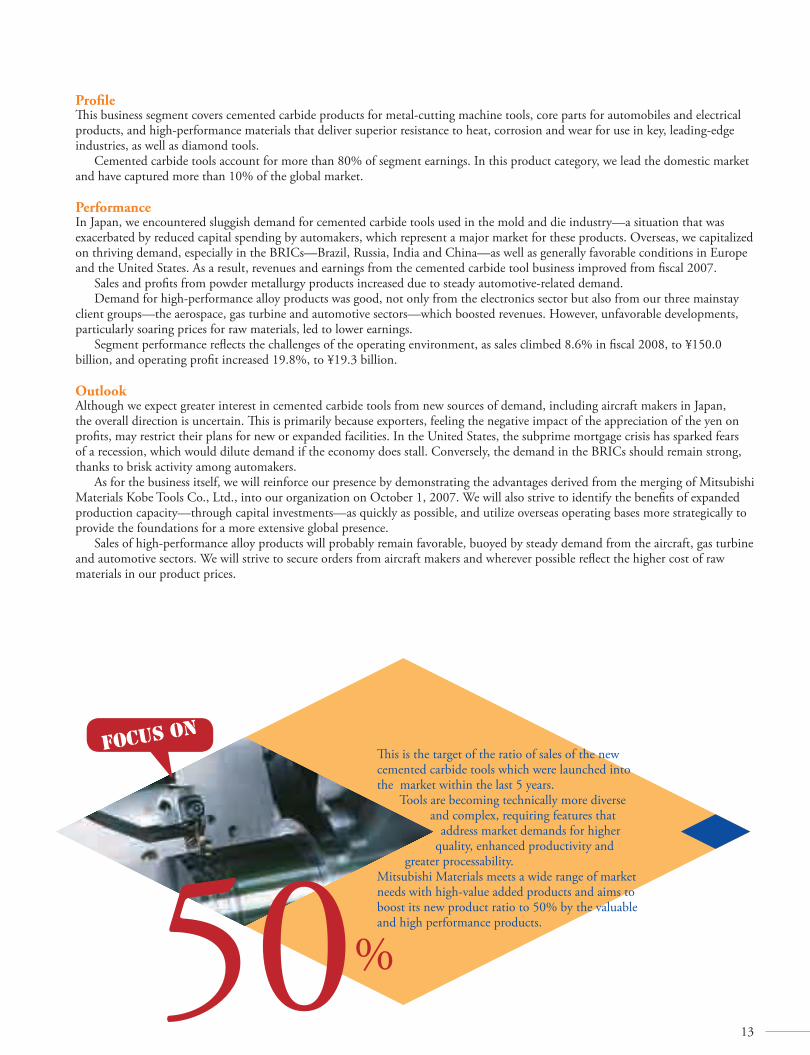
50%
This is the target of the ratio of sales of the new cemented carbide tools which were launched into the market within the last 5 years.
Tools are becoming technically more diverse and complex, requiring features that
address market demands for higher quality, enhanced productivity and
greater processability.Mitsubishi Materials meets a wide range of market needs with high-value added products and aims to boost its new product ratio to 50% by the valuable and high performance products.

Review of Operations
14
Electronic Materials & Components
Millions of yen Percentage change
2008 2007 2008/2007
Sales ¥91,759 ¥85,189 7.7%
Operating profit 14,334 10,388 38.0
Identifiable assets 190,077 169,282 12.3
Depreciation 5,698 4,970 14.6
Capital expenditures 9,674 8,162 18.5
DepreciationCapital expenditures(Millions of yen)
0
2,000
4,000
6,000
8,000
10,000
2007 2008
Further boost profitability by establishing a vertical value chain for silicon products
Highlights

15
ProfileThis segment specializes in advanced materials, electronic components and silicon, and mainly serves makers of semiconductor devices and telecommunications equipment. Key advanced materials include sputtering targets for recording media and chemical products. The electronic components business handles chip thermistors used in the battery packages of such products as cellular telephones. The silicon business produces and sells polycrystalline silicon, mainly for silicon wafer manufacturers.
PerformanceThe advanced materials business brought in higher revenues and earnings, supported by particularly brisk demand for semiconductor- and automotive-related products.
The electronic components business presented lower revenues and earnings, despite an increase in sales of such items as parts for car antennas, largely because of a drop in sales by overseas consolidated subsidiaries.
The polycrystalline silicon business achieved higher revenues and earnings, benefiting from an expanding semiconductor market, driven by greater interest in 300mm silicon wafers, and brisk activity in the solar cell market. Enhanced production capacity at Mitsubishi Polycrystalline Silicon America Corp., also buoyed results.
Overall, segment sales climbed 7.7% in fiscal 2008, to ¥91.7 billion, and operating profit increased 38.0%, to ¥14.3 billion.
OutlookDemand for certain products is highly likely to shrink due to the inventory adjustments of some of our customers. To prepare for this situation, we aim to reinforce profitability by enhancing our marketing and technical skills and thereby raise the ratio of newly developed products in the sales volume mix.
In the electronic components business, market trends are uncertain, but we expect sales of components used in automotive applications to remain favorable. Concerted efforts will be directed toward developing new products, which should boost sales.
The polycrystalline silicon business will be characterized by a persistently tight supply and demand situation, owing to vigorous demand for solar cells and semiconductors, especially 300mm silicon wafers. We will seek to demonstrate the advantages gained by integrating Mitsubishi Materials Polycrystalline Silicon Corp., into the Company on April 1, 2007, and quickly achieve the benefits derived from expanded production capacity through capital investment, as well as confirming sales volume.
Focus on
99.999999999%
Over the years, Mitsubishi Materials has accumulated high-level production technologies for making ultrapure polycrystalline silicon. At 99.999999999% purity—dubbed “eleven-
nine”—this material is used in silicon wafers, which form the base on which semiconductor devices are built. Rising
demand for silicon used in solar cells has limited the availability of polycrystalline silicon,
but the Company will respond to solar cell market needs with columnar crystal silicon and other products that distinguish it from the competition.

Review of Operations
16
ProfileThe Aluminum business centers on subsidiaries Universal Can Co., Ltd., and Mitsubishi Aluminum Co., Ltd., which makes extruded aluminum.
We are cultivating new demand for aluminum containers. Most notable are our proprietary bottle-shaped aluminum cans, which have won recognition for maintaining the long-term freshness of beverages by keeping them impervious to air and light. In our rolled aluminum business, we have achieved solid growth in rolled and extruded offerings for automotive applications, and we expect demand in this area to continue to expand.
In Green Productivity Management activities, which are designed to reduce environmental impact while improving quality of life, we will reinforce our aluminum can recycling structure and enhance the life cycle of aluminum resources to underpin the eco-friendly quality of these efforts.
PerformanceSales of regular aluminum cans were generally steady in fiscal 2008. Cost cuts and partial revision of product prices, to address the skyrocketing price of raw materials, balanced out some of the pricing inconsistencies we had been experiencing. As a result, we saw year-on-year improvements in both the volume and value of sales, which supported higher revenues.
Product prices for rolled and processed aluminum products also increased, paralleling soaring raw material prices. But we recorded a drop in the volume of sales, most notably on aluminum sheets and other rolled products for the printing industry. As a result, earnings in this category decreased.
Overall, segment sales climbed 3.9% in fiscal 2008, to ¥169.1 billion. Operating profit increased 87.1%, to ¥5.3 billion.
OutlookThe domestic market for aluminum cans is shrinking, largely because a falling birthrate and a higher percentage of elderly within the national demographic have streamlined demand for consumer products in aluminum cans. This trend could precipitate a slight decrease in the volume of aluminum cans sold. In regard to product pricing, we will continue to pursue talks with clients for whom we have not yet negotiated new prices.
In the rolled and processed aluminum products business, we anticipate higher demand for sheets and extruded products for use in automobiles. However, skyrocketing energy costs, as well as amendments to the tax system will make our depreciation cost burden much heavier. This could cause earnings to suffer.
Aluminum
Millions of yen Percentage change
2008 2007 2008/2007
Sales ¥169,143 ¥162,841 3.9%
Operating profit 5,330 2,849 87.1
Identifiable assets 164,655 183,585 -10.3
Depreciation 10,174 8,921 14.0
Capital expenditures 6,720 6,481 3.7
DepreciationCapital expenditures(Millions of yen)
0
2,000
4,000
6,000
8,000
10,000
12,000
2007 2008
Highlights

Review of Operations
17
ProfileThe Others segment encompasses energy, precious metals resources, recycling and the environment, and real estate operations.
Our energy business has helped stabilize supplies to Japan, a naturally resource-poor country. We entered the nuclear energy field soon after World War II, and by harnessing such sources of clean energy we continue to strive to help prevent global warming. We are building a safe nuclear fuel cycle that covers everything from mining uranium to fuel fabrication, reprocessing and waste management.
We have expanded our precious metals business by serving industrial and retail customers. Our broad business portfolio includes the gold retail business, which focuses on the gold accumulation plan “My Gold Plan;” the precious metals business, which hinges on jewelry mail order sales and marketing to customers, in addition to jewelry fairs; and the amusement business, which highlights fine gold cards and precious metal clay. Our jewelry fairs and direct sales operations have made us one of Japan’s largest jewelry market players.
PerformanceThe energy division registered higher revenues and earnings in fiscal 2008. Sales of coal and products from the Rokkasho Reprocessing Plant were particularly favorable.
For precious metals, although sales increased, notably those of jewelry and gold plate, profits decreased due to such factors as increasing selling expenses.
Orders for nuclear power and engineering services, as well as activities to support the environment and recycling, reached ¥80.2 billion, up ¥3 billion from fiscal 2007, and the backlog of unfilled orders decreased ¥0.5 billion, to ¥35.2 billion.
Consequently, segment sales climbed 40.9% in fiscal 2008, to ¥378.7 billion. Operating profit increased 102.7%, to ¥9.5 billion.
OutlookIn the nuclear power business, the energy division will focus on nuclear fuel fabrication and radioactive waste management, and strive to raise profitability through various measures—including cost-cutting approaches and a more selective stance on new orders. Principal subsidiary Mitsubishi Nuclear Fuel will pursue business reforms and improvements, with a priority on safety and enhanced quality, while working to achieve a more streamlined, cost-efficient operating foundation.
In the geothermal and electric power business, the energy division will strive for uninterrupted operation, and consequently a stable power supply, by regularly upgrading facilities. Meanwhile, cost-cutting efforts will sharpen the division’s cost-competitive edge, particularly with regard to pricing.
In the fossil fuel business—which hinges on coal with high burning efficiency and low waste materials—the energy division aims to foster wider demand among power utilities using coal, as well as for general industrial use.
Concerning retail sales in the precious metals business, we will focus on increasing the number of members of our gold accumulation plan “My Gold Plan,” and will continue to concentrate on earning solid profits in this area. In the jewelry business, we will endeavor to improve consumer awareness of the MJC brand and expand by implementing various growth strategies. In the amusement business, we aim to actively promote development in overseas markets.
For fiscal 2008, under the affiliated corporations division, Mitsubishi Materials Techno Corp., expects to continue to enjoy brisk demand for factory construction and engineering services, which represent a founding business of the Mitsubishi Materials Group.
Others
Millions of yen Percentage change
2008 2007 2008/2007
Sales ¥378,771 ¥268,771 40.9%
Operating profit 9,594 4,733 102.7
Identifiable assets 316,511 306,280 3.3
Depreciation 3,924 3,821 2.7
Capital expenditures 3,814 4,970 -23.3
DepreciationCapital expenditures(Millions of yen)
0
1,000
2,000
3,000
4,000
5,000
2007 2008
Highlights

18
Research and Development
In fiscal 2008, Mitsubishi Materials—separately and in cooperation with consolidated subsidiaries—pursued research and development (R&D) in disciplines pertinent to each business segment. Consolidated subsidiaries also conducted independent research, geared to the business requirements and user needs characterized by the operating segment to which they belong.
R&D activities are designed to help existing businesses grow and to promote greater sophistication and enhanced leading-edge qualities in basic technology for materials, which are the foundation of the Group’s businesses. Development resources are concentrated into the three fields tapped for growth—automobiles, information electronics, and environment and recycling—and cooperation between marketing and development divisions underpins the creation of new processes and products attuned to market needs.
In fiscal 2008, R&D expenses reached ¥11,676 million. A description of major R&D activities in each operating segment is presented below.
Strengthening Core Technologies
Instrumental analytical technique in the Central Research Institute

19
CementCement-related R&D hinges on the Ube-Mitsubishi Cement Research Institute and emphasizes techniques to enhance the performance of existing products, raise the level of resource recycling technology and promote the development of downstream products.
R&D costs in the Cement segment reached ¥1,591 million in fiscal 2008.
MetalsMitsubishi Materials promotes efficient R&D through close cooperation between domestic plants and its own Central Research Institute, thereby integrating product development and manufacturing.
In copper refining R&D, efforts are currently directed toward boosting operating rates, cutting costs, providing technical support on the new furnace at the Onahama Smelter, reinforcing the recycling business and expanding production of high-performance materials.
In copper processing R&D, we emphasize manufacturing processes and new materials.R&D costs came to ¥1,309 million in fiscal 2008.
Advanced Materials & ToolsThe R&D in this segment hinges on the Central Research Institute and the Nonferrous Alloys Research & Technology Laboratory. R&D costs amounted to ¥927 million in fiscal 2008.
Electronic Materials & Components The Central Research Institute, the Technological Development Section at the Sanda Plant, the Electronic Devices R&D Center at the Ceramics Plant, the Yokkaichi Plant and Jemco Inc., are the primary participants in R&D in electronic materials, electronic devices, polycrystalline silicon and chemical products.
R&D costs in this segment represented ¥883 million of total R&D expenditures.
Aluminum BusinessMost Aluminum segment-related R&D is undertaken by the Technology Dept., and Product Development Dept., at Universal Can Corporation and the development department—namely the Automotive Development Sect., and the Technical Development Center—at Mitsubishi Aluminum Co., Ltd.
R&D costs in the Aluminum business accounted for ¥1,978 million of total R&D expenditures.
Other BusinessesEnergy-related technology development is the domain of Mitsubishi Materials’ Energy Division and includes such facilities as the Naka Energy Research Laboratory.
Complementing these technology-driven themes, the Business Incubation Department in the Corporate R&D Division at Mitsubishi Materials delves into solid oxide fuel cell technology.
R&D costs in other businesses reached ¥650 million in fiscal 2008.
In addition to segment-based R&D, the Central Research Institute explores the potential of material-based technologies in the development of energy-related and resource-conserving products, processes and businesses—especially in the field of automobiles, information electronics, and the environment and recycling industries. Notable topics are highlighted below:
Automobiles • Direct brazed aluminum circuit boards for next-generation hybrid cars• Automotive devices
Information Electronics • Nanolevel thin-film formation technology and nanoparticle compounding technology, and application development of these
technologies• Next-generation wiring materials
Environment and Recycling • Waste treatment technology• Environmental cleanup technology• Valuable resource recovery process
The Central Research Institute also uses CAE technology to analyze reaction processes, fabrication processes and product design, to accelerate development and enhance efficiency in the pursuit of innovation.
R&D costs in these activities accounted for ¥4,334 million of total R&D expenditures in fiscal 2008.
20
CSR Promotion Structure
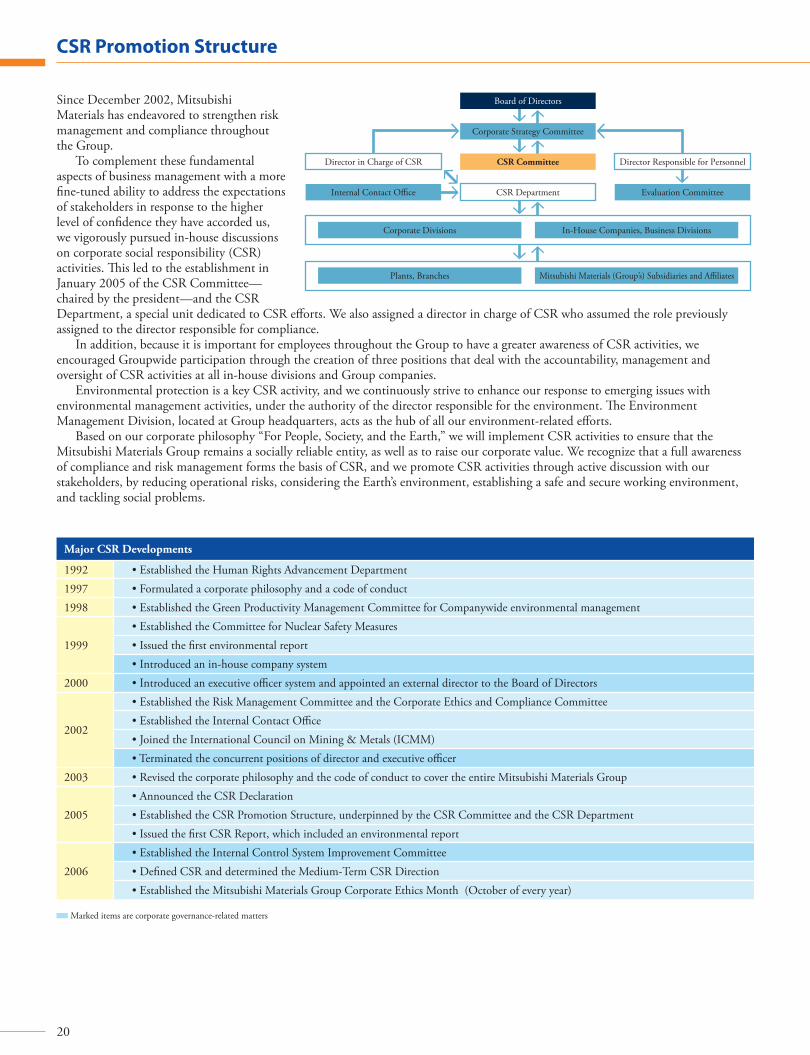
Since December 2002, Mitsubishi Materials has endeavored to strengthen risk management and compliance throughout the Group.
To complement these fundamental aspects of business management with a more fine-tuned ability to address the expectations of stakeholders in response to the higher level of confidence they have accorded us, we vigorously pursued in-house discussions on corporate social responsibility (CSR) activities. This led to the establishment in January 2005 of the CSR Committee—chaired by the president—and the CSR Department, a special unit dedicated to CSR efforts. We also assigned a director in charge of CSR who assumed the role previously assigned to the director responsible for compliance.
In addition, because it is important for employees throughout the Group to have a greater awareness of CSR activities, we encouraged Groupwide participation through the creation of three positions that deal with the accountability, management and oversight of CSR activities at all in-house divisions and Group companies.
Environmental protection is a key CSR activity, and we continuously strive to enhance our response to emerging issues with environmental management activities, under the authority of the director responsible for the environment. The Environment Management Division, located at Group headquarters, acts as the hub of all our environment-related efforts.
Based on our corporate philosophy “For People, Society, and the Earth,” we will implement CSR activities to ensure that the Mitsubishi Materials Group remains a socially reliable entity, as well as to raise our corporate value. We recognize that a full awareness of compliance and risk management forms the basis of CSR, and we promote CSR activities through active discussion with our stakeholders, by reducing operational risks, considering the Earth’s environment, establishing a safe and secure working environment, and tackling social problems.
Major CSR Developments
1992 • Established the Human Rights Advancement Department1997 • Formulated a corporate philosophy and a code of conduct1998 • Established the Green Productivity Management Committee for Companywide environmental management
1999• Established the Committee for Nuclear Safety Measures• Issued the first environmental report• Introduced an in-house company system
2000 • Introduced an executive officer system and appointed an external director to the Board of Directors
2002
• Established the Risk Management Committee and the Corporate Ethics and Compliance Committee• Established the Internal Contact Office• Joined the International Council on Mining & Metals (ICMM)• Terminated the concurrent positions of director and executive officer
2003 • Revised the corporate philosophy and the code of conduct to cover the entire Mitsubishi Materials Group
2005• Announced the CSR Declaration• Established the CSR Promotion Structure, underpinned by the CSR Committee and the CSR Department• Issued the first CSR Report, which included an environmental report
2006• Established the Internal Control System Improvement Committee• Defined CSR and determined the Medium-Term CSR Direction• Established the Mitsubishi Materials Group Corporate Ethics Month (October of every year)
Marked items are corporate governance-related matters
Internal Contact Office
Corporate Divisions In-House Companies, Business Divisions
Plants, Branches Mitsubishi Materials (Group’s) Subsidiaries and Affiliates
Board of Directors
Corporate Strategy Committee
CSR Committee
CSR Department Evaluation Committee
Director in Charge of CSR Director Responsible for Personnel
21
Corporate Governance
Mitsubishi Materials established its Code of Conduct in 1997 to govern the actions of all employees and officers and ensure strict compliance with applicable laws and ordinances as a good corporate citizen. We applied the Code of Conduct to the entire Group in 2003 as part of efforts to sustain growth through fair practices, while maximizing corporate value. Efficient and transparent management is essential to realizing these objectives, which is why we have steadily strengthened corporate governance over the years.
The Board of Directors comprises nine internal directors and one independent external director. We consider this structure appropriate for expediting decisions and ensuring management objectivity and transparency. Supporting the Board of Directors is the Corporate Strategy Committee, containing the president and several directors, who assess matters for subsequent deliberation to reinforce appropriate decision-making processes. The external director has no business relationships with, or any other special interests in, the Company.
The Company is an integrated organization with four core businesses—Cement, Metals, Advanced Materials & Tools, and Electronic Materials & Components. Executive officer and internal company systems oversee these businesses to promote flexibility and ensure appropriate execution of business activities. When launching our new medium-term management plan in April 2007, management appointed directors and executive officers to head these internal companies and implemented a system to facilitate the execution of business activities, based on the decisions of the Board of Directors.
The Board of Corporate Auditors is made up of three standing corporate auditors, one of whom is external, and one part-time auditor. Each auditor attends all Board of Directors’ meetings and other important gatherings—in keeping with internal auditing policies and plans for the relevant fiscal period, based on standards determined by the Board of Corporate Auditors. Auditors monitor the work of directors, the Internal Audit Department and other in-house control bodies. They also inspect important approval documents, and assess operations and assets at headquarters and key business sites. When necessary, auditors also undertake audits of subsidiaries and chart the progress of directors in fulfilling their tasks. Auditors meet regularly with the standing corporate auditors of major Group companies to reinforce coordination of the auditing structure for Group management.
The Auditors Office was established with staff who support the auditors in the execution of their tasks. The Internal Audit Department has 16 members of staff who undertake internal audits of headquarter divisions, in-house companies
and Group affiliates. They identify the effectiveness and efficiency of corporate activities, the reliability of fiscal reports, the status and effective utilization of available assets, the status of risk management efforts and the adherence to both the law and to in-house rules and standards.
The Company appoints auditors in keeping with the Company Law, and chose KPMG AZSA & Co., as the independent auditor responsible for its accounting audits, as required by the Financial Instruments and Exchange Law. This auditing firm designated three certified public accountants to audit the Company’s books—Kenji Sakurai (five consecutive years of auditing the Company), Yoshiaki Uesaka (six consecutive years of auditing the Company) and Kentaro Yamamoto (one year of auditing the Company). These accounting auditors are assisted by six certified public accountants, three junior accountants and 14 other assistants.
Corporate auditors and the Internal Audit Department discuss internal auditing plans at the beginning of each fiscal term, meet regularly to exchange information and opinions regarding audit results and, through such communication, strive to ensure the efficiency of audits. In addition, corporate auditors discuss annual auditing plans with accounting auditors, regularly share information and reports on the results of audits, and communicate closely to execute audits.
In December 2002, we established the Risk Management Committee and the Corporate Ethics and Compliance Committee to advance Groupwide risk management and compliance.
In January 2005, we reinforced our CSR efforts by integrating the Risk Management Committee and the Corporate Ethics and Compliance Committee, and by setting up the CSR Committee, which the president chairs. We also opened the CSR Office, appointed CSR officials at internal businesses and subsidiaries, and pushed ahead with Groupwide initiatives.
It is essential to maintain proper corporate governance systems so we can fulfill business objectives and management plans. We aim to enhance our systems by establishing and maintaining internal rules and by employing a structure that complies with the Company Law and its implementation regulations.
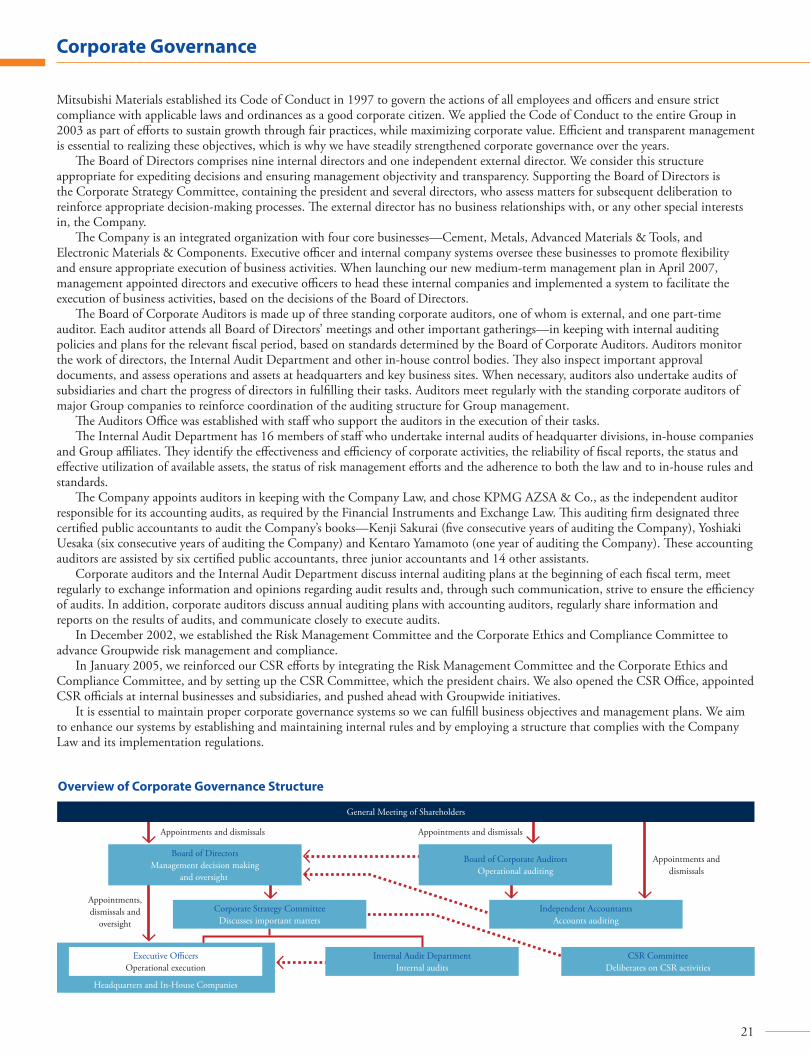
Overview of Corporate Governance Structure
Appointments and dismissals
Appointments,dismissals and
oversight
Appointments and dismissals
Appointments anddismissals
Board of DirectorsManagement decision making
and oversight
Board of Corporate AuditorsOperational auditing
General Meeting of Shareholders
Independent AccountantsAccounts auditing
Corporate Strategy CommitteeDiscusses important matters
Internal Audit DepartmentInternal audits
CSR CommitteeDeliberates on CSR activities
Executive OfficersOperational execution
Headquarters and In-House Companies

22
Management (As of June 27, 2008)
Akihiko Ide*President
Hiroshi Kanemoto*Managing Director
Akira NishikawaDirector and Executive Adviser
Senior Executive Officers Makoto MikiKimball McCloudTakeshi Itaba
Executive Officers
Masanori HirayamaNaoki UchiyamaYoshiaki InabaMasayuki MinagawaAkira TakeuchiYoshinori InabaNozomu ItoMasaharu KuboYoichi FujitsukaHiroshi NakaharaMasatoshi Hanzawa
Masayuki HirotaToshikazu MuraiAkio HamajiTakashi ShimizuHideo KobayashiShinichiro KobayashiToshio TakizawaTetsuo KasukawaTetsuro EguchiMakoto YanoTsutomu TakahashiKeisuke YamanobeKatsuhiko Masuda
Corporate Auditors (Standing) Nobuaki NaitoTakao WadaFumio Shimada
Corporate Auditor
Akio Utsumi†
*Member of the Corporate Strategy Committee†External
Hiroo Kiyokawa*Executive Vice President
Hironori Yoshimura*Managing Director
Yukio Okamoto†Director
Hisayoshi Honma*Executive Vice President
Yoichi Taguchi*Managing Director
Mayuki Hashimoto*Managing Director
Toshinori Kato*Managing Director

Eleven-Year Summary 24Management’s Discussion and Analysis of Financial Condition and Results of Operations 26Consolidated Statements of Income 31Consolidated Balance Sheets 32Consolidated Statements of Shareholders’ Equity 35Consolidated Statements of Changes in Net Assets 37Consolidated Statements of Cash Flows 39Notes to Consolidated Financial Statements 41Independent Auditors’ Report 99
Contents
23
Financial Section

Eleven-Year SummaryMitsubishi Materials Corporation and SubsidiariesYears ended March 31
2008 2007 2006 2005 2004For the Year: Net sales ¥1,659,286 ¥1,452,108 ¥1,143,700 ¥984,777 ¥948,238 Cost of sales 1,425,526 1,246,261 953,084 812,544 783,971 Operating profit 100,146 78,758 68,982 54,085 43,422 Net income (loss) 74,268 71,382 58,803 16,374 (5,324) Depreciation and amortization 57,722 50,135 47,454 48,085 49,401 Gross cash flow 131,991 121,518 106,257 64,459 44,077 R&D expenses 11,676 11,112 10,859 10,449 11,232Balance at End of Year: Total assets 1,856,276 1,773,899 1,609,446 1,420,825 1,435,115 Total long-term liabilities 485,718 475,393 474,664 466,771 519,594 Total net assets 520,289 481,970 303,560 196,902 183,886 Number of shares of common stock (thousands) 1,278,955 1,252,092 1,147,918 1,134,054 1,134,054
2008 2007 2006 2005 2004Per Share Amounts: Basic net income (loss) ¥59.1 ¥60.3 ¥51.7 ¥14.4 ¥(4.8) Diluted net income – 57.1 45.4 12.9 – Cash dividends applicable to the year 8.0 6.0 4.0 3.0 2.0Ratios: Return on assets (ROA) 4.0% 4.0% 3.7% 1.2% –0.4% Return on equity (ROE) 14.3% 14.8% 19.4% 8.3% –3.0%
Notes: Japanese yen amounts have been translated into U.S. dollars, solely for the convenience of the reader, at the rate of ¥100.19 to U.S.$1, the prevailing exchange rate at March 31, 2008. Effective from the year ended March 31, 2007, the Company and its consolidated subsidiaries adopted, “Accounting Standard for Presentation of Net Assets in the Balance Sheet.” Except
2007, “Total Net Assets” means “Total Shareholders’ Equity” which is pursuant to the previous presentation rules.
24
Net Sales
0
200
400
600
800
1,000
1,200
1,400
1,600
1,800
2004 2005 2006 2007 2008
(Billions of yen)
Operating ProfitOperating Margin
0
25
50
75
100
0
2
4
6
8
2004 2005 2006 2007 2008
(Billions of yen) (%) (%)
Net Income (Loss) Return on Equity (ROE)
-10
0
10
20
30
40
50
60
70
80
-3
0
3
6
9
12
15
18
21
24
2004 2005 2006 2007 2008
(Billions of yen)
Gross Cash Flow
0
20
40
60
80
100
120
140
2004 2005 2006 2007 2008
(Billions of yen)

Thousands of U.S. dollars Millions of yen (Note 1)
2003 2002 2001 2000 1999 1998 2008
¥964,726 ¥1,046,807 ¥1,144,068 ¥986,884 ¥983,784 ¥1,196,008 $16,561,397 807,308 899,220 936,563 825,097 830,129 981,916 14,228,234 34,429 10,872 65,827 27,229 10,405 56,744 999,570 (26,854) (61,316) 7,149 (12,075) (34,853) 10,071 741,279 54,457 78,436 79,557 74,592 74,038 80,575 576,131 27,603 17,120 86,706 62,517 39,185 90,646 1,317,410 11,608 15,404 15,437 14,762 17,830 18,401 116,544
1,439,985 1,575,739 1,615,844 1,671,000 1,605,671 1,679,207 18,527,567 555,467 572,071 509,187 603,096 580,446 534,378 4,847,975 174,381 206,413 239,190 231,559 243,356 312,386 5,193,025 1,134,054 1,117,314 1,117,314 1,117,314 1,117,314 1,134,153
U.S. dollars Yen (Note 1)
2003 2002 2001 2000 1999 1998 2008
¥(23.9) ¥(54.9) ¥6.4 ¥(10.8) ¥(30.9) ¥8.9 $0.59 – – 6.1 – – 8.4 – – – 3.0 1.5 – 5.0 0.07
–1.8% –3.9% 0.4% –0.7% –2.1% 0.6% –14.1% –27.5% 3.0% –5.1% –12.5% 3.2%
25
Total Assets
0
250
500
750
1,000
1,250
1,500
1,750
2,000
2004 2005 2006 2007 2008
(Billions of yen)
Total Long-Term Liabilities
0
100
200
300
400
500
600
2004 2005 2006 2007 2008
(Billions of yen) (%)
Total Net Assets (Shareholders’ Equity) Equity Ratio
0
100
200
300
400
500
600
0
5
10
15
20
25
30
2004 2005 2006 2007 2008
(Billions of yen)

Overview
In fiscal 2008, ended March 31, 2008, the global economy maintained a trend of modest expansion—as the European economy was stable and the Chinese economy expanded strongly, mainly in the area of capital investment—despite the difficulties related to mortgages for individuals with lower credit ratings, a result of the subprime loans crisis, leading to a slowdown of the U.S. economy. For the Japanese economy in the fiscal year under review, there was increasing concern over the slower economic growth—due to the surge in oil prices, a sluggish stock market, the appreciation of the yen and the subprime loan problem. However, capital investment was stable because of the recovery of corporate earnings, the employment condition showed signs of recovery and the level of consumer spending was firm, all of which brought a modest upward trend in the overall economy. Despite factors that negatively affected profitability, such as a decline in demand for cement and rising raw material and fuel prices, the Mitsubishi Materials Group continued to perform well overall—reflecting high prices for core materials, such as copper, and strong demand from customers in the automobiles, information and electronics, and silicon sectors. In the R&D area, the Group concentrated its business resources in three growth fields to promote the development of new products based on the needs of the market. Thanks to integrated business management, which established a system for stable profits, in fiscal 2008 the Group recorded consolidated sales of ¥1,659,286 million, up 14.3% from fiscal 2007, and consolidated operating profit of ¥100,146 million, up 27.2% from the previous year. Consolidated net income increased by 4.0% from the last fiscal year to ¥74,268 million, as we recorded special profit from the sale of investable securities, while also recording extraordinary loss, due to the Provision for waste management cost. As a result, the Group reached historic highs in consolidated net sales, consolidated operating profit, and consolidated net income.
Sales and Operating Profit by Business Segment
CementSales and profits in the Cement business decreased due to rising fuel prices and the decline in domestic demand—a product of the widespread delays in construction approval for houses and buildings, following the enforcement of the revised Building Standards Law. Although there was a strong demand from Australia and South Asia, the demand in the United States was sluggish due to the subprime mortgage crisis, a problem that affected the performance of this segment as a whole. Production volume of the Cement business remained at 14 million tons, the same as last fiscal year.Furthermore, aggregate sales and profits decreased because the demand for mainline Portland cement was poor, due to widespread delays in construction approval for houses and buildings. Segment sales decreased ¥13.2 billion, to ¥185.0 billion. Operating profit was down ¥4.4 billion, to ¥13.9 billion.
MetalsCopper cathode sales and profits increased, thanks to higher copper prices and favorable operations at PT. Smelting in Indonesia. The volume of manufactured electrolytic copper in this segment increased 56 thousand tons, to 602 thousand tons. Sales and profits of processed copper products increased, due to a stable demand for copper balls for substrate coating and a positive contribution from Mitsubishi Shindoh Co., Ltd.,—a consolidated company since October 2006— despite a sluggish demand for processed copper for copper pipes and sheets and wirerod, again a result of higher copper prices. Segment sales rose ¥85.5 billion, to ¥684.4 billion. Operating profit was up ¥12.6 billion, to ¥46.0 billion.
Advanced Materials & ToolsWhile domestic demand for cemented carbide products decreased, because of sluggish sales for die assembly products and reduced capital investment in the automotive industry, there was continued strong overseas demand—mainly from BRICs such as China and India, as well as favorable increase in demand from Europe in general—which contributed to the increase in sales and profits. Sales and profits from powder metallurgy products increased due to steady automotive-related demand. In high-performance alloy products, sales were up as a result of a steady rise in demand for products for major markets such as aircraft, gas turbines, and automobiles, as well as for the electronics market. However, profits were affected negatively by higher raw material prices. Segment sales increased ¥11.9 billion, to ¥150.0 billion. Operating profit was up ¥3.1 billion, to ¥19.3 billion.
Management’s Discussion and Analysis of Financial Condition and Results of OperationsMitsubishi Materials Corporation and Consolidated Subsidiaries
Thousands of Percentage Millions of yen U.S. dollars change
For the years ended March 31 2008 2007 2008 (2008/2007)Net sales ¥1,659,286 ¥1,452,108 $16,561,397 14.3%Operating profit 100,146 78,758 999,570 27.2%Net income 74,268 71,382 741,279 4.0%
Percentage
Yen U.S. dollars change
For the years ended March 31 2008 2007 2008 (2008/2007)Basic net income per share ¥ 59.1 ¥60.3 $0.59 –1.9%Diluted net income – 57.1 – –
26

Electronic Materials & ComponentsSales and profits were up in advanced materials, thanks to steady growth in demand for semiconductors and automotive products. In electronics devices, sales and profits decreased as the decline in sales revenues of consolidated overseas subsidiaries offset the increase of sales of products such as car antennas. Sales and profits of polycrystalline silicon increased, aided by expansion in the production capacity of the U.S.-located Mitsubishi Polycrystalline Silicon America Corporation. Furthermore, expansion of the semiconductor market, involving products such as 300mm silicon wafers and active solar batteries, also led to favorable sales. Segment sales, therefore, increased ¥6.5 billion, to ¥91.7 billion, with a gain in operating profit of ¥3.9 billion, totaling ¥14.3 billion.
AluminumSales and profits of aluminum cans increased, as both sales revenue and sales volume were up from the last fiscal year. The upward revision of sales prices—triggered by a rise of raw material prices—partly succeeded in raising profits, complemented by a steady sales growth of regular aluminum cans in general. Sales revenue from rolled aluminum and processed aluminum products increased due to a rise of raw material prices. However, despite an increase in sales, profits decreased primarily due to a decline in sales volume in sheet aluminum for the printing industry. Segment sales were up ¥6.3 billion, to ¥169.1 billion. Operating profit rose ¥2.4 billion, to ¥5.3 billion.
OthersEnergy, sales and profits were up due to a steady sales growth of coal and products from the Rokkasho Reprocessing Plant. For precious metals, although sales were up, most notably those of jewelry and gold plate, profits decreased due to such factors as increasing selling expenses. The amount of orders from nuclear- and engineering-related businesses, along with environmental and recycling and related businesses, totaled ¥80.2 billion, up ¥3 billion, and backlog of the orders amounted to ¥35.2 billion, down ¥0.5 billion.
Thousands of Millions of yen U.S. dollars
For the years ended March 31 2008 2007 2008Cement Sales ¥185,074 ¥198,288 $1,847,236 Operating profit 13,925 18,335 138,992 Operating margin 7.5% 9.2% Metals Sales 684,497 598,921 6,831,989 Operating profit 46,053 33,395 459,660 Operating margin 6.7% 5.6% Advanced Materials & Tools Sales 150,040 138,095 1,497,558 Operating profit 19,311 16,114 192,752 Operating margin 12.9% 11.7% Electronic Materials & Components Sales 91,759 85,189 915,853 Operating profit 14,334 10,388 143,074 Operating margin 15.6% 12.2% Aluminum Sales 169,143 162,841 1,688,227 Operating profit 5,330 2,849 53,208 Operating margin 3.2% 1.7% Others Sales 378,771 268,771 3,780,532 Operating profit 9,594 4,733 95,758 Operating margin 2.5% 1.8%
27

Sales and Operating Profit by Geographic Segment
JapanThe market environment was a positive one, characterized by higher prices for copper and a wider demand for cemented carbide products and electronic materials and components. Consequently, domestic sales grew ¥185.3 billion, to ¥1,401.4 billion, and operating profit rose ¥12.0 billion, to ¥75.0 billion. United StatesSales of cement used in the construction of homes decreased, while sales of polycrystalline silicon and cemented carbide products increased. As a result, sales in this market totaled ¥83.8 billion, down ¥1.9 billion, while operating profit expanded ¥1.0 billion, to ¥14.6 billion. EuropeSales of cemented carbide products for automotive applications were favorable, contributing to regional sales of ¥22.1 billion, climbing ¥5.1 billion, and operating profit of ¥2.1 billion, a rise of ¥1.0 billion. Asia, excluding JapanThe impact of reduced production in fiscal 2007, primarily because of facility problems at an oxygen supplier for PT. Smelting in Indonesia, hurt sales. However, with operations returning to a steady schedule in fiscal 2008, sales of copper cathode and other metals showed considerable improvement. Consequently, sales from operations in Asia, excluding Japan, reached ¥149.4 billion, a dramatic increase of ¥19.6 billion, and operating profit climbed ¥8.5 billion, to ¥16.1 billion.
Financial Position and LiquidityAt the end of March 2008, total assets stood at ¥1,856.2 billion, up ¥82.3 billion, or 4.6%, from a year earlier. Total current assets reached ¥775.1 billion, up ¥74.7 billion, or 10.7%, year on year—owing to such factors as higher cash and deposits and high inventory assets caused by the skyrocketing price of major metal prices, including that of copper. Total fixed assets edged up ¥7.6 billion, or 0.7%, to ¥1,081.1 billion, largely due to an increase in investments in securities. Total liabilities inched up ¥44.0 billion, or 3.4%, to ¥1,335.9 billion. Total current liabilities rose ¥33.7 billion, or 4.1%, to ¥850.2 billion, as higher gold prices caused gold bullion deposited by customers under the Company’s “My Gold plan” to expand. Long-term liabilities amounted to ¥485.7 billion, up ¥10.3 billion, or 2.2%, reflecting such factors as additions to the reserve for waste management cost and the elimination of deferred tax assets caused by reassessment. The balance of interest-bearing debt, which includes loans, bonds and commercial paper, stood at ¥690.3 billion, just ¥5.1 billion, or 0.7%, more than at the end of March 2007. Total net assets came to ¥520.2 billion, up ¥38.3, or 8.0%, from the previous year, as higher net income buoyed retained earnings and overshadowed lower unrealized holding gains on securities. Given these changes, the consolidated equity ratio improved to 25.0%, from 23.2%, and shareholders’ equity per share grew to ¥362.45, from ¥329.35.
Thousands of Millions of yen U.S. dollars
For the years ended March 31 2008 2007 2008Japan Sales ¥1,401,417 ¥1,216,099 $13,987,597 Operating profit 75,013 62,926 748,716 Operating margin 5.4% 5.2% U.S.A. Sales 83,879 85,866 837,207 Operating profit 14,603 13,542 145,760 Operating margin 17.4% 15.8% Europe Sales 22,166 17,065 221,247 Operating profit 2,177 1,097 21,729 Operating margin 9.8% 6.4% Asia, excluding Japan Sales 149,449 129,823 1,491,658 Operating profit 16,162 7,590 161,317 Operating margin 10.8% 5.8% Others Sales 2,373 3,253 23,686 Operating profit 285 863 2,847 Operating margin 12.0% 26.5%
At March 31 2008 2007 2006Equity ratio 25.0% 23.2% 18.9%
28

Cash Flows Net cash provided by operating activities amounted to ¥154.1 billion, an increase of ¥36.4 billion. Although there was a rise in cash outflow, due to the increase of inventory—which was pushed further by a surge in the price of metals and the purchases of gold bullion from market for customers under “My Gold Plan”—this was offset by a favorable business performance and an increase in dividends received. Net cash used in investing activities totaled ¥110.9 billion, an increase of ¥36.1 billion, due to the acquisition of securities and expenditures-related capital investment. Net cash provided by financing activities amounted to ¥3.0 billion, an increase of ¥6.4 billion, owing to cash procurements by issuing corporate bonds and commercial paper, and also repayments of short-term bank loans and paid dividends. As a result, the balance of cash and cash equivalents at the end of the fiscal year was ¥109.3 billion, up ¥42.0 billion from the previous year.
Capital ExpendituresCapital expenditures for the Group are tempered by the need to limit interest-bearing debt and therefore the content of such plans is determined through careful concentration of investments in business areas offering high profit and growth potential. In fiscal 2008, capital expenditures amounted to ¥75.6 billion, reflecting maintenance and upgrades at existing facilities in each business segment as well as expansion, rationalization and renovation at production facilities. Capital expenditures by business segment were as follows:Cement : In Japan, the Company installed new thermal power facilities and expanded industrial waste processing facilities. Emphasis was also placed on maintenance and repair work at existing facilities, especially in Japan and the United States. Capital expenditures in this segment were ¥16.6 billion.Metals : In Japan, funds were applied to the expansion of facilities for copper refining and for precious metal recycling and to maintenance and repair work at existing facilities. Capital expenditures in this segment were ¥25.9 billion.Advanced Materials & Tools : The Company expanded its facilities to accommodate increased orders, especially from the automotive sector, and maintained and repaired existing facilities. Capital expenditures in this segment were ¥11.4 billion. Electronic Materials & Components : Polycrystalline silicon facilities in Japan and the United States were expanded, and existing facilities were maintained and repaired. Capital expenditures in this segment were ¥9.6 billion. Aluminum : Funds were primarily directed toward the expansion of facilities for rolled aluminum products. Existing facilities were maintained and repaired. Segment capital expenditures were ¥6.7 billion.Other : Existing facilities were maintained and repaired. Capital expenditures in this segment were ¥5.1 billion.
Outlook for Fiscal 2009, Ending March 31, 2009The prospects for the global economy are uncertain, due to the current turmoil of the financial and capital markets and concern about the slowdown of the U.S. economy. However, we can expect support from the steady demand from BRICs. We also have seen further uncertainty in the Japanese economy. Exports show signs of decreasing and domestic demand is sluggish—a consequence of a weaker global economy resulting from the slowdown in the U.S. economy. Although the business environment in which the Group operates will be likely to maintain favorable trends in the areas of automotive and silicon related products, the slowdown of the U.S. economy, in addition to the deterioration of copper mining purchase conditions, continuing high prices of raw materials and fuel, and the further appreciation of the yen, may adversely impact on the product demand-supply situation. In such circumstances, the Group aims to establish a business base for achieving more than ¥100 billion of earnings steadily under the medium-term management plan, and will implement various measures to achieve its goal. Accordingly, consolidated net sales, ordinary income, and net income for the next fiscal year are expected to be ¥1,527 billion, ¥100 billion, and ¥50 billion, respectively.
Business RisksThe companies under the Mitsubishi Materials Group umbrella, hereafter collectively referred to as “the Group,” are involved in a wide range of businesses. Consequently, various external influences—including domestic and overseas political and economic developments, weather, markets, currency trends, and laws and ordinances—could influence the Group’s fiscal performance and financial position. The following risks carry the potential for particularly significant impact on operations. Forward-looking statements in this section are based on information available to management as of the date June 27, 2008, on which the Company released the business report Yukashoken Hokokusho as required of all listed companies in Japan.
1. Business RestructuringManagement subscribes to the selection-and-concentration approach for business expansion, whereby management resources are actively invested in operations with high profitability. Management also considers alliances with other companies, if such alliances will facilitate the rigorous review, restructuring and liquidation of operations to reinforce the bottom line. This emphasis could affect the Group’s fiscal performance and financial position.
2. Market and Customer TrendsThe Group provides products and services to various industries. Worldwide economic developments as well as customer-driven developments—such as sudden changes in markets and market shares, new business strategies and product development initiatives—may influence sales of the Group’s products. The automotive and IT sectors are subject to particularly severe price wars and competition on the technological front. The Group strives to cut overall costs and engineer new products and technologies. However, if these efforts do not accurately match industry and customer market changes, the Group’s fiscal performance and financial position could be eroded.
Millions of yen Thousands of U.S. dollars
For the years ended March 31 2008 2007 2006 2008Gross cash flow ¥131,991 ¥121,518 ¥106,257 $1,317,410
29

3. Fluctuations in Nonferrous Metal and Currency MarketsIn the copper business, the Group’s key revenue sources are smelting and other operations for which payment is in foreign currencies. Consequently, these operations are susceptible to fluctuations in the nonferrous metal and currency markets and the effects of custom ore purchasing conditions. The cost of raw materials acquired for inventory carries the risk of fluctuating nonferrous metal prices and exchange rates over the period starting with the purchase of the ore and ending with cathode production and sales. In addition, nonferrous metal materials—used predominantly by Aluminum and Advanced Materials & Tools—as well as materials, particularly coal, used by Cement, are international commodities. The procurement prices of these raw materials, as well as fuels, are linked to changes in the nonferrous metal and coal markets, currency markets, and also maritime freight rates.
4. Trends in the Semiconductor MarketCertain members of the Group supply the semiconductor industry with such products as electronic materials and components and polycrystalline silicon, while SUMCO CORPORATION—an equity-method affiliate—makes silicon wafers used in semiconductor fabrication. Trends in the semiconductor market could influence the operations of these companies and thus the fiscal results and financial position of the Group.
5. Interest-Bearing DebtAs of March 31, 2008, the interest-bearing debt carried by the Group stood at ¥690.3 billion—comprising short-term loans, bonds due within one year, commercial paper, bonds and long-term loans—and represented 37.2% of consolidated total assets. Management seeks to improve the balance sheet of the Group by restricting inventories and divesting assets, but unfavorable trends in interest rates could hurt the fiscal results and financial position of the Group.
6. Debt GuaranteesIn fiscal 2008, Mitsubishi Materials extended debt guarantees totaling ¥25.2 billion mainly to unconsolidated affiliates. If conditions warranted the fulfillment of debt guarantees, the outflow of capital could affect the fiscal results and financial position of the Group.
7. Fluctuations in the Market Value of AssetsFluctuations in the market value of securities, land and other assets held by members of the Group could have a detrimental impact on the fiscal results and financial position of the Group.
8. Pension Benefit Expenses and ObligationsThe costs and obligations of the Group’s pension plans for employees are based on actuarial assumptions. These assumptions take into account the average number of years of service remaining, long-term yields on Japanese government bonds, stock contributed to trust accounts and other factors in pension plan management. However, losses stemming from lower discount rates and pension plan management could influence future Group costs and the calculation of obligations.
9. Environmental RegulationsAll Group locations in Japan and overseas strive to prevent pollution, especially air, wastewater, soil and groundwater pollution, in accordance with local environmental legislation. Efforts are also made to prevent pollution from inactive mines in Japan, in accordance with the Mine Safety Law. This focuses on neutralizing the water that seeps into excavation pits from tunnels and the safe maintenance of tailing piles. However, the revision of related laws could lead to new maintenance and treatment costs.
10. Overseas ActivitiesThe Group maintains production and sales bases in 25 countries and regions. Overseas operations account for 34.6% of consolidated net sales. In addition to varying economic circumstances and currency status, unforeseen changes in laws and regulations—or their interpretations related to trade rules and restrictions, mining sector policies, environmental regulations and tax systems in these countries—could affect the Group’s fiscal performance and financial position.
11. Intellectual PropertyManagement recognizes the importance of intellectual property and steps are taken throughout the Group to safeguard such assets. However, the fiscal performance and financial position of the Group could be hurt by inadequate protection and legal infringement of proprietary intellectual assets. From the opposite perspective, the Group duly respects the intellectual property of other companies, but in the unlikely event that a member of the Group is found to have infringed upon the rights of another company, the subsequent compensation for damages could negatively impact the fiscal results and financial position of the Group.
12. Product QualityThe Group strives to provide high-quality products and makes every effort to control quality. In addition, the Group carries insurance as a precaution in the unlikely event that a serious product defect leads to liability issues. However, a large-scale product recall prompted by unforeseen circumstances, for example, could mar the fiscal performance and financial position of the Group.
13. Information ManagementThe Group endeavors to properly control information, including personal data. However, in the unlikely event that the unauthorized disclosure of information was to occur, such a situation could damage the Group’s social standing, which could negatively impact the Group’s results and financial position.
14. LitigationThe Group is or could become involved in decisions, settlements or legal judgments stemming from litigation, disputes and other legal proceedings related to present or past operations in Japan or overseas, which could adversely affect the Group’s results and financial position.
15. Other RisksOther risks that may affect the Group’s results and financial position include changes in business practices, events such as terrorism, war, epidemics, earthquakes and other natural disasters, and other unforeseen developments.
30
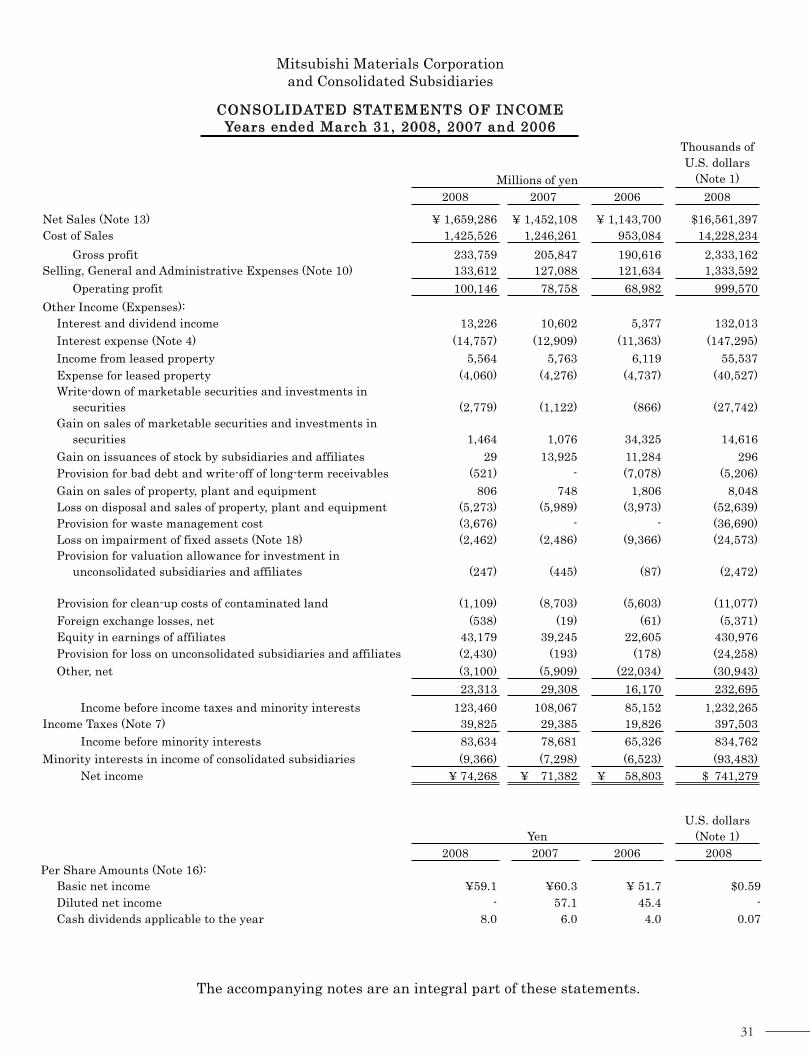
The accompanying notes are an integral part of these statements.
-7-
Millions of yen
Thousands of
U.S. dollars
(Note 1)
2008 2007 2006 2008
Net Sales (Note 13) ¥ 1,659,286 ¥ 1,452,108 ¥ 1,143,700 $16,561,397
Cost of Sales 1,425,526 1,246,261 953,084 14,228,234
Gross profit 233,759 205,847 190,616 2,333,162
Selling, General and Administrative Expenses (Note 10) 133,612 127,088 121,634 1,333,592
Operating profit 100,146 78,758 68,982 999,570
Other Income (Expenses):
Interest and dividend income 13,226 10,602 5,377 132,013
Interest expense (Note 4) (14,757) (12,909) (11,363) (147,295)
Income from leased property 5,564 5,763 6,119 55,537
Expense for leased property (4,060) (4,276) (4,737) (40,527)
Write-down of marketable securities and investments in
securities (2,779) (1,122) (866) (27,742)
Gain on sales of marketable securities and investments in
securities 1,464 1,076 34,325 14,616
Gain on issuances of stock by subsidiaries and affiliates 29 13,925 11,284 296
Provision for bad debt and write-off of long-term receivables (521) - (7,078) (5,206)
Gain on sales of property, plant and equipment 806 748 1,806 8,048
Loss on disposal and sales of property, plant and equipment (5,273) (5,989) (3,973) (52,639)
Provision for waste management cost (3,676) - - (36,690)
Loss on impairment of fixed assets (Note 18) (2,462) (2,486) (9,366) (24,573)
Provision for valuation allowance for investment in
unconsolidated subsidiaries and affiliates (247) (445) (87) (2,472)
Provision for clean-up costs of contaminated land (1,109) (8,703) (5,603) (11,077)
Foreign exchange losses, net (538) (19) (61) (5,371)
Equity in earnings of affiliates 43,179 39,245 22,605 430,976
Provision for loss on unconsolidated subsidiaries and affiliates (2,430) (193) (178) (24,258)
Other, net (3,100) (5,909) (22,034) (30,943)
23,313 29,308 16,170 232,695
Income before income taxes and minority interests 123,460 108,067 85,152 1,232,265
Income Taxes (Note 7) 39,825 29,385 19,826 397,503
Income before minority interests 83,634 78,681 65,326 834,762
Minority interests in income of consolidated subsidiaries (9,366) (7,298) (6,523) (93,483)
Net income ¥ 74,268 ¥ 71,382 ¥ 58,803 $ 741,279
Yen
U.S. dollars
(Note 1)
2008 2007 2006 2008
Per Share Amounts (Note 16):
Basic net income ¥59.1 ¥60.3 ¥ 51.7 $0.59
Diluted net income - 57.1 45.4 -
Cash dividends applicable to the year 8.0 6.0 4.0 0.07
Mitsubishi Materials Corporation and Consolidated Subsidiaries
CONSOLIDATED STATEMENTS OF INCOMEYears ended March 31, 2008, 2007 and 2006
31
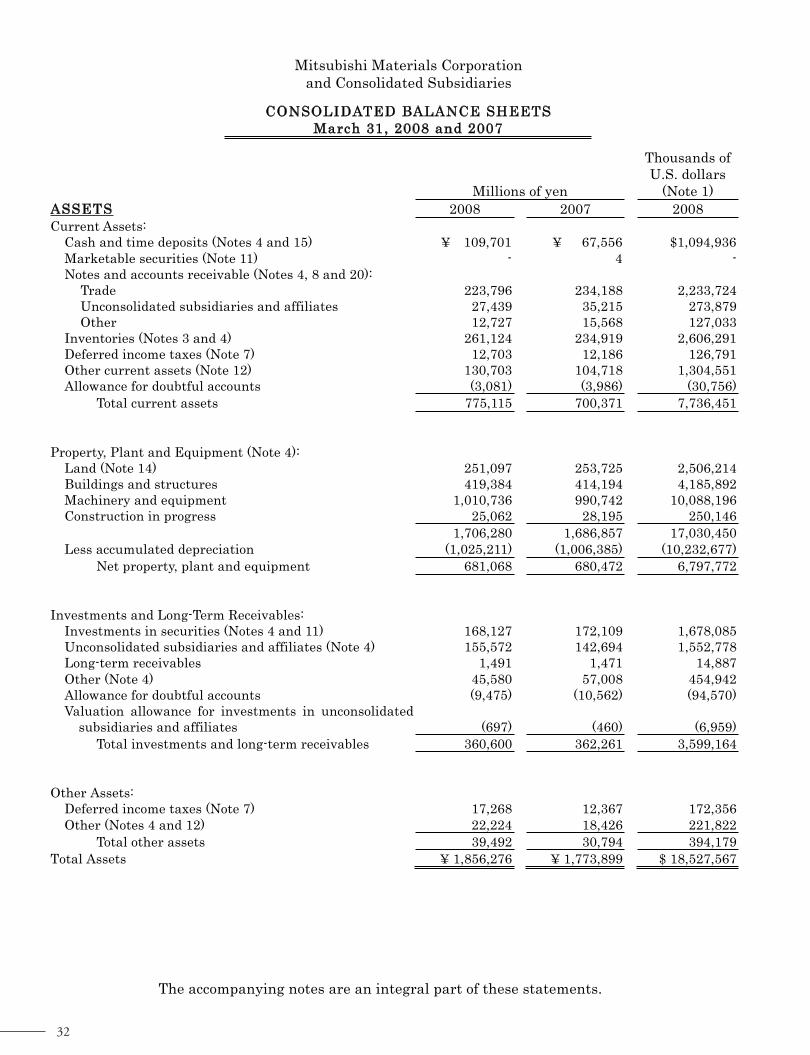
The accompanying notes are an integral part of these statements.
-4-
Mitsubishi Materials Corporation and Consolidated Subsidiaries
CONSOLIDATED BALANCE SHEETSMarch 31, 2008 and 2007
Millions of yen
Thousands of U.S. dollars
(Note 1) ASSETS 2008 2007 2008 Current Assets:
Cash and time deposits (Notes 4 and 15) ¥ 109,701 ¥ 67,556 $1,094,936Marketable securities (Note 11) - 4 -Notes and accounts receivable (Notes 4, 8 and 20):
Trade 223,796 234,188 2,233,724Unconsolidated subsidiaries and affiliates 27,439 35,215 273,879Other 12,727 15,568 127,033
Inventories (Notes 3 and 4) 261,124 234,919 2,606,291Deferred income taxes (Note 7) 12,703 12,186 126,791Other current assets (Note 12) 130,703 104,718 1,304,551Allowance for doubtful accounts (3,081) (3,986) (30,756)
Total current assets 775,115 700,371 7,736,451
Property, Plant and Equipment (Note 4): Land (Note 14) 251,097 253,725 2,506,214Buildings and structures 419,384 414,194 4,185,892Machinery and equipment 1,010,736 990,742 10,088,196Construction in progress 25,062 28,195 250,146 1,706,280 1,686,857 17,030,450Less accumulated depreciation (1,025,211) (1,006,385) (10,232,677)
Net property, plant and equipment 681,068 680,472 6,797,772
Investments and Long-Term Receivables: Investments in securities (Notes 4 and 11) 168,127 172,109 1,678,085Unconsolidated subsidiaries and affiliates (Note 4) 155,572 142,694 1,552,778Long-term receivables 1,491 1,471 14,887Other (Note 4) 45,580 57,008 454,942Allowance for doubtful accounts (9,475) (10,562) (94,570)Valuation allowance for investments in unconsolidated
subsidiaries and affiliates (697) (460) (6,959)Total investments and long-term receivables 360,600 362,261 3,599,164
Other Assets: Deferred income taxes (Note 7) 17,268 12,367 172,356Other (Notes 4 and 12) 22,224 18,426 221,822
Total other assets 39,492 30,794 394,179Total Assets ¥ 1,856,276 ¥ 1,773,899 $ 18,527,567
32

The accompanying notes are an integral part of these statements.
-5-
Mitsubishi Materials Corporation and Consolidated Subsidiaries
CONSOLIDATED BALANCE SHEETSMarch 31, 2008 and 2007
(Continued)
(Continued on following page)
Millions of yen
Thousands of U.S. dollars
(Note 1) LIABILITIES 2008 2007 2008 Current Liabilities:
Short-term bank loans (Note 4) ¥ 233,143 ¥ 256,833 $2,327,017Current portion of long-term debt (Note 4) 101,323 75,284 1,011,313Commercial Paper (Note 4) Notes and accounts payable (Note 20):
30,000 28,000 299,431
Trade 170,249 164,315 1,699,264
Unconsolidated subsidiaries and affiliates 4,725 6,908 47,163
Other 27,982 24,576 279,290Income taxes payable 16,861 11,453 168,296Deferred income taxes (Note 7) 2,245 2,496 22,415Accrued expenses 71,983 70,128 718,467Other current liabilities (Note 12) 191,754 176,538 1,913,906
Total current liabilities 850,269 816,535 8,486,566Long-Term Liabilities:
Long-term debt (Note 4) 325,846 325,068 3,252,284Employees’ severance and pension benefits (Note 5) 48,361 48,853 482,694Accrual for officers’ lump-sum severance benefits 1,662 2,230 16,589Reserve for waste management cost 5,784 1,996 57,738Reserve for loss on unconsolidated subsidiaries and affiliates 2,623 367 26,189
Reserve for clean-up costs of contaminated land 11,087 12,037 110,665Deferred income taxes (Note 7) 14,465 18,265 144,382Deferred income taxes on revaluation reserve
for land (Notes 7 and 14) 40,584 34,831 405,070Other (Note 12) 35,302 31,742 352,359
Total long-term liabilities 485,718 475,393 4,847,975
Contingent Liabilities and Commitments (Notes 8 and 9)
33
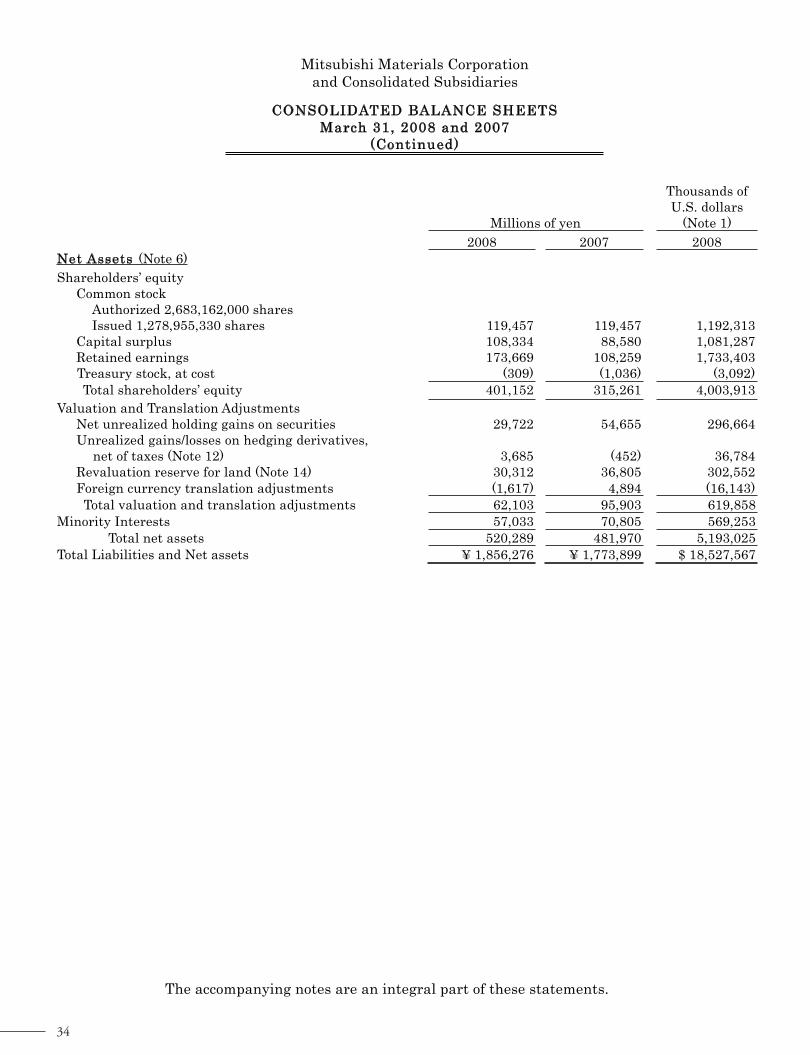
The accompanying notes are an integral part of these statements.
-6-
Mitsubishi Materials Corporation and Consolidated Subsidiaries
CONSOLIDATED BALANCE SHEETSMarch 31, 2008 and 2007
(Continued)
Millions of yen
Thousands of U.S. dollars
(Note 1)
2008 2007 2008 Net Assets (Note 6)
Shareholders’ equity Common stock
Authorized 2,683,162,000 shares Issued 1,278,955,330 shares 119,457 119,457 1,192,313
Capital surplus 108,334 88,580 1,081,287Retained earnings 173,669 108,259 1,733,403Treasury stock, at cost (309) (1,036) (3,092)Total shareholders’ equity 401,152 315,261 4,003,913
Valuation and Translation Adjustments Net unrealized holding gains on securities 29,722 54,655 296,664Unrealized gains/losses on hedging derivatives,
net of taxes (Note 12) 3,685 (452) 36,784Revaluation reserve for land (Note 14) 30,312 36,805 302,552Foreign currency translation adjustments (1,617) 4,894 (16,143)
Total valuation and translation adjustments 62,103 95,903 619,858Minority Interests 57,033 70,805 569,253
Total net assets 520,289 481,970 5,193,025Total Liabilities and Net assets ¥ 1,856,276 ¥ 1,773,899 $ 18,527,567
34

The accompanying notes are an integral part of these statements.
-8-
Mitsubishi Materials Corporation and Consolidated Subsidiaries
CONSOLIDATED STATEMENTS OF SHAREHOLDERS ’ EQUITY
Years ended March 31, 2006
Millions of yen/thousands of shares
2006Common Stock:
Number of shares At beginning of year 1,134,054Conversion of convertible yen debentures 8 Issuance of new stocks by execution of stock acquisition rights 13,856 At end of year 1,147,918
Amount Balance at beginning of year ¥ 99,397 Conversion of convertible yen debentures 2,356Balance at end of year ¥ 101,753
Capital Surplus: Balance at beginning of year ¥ 68,440 Gain on sales of treasury stock 100 Conversion of convertible yen debentures 2 Issuance of new stocks by execution of stock acquisition rights 2,340 Balance at end of year ¥ 70,882
Retained earnings: Balance at beginning of year ¥ (14,328) Net income for the year 58,803Cash dividends paid (3,396) Bonuses to directors and corporate auditors (52) Increase resulting from increase in the number of consolidated subsidiaries 290
Increase due to reversal of revaluation reserve for land (Note14) 2,416 Decrease due to reversal of revaluation reserve for land (Note14) (259) Increase due to mergers of unconsolidated subsidiaries 50 Decrease due to mergers of unconsolidated subsidiaries (158) Other, net 87Balance at end of year ¥ 43,453
The accompanying notes are an integral part of these statements.
-8-
Mitsubishi Materials Corporation and Consolidated Subsidiaries
CONSOLIDATED STATEMENTS OF SHAREHOLDERS ’EQUITY
Years ended March 31, 2006
Millions of yen/thousands of shares
2006Common Stock:
Number of shares At beginning of year 1,134,054Conversion of convertible yen debentures 8 Issuance of new stocks by execution of stock acquisition rights 13,856 At end of year 1,147,918
Amount Balance at beginning of year ¥ 99,397 Conversion of convertible yen debentures 2,356Balance at end of year ¥ 101,753
Capital Surplus: Balance at beginning of year ¥ 68,440 Gain on sales of treasury stock 100 Conversion of convertible yen debentures 2 Issuance of new stocks by execution of stock acquisition rights 2,340 Balance at end of year ¥ 70,882
Retained earnings: Balance at beginning of year ¥ (14,328) Net income for the year 58,803Cash dividends paid (3,396) Bonuses to directors and corporate auditors (52) Increase resulting from increase in the number of consolidated subsidiaries 290
Increase due to reversal of revaluation reserve for land (Note14) 2,416 Decrease due to reversal of revaluation reserve for land (Note14) (259) Increase due to mergers of unconsolidated subsidiaries 50 Decrease due to mergers of unconsolidated subsidiaries (158) Other, net 87Balance at end of year ¥ 43,453
35

The accompanying notes are an integral part of these statements.
-9-
Mitsubishi Materials Corporation and Consolidated Subsidiaries
CONSOLIDATED STATEMENTS OF SHAREHOLDERS ’ EQUITY
Years ended March 31, 2006(Continued)
Millions of yen 2006 Revaluation Reserve for Land (Note 14):
Balance at beginning of year ¥ 39,480 Decrease, net (2,162) Balance at end of year ¥ 37,318
Net unrealized holding gains on securities: Balance at beginning of year ¥ 16,989 Net change 33,583 Balance at end of year ¥ 50,572
Foreign currency translation adjustments: Balance at beginning of year ¥ (12,381) Net change 12,805 Balance at end of year ¥ 424
Treasury stock: Balance at beginning of year ¥ (695) Increase, net (147) Balance at end of year ¥ (842)
36

T
he
acco
mp
any
ing
no
tes
are
an i
nte
gra
l p
art
of
thes
e st
atem
ents
.
-10
-
T
hou
san
ds
M
illi
ons
of y
en
Sh
are
hol
der
s' e
qu
ity
Va
lua
tion
an
d t
ran
sla
tion
ad
just
men
ts
Nu
mb
er o
f sh
are
s of
C
omm
on S
tock
C
omm
onS
tock
Ca
pit
al
Su
rplu
sR
eta
ined
ea
rnin
gs
T
rea
sury
stoc
k
Tot
al
sha
reh
old
ers'
equ
ity
Net
u
nre
ali
zed
hol
din
gga
ins
(los
ses)
on
se
curi
ties
Un
rea
lize
d
ga
ins
(los
ses)
on
hed
gin
g
der
iva
tives
,n
et o
f ta
xes
Rev
alu
ati
on
rese
rve
for
lan
d
(Not
e 1
4)
For
eign
curr
ency
tra
nsl
ati
ona
dju
stm
ents
Tot
al
va
lua
tion
an
d
tra
nsl
ati
ona
dju
stm
ents
M
inor
ity
inte
rest
sT
ota
l n
et
ass
ets
Sh
are
hol
der
s' e
qu
ity a
t M
arc
h 3
1,
20
06
as
p
revio
usl
y r
epor
ted
: 1
,14
7,9
18
¥1
01
,75
3
¥7
0,8
82
¥4
3,4
53
¥ (
84
2)
¥2
15
,24
6
¥
50
,57
2
¥
-
¥3
7,3
18
¥
42
4¥
88
,31
4
¥
-
¥
30
3,5
60
R
ecla
ssif
ica
tion
du
e to
ad
opti
on o
f n
ew a
ccou
nti
ng
sta
nd
ard
s fo
r p
rese
nta
tion
of
net
ass
ets
in t
he
ba
lan
ce a
t A
pri
l 1
, 2
00
6
5
4,4
62
5
4,4
62
Net
ass
ets
at
Ap
ril
1,
20
06
1
,14
7,9
18
10
1,7
53
7
0,8
82
43
,45
3(8
42
) 2
15
,24
6
5
0,5
72
-
37
,31
84
24
88
,31
45
4,4
62
35
8,0
23
Issu
an
ce o
f n
ew s
tock
s b
y e
xec
uti
on o
f st
ock
acq
uis
itio
n r
igh
ts
10
4,1
74
1
7,7
05
17
,60
0-
-
3
5,3
06
-
-
-
-
-
-
35
,30
6
Ca
sh d
ivid
end
s p
aid
-
-
-
(6,8
70
) -
(6
,87
0)
-
-
-
-
-
-
(6
,87
0)
Bon
use
s to
dir
ecto
rs a
nd
cor
por
ate
au
dit
ors
-
-
-
(1
29
) -
(1
29
)
-
-
-
-
-
-
(12
9)
Net
in
com
e fo
r th
e yea
r -
-
-
71
,38
2
-
71
,38
2
-
-
-
-
-
-
7
1,3
82
Dec
rea
se d
ue
to r
ever
sal
of r
eva
lua
tion
res
erve
for
la
nd
(N
ote
14
) -
-
-
(35
) -
(3
5)
-
-
-
-
-
-
(3
5)
Incr
ease
du
e to
mer
ger
s of
un
con
soli
da
ted
su
bsi
dia
ries
-
-
-
3
46
-
3
46
-
-
-
-
-
-
34
6
Dec
rea
se d
ue
to m
erger
s of
un
con
soli
da
ted
su
bsi
dia
ries
-
-
-
(10
5)
-
(10
5)
-
-
-
-
-
-
(1
05
) In
crea
se r
esu
ltin
g f
rom
in
crea
se i
n t
he
nu
mb
er o
f
con
soli
da
ted
su
bsi
dia
ries
-
-
-
19
1
-
19
1
-
-
-
-
-
-
1
91
Tra
nsf
er o
f u
nre
ali
zed
ga
ins
an
d l
osse
s on
d
eriv
ati
ves
at
over
sea
s su
bsi
dia
ries
-
-
-
26
-
2
6
-
-
-
-
-
-
2
6
Acq
uis
itio
n o
f tr
easu
ry s
tock
-
-
-
-
(29
9)
(29
9)
-
-
-
-
-
-
(2
99
)
Sa
les
of t
rea
sury
sto
ck
-
-
9
7
-
15
3
25
0
-
-
-
-
-
-
2
50
In
crea
se r
esu
ltin
g f
rom
ch
an
ges
of
equ
ity s
ha
res
in
aff
ilia
tes
-
-
-
-
(4
7)
(47
)
-
-
-
-
-
-
(47
)
Net
ch
an
ge
oth
er t
ha
n s
ha
reh
old
ers'
eq
uit
y
-
-
-
-
-
-
4
,08
3
(45
2)
(51
2)
4,4
70
7
,58
9
16
,34
2
23
,93
1
Ba
lan
ce a
t M
arc
h 3
1,2
00
7
1,2
52
,09
2
1
19
,45
7
88
,58
01
08
,25
9(1
,03
6)
31
5,2
61
54
,65
5
(45
2)
3
6,8
05
4
,89
49
5,9
03
70
,80
54
81
,97
0
Issu
an
ce o
f n
ew s
tock
s (s
ha
re e
xch
an
ge)
2
6,8
62
-
18
,76
6
-
(5)
18
,76
1
-
-
-
-
-
-
1
8,7
61
Ca
sh d
ivid
end
s p
aid
-
-
-
(9,9
97
) -
(9
,99
7)
-
-
-
-
-
-
(9
,99
7)
Net
in
com
e fo
r th
e yea
r -
-
-
74
,26
8
-
74
,26
8
-
-
-
-
-
-
7
4,2
68
Incr
ease
du
e to
rev
ersa
l of
rev
alu
ati
on r
eser
ve
for
la
nd
(N
ote
14
) -
-
-
29
5
-
29
5
-
-
-
-
-
-
2
95
Incr
ease
res
ult
ing f
rom
in
crea
se i
n t
he
nu
mb
er o
f
con
soli
da
ted
su
bsi
dia
ries
-
-
-
17
7
-
17
7
-
-
-
-
-
-
1
77
Ga
in o
n c
ha
nge
in e
qu
ity r
ecor
ded
by a
n a
ffil
iate
-
-
-
68
3
-
68
3
-
-
-
-
-
-
6
83
Ad
just
men
t of
pen
sion
ob
liga
tion
at
over
sea
s su
bsi
dia
ries
-
-
-
(18
) -
( 1
8)
-
-
-
-
-
-
(1
8)
Acq
uis
itio
n o
f tr
easu
ry s
tock
-
-
-
-
(46
0)
(46
0)
-
-
-
-
-
-
(4
60
)
Sa
les
of t
rea
sury
sto
ck
-
-
9
87
-
1
,19
2
2,1
79
-
-
-
-
-
-
2,1
79
In
crea
se r
esu
ltin
g f
rom
ch
an
ges
of
equ
ity s
ha
res
in
aff
ilia
tes
-
-
-
-
(0
) (0
)
-
-
-
-
-
-
(0)
Net
ch
an
ge
oth
er t
ha
n s
ha
reh
old
ers'
eq
uit
y
-
-
-
-
-
-
(2
4,9
32
) 4
,13
8
(6,4
92
) (6
,51
1)
(33
,79
9)
(13
,77
1)
(47
,57
1)
Ba
lan
ce a
t M
arc
h 3
1,
20
08
1
,27
8,9
55
¥1
19
,45
7
¥1
08
,33
4
¥1
73
,66
9
¥(3
09
)¥
40
1,1
52
¥2
9,7
22
¥
3,6
85
¥
30
,31
2
¥(1
,61
7)
¥6
2,1
03
¥5
7,0
33
¥5
20
,28
9
Mit
sub
ish
i M
ate
ria
ls C
orp
ora
tion
an
d C
onso
lid
ate
d S
ub
sid
iari
es
CO
NS
OL
IDA
TE
DS
TA
TE
ME
NT
SO
FC
HA
NG
ES
INN
ET
AS
SE
TS
(No
te1
9)
Ye
ar
en
de
dM
arch
31
,2
00
8a
nd
20
07
37

T
he
acco
mp
any
ing
no
tes
are
an i
nte
gra
l p
art
of
thes
e st
atem
ents
.
-11
-
T
hou
san
ds
T
hou
san
ds
of U
.S.
dol
lars
(N
ote1
)
Sh
are
hol
der
s' e
qu
ity
Va
lua
tion
an
d t
ran
sla
tion
ad
just
men
ts
Nu
mb
er o
f sh
are
s of
C
omm
on S
tock
C
omm
onS
tock
Ca
pit
al
Su
rplu
sR
eta
ined
ea
rnin
gs
T
rea
sury
stoc
k
Tot
al
sha
reh
old
ers'
equ
ity
Net
u
nre
ali
zed
hol
din
gga
ins
(los
ses)
on
se
curi
ties
Un
rea
lize
d
ga
ins
(los
ses)
on
hed
gin
g
der
iva
tives
,n
et o
f ta
xes
Rev
alu
ati
onre
serv
e fo
r la
nd
(N
ote
14
)
For
eign
curr
ency
tra
nsl
ati
ona
dju
stm
ents
Tot
al
va
lua
tion
an
dtr
an
sla
tion
ad
just
men
ts
Min
orit
yin
tere
sts
Tot
al
net
a
sset
s
Ba
lan
ce a
t M
arc
h 3
1,2
00
7
1,2
52
,09
2
1
,19
2,3
13
8
84
,12
71
,08
0,5
41
(10
,34
3)
3,1
46
,63
8
5
45
,52
0
(4,5
16
)
36
7,3
58
4
8,8
52
95
7,2
14
70
6,7
11
4,8
10
,56
4
Issu
an
ce o
f n
ew s
tock
s (s
ha
re e
xch
an
ge)
2
6,8
62
-
18
7,3
07
-
(5
2)
18
7,2
55
-
-
-
-
-
-
18
7,2
55
Ca
sh d
ivid
end
s p
aid
-
-
-
(99
,78
2)
-
(99
,78
2)
-
-
-
-
-
-
(9
9,7
82
) N
et i
nco
me
for
the
yea
r -
-
-
74
1,2
79
-
7
41
,27
9
-
-
-
-
-
-
7
41
,27
9
Incr
ease
du
e to
rev
ersa
l of
rev
alu
ati
on r
eser
ve
for
la
nd
(N
ote
14
) -
-
-
2,9
52
-
2
,95
2
-
-
-
-
-
-
2
,95
2
Incr
ease
res
ult
ing f
rom
in
crea
se i
n t
he
nu
mb
er o
f
con
soli
da
ted
su
bsi
dia
ries
-
-
-
1,7
73
-
1
,77
3
-
-
-
-
-
-
1
,77
3
Ga
in o
n c
ha
nge
in e
qu
ity r
ecor
ded
by a
n a
ffil
iate
-
-
-
6,8
27
-
6
,82
7
-
-
-
-
-
-
6
,82
7
Ad
just
men
t of
pen
sion
ob
liga
tion
at
over
sea
s su
bsi
dia
ries
-
-
-
(18
6)
-
( 18
6)
-
-
-
-
-
-
(1
86
)
Acq
uis
itio
n o
f tr
easu
ry s
tock
-
-
-
-
(4,5
96
) (4
,59
6)
-
-
-
-
-
-
(4
,59
6)
Sa
les
of t
rea
sury
sto
ck
-
-
9
,85
2
-
11
,90
1
21
,75
4
-
-
-
-
-
-
2
1,7
54
In
crea
se r
esu
ltin
g f
rom
ch
an
ges
of
equ
ity s
ha
res
in
aff
ilia
tes
-
-
-
-
(1
) (1
)
-
-
-
-
-
-
(1)
Net
ch
an
ge
oth
er t
ha
n s
ha
reh
old
ers'
eq
uit
y
-
-
-
-
-
-
(2
48
,85
5)
41
,30
1
(64
,80
6)
(64
,99
5)
(33
7,3
55
) (1
37
,45
8)
(47
4,8
14
)
Ba
lan
ce a
t M
arc
h 3
1,
20
08
1
,27
8,9
55
$1
,19
2,3
13
$
1,0
81
,28
7
$1
,73
3,4
03
$
(3,0
92
)$
4,0
03
,91
3
$
29
6,6
64
$
36
,78
4
$3
02
,55
2
$(1
6,1
43
)$
61
9,8
58
$5
69
,25
3$
5,1
93
,02
5
Mit
sub
ish
i M
ate
ria
ls C
orp
ora
tion
an
d C
onso
lid
ate
d S
ub
sid
iari
es
CO
NS
OL
IDA
TE
DS
TA
TE
ME
NT
SO
FC
HA
NG
ES
INN
ET
AS
SE
TS
(No
te1
9)
Ye
ar
en
de
dM
arch
31
,2
00
8a
nd
20
07
(Co
nti
nu
ed
)
38

T
he
acco
mp
any
ing
no
tes
are
an i
nte
gra
l p
art
of
thes
e st
atem
ents
.
-11
-
T
hou
san
ds
T
hou
san
ds
of U
.S.
dol
lars
(N
ote1
)
Sh
are
hol
der
s' e
qu
ity
Va
lua
tion
an
d t
ran
sla
tion
ad
just
men
ts
Nu
mb
er o
f sh
are
s of
C
omm
on S
tock
C
omm
onS
tock
Ca
pit
al
Su
rplu
sR
eta
ined
ea
rnin
gs
T
rea
sury
stoc
k
Tot
al
sha
reh
old
ers'
equ
ity
Net
u
nre
ali
zed
hol
din
gga
ins
(los
ses)
on
se
curi
ties
Un
rea
lize
d
ga
ins
(los
ses)
on
hed
gin
g
der
iva
tives
,n
et o
f ta
xes
Rev
alu
ati
onre
serv
e fo
r la
nd
(N
ote
14
)
For
eign
curr
ency
tra
nsl
ati
ona
dju
stm
ents
Tot
al
va
lua
tion
an
dtr
an
sla
tion
ad
just
men
ts
Min
orit
yin
tere
sts
Tot
al
net
a
sset
s
Ba
lan
ce a
t M
arc
h 3
1,2
00
7
1,2
52
,09
2
1
,19
2,3
13
8
84
,12
71
,08
0,5
41
(10
,34
3)
3,1
46
,63
8
5
45
,52
0
(4,5
16
)
36
7,3
58
4
8,8
52
95
7,2
14
70
6,7
11
4,8
10
,56
4
Issu
an
ce o
f n
ew s
tock
s (s
ha
re e
xch
an
ge)
2
6,8
62
-
18
7,3
07
-
(5
2)
18
7,2
55
-
-
-
-
-
-
18
7,2
55
Ca
sh d
ivid
end
s p
aid
-
-
-
(99
,78
2)
-
(99
,78
2)
-
-
-
-
-
-
(9
9,7
82
) N
et i
nco
me
for
the
yea
r -
-
-
74
1,2
79
-
7
41
,27
9
-
-
-
-
-
-
7
41
,27
9
Incr
ease
du
e to
rev
ersa
l of
rev
alu
ati
on r
eser
ve
for
la
nd
(N
ote
14
) -
-
-
2,9
52
-
2
,95
2
-
-
-
-
-
-
2
,95
2
Incr
ease
res
ult
ing f
rom
in
crea
se i
n t
he
nu
mb
er o
f
con
soli
da
ted
su
bsi
dia
ries
-
-
-
1,7
73
-
1
,77
3
-
-
-
-
-
-
1
,77
3
Ga
in o
n c
ha
nge
in e
qu
ity r
ecor
ded
by a
n a
ffil
iate
-
-
-
6,8
27
-
6
,82
7
-
-
-
-
-
-
6
,82
7
Ad
just
men
t of
pen
sion
ob
liga
tion
at
over
sea
s su
bsi
dia
ries
-
-
-
(18
6)
-
( 18
6)
-
-
-
-
-
-
(1
86
)
Acq
uis
itio
n o
f tr
easu
ry s
tock
-
-
-
-
(4,5
96
) (4
,59
6)
-
-
-
-
-
-
(4
,59
6)
Sa
les
of t
rea
sury
sto
ck
-
-
9
,85
2
-
11
,90
1
21
,75
4
-
-
-
-
-
-
2
1,7
54
In
crea
se r
esu
ltin
g f
rom
ch
an
ges
of
equ
ity s
ha
res
in
aff
ilia
tes
-
-
-
-
(1
) (1
)
-
-
-
-
-
-
(1)
Net
ch
an
ge
oth
er t
ha
n s
ha
reh
old
ers'
eq
uit
y
-
-
-
-
-
-
(2
48
,85
5)
41
,30
1
(64
,80
6)
(64
,99
5)
(33
7,3
55
) (1
37
,45
8)
(47
4,8
14
)
Ba
lan
ce a
t M
arc
h 3
1,
20
08
1
,27
8,9
55
$1
,19
2,3
13
$
1,0
81
,28
7
$1
,73
3,4
03
$
(3,0
92
)$
4,0
03
,91
3
$
29
6,6
64
$
36
,78
4
$3
02
,55
2
$(1
6,1
43
)$
61
9,8
58
$5
69
,25
3$
5,1
93
,02
5
Mit
sub
ish
i M
ate
ria
ls C
orp
ora
tion
an
d C
onso
lid
ate
d S
ub
sid
iari
es
CO
NS
OL
IDA
TE
DS
TA
TE
ME
NT
SO
FC
HA
NG
ES
INN
ET
AS
SE
TS
(No
te1
9)
Ye
ar
en
de
dM
arch
31
,2
00
8a
nd
20
07
(Co
nti
nu
ed
)
T
he
acco
mp
any
ing
no
tes
are
an i
nte
gra
l p
art
of
thes
e st
atem
ents
.
-12
-
Mil
lion
s of
yen
Th
ousa
nd
s of
U
.S.
dol
lars
(N
ote
1)
20
08
20
07
20
06
20
08
C
ash
Flo
ws
from
Op
era
tin
g A
ctiv
itie
s:
In
com
e b
efor
e in
com
e ta
xes
an
d m
inor
ity i
nte
rest
s ¥
12
3,4
60
¥ 1
08
,06
7
¥
85
,15
2
$
1,2
32
,26
5
Ad
just
men
ts t
o re
con
cile
in
com
e b
efor
e in
com
e ta
xes
an
d m
inor
ity i
nte
rest
s to
net
ca
sh p
rovid
ed
by o
per
ati
ng a
ctiv
itie
s:
D
epre
cia
tion
58
,11
8
4
9,4
16
47
,68
4
5
80
,07
8
Incr
ease
(d
ecre
ase
) in
all
owa
nce
for
dou
btf
ul
acc
oun
ts
29
9
( 6
03
)
7,4
99
2,9
88
D
ecre
ase
in
sev
era
nce
an
d p
ensi
on b
enef
its
(9
38
)
(70
4)
(5
18
)
(9,3
69
) In
crea
se i
n v
alu
ati
on a
llow
an
ce f
or i
nves
tmen
ts i
n u
nco
nso
lid
ate
d s
ub
sid
iari
es a
nd
aff
ilia
tes
23
6
4
11
8
7
2
,36
2
Incr
ease
(d
ecre
ase
) in
res
erve
for
loss
on
un
con
soli
da
ted
su
bsi
dia
ries
an
d a
ffil
iate
s (D
ecre
ase
) in
crea
se i
n r
eser
ve
for
clea
n-u
p c
osts
of
con
tam
ina
ted
la
nd
2
,66
9(9
49
)
10
06
,43
4
(4
96
)5
,60
3
2
6,6
43
(9,4
79
) In
crea
se (
dec
rea
se)
in r
eser
ve
for
wa
ste
ma
na
gem
ent
cost
3
,78
8
(6
9)
7
6
3
7,8
11
Inte
rest
an
d d
ivid
end
in
com
e (1
3,2
26
)
(10
,60
2)
(5
,37
7)
(1
32
,01
3)
Inte
rest
exp
ense
1
4,7
57
12
,90
9
11
,36
3
1
47
,29
5
Non
-rec
urr
ing d
epre
cia
tion
of
pro
per
ty,
pla
nt
an
d e
qu
ipm
ent
1,4
00
-
-
13
,98
1
Los
s on
dis
pos
al
an
d s
ale
s of
pro
per
ty,
pla
nt
an
d e
qu
ipm
ent
5,2
79
5,9
89
3,9
73
52
,69
4
Ga
in o
n s
ale
s of
pro
per
ty,
pla
nt
an
d e
qu
ipm
ent
Los
s on
im
pa
irm
ent
of f
ixed
ass
ets
(84
8)
2,4
62
(74
8)
2,4
86
(1,8
06
) 9
,36
6
(8
,46
6)
24
,57
3G
ain
on
sa
les
of m
ark
eta
ble
sec
uri
ties
an
d i
nves
tmen
ts i
n s
ecu
riti
es
(1,4
64
)
(1,0
76
)
(34
,32
5)
(1
4,6
16
) W
rite
-dow
n o
f m
ark
eta
ble
sec
uri
ties
an
d i
nves
tmen
ts i
n s
ecu
riti
es
Ga
in o
n i
ssu
an
ces
of s
tock
by s
ub
sid
iari
es a
nd
aff
ilia
tes
2,7
79
(29
)
1,1
22
(13
,92
5)
8
66
(11
,28
4)
2
7,7
42
(29
6)
Dec
rea
se (
incr
ease
) in
not
es a
nd
acc
oun
ts r
ecei
va
ble
1
6,7
32
(15
,73
9)
(3
6,7
49
)
16
7,0
02
Incr
ease
in
in
ven
tori
es
(26
,82
9)
(1
2,8
54
)
(47
,17
0)
(2
67
,78
9)
Pro
ceed
s fr
om s
ale
s of
gol
d b
ull
ion
dep
osit
ed f
rom
cu
stom
ers
un
der
con
sum
ing b
ail
men
t M
y G
old
Pla
n
Pa
ym
ent
for
pu
rch
ase
s of
gol
d b
ull
ion
fro
m m
ark
et f
or c
ust
omer
s u
nd
er M
y G
old
Pla
n
48
,26
7(4
6,9
13
)4
6,6
05
(26
,74
0)
26
,68
9(1
0,2
96
) 4
81
,76
2(4
68
,24
1)
Incr
ease
in
not
es a
nd
acc
oun
ts p
aya
ble
7
,67
7
2
,91
4
3
0,4
20
76
,62
7
Incr
ease
in
acc
rued
exp
ense
s 2
,59
3
9
,42
8
1
6,0
47
25
,89
0
Eq
uit
y i
n e
arn
ings
of a
ffil
iate
s (4
3,1
79
)
(39
,24
5)
(2
2,6
05
)
(43
0,9
76
) O
ther
, n
et
(6,5
59
)
3,3
67
(2,8
86
)
(65
,46
8)
S
ub
-tot
al
14
9,5
84
12
6,9
43
71
,31
3
1
,49
3,0
03
In
tere
st a
nd
div
iden
d r
ecei
ved
5
0,0
00
32
,42
6
1
9,0
13
49
9,0
57
In
tere
st p
aid
(1
4,5
49
)
(12
,55
4)
(1
0,9
65
)
(14
5,2
21
) P
roce
eds
from
ere
ctio
n a
ll r
isk
s in
sura
nce
-
2,2
59
-
- In
com
e ta
xes
pa
id
(30
,89
5)
(3
1,4
03
)
(23
,56
7)
(3
08
,36
5)
Net
Ca
sh P
rovid
ed b
y O
per
ati
ng A
ctiv
itie
s 1
54
,13
9
1
17
,67
1
5
5,7
94
1,5
38
,47
4
Mit
sub
ish
i M
ate
ria
ls C
orp
ora
tion
an
d C
onso
lid
ate
d S
ub
sid
iari
es
CO
NS
OL
IDA
TE
DS
TA
TE
ME
NT
SO
FC
AS
HF
LO
WS
Ye
ars
en
de
dM
arch
31
,2
00
8,
20
07
an
d2
00
6
39

T
he
acco
mp
any
ing
no
tes
are
an i
nte
gra
l p
art
of
thes
e st
atem
ents
.
-13
-
Mit
sub
ish
i M
ate
ria
ls C
orp
ora
tion
an
d C
onso
lid
ate
d S
ub
sid
iari
es
CO
NS
OL
IDA
TE
DS
TA
TE
ME
NT
SO
FC
AS
HF
LO
WS
Ye
ars
en
de
dM
arch
31
,2
00
8,
20
07
an
d2
00
6(C
on
tin
ue
d)
Mil
lion
s of
yen
Th
ousa
nd
s of
U
.S.
dol
lars
(N
ote
1)
20
08
20
07
20
06
20
08
Ca
sh F
low
s fr
om I
nves
tin
g A
ctiv
itie
s:
P
aym
ents
for
pu
rch
ase
s of
pro
per
ty,
pla
nt
an
d e
qu
ipm
ent
¥(7
4,3
70
)
¥(6
3,7
31
)
¥ (
48
,54
2)
$(7
42
,29
2)
Pro
ceed
s fr
om s
ale
s of
pro
per
ty,
pla
nt
an
d e
qu
ipm
ent
4,9
63
2
,06
0
3,7
68
4
9,5
40
Pa
ym
ents
for
pu
rch
ase
s of
ma
rket
ab
le s
ecu
riti
es a
nd
in
ves
tmen
ts i
n s
ecu
riti
es
(40
,79
5)
(2
0,8
19
)
(15
,70
5)
(4
07
,18
3)
Pro
ceed
s fr
om s
ale
s of
ma
rket
ab
le s
ecu
riti
es a
nd
in
ves
tmen
ts i
n s
ecu
riti
es
1,7
57
4
,79
2
53
,09
6
17
,54
6D
isb
urs
emen
t of
loa
n r
ecei
va
ble
s (1
,13
2)
(3
,80
5)
(5
,33
8)
(1
1,3
06
)P
roce
eds
from
col
lect
ion
of
loa
n r
ecei
va
ble
s 2
,12
1
8,3
94
7
,97
0
21
,17
1P
aym
ents
for
pu
rch
ase
s of
in
tan
gib
le f
ixed
ass
ets
(99
6)
(1
,30
8)
(1
,44
1)
(9
,94
5)
Pa
ym
ents
for
ad
dit
ion
al
acq
uis
itio
n o
f co
nso
lid
ate
d s
ub
sid
iari
es’ s
ha
re
(2,4
26
)
-
-
(24
,22
0)
Pa
ym
ent
for
acq
uis
itio
n o
f co
nso
lid
ate
d s
ub
sid
iari
es' s
ha
res,
net
of
cash
ow
ned
by t
he
sub
sid
iari
es
-
(3,5
88
)
-
-P
roce
eds
from
acq
uis
itio
n o
f co
nso
lid
ate
d s
ub
sid
iary
’s s
ha
res,
net
of
cash
ow
ned
by t
he
sub
sid
iary
-
1
,59
3
-
-P
roce
eds
from
sa
le o
f co
nso
lid
ate
d s
ub
sid
iari
es’ s
ha
res,
net
of
cash
ow
ned
by t
he
sub
sid
iari
es
43
2
84
9
8,8
43
4
,31
5P
roce
eds
from
sa
les
of b
usi
nes
s -
2
49
-
-
Pa
ym
ents
for
acq
uis
itio
n o
f b
usi
nes
s -
(3
8)
(9
61
)
-O
ther
, n
et
(49
6)
5
97
(7
91
)
(4,9
57
)
Net
Ca
sh (
Use
d i
n)
Pro
vid
ed b
y I
nves
tin
g A
ctiv
itie
s (1
10
,94
3)
(7
4,7
53
)8
99
(1,1
07
,33
2)
Ca
sh F
low
s fr
om F
ina
nci
ng A
ctiv
itie
s:
Pro
ceed
s fr
om l
ong-t
erm
deb
t 7
7,5
75
5
2,9
38
8
1,7
87
7
74
,28
0R
epa
ym
ents
of
lon
g-t
erm
deb
t (6
9,4
80
)
(83
,11
9)
(9
8,6
54
)
(69
3,4
82
)P
aym
ents
for
red
emp
tion
of
bon
ds
(10
,00
0)
(2
5,0
00
)
(49
,44
5)
(9
9,8
10
)P
roce
eds
from
iss
ua
nce
of
bon
ds
30
,00
0
35
,00
0
30
,00
0
29
9,4
31
Incr
ease
of
com
mer
cia
l p
ap
er,
net
2
,00
0
21
,00
0
7,0
00
1
9,9
62
Pa
ym
ents
for
pu
rch
ase
of
trea
sury
sto
ck
(46
0)
(2
99
)
(25
8)
(4
,59
6)
(Dec
rea
se)
incr
ease
in
sh
ort-
term
ba
nk
loa
ns,
net
(2
0,1
95
)
4,0
22
(1
5,2
58
)
(20
1,5
75
)C
ash
div
iden
ds
pa
id
(9,9
97
)
(6,8
70
)
(3,3
96
)
(99
,78
2)
Ca
sh d
ivid
end
s p
aid
to
min
orit
y s
ha
reh
old
ers
(3,0
29
)
(1,6
06
)
(1,7
75
)
(30
,23
5)
Pro
ceed
s fr
om s
ale
s a
nd
lea
seb
ack
tra
nsa
ctio
n
8,3
71
-
-
8
3,5
56
Oth
er,
net
(1
,77
2)
5
07
(1
,24
2)
(1
7,6
95
)N
et C
ash
Pro
vid
ed b
y (
Use
d i
n)
Fin
an
cin
g A
ctiv
itie
s ¥
3
,01
0
¥ (
3,4
28
)
¥ (
51
,24
1)
$
3
0,0
51
Eff
ect
of e
xch
an
ge
rate
flu
ctu
ati
on o
n c
ash
an
d c
ash
eq
uiv
ale
nts
¥
(3
,90
3)
¥
1,7
15
¥
2,2
43
$ (
38
,95
8)
Net
In
crea
se i
n C
ash
an
d C
ash
Eq
uiv
ale
nts
4
2,3
03
41
,20
47
,69
54
22
,23
4C
ash
an
d c
ash
eq
uiv
ale
nts
at
beg
inn
ing o
f yea
r 6
7,2
62
24
,99
41
6,3
53
67
1,3
52
Eff
ect
of c
ha
nges
in
con
soli
da
ted
su
bsi
dia
ries
(2
05
)1
35
27
2(2
,05
5)
Incr
ease
in
ca
sh a
nd
ca
sh e
qu
iva
len
ts f
rom
mer
ger
s of
un
con
soli
da
ted
su
bsi
dia
ries
-
92
86
74
-
Ca
sh a
nd
ca
sh e
qu
iva
len
ts a
t en
d o
f yea
r (N
ote
15
) ¥
10
9,3
60
¥
6
7,2
62
¥
2
4,9
94
$
1,0
91
,53
1
40

T
he
acco
mp
any
ing
no
tes
are
an i
nte
gra
l p
art
of
thes
e st
atem
ents
.
-13
-
Mit
sub
ish
i M
ate
ria
ls C
orp
ora
tion
an
d C
onso
lid
ate
d S
ub
sid
iari
es
CO
NS
OL
IDA
TE
DS
TA
TE
ME
NT
SO
FC
AS
HF
LO
WS
Ye
ars
en
de
dM
arch
31
,2
00
8,
20
07
an
d2
00
6(C
on
tin
ue
d)
Mil
lion
s of
yen
Th
ousa
nd
s of
U
.S.
dol
lars
(N
ote
1)
20
08
20
07
20
06
20
08
Ca
sh F
low
s fr
om I
nves
tin
g A
ctiv
itie
s:
P
aym
ents
for
pu
rch
ase
s of
pro
per
ty,
pla
nt
an
d e
qu
ipm
ent
¥(7
4,3
70
)
¥(6
3,7
31
)
¥ (
48
,54
2)
$(7
42
,29
2)
Pro
ceed
s fr
om s
ale
s of
pro
per
ty,
pla
nt
an
d e
qu
ipm
ent
4,9
63
2
,06
0
3,7
68
4
9,5
40
Pa
ym
ents
for
pu
rch
ase
s of
ma
rket
ab
le s
ecu
riti
es a
nd
in
ves
tmen
ts i
n s
ecu
riti
es
(40
,79
5)
(2
0,8
19
)
(15
,70
5)
(4
07
,18
3)
Pro
ceed
s fr
om s
ale
s of
ma
rket
ab
le s
ecu
riti
es a
nd
in
ves
tmen
ts i
n s
ecu
riti
es
1,7
57
4
,79
2
53
,09
6
17
,54
6D
isb
urs
emen
t of
loa
n r
ecei
va
ble
s (1
,13
2)
(3
,80
5)
(5
,33
8)
(1
1,3
06
)P
roce
eds
from
col
lect
ion
of
loa
n r
ecei
va
ble
s 2
,12
1
8,3
94
7
,97
0
21
,17
1P
aym
ents
for
pu
rch
ase
s of
in
tan
gib
le f
ixed
ass
ets
(99
6)
(1
,30
8)
(1
,44
1)
(9
,94
5)
Pa
ym
ents
for
ad
dit
ion
al
acq
uis
itio
n o
f co
nso
lid
ate
d s
ub
sid
iari
es’ s
ha
re
(2,4
26
)
-
-
(24
,22
0)
Pa
ym
ent
for
acq
uis
itio
n o
f co
nso
lid
ate
d s
ub
sid
iari
es' s
ha
res,
net
of
cash
ow
ned
by t
he
sub
sid
iari
es
-
(3,5
88
)
-
-P
roce
eds
from
acq
uis
itio
n o
f co
nso
lid
ate
d s
ub
sid
iary
’s s
ha
res,
net
of
cash
ow
ned
by t
he
sub
sid
iary
-
1
,59
3
-
-P
roce
eds
from
sa
le o
f co
nso
lid
ate
d s
ub
sid
iari
es’ s
ha
res,
net
of
cash
ow
ned
by t
he
sub
sid
iari
es
43
2
84
9
8,8
43
4
,31
5P
roce
eds
from
sa
les
of b
usi
nes
s -
2
49
-
-
Pa
ym
ents
for
acq
uis
itio
n o
f b
usi
nes
s -
(3
8)
(9
61
)
-O
ther
, n
et
(49
6)
5
97
(7
91
)
(4,9
57
)
Net
Ca
sh (
Use
d i
n)
Pro
vid
ed b
y I
nves
tin
g A
ctiv
itie
s (1
10
,94
3)
(7
4,7
53
)8
99
(1,1
07
,33
2)
Ca
sh F
low
s fr
om F
ina
nci
ng A
ctiv
itie
s:
Pro
ceed
s fr
om l
ong-t
erm
deb
t 7
7,5
75
5
2,9
38
8
1,7
87
7
74
,28
0R
epa
ym
ents
of
lon
g-t
erm
deb
t (6
9,4
80
)
(83
,11
9)
(9
8,6
54
)
(69
3,4
82
)P
aym
ents
for
red
emp
tion
of
bon
ds
(10
,00
0)
(2
5,0
00
)
(49
,44
5)
(9
9,8
10
)P
roce
eds
from
iss
ua
nce
of
bon
ds
30
,00
0
35
,00
0
30
,00
0
29
9,4
31
Incr
ease
of
com
mer
cia
l p
ap
er,
net
2
,00
0
21
,00
0
7,0
00
1
9,9
62
Pa
ym
ents
for
pu
rch
ase
of
trea
sury
sto
ck
(46
0)
(2
99
)
(25
8)
(4
,59
6)
(Dec
rea
se)
incr
ease
in
sh
ort-
term
ba
nk
loa
ns,
net
(2
0,1
95
)
4,0
22
(1
5,2
58
)
(20
1,5
75
)C
ash
div
iden
ds
pa
id
(9,9
97
)
(6,8
70
)
(3,3
96
)
(99
,78
2)
Ca
sh d
ivid
end
s p
aid
to
min
orit
y s
ha
reh
old
ers
(3,0
29
)
(1,6
06
)
(1,7
75
)
(30
,23
5)
Pro
ceed
s fr
om s
ale
s a
nd
lea
seb
ack
tra
nsa
ctio
n
8,3
71
-
-
8
3,5
56
Oth
er,
net
(1
,77
2)
5
07
(1
,24
2)
(1
7,6
95
)N
et C
ash
Pro
vid
ed b
y (
Use
d i
n)
Fin
an
cin
g A
ctiv
itie
s ¥
3
,01
0
¥ (
3,4
28
)
¥ (
51
,24
1)
$
3
0,0
51
Eff
ect
of e
xch
an
ge
rate
flu
ctu
ati
on o
n c
ash
an
d c
ash
eq
uiv
ale
nts
¥
(3
,90
3)
¥
1,7
15
¥
2,2
43
$ (
38
,95
8)
Net
In
crea
se i
n C
ash
an
d C
ash
Eq
uiv
ale
nts
4
2,3
03
41
,20
47
,69
54
22
,23
4C
ash
an
d c
ash
eq
uiv
ale
nts
at
beg
inn
ing o
f yea
r 6
7,2
62
24
,99
41
6,3
53
67
1,3
52
Eff
ect
of c
ha
nges
in
con
soli
da
ted
su
bsi
dia
ries
(2
05
)1
35
27
2(2
,05
5)
Incr
ease
in
ca
sh a
nd
ca
sh e
qu
iva
len
ts f
rom
mer
ger
s of
un
con
soli
da
ted
su
bsi
dia
ries
-
92
86
74
-
Ca
sh a
nd
ca
sh e
qu
iva
len
ts a
t en
d o
f yea
r (N
ote
15
) ¥
10
9,3
60
¥
6
7,2
62
¥
2
4,9
94
$
1,0
91
,53
1 Mitsubishi Materials Corporation and Consolidated Subsidiaries
NOTES TO CONSOLIDATED FINANCIAL STATEMENTS
March 31, 2008, 2007 and 2006
14
Note 1 Basis of Presenting Consolidated Financial Statements
The accompanying consolidated financial statements of Mitsubishi Materials Corporation (the
“Company”) and its consolidated subsidiaries have been prepared in accordance with the provisions
set forth in the Financial Instruments and Exchange Law in 2008 (the Japanese Securities and
Exchange Law in 2007 and 2006) and its related accounting regulations, and in conformity with
accounting principles generally accepted in Japan (“Japanese GAAP”), which are different in certain
respects as to application and disclosure requirements from International Financial Reporting
Standards.
The accounts of the Company’s overseas subsidiaries are based on their accounting records
maintained in conformity with generally accepted accounting principles prevailing in the respective
countries of domicile. The accompanying consolidated financial statements have been restructured and
translated into English (with certain expanded disclosure and the inclusion of the consolidated
statements of shareholders’ equity for 2006) from the consolidated financial statements of the
Company prepared in accordance with Japanese GAAP and filed with the appropriate Local Finance
Bureau of the Ministry of Finance as required by the Financial Instruments and Exchange Law in 2008
(the Japanese Securities and Exchange Law in 2007 and 2006). Certain supplementary information
included in the statutory Japanese language consolidated financial statements, but not required for fair
presentation, is not presented in the accompanying consolidated financial statements.
As discussed in Note 2 (s), the consolidated statements of changes in net assets for the year ended
March 31, 2008 and 2007 have been prepared in accordance with the new accounting standard. The
accompanying consolidated statement of shareholders’ equity for the year ended March 31, 2006 was
voluntarily prepared for the purpose of inclusion in the consolidated financial statements although
such statements were not required to be filed with the Local Finance Bureau.
The translation of the Japanese yen amounts into U.S. dollars is included solely for the convenience of
readers outside Japan, using the prevailing exchange rate at March 31, 2008, which was ¥100.19 to
U.S. $1. The convenience translation should not be construed as representation that the Japanese yen
amounts have been, could have been, or could in the future be, converted into U.S. dollars at this or
any other rate of exchange.
Fractions less than one million yen (one tenth yen in respect of per share amount) have been omitted
from the year ended March 31, 2007. As a result, the total amounts in Japanese yen and translated U.S.
dollars shown in the consolidated financial statements and notes to the consolidated financial
statements do not necessarily agree with the sum of the individual amounts.
41

Mitsubishi Materials Corporation and Consolidated Subsidiaries
NOTES TO CONSOLIDATED FINANCIAL STATEMENTS
March 31, 2008, 2007 and 2006
(Continued)
15
Note 2 Summary of Significant Accounting Policies
(a) Consolidation
The accompanying consolidated financial statements include the accounts of the Company
and significant companies which the Company controls through majority voting right or
existence of certain conditions. All significant intercompany balances and transactions have
been eliminated in consolidation. Investments in affiliates of which the Company has the
ability to exercise significant influence over operating and financial policies, except for
insignificant companies, are accounted for by the equity method, and accordingly, stated at
cost adjusted for the earnings and losses after elimination of unrealized intercompany
profits from the date of acquisition.
Investments in unconsolidated subsidiaries and affiliates not accounted for by the equity
method are carried at cost, adjusted for any substantial and nonrecoverable decline in value.
In the elimination of investments in subsidiaries, assets and liabilities of the subsidiaries,
including the portion attributable to minority shareholders, are evaluated based on their fair
values at the time the Company acquired control of the respective subsidiaries.
The excess investment amounts, at the acquisition date, over net assets of consolidated
subsidiaries or unconsolidated subsidiaries and affiliates accounted for by the equity method,
except for SUMCO CORPORATION, are being amortized over a period of five years on a
straight-line basis.
The excess investment amount over net assets of SUMCO CORPORATION as of March 31,
2002, which is composed of goodwill, is amortized over a period of 20 years.
(b) Translation of Foreign Currencies
Receivables and payables denominated in foreign currencies are translated into Japanese
yen at the year-end rates. Gains or losses resulting from foreign currency transactions are
credited or charged to other income as incurred.
The financial statements of consolidated foreign subsidiaries and affiliates are translated
into Japanese yen amounts at the current rate except for net assets, which is translated at
historical rates. The difference resulting from exchange adjustments is reported as a separate
component of net assets.
42

Mitsubishi Materials Corporation and Consolidated Subsidiaries
NOTES TO CONSOLIDATED FINANCIAL STATEMENTS
March 31, 2008, 2007 and 2006
(Continued)
16
(c) Allowance for Doubtful Accounts
Allowance for doubtful accounts is provided in the amount sufficient to cover probable
losses on collection. It consists of individually estimated uncollectible amounts, and an
amount calculated using the past rate of actual losses on collection.
(d) Inventories
The amounts of inventories are stated primarily at acquisition cost modified by the writing
down below cost to net selling value. Nonferrous metals are stated primarily at the first-in,
first-out (FIFO) method. Other inventories are primarily stated at average cost method.
The Company and the domestic consolidated subsidiaries adopted the “Accounting
Standard for Measurement of Inventories” (Statement No.9, issued by Accounting
Standards Board of Japan on July 5, 2006) in the year ended March 31, 2007, as the
standard became applicable to the consolidated fiscal year commencing before March 31,
2008 and the following consolidated fiscal years. Under this standard, inventories held for
sale in the ordinary course of business in principle, shall be carried at the acquisition cost on
the balance sheet. However, in the case that the net selling value falls below the acquisition
cost at the end of the period, inventories shall be carried at the net selling value on the
balance sheet, regarded as decreased profitability of assets.
Consequently, the gross profit, the operating profit, and the income before income taxes and
minority interests for the year ended March 31, 2007 decreased by ¥5,740 million compared
to the amounts that would have been reported by the previous accounting method.
The effect of the change on the segment information is described in Note 13.
(e) Derivative Transaction and Hedge Accounting
Derivative financial instruments are stated at fair value. Gains or losses resulting from
changes in fair value are recognized in income except for the derivative financial
instruments applied hedge accounting.
If derivative financial instruments are used as hedges and meet certain hedging criteria, the
Company defers recognition of gains or losses resulting from changes in fair value of
derivative financial instruments until the related losses or gains on the hedged items are
recognized.
However, in cases where forward foreign exchange contracts are used as hedges and meet
certain hedging criteria, forward foreign exchange contracts and hedged items are accounted
for in the following manner:
43

Mitsubishi Materials Corporation and Consolidated Subsidiaries
NOTES TO CONSOLIDATED FINANCIAL STATEMENTS
March 31, 2008, 2007 and 2006
(Continued)
17
1. If a forward foreign exchange contract is executed to hedge an existing foreign currency
receivable or payable,
(1) the difference, if any, between the Japanese yen amount of the hedged foreign
currency receivable or payable translated at the spot rate as of the inception date of
the contract and the carrying amount of the receivable or payable is recognized in the
consolidated statements of income in the period which includes the inception date,
and
(2) the discount or premium on the contract (that is, the difference between the Japanese
yen amount of the contract translated at the contracted forward rate and that translated
at the spot rate as of the inception date of the contract) is recognized in income over
the term of the contract.
2. If a forward foreign exchange contract is executed to hedge a future forecasted
transaction denominated in foreign currency, the future transaction will be recorded at the
contracted forward rate, and no gains or losses on the forward foreign exchange contract
are recognized.
Also, if interest rate swap contracts are used as hedges and meet certain hedging criteria, the
net amount to be paid or received under the contract is added to or deducted from the
interest on the assets or liabilities for which the swap contract was executed.
(f) Securities
Based on the intent of holding, securities are classified as (a) securities held for trading
purposes, (b) debt securities intended to be held to maturity (hereafter, “held-to-maturity
debt securities”), (c) equity securities issued by unconsolidated subsidiaries and affiliates
(hereafter, “equity securities”) and (d) all other securities that are not classified in any of the
above categories (hereafter, “available-for-sale securities”).
Held-to-maturity debt securities are stated at amortized cost. Equity securities, which are
not accounted for by the equity method, are stated at moving-average cost.
Available-for-sale securities with available fair market value are stated at fair market value.
Unrealized gains and losses on these securities are reported, net of applicable income taxes,
as a separate component of net assets. Realized gains and losses on sale of such securities
are computed with the moving-average cost. Available-for-sale securities with no available
fair market value are stated at moving-average cost. There are no securities held for trading
purposes.
44

Mitsubishi Materials Corporation and Consolidated Subsidiaries
NOTES TO CONSOLIDATED FINANCIAL STATEMENTS
March 31, 2008, 2007 and 2006
(Continued)
18
If the market value of held-to-maturity debt securities, equity securities, and
available-for-sale securities declines significantly, such securities are stated at fair market
value and the difference between the fair market value and the carrying amount is
recognized as losses in the period of decline. If the fair market value of these securities is
not readily available, such securities are written down to net asset value with corresponding
charge in the consolidated statement of income, in the event that net asset value declines
significantly. In these cases, such fair market value or net asset value will become the
carrying amount of the securities at the beginning of the next year.
(g) Property, Plant and Equipment and Depreciation
Property, plant and equipment are stated at cost, except for certain revalued land as
explained in Note 14. Depreciation is calculated primarily using the declining-balance
method at rates based on the estimated useful lives of depreciable assets. The straight-line
method is applied to certain plant facilities, such as those in the Naoshima smelter, etc.,
based on the estimated useful lives of those depreciable assets.
The useful lives of the assets range from 3 to 75 years for buildings and structures, and from
2 to 30 years for machinery and equipment.
Cost and accumulated depreciation applicable to assets retired or otherwise disposed of are
eliminated from the related accounts, and gain on sale or loss on disposal is credited or
charged to income. Expenditures for new facilities and those which substantially increase
the useful lives of existing property, plant, and equipment are capitalized. Maintenance,
repair and minor renewals are charged to income as incurred.
Following the amendments of the Corporation Tax Law of Japan, the method of
depreciation applied to the tangible assets acquired on or after April 1,2007 was revised.Due
to this revision of the tax law,operating profit and income before income taxes and minority
interests for the year ended March 31,2008 decreased by ¥961million ($9,597 thousand) and
¥967 million ($9,658 thousand), respectively, compared to the figures if the accounting
prior to the revision had been applied. The effect of the change on the segment information
is described in Note 13.
Due to the revised Corporation Tax Law of Japan, effective April 1,2007,the salvage values
of fixed assets acquired before April 1, 2007 are additionally depreciated to their nominal
values equally over five years commencing from the years immediately after the year in
which the depreciated bases have been reached to the 5% of their acquisition costs.
Consequently, operating profit and income before income taxes and minority interests for
the year ended March 31,2008 decreased by ¥4,250 million ($42,428 thousand) and ¥4,339
million ($43,311 thousand), respectively, compared to the figures if the accounting prior to
45

Mitsubishi Materials Corporation and Consolidated Subsidiaries
NOTES TO CONSOLIDATED FINANCIAL STATEMENTS
March 31, 2008, 2007 and 2006
(Continued)
19
the revision had been applied. The effect of the change on the segment information is
described in Note 13.
In the year ended March 31, 2008, Universal Can Corporation, a consolidated subsidiary,
changed the estimated useful lives and its salvage value of some tangible fixed assets based
on the recent trends of useful lives and disposal values extracted from the company’s factual
cases. Consequently, ¥1,400 million ($13,981 thousand) attributed to prior period
adjustment of the depreciation is included in other expense. The effect of the change on the
segment information is described in Note 13.
In the year ended March 31, 2007, the Company shortened the useful lives of the equipment
at Sanda Factory (Sanda, Hyogo prefecture) for production of semiconductors from 13 to 4
years considering the high capacity utilization due to the increase in the production demand
and the shortening of the product lifecycle.
Mitsubishi Polycrystalline Silicon America Corp. (Alabama), the consolidated subsidiary,
also shortened the useful lives of the equipment from the range from 5 to 30 years (21 years
on average) to the range from 3 to 20 years (17 years on average). That is because the
operating rate of the equipment has been over its original capacity since the year ended
March 31,2006 due to the continuous high demand in silicon wafers.
Consequently, the gross profit, the operating profit, and the income before income taxes and
minority interests for the year ended March 31, 2007 decreased by ¥691 million, compared
to the amounts that would have been reported by the previous accounting method.
The effect of the change on the segment information is described in Note 13.
(h) Loss on Impairment of Fixed Assets
Effective on April 1, 2005, the Company, the domestic consolidated subsidiaries, and the
domestic affiliates under the equity method have adopted “Accounting Standards for
Impairment Loss of Fixed Assets” (“Opinion for Regulating Accounting Standards for
Impairment Loss of Fixed Assets” (by Business Accounting Council, August 9, 2002)), and
“Guidelines for Implementing Accounting Standards for Impairment Loss of Fixed Assets”
(Accounting Standard Guideline No.6 by Accounting Standards Board of Japan, October 31,
2003). The Company, the domestic consolidated subsidiaries, and the domestic affiliates
under the equity method review their fixed assets for impairment, whenever events or
changes in circumstances indicate that the carrying amount of asset or asset group may not
be recoverable. A loss on impairment is recognized if the carrying amount of asset or asset
group exceeds the total undiscounted future cash flows expected to arise from the continued
use and the eventual disposition of asset or asset group. The loss on impairment would be an
excess of the carrying amount of asset over the recoverable amount, which is the higher of
the discounted cash flows from the continued use and eventual disposal of asset, or the net
selling price at the time of disposal. The amounts of loss on impairment were directly
46

Mitsubishi Materials Corporation and Consolidated Subsidiaries
NOTES TO CONSOLIDATED FINANCIAL STATEMENTS
March 31, 2008, 2007 and 2006
(Continued)
20
deducted from the amounts of each asset as cost adjustments. The effect of adopting those
accounting standards, including the loss on impairment recognized by the affiliates under
the equity method was to decrease the income before income taxes and minority interests by
¥16,945 million for the year ended March 31, 2006.
(i) Finance Leases
Finance leases are accounted for in the same manner as operating leases, unless the
ownership of the leased assets is considered to be transferred to the lessee.
(j) Severance and Pension Benefits
1. For employees
The Company provides two types of post-employment benefit plans, an unfunded lump-sum
severance payment plan, and funded defined benefit pension plans, under which all eligible
employees are entitled to benefits based on the level of wages and salaries at the time of
retirement or termination, the length of service, and certain other factors.
The Company provides allowance for employees’ severance and pension benefits, based on
the estimated amounts of projected benefit obligations that were actuarially calculated on
certain assumptions, and the fair value of plan assets at that date.
The negative prior service cost of ¥8,154 million, resulting from the revision of employee’s
retirement benefit policy in October 2000, is being amortized over five years and recorded
as other income in the year ended March 31, 2006. Prior service costs incurred after April 1,
2000, except for the negative prior service cost aforementioned, are recognized as expense
with the straight–line method over the period within the estimated average remaining
service life of the employees (mainly 10 years). Actuarial gains and losses are also
recognized as expense with the straight–line method over the estimated average remaining
service life (mainly 10 years), commencing from the succeeding period.
2. For officers
Officers (directors and corporate auditors) are entitled to lump-sum severance payments
based on the length of service and certain other factors. Some consolidated subsidiaries
accrue a liability for lump-sum severance payments equal to 100% of the amounts required,
had all officers voluntarily retired at the balance sheet dates.
At the 82nd shareholders’ meetings of the Company held on June 28, 2007, the proposal of
the termination of their retirement benefit programs for directors and corporate auditors
(under which payments would be made at the time of each person’s retirement) was
approved.Accordingly, the Company reversed the entire amount of accrual for officers’
47

Mitsubishi Materials Corporation and Consolidated Subsidiaries
NOTES TO CONSOLIDATED FINANCIAL STATEMENTS
March 31, 2008, 2007 and 2006
(Continued)
21
lump-sum severance benefits, and recorded unpaid balances of these retirement benefits as
of June30,2007, in the “Long-term liabilities-other”.
(k) Valuation Allowance for Investments in Unconsolidated Subsidiaries and Affiliates and
Reserve for Loss on Unconsolidated Subsidiaries and Affiliates
Valuation allowance for investments in unconsolidated subsidiaries and affiliates and
reserve for loss on unconsolidated subsidiaries and affiliates are provided for based on the
evaluation of individual financial and other conditions of subsidiaries and affiliates.
(l) Reserve for waste management cost
Reserve for waste management cost is provided for future payments for waste disposal,
based on the management estimation.
(m) Reserve for Clean-up Costs of Contaminated Land
Reserve for clean-up costs of contaminated land is provided to clean up soil contamination
at Omiya Environmental Management Center (the Central Research Institute formerly,
Saitama, Saitama prefecture) site and Kaihatsu Board Co., Ltd. (Aizu Daiken Kogyo Co.,
Ltd at present, Aizuwakamatsu, Fukushima prefecture) site, based on the management
estimation of future remedial cost to be paid.
Kaihatsu Board Co., Ltd. was a wholly-owned consolidated subsidiary, and the Company
sold all its stocks on April 10, 2007.
(n) Income Taxes
The Company provides for income taxes on the basis of current tax liabilities, and reflects
the tax effects of the temporary differences between the carrying amounts of assets and
liabilities for financial reporting purposes and their respective tax bases.
(o) Bonuses to Directors and Corporate Auditors
Bonuses to directors and corporate auditors are subject to approval by the shareholders.
Bonuses to directors and corporate auditors had been accounted for as an appropriation of
retained earnings for the year in which payment is made until the year ended March 31,
2006. Effective from the year ended March 31, 2007, the Company adopted “Accounting
Standard for Directors’ Bonus” (Statement No.4 issued by the Accounting Standards Board
of Japan on November 29, 2005) and bonuses to directors and corporate auditors are
accounted for as an expense of the period when incurred. The effect on net income of
adoption of this new accounting standard is not material.
48
Mitsubishi Materials Corporation and Consolidated Subsidiaries
NOTES TO CONSOLIDATED FINANCIAL STATEMENTS
March 31, 2008, 2007 and 2006
(Continued)
22
(p) Net Income per Share
Basic net income per share is computed based upon the weighted-average number of shares
of common stock outstanding during each period.
Diluted net income per share assumes that outstanding convertible bonds and zero-coupon
unsecured convertible bond-type bonds with stock acquisition rights were converted into
common stock at the beginning of the period at the current conversion price.
(q) Cash and Cash Equivalents
Cash and cash equivalents include all highly liquid investments with maturity of three
months or less at the time of purchase.
(r) Accounting Standard for Presentation of Net Assets in the Balance Sheet
Effective from the year ended March 31, 2007, the Company and its consolidated
subsidiaries adopted “Accounting Standard for Presentation of Net Assets in the Balance
Sheet” (Statement No.5 issued by the Accounting Standards Board of Japan on December 9,
2005), the implementation guidance for the accounting standard for presentation of net
assets in the balance sheet (the Financial Accounting Standard Implementation Guidance
No.8 issued by the Accounting Standards Board of Japan on December 9, 2005), revised
“Accounting Standards for Treasury shares and Appropriation of Legal Reserve and its
Implementation Guidance” (Statement No.1 issued by the Accounting Standards Board of
Japan on August 11, 2006) and revised “Guidance on Accounting Standard for Treasury
Shares and Appropriation of Legal Reserve” ( Statement No.2 issued by the Accounting
Standards Board of Japan on August 11, 2006)(collectively, “the New Accounting
Standards”).
The consolidated balance sheets as of March 31, 2008 and 2007 prepared in accordance
with the New Accounting Standards comprise three sections, which are the assets, liabilities
and net assets sections.
The adoption of the New Accounting Standards had no impacts on the consolidated
statements of income for the year ended March 31, 2008 and 2007.
(s) Accounting Standards for Statement of Changes in Net Assets
Effective from the year ended March 31, 2007, the Company and its consolidated
subsidiaries adopted the new accounting standard, “Accounting Standard for Statement of
Changes in Net Assets” (Statement No.6 issued by the Accounting Standards Board of
49
Mitsubishi Materials Corporation and Consolidated Subsidiaries
NOTES TO CONSOLIDATED FINANCIAL STATEMENTS
March 31, 2008, 2007 and 2006
(Continued)
23
Japan on December 27, 2005), and the implementation guidance for the accounting standard
for statement of changes in net assets (the Financial Accounting Standard Implementation
Guidance No.9 issued by the Accounting Standards Board of Japan on December 27, 2005),
(collectively, “the Additional New Accounting Standards”).
The Company prepared the accompanying consolidated statements of changes in net assets
for the year ended March 31, 2008 and 2007 in accordance with the Additional New
Accounting Standards. The accompanying consolidated statement of shareholders’ equity
for the year ended March 31, 2006, which was voluntarily prepared for inclusion in the
consolidated financial statements, has not been adapted to the new presentation rules of
2007.
(t) Accounting Standard for Business Combinations
Effective from the year ended March 31, 2007, the Company adopted “Accounting
Standards for Business Combination” issued by Business Accounting Council on October
31, 2003, “Accounting Standard for Business Divestitures and the related Implementation
Guidance” (Statement No.7 issued by the Accounting Standards Board of Japan on
December 27, 2005), Guidance on Accounting Standard for Business Combinations and
Accounting Standard for Business Divestitures (Guidance No.10 issued by the Accounting
Standards Board of Japan on December 27, 2005).
(u) Change in Accounting Method for Income for Industrial Waste Treatment in the “Cement”
Segment
In the previous years, the income for industrial waste treatment in the “Cement” had been
deducted from the cost of sales. In the year ended March 31, 2007, the Company has
changed its accounting method to include such income in the sales amount. This change was
made to reflect the revenue structure of the “Cement” more appropriately as the industrial
waste treatment has increased and become core revenue in the “Cement”.
Consequently, the sales and the cost of sales for the year ended March 31, 2007 increased
by ¥12,197 million, ¥11,917 million respectively, and the gross profit, the operating profit
and the income before income taxes and minority interests for the year ended March 31,
2007 increased by ¥279 million respectively, compared to the amounts that would have
been reported by the previous accounting method.
The effect of the change on the segment information is described in Note 13.
50
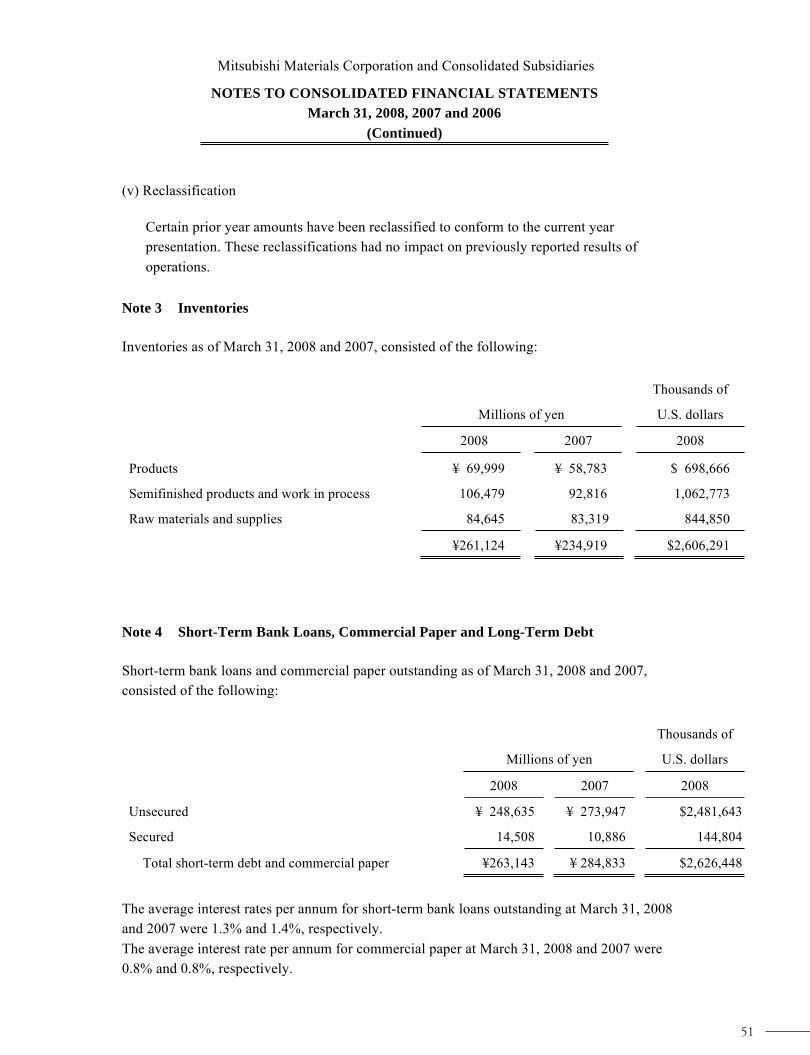
Mitsubishi Materials Corporation and Consolidated Subsidiaries
NOTES TO CONSOLIDATED FINANCIAL STATEMENTS
March 31, 2008, 2007 and 2006
(Continued)
24
(v) Reclassification
Certain prior year amounts have been reclassified to conform to the current year
presentation. These reclassifications had no impact on previously reported results of
operations.
Note 3 Inventories
Inventories as of March 31, 2008 and 2007, consisted of the following:
Millions of yen
Thousands of
U.S. dollars
2008 2007 2008
Products ¥ 69,999 ¥ 58,783 $ 698,666
Semifinished products and work in process 106,479 92,816 1,062,773
Raw materials and supplies 84,645 83,319 844,850
¥261,124 ¥234,919 $2,606,291
Note 4 Short-Term Bank Loans, Commercial Paper and Long-Term Debt
Short-term bank loans and commercial paper outstanding as of March 31, 2008 and 2007,
consisted of the following:
Millions of yen
Thousands of
U.S. dollars
2008 2007 2008
Unsecured ¥ 248,635 ¥ 273,947 $2,481,643
Secured 14,508 10,886 144,804
Total short-term debt and commercial paper ¥263,143 ¥ 284,833 $2,626,448
The average interest rates per annum for short-term bank loans outstanding at March 31, 2008
and 2007 were 1.3% and 1.4%, respectively.
The average interest rate per annum for commercial paper at March 31, 2008 and 2007 were
0.8% and 0.8%, respectively.
51

Mitsubishi Materials Corporation and Consolidated Subsidiaries
NOTES TO CONSOLIDATED FINANCIAL STATEMENTS
March 31, 2008, 2007 and 2006
(Continued)
25
Long-term debt as of March 31, 2008 and 2007, consisted of the following:
Millions of yen
Thousands of
U.S. dollars
2008 2007 2008
Banks, insurance companies and other financial
institutions, maturing serially until 2030 with an
average rate of 2.398% per annum as of March 31,
2008:
Unsecured ¥ 265,811 ¥ 251,314 $2,653,078
Secured 51,357 59,039 512,605
3.10% unsecured yen bonds, due 2008 - 10,000 -
1.54% unsecured yen bonds, due 2008 15,000 15,000 149,715
0.94% unsecured yen bonds, due 2010 20,000 20,000 199,620
1.39% unsecured yen bonds, due 2012 10,000 10,000 99,810
1.97% unsecured yen bonds, due 2011 20,000 20,000 199,620
1.82% unsecured yen bonds, due 2013 15,000 15,000 149,715
2.06% unsecured yen bonds, due 2014 30,000 - 299,431
427,169 400,353 4,263,598
Less current portion (101,323) (75,284) (1,011,313)
¥ 325,846 ¥ 325,068 $ 3,252,284
The aggregate annual maturities of long-term debt as of March 31, 2008, are as follows:
Year ending March 31, Millions of yen
Thousands of
U.S. dollars
2009 ¥ 101,323 $ 1,011,313
2010 62,436 623,181
2011 60,356 602,419
2012 47,789 476,988
2013 63,169 630,500
2014 and thereafter 92,094 919,194
¥ 427,169 $4,263,598
52

Mitsubishi Materials Corporation and Consolidated Subsidiaries
NOTES TO CONSOLIDATED FINANCIAL STATEMENTS
March 31, 2008, 2007 and 2006
(Continued)
26
Assets pledged as collateral for short-term bank loans and long-term debt as of March 31, 2008
and 2007, were as follows:
Millions of yen
Thousands of
U.S. dollars
2008 2007 2008
Cash and time deposits ¥6,611 ¥ 13,718 $65,993
Notes and accounts receivable 8,162 1,890 81,473
Inventories 17,993 24,981 179,591
Investments:
Investments in securities 326 50 3,262
Unconsolidated subsidiaries and affiliates 33 481 330
Property, plant and equipment, at net book value 148,476 156,849 1,481,949
Other 344 350 3,440
¥181,949 ¥ 198,321 $1,816,041
53

Mitsubishi Materials Corporation and Consolidated Subsidiaries
NOTES TO CONSOLIDATED FINANCIAL STATEMENTS
March 31, 2008, 2007 and 2006
(Continued)
27
Note 5 Employees' Severance and Pension Benefits
Employees' severance and pension benefits included in the consolidated balance sheets as of
March 31, 2008 and 2007, consisted of the following:
Millions of yen
Thousands of
U.S. dollars
2008 2007 2008
Projected benefit obligation ¥128,591 ¥ 134,153 $1,283,475
Fair value of pension assets (62,078) (78,581) (619,611)
Projected benefit obligation in excess of pension
assets 66,512 55,571 663,863
Unrecognized actuarial losses (18,409) (6,690) (183,741)
Unrecognized prior service costs (78) (216) (781)
Net liability for severance and retirement benefits 48,025 48,664 479,340
Prepaid pension costs 336 189 3,354
Employees’ severance and pension benefits ¥48,361 ¥ 48,853 $482,694
54

Mitsubishi Materials Corporation and Consolidated Subsidiaries
NOTES TO CONSOLIDATED FINANCIAL STATEMENTS
March 31, 2008, 2007 and 2006
(Continued)
28
Employees' severance and pension benefit expense included in the consolidated statements of
income for the years ended March 31, 2008, 2007 and 2006, consisted of the following:
Millions of yen
Thousands of
U.S. dollars
2008 2007 2006 2008
Service cost benefits earned during the
year ¥ 7,391 ¥ 6,285 ¥ 6,230 $ 73,775
Interest cost on projected benefit
obligation 2,663 2,824 2,904 26,588
Expected return on plan assets (1,621) (1,444) (1,211) (16,188)
Amortization of actuarial losses 2,839 2,809 3,828 28,342
Amortization of prior service costs 288 32 (778) 2,876
Employees' severance and pension benefit
expense ¥ 11,561 ¥ 10,508 ¥ 10,973 $115,394
The discount rate used by the Company was mainly 2.5% for the years ended March 31, 2008,
2007 and 2006. The rates of expected return on plan assets were mainly 2.5% for the years
ended March 31, 2008, 2007 and 2006. The estimated amounts of all retirement benefits to be
paid at the future retirement dates are allocated equally to each service year using the estimated
number of total service years.
Amortization of negative prior service costs resulting from the revision of employees’
retirement policy in October 2000, amounting to ¥815 million income for the years ended
March 31, 2006, was included in other income in the accompanying consolidated statements of
income.
55

Mitsubishi Materials Corporation and Consolidated Subsidiaries
NOTES TO CONSOLIDATED FINANCIAL STATEMENTS
March 31, 2008, 2007 and 2006
(Continued)
29
Note 6 Net Assets
The Japanese Corporate Law (“the Law”) became effective on May 1, 2006, replacing the
Japanese Commercial Code (“the Code”). The Law is generally applicable to events and
transactions occurring after April 30, 2006 and for fiscal years ending after that date.
Under Japanese laws and regulations, the entire amount paid for new shares is required to be
designated as common stock. However, a company may, by a resolution of the Board of
Directors, designate an amount not exceeding one-half of the price of the new shares as
additional paid-in-capital, which is included in capital surplus.
Under the Law, in cases where a dividend distribution of surplus is made, the smaller of an
amount equal to 10% of the dividend or the excess, if any, of 25% of common stock over the
total of additional paid-in-capital and legal earnings reserve must be set aside as additional
paid-in-capital or legal earnings reserve. Legal earnings reserve is included in retained earnings
in the accompanying consolidated balance sheets.
Under the Code, companies were required to set aside an amount equal to at least 10% of the
aggregate amount of cash dividends and other cash appropriations as legal earnings reserve until
the total of legal earnings reserve and additional paid-in-capital equaled 25% of common stock.
Under the Code, legal earnings reserve and additional paid-in capital could be used to eliminate
or reduce a deficit by a resolution of the shareholders’ meeting or could be capitalized by a
resolution of the Board of Directors. Under the Law, both of these appropriations generally
require a resolution of the shareholders’ meeting.
Additional paid-in capital and legal earnings reserve may not be distributed as dividends. Under
the Code, however, on condition that the total amount of legal earnings reserve and additional
paid-in capital remained equal to or exceeded 25% of common stock, they were available for
distribution by resolution of the shareholders’ meeting. Under the Law, all additional paid-in
capital and all legal earnings reserve may be transferred to other capital surplus and retained
earnings, respectively, which are potentially available for dividends.
The maximum amount that the Company can distribute as dividends is calculated based on the
non-consolidated financial statements of the Company in accordance with Japanese laws and
regulations.
56
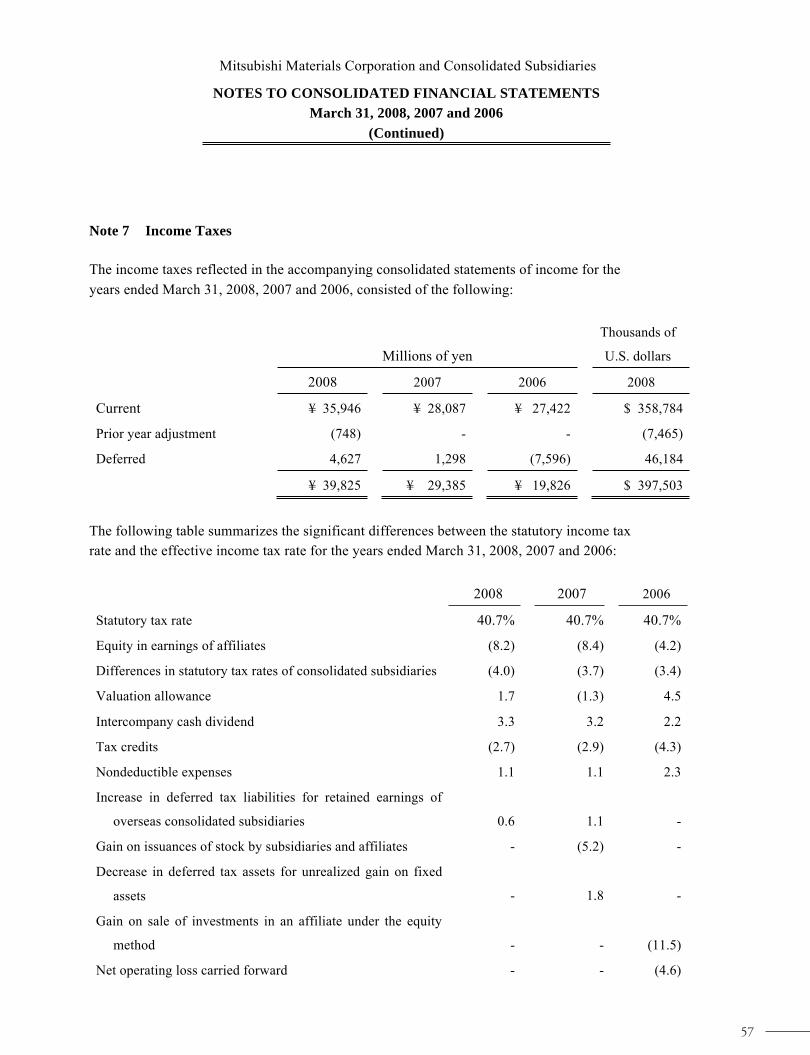
Mitsubishi Materials Corporation and Consolidated Subsidiaries
NOTES TO CONSOLIDATED FINANCIAL STATEMENTS
March 31, 2008, 2007 and 2006
(Continued)
30
Note 7 Income Taxes
The income taxes reflected in the accompanying consolidated statements of income for the
years ended March 31, 2008, 2007 and 2006, consisted of the following:
Millions of yen
Thousands of
U.S. dollars
2008 2007 2006 2008
Current ¥ 35,946 ¥ 28,087 ¥ 27,422 $ 358,784
Prior year adjustment (748) - - (7,465)
Deferred 4,627 1,298 (7,596) 46,184
¥ 39,825 ¥ 29,385 ¥ 19,826 $ 397,503
The following table summarizes the significant differences between the statutory income tax
rate and the effective income tax rate for the years ended March 31, 2008, 2007 and 2006:
2008 2007 2006
Statutory tax rate 40.7% 40.7% 40.7%
Equity in earnings of affiliates (8.2) (8.4) (4.2)
Differences in statutory tax rates of consolidated subsidiaries (4.0) (3.7) (3.4)
Valuation allowance 1.7 (1.3) 4.5
Intercompany cash dividend 3.3 3.2 2.2
Tax credits (2.7) (2.9) (4.3)
Nondeductible expenses 1.1 1.1 2.3
Increase in deferred tax liabilities for retained earnings of
overseas consolidated subsidiaries 0.6 1.1 -
Gain on issuances of stock by subsidiaries and affiliates - (5.2) -
Decrease in deferred tax assets for unrealized gain on fixed
assets - 1.8 -
Gain on sale of investments in an affiliate under the equity
method - - (11.5)
Net operating loss carried forward - - (4.6)
57

Mitsubishi Materials Corporation and Consolidated Subsidiaries
NOTES TO CONSOLIDATED FINANCIAL STATEMENTS
March 31, 2008, 2007 and 2006
(Continued)
31
Other (0.3) 0.9 1.6
Effective tax rate 32.2% 27.2% 23.3%
Significant components of deferred income tax assets and liabilities as of March 31, 2008 and
2007 were as follows:
Millions of yen
Thousands of
U.S. dollars
2008 2007 2008
Deferred income tax assets:
Employees’ severance and pension benefits ¥20,779 ¥ 20,686 $ 207,404
Net operating loss carried forward 12,325 15,584 123,018
Loss on write-down of building 8,859 9,380 88,422
Intercompany profits 8,580 8,427 85,643
Accrued employees’ bonuses 5,377 5,266 53,677
Reserve for clean-up costs of contaminated land 4,622 4,897 46,136
Nondeductible loss on impairment of fixed assets 3,874 3,652 38,666
Loss on write-down of securities 3,111 3,214 31,056
Reserve for waste management cost 2,347 - 23,425
Nondeductible environmental expenditures 2,175 2,175 21,711
Loss on write-down of inventories 2,087 2,039 20,839
Allowance for doubtful accounts 1,987 - 19,833
Nondeductible compensation expenditures 1,444 1,444 14,417
Deferred losses on hedges - 3,487 -
Other 16,947 18,419 169,155
Subtotal 94,520 98,675 943,408
Valuation allowance (26,492) (23,370) (264,420)
Total deferred income tax assets ¥ 68,027 ¥ 75,305 $ 678,987
58

Mitsubishi Materials Corporation and Consolidated Subsidiaries
NOTES TO CONSOLIDATED FINANCIAL STATEMENTS
March 31, 2008, 2007 and 2006
(Continued)
32
Millions of yen
Thousands of
U.S. dollars
2008 2007 2008
Deferred income tax liabilities:
Excess of fair value over the book value of the assets and
liabilities of the consolidated subsidiaries and affiliates at
the acquisition date ¥(9,057) ¥ (11,361) $(90,400)
Accelerated depreciation of property, plant and equipment (6,320) (8,049) (63,084)
Deferred gain on sale of property, plant and equipment (2,867) (1,948) (28,616)
Reserves deductible for Japanese tax purposes (2,105) (1,928) (21,015)
Revaluation of land, as a result of the merger (1,996) - (19,927)
Net unrealized holding gains on securities (20,690) (37,258) (206,516)
Retained earnings of overseas consolidated subsidiaries (4,206) (3,420) (41,980)
Unrealized gains on hedging derivatives (2,290) (3,334) (22,859)
Other (5,233) (4,212) (52,236)
Total deferred income tax liabilities (54,767) (71,513) (546,638)
Net deferred income tax assets ¥13,260 ¥ 3,791 $132,349
Net deferred income tax liabilities on revaluation reserve for
land ¥(40,584) ¥(34,831) $(405,070)
59

Mitsubishi Materials Corporation and Consolidated Subsidiaries
NOTES TO CONSOLIDATED FINANCIAL STATEMENTS
March 31, 2008, 2007 and 2006
(Continued)
33
Note 8 Contingent Liabilities
Contingent liabilities for notes receivable discounted with banks, notes receivable endorsed with
recourse, notes and accounts receivable securitized with recourse, and loans guaranteed by the
Company and its consolidated subsidiaries primarily on behalf of unconsolidated subsidiaries
and affiliates, including employees’ housing loans from banks, as of March 31, 2008 and 2007,
were as follows:
Millions of yen
Thousands of
U.S. dollars
2008 2007 2008
Notes receivable discounted ¥748 ¥ 5,082 $7,471
Notes receivable endorsed with recourse 73 88 732
Notes and accounts receivable securitized with
recourse 7,614 6,174 76,002
Loans guaranteed 28,903 33,488 288,483
¥37,339 ¥ 44,834 $372,688
Loans guaranteed as of March 31, 2008 include a ¥3,696 million ($36,899 thousand) portion
guaranteed by unrelated parties.
60
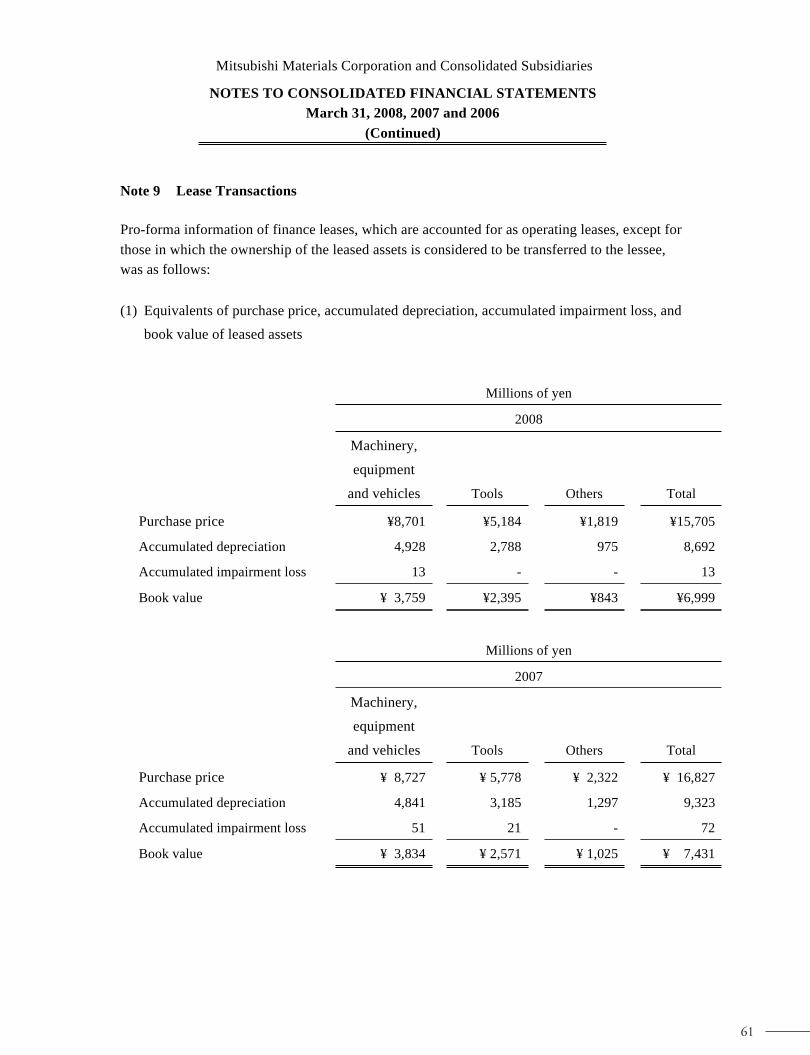
Mitsubishi Materials Corporation and Consolidated Subsidiaries
NOTES TO CONSOLIDATED FINANCIAL STATEMENTS
March 31, 2008, 2007 and 2006
(Continued)
34
Note 9 Lease Transactions
Pro-forma information of finance leases, which are accounted for as operating leases, except for
those in which the ownership of the leased assets is considered to be transferred to the lessee,
was as follows:
(1) Equivalents of purchase price, accumulated depreciation, accumulated impairment loss, and
book value of leased assets
Millions of yen
2008
Machinery,
equipment
and vehicles Tools Others Total
Purchase price ¥8,701 ¥5,184 ¥1,819 ¥15,705
Accumulated depreciation 4,928 2,788 975 8,692
Accumulated impairment loss 13 - - 13
Book value ¥ 3,759 ¥2,395 ¥843 ¥6,999
Millions of yen
2007
Machinery,
equipment
and vehicles Tools Others Total
Purchase price ¥ 8,727 ¥ 5,778 ¥ 2,322 ¥ 16,827
Accumulated depreciation 4,841 3,185 1,297 9,323
Accumulated impairment loss 51 21 - 72
Book value ¥ 3,834 ¥ 2,571 ¥ 1,025 ¥ 7,431
61

Mitsubishi Materials Corporation and Consolidated Subsidiaries
NOTES TO CONSOLIDATED FINANCIAL STATEMENTS
March 31, 2008, 2007 and 2006
(Continued)
35
Thousands of U.S. dollars
2008
Machinery,
equipment
and vehicles Tools Others Total
Purchase price $86,850 $51,748 $18,159 $156,759
Accumulated depreciation 49,187 27,834 9,736 86,757
Accumulated impairment loss 134 - - 134
Book value $37,528 $23,914 $8,423 $69,866
(2) Lease commitments and accumulated impairment loss on leased assets
Millions of yen
Thousands of
U.S. dollars
2008 2007 2008
Lease commitments:
Due within one year ¥2,602 ¥ 2,601 $25,979
Due after one year 4,401 4,897 43,928
Total ¥7,004 ¥ 7,498 $ 69,907
Accumulated impairment loss on
leased assets ¥ 5 ¥ 67 $ 50
62

Mitsubishi Materials Corporation and Consolidated Subsidiaries
NOTES TO CONSOLIDATED FINANCIAL STATEMENTS
March 31, 2008, 2007 and 2006
(Continued)
36
(3) Lease expenses, depreciation equivalents, reversal of accumulated impairment loss on
leased assets, and loss on impairment
Millions of yen
Thousands of
U.S. dollars
2008 2007 2006 2008
Lease expenses ¥2,802 ¥ 2,894 ¥ 2,946 $27,969
Depreciation equivalents 2,739 2,890 2,941 27,347
Reversal of accumulated impairment
loss on leased assets 62 3 5 621
Loss on impairment - 59 17 -
Noncancelable operating lease commitments were as follows:
Millions of yen
Thousands of
U.S. dollars
2008 2007 2008
Due within one year ¥2,700 ¥ 1,876 $26,957
Due after one year 4,107 3,752 41,001
Total ¥6,808 ¥ 5,629 $67,959
Note 10 Research and Development Expenses
Research and development expenses for the years ended March 31, 2008, 2007 and 2006, were
¥11,676 million ($ 116,544 thousand), ¥11,112 million and ¥10,859 million, respectively, and
were included in selling, general and administrative expenses.
63
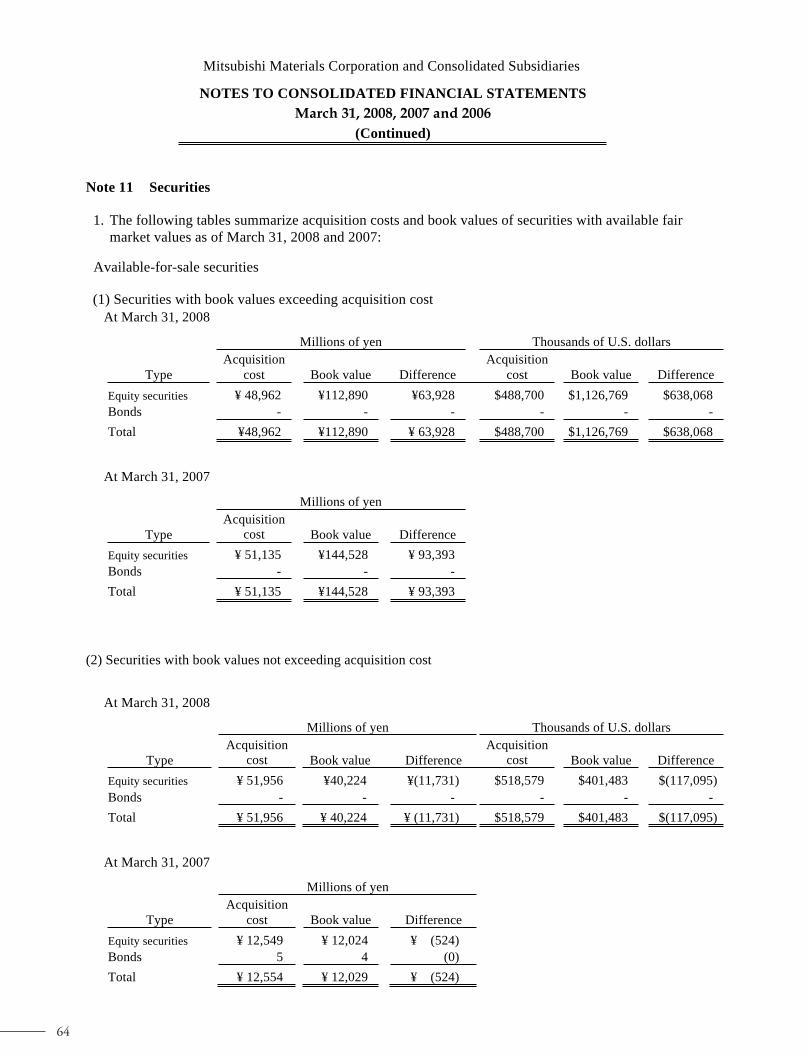
Mitsubishi Materials Corporation and Consolidated Subsidiaries
NOTES TO CONSOLIDATED FINANCIAL STATEMENTS
March 31, 2008, 2007 and 2006
(Continued)
37
Note 11 Securities
1. The following tables summarize acquisition costs and book values of securities with available fair
market values as of March 31, 2008 and 2007:
Available-for-sale securities
(1) Securities with book values exceeding acquisition cost
At March 31, 2008
Millions of yen Thousands of U.S. dollars
Type
Acquisition
cost Book value Difference
Acquisition
cost Book value Difference
Equity securities ¥ 48,962 ¥112,890 ¥63,928 $488,700 $1,126,769 $638,068
Bonds - - - - - -
Total ¥48,962 ¥112,890 ¥ 63,928 $488,700 $1,126,769 $638,068
At March 31, 2007
Millions of yen
Type
Acquisitioncost Book value Difference
Equity securities ¥ 51,135 ¥144,528 ¥ 93,393
Bonds - - -
Total ¥ 51,135 ¥144,528 ¥ 93,393
(2) Securities with book values not exceeding acquisition cost
At March 31, 2008
Millions of yen Thousands of U.S. dollars
Type
Acquisitioncost Book value Difference
Acquisitioncost Book value Difference
Equity securities ¥ 51,956 ¥40,224 ¥(11,731) $518,579 $401,483 $(117,095)
Bonds - - - - - -
Total ¥ 51,956 ¥ 40,224 ¥ (11,731) $518,579 $401,483 $(117,095)
At March 31, 2007
Millions of yen
Type
Acquisition
cost Book value Difference
Equity securities ¥ 12,549 ¥ 12,024 ¥ (524)
Bonds 5 4 (0)
Total ¥ 12,554 ¥ 12,029 ¥ (524)
64

Mitsubishi Materials Corporation and Consolidated Subsidiaries
NOTES TO CONSOLIDATED FINANCIAL STATEMENTS
March 31, 2008, 2007 and 2006
(Continued)
38
2. The following table summarizes book values of securities with no available fair market values as
of March 31, 2008 and 2007:
Available-for-sale securities
Book value
Millions of yen
Thousands of U.Sdollars
Type 2008 2007 2008
Unlisted equity securities ¥15,000 ¥15,600 $149,718
Corporate bonds - - -
Others 11 3 114
Total ¥15,011 ¥15,604 $149,832
3. The following table summarizes maturities of available-for-sale securities with maturity, and
held-to-maturity debt securities as of March 31, 2008 and 2007:
The company did not hold any available-for-sale securities with maturity, and held-to-maturity debt
securities as of March 31, 2008.
At March 31, 2007 Millions of yen
Type
Within
one year
Over one year
but within
five years
Over five years
but within
ten years
Over
ten years Total
Available-for-sale securities:
Government or local bonds ¥ 4 ¥ - ¥ - ¥ - ¥ 4
Corporate bonds - - - - -
Other bonds - - - - -
Total ¥ 4 ¥ - ¥ - ¥ - ¥ 4
4. Total amounts of available-for-sale securities sold, and the resulting gains and losses, in the years
ended March 31, 2008 and 2007, were as follows:
Millions of yen Thousands of
U.S dollars
2008 2007 2008
Sales amount ¥1,048 ¥4,299 $10,468
Gains 298 1,419 2,983Losses 62 19 619
65

Mitsubishi Materials Corporation and Consolidated Subsidiaries
NOTES TO CONSOLIDATED FINANCIAL STATEMENTS
March 31, 2008, 2007 and 2006
(Continued)
39
Note 12 Derivative Transactions
Derivative financial instruments currently utilized by the Company and its consolidated subsidiaries
include forward foreign currency contracts, interest rate swap contracts, currency swap contracts,
forward commodity contracts and commodity price swap contracts.
The Company utilizes forward foreign currency contracts to hedge the impact of foreign exchange
fluctuations on receivables and payables, and on advance payments for purchase of ores.
The Company enters into interest rate swap contracts to reduce exposure to adverse movements in
interest rates, and to lower finance costs on debts.
The Company also utilizes forward commodity contracts to hedge the impact of future price
fluctuations of nonferrous metal inventories and sold gold bullion deposited from customers under
consuming bailment named “My Gold Plan”.
Some consolidated subsidiaries utilize forward foreign currency contracts and interest swap contracts
to hedge the impact of foreign currency fluctuations on foreign currency receivables and payables, and
forward commodity contracts and commodity price swap contracts to hedge the impact of price
fluctuations of nonferrous metal inventories.
The counterparties to those derivative contracts are Japanese and overseas companies and financial
institutions with high credit standing, and therefore, it is anticipated that those counterparties will be
able to fully satisfy their obligations under the contracts.
The Company has “Rules on Utilizing Derivative Transactions” in its “Operation Standards”
applicable to the whole Company. In addition, there are specific rules and standards for derivative
transactions provided for each business unit based on its type of business. In accordance with the
authority and limits provided in these rules and standards, forward foreign currency contracts are
utilized and controlled by the Finance Department and other responsible departments; interest rate
swap contracts by the Finance Department and other responsible departments; and forward commodity
contracts by each responsible department. Furthermore, departments utilizing derivative transactions
are required to report the status and results of derivative transactions to the risk control section for
financial transaction, at each annual and semi-annual year-end.
Consolidated subsidiaries utilizing derivative transactions have provided the operational standards
individually, according to the purpose of derivative transactions.
The Company evaluates hedge effectiveness by comparing the cumulative changes in cash flows or
the changes in fair value of the hedged items with the corresponding changes in the hedging derivative
instruments. Furthermore, the Company periodically controls the transaction volume of forward
commodity contracts in order to balance them with hedged nonferrous metal inventories, and to
evaluate their hedge effectiveness at each annual and semi-annual year-end.
66

Mitsubishi Materials Corporation and Consolidated Subsidiaries
NOTES TO CONSOLIDATED FINANCIAL STATEMENTS
March 31, 2008, 2007 and 2006
(Continued)
40
As of March 31, 2008 and 2007, the Company and its consolidated subsidiaries had outstanding
derivative transactions as follows:
(a) Forward Foreign Currency Contracts
At March 31, 2008
Millions of yen
Contract amounts in yen equivalent
Due within
one year
Due after
one year Total Fair value
Unrealized
gains (losses)
Forward exchange contracts
Sell U.S. dollars ¥38,434 ¥ - ¥ 38,434 ¥ 36,710 ¥1,724
Other 1,568 - 1,568 1,555 12
Buy U.S. dollars 3,707 - 3,707 3,679 (27) Other 151 - 151 154 3
Total ¥1,713
At March 31, 2007 Millions of yen
Contract amounts in yen equivalent
Due within
one year
Due after
one year Total Fair value
Unrealized
gains (losses)
Forward exchange contracts
Sell U.S. dollars ¥ 47,672 ¥ - ¥ 47,672 ¥ 47,543 ¥ 128 Other 958 - 958 972 (14)
Buy U.S. dollars 1,664 138 1,803 1,979 176 Other 222 - 222 223 0
Total ¥ 290
At March 31, 2008 Thousands of U.S. dollars
Contract amounts in U.S. dollar equivalent
Due within one year
Due after one year Total Fair value
Unrealizedgains (losses)
Forward exchange contracts Sell U.S. dollars $383,620 $ - $383,620 $ 366,411 $ 17,209 Other 15,657 - 15,657 15,528 129
Buy U.S. dollars 36,999 36,999 36,723 (276) Other 1,510 - 1,510 1,546 36
Total $17,098
Fair value of forward exchange contracts is stated based on the quoted market price.
67

Mitsubishi Materials Corporation and Consolidated Subsidiaries
NOTES TO CONSOLIDATED FINANCIAL STATEMENTS
March 31, 2008, 2007 and 2006
(Continued)
41
The above information does not include forward exchange contracts and currency swap contracts
executed to hedge existing foreign currency receivables or payables.
Forward exchange contracts shown above are primarily utilized to hedge the impact of foreign
currency fluctuations on advance payments for the purchase of ores, and unrealized gains or losses
are deferred until the related gains or losses on the hedged items are recognized.
(b) Interest Rate Contracts
At March 31, 2008
Millions of yen
Notional amounts
Due within one year
Due after one year Total Fair value
Unrealizedlosses
Interest rate swap contracts
Pay floating rate, receive fixed rate
Pay fixed rate, receive floating rate
¥ -
17,979
¥ 1,000
111,976
¥ 1,000
129,956
¥ (9)
(2,072)
¥ (9)
(2,072)
Total ¥ (2,081)
At March 31, 2007
Millions of yen
Notional amounts
Due within one year
Due after one year Total Fair value
Unrealizedlosses
Interest rate swap contracts
Pay floating rate, receive fixed rate ¥ - ¥ 1,000 ¥ 1,000 ¥ (28) ¥ (28)
Pay fixed rate, receive floating rate 17,642 78,657 96,300 (702) (702)
Total ¥ (730)
At March 31, 2008
Thousands of U.S. dollars
Notional amounts
Due within one year
Due after one year Total Fair value
Unrealizedlosses
Interest rate swap contracts
Pay floating rate, receive fixed rate
Pay fixed rate, receive floating rate
$ -
179,454
$9,981
1,117,643
$9,981
1,297,098
$(96)
(20,682)
$ (96)
(20,682)
Total $(20,779)
Fair value is stated based on the current offer price from financial institutions.
With respect to interest rate swap contracts used as hedge and meeting certain hedging criteria, the
net amounts to be paid or received under the interest rate swap contract are added to or deducted
from the interest on the liabilities for which the swap contract was executed, and the information
for such contracts is included in the above tables.
68

Mitsubishi Materials Corporation and Consolidated Subsidiaries
NOTES TO CONSOLIDATED FINANCIAL STATEMENTS
March 31, 2008, 2007 and 2006
(Continued)
42
(c) Commodity Contracts
At March 31, 2008
Millions of yen
Contract amounts
Due within one year
Due after one year Total Fair value
Unrealizedgains (losses)
Nonferrous metals forward
Sell ¥ 56,682 ¥ 74 ¥ 56,757 ¥ 58,364 ¥ (1,606)
Buy 121,728 4,014 125,742 134,763 9,020
Nonferrous metal commodity price swap
Pay fixed price, receive floating price 1,062 708 1,770 1,271 1,271
Total ¥ 8,685
At March 31, 2007
Millions of yen
Contract amounts
Due within one year
Due after one year Total Fair value
Unrealizedgains (losses)
Nonferrous metals forward
Sell ¥ 68,181 ¥ 427 ¥ 68,609 ¥ 76,956 ¥ (8,347)
Buy 95,626 7,495 103,121 109,070 5,948
Nonferrous metal commodity price swap
Pay fixed price, receive floating price 1,486 1,770 3,256 2,247 2,247
Total ¥ (151)
At March 31, 2008
Thousands of U.S. dollars
Contract amounts
Due within one year
Due after one year Total Fair value
Unrealizedgains (losses)
Nonferrous metals forward
Sell $565,753 $747 $566,501 $582,534 $ (16,033)
Buy 1,214,973 40,064 1,255,037 1,345,074 90,036
Nonferrous metal commodity price swap
Pay fixed price, receive floating price 10,599 7,066 17,666 12,689 12,689
Total $ 86,693
Fair value is stated based on the quoted market price.
Unrealized gains or losses on forward commodity contracts, and commodity price swap contracts
which are utilized to hedge future price fluctuations of nonferrous metals, are deferred until related
losses or gains on the hedged items are recognized.
The Company does not apply the hedge accounting to the forward commodity contracts for gold
bullion.
69

Mitsubishi Materials Corporation and Consolidated Subsidiaries
NOTES TO CONSOLIDATED FINANCIAL STATEMENTS
March 31, 2008, 2007 and 2006
(Continued)
43
Note 13 Segment Information
(a) The Companies operate primarily in the production and sales of cement, metals, advanced
materials & tools, electronic materials, aluminum & components, and others. Cement comprises
cement, secondary cement product, ready-mixed concrete, and building materials; metals comprise
copper smelting, and processed copper products; advanced materials & tools comprise superhard
tools, powder metallurgy, highly efficient materials, and diamond tools; electronic materials &
components comprise advanced materials, chemical products, electronic device products, and
polycrystalline silicon; aluminum comprises aluminum cans, rolled aluminum products, and
processed aluminum products; and others comprise engineering, nuclear energy, precious metals,
environment & recycle related products, and real estate.
Business segment information for the years ended March 31, 2008, 2007 and 2006 was as follows:
Year ended March 31, 2008 Millions of yen
Cement Metals
Advanced
materials &
tools
Electronic
materials &
components Aluminum Others Total
Elimination
and corporate
assets or
expenses Consolidated
Sales:
Unaffiliated
customers ¥185,074 ¥684,497 ¥150,040 ¥91,759 ¥169,143 ¥378,771 ¥1,659,286 ¥ - ¥1,659,286
Intersegment 1,697 115,198 20,775 3,957 1,332 69,550 212,511 (212,511) -
Total 186,772 799,695 170,816 95,716 170,475 448,321 1,871,797 (212,511) 1,659,286
Operating
expenses 172,846 753,641 151,504 81,381 165,144 438,727 1,763,246 (204,107) 1,559,139
Operating
profit ¥13,925 ¥46,053 ¥19,311 ¥14,334 ¥5,330 ¥9,594 ¥108,550 ¥(8,403) ¥100,146
Identifiable assets ¥268,847 ¥500,705 ¥174,760 ¥190,077 ¥164,655 ¥316,511 ¥1,615,558 ¥240,718 ¥1,856,276
Depreciation ¥12,849 ¥15,672 ¥8,968 ¥5,698 ¥10,174 ¥3,924 ¥57,287 ¥2,230 ¥59,518
Capital
expenditures ¥16,653 ¥25,980 ¥11,443 ¥9,674 ¥6,720 ¥3,814 ¥74,287 ¥1,359 ¥75,646
70

Mitsubishi Materials Corporation and Consolidated Subsidiaries
NOTES TO CONSOLIDATED FINANCIAL STATEMENTS
March 31, 2008, 2007 and 2006
(Continued)
44
Year ended March 31, 2007 Millions of yen
Cement Metals
Advanced
materials &
tools
Electronic
materials &
components Aluminum Others Total
Elimination
and corporate
assets or
expenses Consolidated
Sales:
Unaffiliated
customers ¥198,288 ¥598,921 ¥138,095 ¥ 85,189 ¥162,841 ¥268,771 ¥1,452,108 ¥ - ¥1,452,108
Intersegment 1,581 81,516 14,925 3,185 1,234 61,996 164,439 (164,439) -
Total 199,869 680,438 153,020 88,375 164,075 330,767 1,616,547 (164,439) 1,452,108
Operating
expenses 181,533 647,043 136,906 77,986 161,225 326,033 1,530,729 (157,379) 1,373,349
Operating
profit ¥ 18,335 ¥ 33,395 ¥ 16,114 ¥ 10,388 ¥ 2,849 ¥ 4,733 ¥ 85,818 ¥ (7,059) ¥ 78,758
Identifiable assets ¥280,368 ¥466,294 ¥166,433 ¥169,282 ¥183,585 ¥306,280 ¥1,572,245 ¥ 201,654 ¥1,773,899
Depreciation ¥ 10,216 ¥ 12,455 ¥ 6,894 ¥ 4,970 ¥ 8,921 ¥ 3,821 ¥ 47,279 ¥ 2,137 ¥ 49,416
Capital
expenditures ¥ 21,114 ¥ 11,626 ¥ 12,702 ¥ 8,162 ¥ 6,481 ¥ 4,970 ¥ 65,058 ¥ 1,425 ¥ 66,484
Year ended March 31, 2006 Millions of yen
Cement Metals
Advanced
materials &
tools
Electronic
materials &
components Aluminum Others Total
Elimination
and corporate
assets or
expenses Consolidated
Sales:
Unaffiliated
customers ¥164,501 ¥358,765 ¥147,908 ¥ 75,525 ¥143,093 ¥253,908 ¥1,143,700 ¥ - ¥1,143,700
Intersegment 553 68,696 14,250 2,480 699 51,882 138,560 (138,560) -
Total 165,054 427,461 162,158 78,005 143,792 305,790 1,282,260 (138,560) 1,143,700
Operating
expenses 149,415 404,499 142,173 73,191 140,351 297,918 1,207,547 (132,829) 1,074,718
Operating
profit ¥ 15,639 ¥ 22,962 ¥ 19,985 ¥ 4,814 ¥ 3,441 ¥ 7,872 ¥ 74,713 ¥ (5,731) ¥ 68,982
Identifiable assets ¥264,000 ¥395,493 ¥162,855 ¥137,310 ¥180,913 ¥307,648 ¥1,448,219 ¥ 161,227 ¥1,609,446
Depreciation ¥ 9,582 ¥ 10,846 ¥ 7,155 ¥ 4,361 ¥ 9,478 ¥ 4,039 ¥ 45,461 ¥ 2,223 ¥ 47,684
Capital
expenditures ¥ 14,127 ¥ 10,965 ¥ 11,063 ¥ 4,801 ¥ 5,992 ¥ 3,817 ¥ 50,765 ¥ 1,794 ¥ 52,559
71
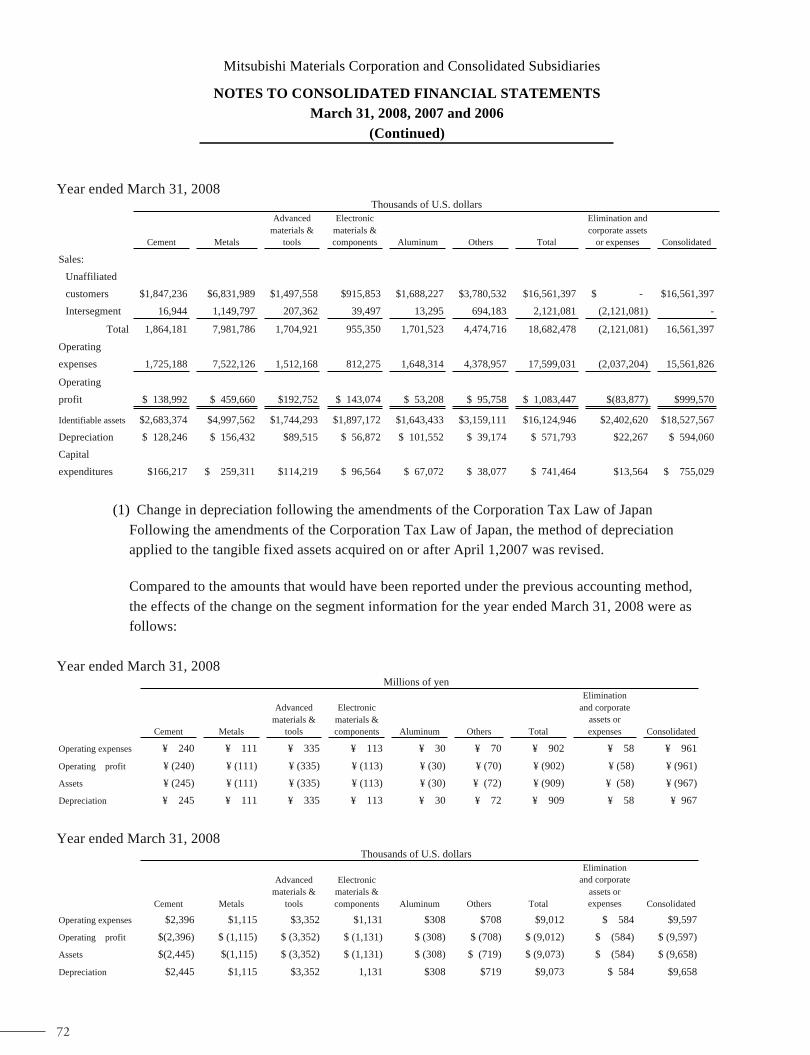
Mitsubishi Materials Corporation and Consolidated Subsidiaries
NOTES TO CONSOLIDATED FINANCIAL STATEMENTS
March 31, 2008, 2007 and 2006
(Continued)
45
Year ended March 31, 2008 Thousands of U.S. dollars
Cement Metals
Advanced
materials &
tools
Electronic
materials &
components Aluminum Others Total
Elimination and
corporate assets
or expenses Consolidated
Sales:
Unaffiliated
customers $1,847,236 $6,831,989 $1,497,558 $915,853 $1,688,227 $3,780,532 $16,561,397 $ - $16,561,397
Intersegment 16,944 1,149,797 207,362 39,497 13,295 694,183 2,121,081 (2,121,081) -
Total 1,864,181 7,981,786 1,704,921 955,350 1,701,523 4,474,716 18,682,478 (2,121,081) 16,561,397
Operating
expenses 1,725,188 7,522,126 1,512,168 812,275 1,648,314 4,378,957 17,599,031 (2,037,204) 15,561,826
Operating
profit $ 138,992 $ 459,660 $192,752 $ 143,074 $ 53,208 $ 95,758 $ 1,083,447 $(83,877) $999,570
Identifiable assets $2,683,374 $4,997,562 $1,744,293 $1,897,172 $1,643,433 $3,159,111 $16,124,946 $2,402,620 $18,527,567
Depreciation $ 128,246 $ 156,432 $89,515 $ 56,872 $ 101,552 $ 39,174 $ 571,793 $22,267 $ 594,060
Capital
expenditures $166,217 $ 259,311 $114,219 $ 96,564 $ 67,072 $ 38,077 $ 741,464 $13,564 $ 755,029
(1) Change in depreciation following the amendments of the Corporation Tax Law of Japan
Following the amendments of the Corporation Tax Law of Japan, the method of depreciation
applied to the tangible fixed assets acquired on or after April 1,2007 was revised.
Compared to the amounts that would have been reported under the previous accounting method,
the effects of the change on the segment information for the year ended March 31, 2008 were as
follows:
Year ended March 31, 2008 Millions of yen
Cement Metals
Advanced
materials &
tools
Electronic
materials &
components Aluminum Others Total
Elimination
and corporate
assets or
expenses Consolidated
Operating expenses ¥ 240 ¥ 111 ¥ 335 ¥ 113 ¥ 30 ¥ 70 ¥ 902 ¥ 58 ¥ 961
Operating profit ¥ (240) ¥ (111) ¥ (335) ¥ (113) ¥ (30) ¥ (70) ¥ (902) ¥ (58) ¥ (961)
Assets ¥ (245) ¥ (111) ¥ (335) ¥ (113) ¥ (30) ¥ (72) ¥ (909) ¥ (58) ¥ (967)
Depreciation ¥ 245 ¥ 111 ¥ 335 ¥ 113 ¥ 30 ¥ 72 ¥ 909 ¥ 58 ¥ 967
Year ended March 31, 2008 Thousands of U.S. dollars
Cement Metals
Advanced
materials &
tools
Electronic
materials &
components Aluminum Others Total
Elimination
and corporate
assets or
expenses Consolidated
Operating expenses $2,396 $1,115 $3,352 $1,131 $308 $708 $9,012 $ 584 $9,597
Operating profit $(2,396) $ (1,115) $ (3,352) $ (1,131) $ (308) $ (708) $ (9,012) $ (584) $ (9,597)
Assets $(2,445) $(1,115) $ (3,352) $ (1,131) $ (308) $ (719) $ (9,073) $ (584) $ (9,658)
Depreciation $2,445 $1,115 $3,352 1,131 $308 $719 $9,073 $ 584 $9,658
72

Mitsubishi Materials Corporation and Consolidated Subsidiaries
NOTES TO CONSOLIDATED FINANCIAL STATEMENTS
March 31, 2008, 2007 and 2006
(Continued)
46
Due to the revised Corporation Tax Law of Japan, effective April 1, 2007, the salvage values of
tangible fixed assets acquired before April 1, 2007 are additionally depreciated to their nominal
values equally over five years commencing from the years immediately after the year in which the
depreciated bases have been reached to the 5% of their acquisition costs.
Compared to the amounts that would have been reported under the previous accounting method,
the effects of the change on the segment information for the year ended March 31, 2008 were as
follows:
Year ended March 31, 2008 Millions of yen
Cement Metals
Advanced
materials &
tools
Electronic
materials &
components Aluminum Others Total
Elimination
and corporate
assets or
expenses Consolidated
Operating expenses ¥ 1,242 ¥ 1,257 ¥ 604 ¥ 294 ¥ 413 ¥ 382 ¥ 4,195 ¥ 55 ¥ 4,250
Operating profit ¥ (1,242) ¥ (1,257) ¥ (604) ¥ (294) ¥ (413) ¥ (382) ¥ (4,195) ¥ (55) ¥ (4,250)
Assets ¥ (1,321) ¥ (1,259) ¥ (604) ¥ (294) ¥ (416) ¥ (384) ¥ (4,281) ¥ (57) ¥ (4,339)
Depreciation ¥ 1,321 ¥ 1,259 ¥ 604 ¥ 294 ¥ 416 ¥ 384 ¥ 4,281 ¥ 57 ¥ 4,339
Year ended March 31, 2008 Thousands of U.S. dollars
Cement Metals
Advanced
materials &
tools
Electronic
materials &
components Aluminum Others Total
Elimination
and corporate
assets or
expenses Consolidated
Operating expenses $12,398 $12,551 $6,037 $2,940 $4,127 $3,815 $41,871 $ 557 $42,428
Operating profit $(12,398) $ (12,551) $ (6,037) $ (2,940) $ (4,127) $ (3,815) $ (41,871) $ (557) $ (42,428)
Assets $(13,188) $(12,571) $ (6,037) $ (2,940) $ (4,155) $ (3,839) $ (42,733) $ (578) $ (43,311)
Depreciation $13,188 $12,571 $6,037 2,940 $4,155 $3,839 $42,733 $ 578 $43,311
(2) Change in the estimated useful lives and salvage value in the “Aluminum” segment
In the year ended March 31, 2008, Universal Can Corporation, a consolidated subsidiary, changed
the estimated useful lives and its salvage value of some tangible fixed assets upon an available
time and recent disposal value. Prior period adjustment of the depreciation based on this change
is included in depreciation in segment information.
Consequently, the assets in the “Aluminum” segment for the year ended March 31, 2008
decreased by ¥1,400 million ($13,981 thousand) and the depreciation increased by the same
amount, compared to the amounts that would have been reported under the previous accounting
method.
(3) Change in accounting method for income for industrial waste treatment in the “Cement” segment
73

Mitsubishi Materials Corporation and Consolidated Subsidiaries
NOTES TO CONSOLIDATED FINANCIAL STATEMENTS
March 31, 2008, 2007 and 2006
(Continued)
47
In the past, the income for industrial waste treatment in the “Cement” segment had been deducted
from the cost of sales. In the year ended March 31, 2007, the Company changed its accounting
method to include such income in the sales amount. This change was made to reflect the revenue
structure of the “Cement” segment more appropriately as the industrial waste treatment has
increased and become core revenue in the “Cement” segment.
Consequently, the sales, the operating expense, and the operating profit in the “Cement” segment
for the year ended March 31, 2007 increased by ¥12,197 million, ¥11,917 million, and ¥279
million respectively, compared to the amounts that would have been reported by the previous
accounting method.
(4) Adoption of “Accounting Standard for Measurement of Inventories”
Effective from the year ended March 31, 2007, the Company and the domestic consolidated
subsidiaries adopted “Accounting Standard for Measurement of Inventories” (Statement No.9
issued by the Accounting Standards Board of Japan on July 5, 2006).
Compared to the amounts that would have been reported by the previous accounting method, the
effects of adopting this accounting standard for each business segment for the year ended March
31, 2007 were as follows:
Millions of yen
Cement Metals
Advanced
materials &
tools
Electronic
materials &
components Aluminum Others Total
Elimination
and corporate
assets or
expenses Consolidated
Operating expenses ¥ 151 ¥ 2,650 ¥ 1,592 ¥ 55 ¥ 751 ¥ 538 ¥ 5,740 ¥ - ¥ 5,740
Operating profit ¥ (151) ¥ (2,650) ¥ (1,592) ¥ (55) ¥ (751) ¥ (538) ¥ (5,740) ¥ - ¥ (5,740)
Assets ¥ (151) ¥ (2,650) ¥ (1,592) ¥ (55) ¥ (751) ¥ (538) ¥ (5,740) ¥ - ¥ (5,740)
(5) Change in useful lives of the equipment in the “Electronic materials & components” segment
In the year ended March 31,2007, the Company shortened the useful lives of the equipment at
Sanda Factory (Sanda, Hyogo prefecture) for production of semiconductors from 13 to 4 years
considering the high capacity utilization due to the increase in the production demand and the
shortening of the product lifecycle.
Mitsubishi Polycrystalline Silicon America Corp. (Alabama), the consolidated subsidiary, also
shortened the useful lives of the equipment from the range from 5 to 30 years (21 years on
average) to the range from 3 to 20 years (17 years on average). That is because the operating rate
of the equipment has been over its original capacity since the year ended March 31,2006 due to
continuous high demand in silicon wafers.
74

Mitsubishi Materials Corporation and Consolidated Subsidiaries
NOTES TO CONSOLIDATED FINANCIAL STATEMENTS
March 31, 2008, 2007 and 2006
(Continued)
48
Consequently, the operating expenses in the “Electronic materials & components” segment for
the year ended March 31, 2007 increased by ¥691 million, and the operating profit decreased by
the same amount, compared to the amounts that would have been reported by the previous
accounting method.
This effect on assets of the “Electronic materials & components” segment was not material.
(6) The Company has changed its method of business segment classification from the previous
segmentation of “Cement,” “Metals,” “Powder metallurgy products & tools,” “Advanced
products,” “Aluminum,” “Energy & systems,” and “Others,” to the current one of “Cement,”
“Metals,” “Advanced materials & tools,” “Electronic materials & components,” “Aluminum,”
and “Others”.
Effective April 1, 2005, the Company has reorganized its business segments to divide them into
five main companies, comprising “Cement,” “Metals,” “Advanced materials & tools,”
“Electronic materials & components,”and “Aluminum,” in order to efficiently invest its
management resources, and improve its profitability. It reviewed its previous business units and
operational system that divide its businesses into “core businesses” and “strategic businesses,”
and then integrated and reorganized them, considering the synergy effect arising from the
similarity in product category and sales method, and the business position in the company group.
Therefore the change on the year ended March 31, 2006 in business segmentation was made to
more adequately reflect the results of the Company’s operations after the reorganization.
Business segment information reclassified to conform with the current business segmentation, for
the year ended March 31, 2005, was as follows:
Millions of yen
Cement Metals
Advanced
materials &
tools
Electronic
materials &
components Aluminum Others Total
Elimination and
corporate assets
or expenses Consolidated
Sales:
Unaffiliated
customers ¥148,973 ¥252,333 ¥138,769 ¥ 66,941 ¥134,519 ¥243,242 ¥ 984,777 ¥ - ¥ 984,777
Intersegment 491 55,176 14,945 2,512 747 47,284 121,155 (121,155) -
Total 149,464 307,509 153,714 69,453 135,266 290,526 1,105,932 (121,155) 984,777
Operating
expenses 137,324 294,397 135,850 66,586 128,035 283,527 1,045,719 (115,027) 930,692
Operating
profit ¥ 12,140 ¥ 13,112 ¥ 17,864 ¥ 2,867 ¥ 7,231 ¥ 6,999 ¥60,213 ¥ (6,128) ¥54,085
Identifiable assets ¥246,395 ¥296,483 ¥161,427 ¥125,050 ¥158,917 ¥276,378 ¥1,264,650 ¥156,175 ¥1,420,825
Depreciation ¥ 9,043 ¥ 10,663 ¥ 7,083 ¥ 4,289 ¥ 9,725 ¥ 4,682 ¥ 45,485 ¥ 2,435 ¥ 47,920
Capital
expenditures ¥ 9,698 ¥ 9,354 ¥12,042 ¥ 3,850 ¥ 7,250 ¥ 6,347 ¥ 48,541 ¥ 966 ¥ 49,507
(7) Change in allocation method for operating expenses
75

Mitsubishi Materials Corporation and Consolidated Subsidiaries
NOTES TO CONSOLIDATED FINANCIAL STATEMENTS
March 31, 2008, 2007 and 2006
(Continued)
49
In the past, the basic R&D expenses and the administrative expenses for the corporate had been
allocated to each segment, according to a certain allocation bases that mainly reflect the degree of benefit. In the year ended March 31, 2006, the Company has reviewed the scope of unallocatable
operating expenses, and started to allocate some expenses directly to the related segments, and
other expenses to each segment according to the allocation bases that reflect the degree of offering services.
This change was made to reflect the performance of each business segment more adequately,
following the change in internal control system at the Company to clarify the further benefit assessment through transforming the headquarters organization into a shared service unit, or
elaborating the burden on each segment arising from each development theme, and others.
By the previous allocating method, the total amount of unallocatable operating expenses for the
year ended March 31, 2006 was ¥8,490 million, and the amounts of operating expenses and
operating profit for each segment were as follows:
Year ended March 31, 2006 Millions of yen
Cement Metals
Advanced
materials &
tools
Electronic
materials &
components Aluminum Others Total
Elimination and
corporate
expenses Consolidated
Operating
expenses ¥149,302 ¥404,247 ¥141,475 ¥72,195 ¥140,242 ¥297,626 ¥1,205,087 ¥(130,369) ¥1,074,718
Operating profit 15,752 23,214 20,683 5,810 3,550 8,164 77,173 (8,191) 68,982
(8) Change in scope of corporate assets
In the past, the deferred tax asset of the Company had been classified as a corporate asset. In the
year ended March 31, 2006, the Company started to classify it as an asset of each segment, if its
source can be attributed to a particular segment. This change was made to reflect the performance of each business segment more adequately, following the change in internal control system at the
Company to clarify the responsibility for recovering a deferred tax asset, and others. By the
previous method, the total amount of corporate assets as of March 31, 2006 was ¥194,224 million,
and the amounts of assets for each segment were as follows:
As of March 31, 2006 Millions of yen
Cement Metals
Advanced
materials &
tools
Electronic
materials &
components Aluminum Others Total
Elimination and
corporate
assets Consolidated
Assets ¥263,146 ¥389,941 ¥162,425 ¥135,365 ¥180,913 ¥306,580 ¥1,438,370 ¥171,076 ¥1,609,446
76

Mitsubishi Materials Corporation and Consolidated Subsidiaries
NOTES TO CONSOLIDATED FINANCIAL STATEMENTS
March 31, 2008, 2007 and 2006
(Continued)
50
(b) Geographic segment information geographic for the years ended March 31, 2008, 2007 and 2006
was as follows:
Year ended March 31, 2008
Millions of yen
Japan U.S.A. Europe Asia Others Total
Elimination and corporate
assets or expenses Consolidated
Sales:
Unaffiliated customers ¥1,401,417 ¥83,879 ¥22,166 ¥149,449 ¥2,373 ¥1,659,286 ¥ - ¥1,659,286
Intersegment 31,716 10,100 275 216,361 - 258,454 (258,454) -
Total 1,433,133 93,980 22,442 365,810 2,373 1,917,740 (258,454) 1,659,286
Operating expenses 1,358,120 79,376 20,265 349,648 2,087 1,809,497 (250,358) 1,559,139
Operating profit ¥75,013 ¥14,603 ¥2,177 ¥16,162 ¥ 285 ¥108,242 ¥(8,095) ¥100,146
Identifiable assets ¥1,389,669 ¥111,381 ¥56,564 ¥119,366 ¥ 3,586 ¥1,680,568 ¥175,708 ¥1,856,276
Year ended March 31, 2007
Millions of yen
Japan U.S.A. Europe Asia Others Total
Elimination and corporate
assets or expenses Consolidated
Sales:
Unaffiliated customers ¥ 1,216,099 ¥ 85,866 ¥17,065 ¥129,823 ¥3,253 ¥1,452,108 ¥ - ¥1,452,108
Intersegment 27,782 6,383 293 109,315 - 143,774 (143,774) -
Total 1,243,882 92,249 17,358 239,139 3,253 1,595,883 (143,774) 1,452,108
Operating expenses 1,180,955 78,707 16,260 231,548 2,390 1,509,862 (136,512) 1,373,349
Operating profit ¥ 62,926 ¥ 13,542 ¥ 1,097 ¥ 7,590 ¥ 863 ¥ 86,021 ¥ (7,262) ¥ 78,758
Identifiable assets ¥ 1,369,821 ¥108,275 ¥46,444 ¥116,019 ¥ 3,290 ¥1,643,851 ¥ 130,048 ¥1,773,899
Year ended March 31, 2006
Millions of yen
Japan U.S.A. Europe Asia Others Total
Elimination and corporate
assets or expenses Consolidated
Sales:
Unaffiliated customers ¥ 954,732 ¥ 80,044 ¥ 14,091 ¥ 91,073 ¥3,760 ¥ 1,143,700 ¥ - ¥ 1,143,700
Intersegment 27,785 1,985 306 93,755 - 123,831 (123,831) -
Total 982,517 82,029 14,397 184,828 3,760 1,267,531 (123,831) 1,143,700
Operating expenses 928,338 71,033 13,753 176,745 2,725 1,192,594 (117,876) 1,074,718
Operating profit ¥ 54,179 ¥ 10,996 ¥ 644 ¥ 8,083 ¥1,035 ¥ 74,937 ¥ (5,955) ¥ 68,982
Identifiable assets ¥ 1,269,949 ¥ 93,670 ¥ 35,636 ¥ 124,029 ¥4,437 ¥1,527,721 ¥ 81,725 ¥ 1,609,446
77

Mitsubishi Materials Corporation and Consolidated Subsidiaries
NOTES TO CONSOLIDATED FINANCIAL STATEMENTS
March 31, 2008, 2007 and 2006
(Continued)
51
Year ended March 31, 2008
Thousands of U.S. dollars
Japan U.S.A. Europe Asia Others Total
Elimination
and corporate
assets or
expenses Consolidated
Sales:Unaffiliated customers $13,987,597 $837,207 $221,247 $1,491,658 $23,686 $16,561,397 $ - $16,561,397
Intersegment 316,563 100,811 2,751 2,159,510 - 2,579,638 (2,579,638) -
Total 14,304,161 938,019 223,999 3,651,169 23,686 19,141,036 (2,579,638) 16,561,397
Operating expenses 13,555,444 792,258 202,269 3,489,852 20,838 18,060,664 (2,498,837) 15,561,826
Operating profit $ 748,716 $145,760 $21,729 $ 161,317 $ 2,847 $1,080,372 $(80,801) $ 999,570
Identifiable assets $13,870,341 $1,111,706 $564,570 $1,191,403 $35,795 $16,773,817 $1,753,749 $18,527,567
(1) Change in depreciation following the amendments of the Corporation Tax Law of Japan
Following the amendments of the Corporation Tax Law of Japan, the method of depreciation
applied to the tangible fixed assets acquired on or after April 1,2007 was revised.
Consequently, the operating expenses for the “Japan” segment for the year ended March 31, 2008
increased by ¥902 million ($9,012 thousand), the operating profit decreased by ¥902 million
($9,012 thousand), the assets decreased by ¥909 million ($9,073 thousand), the operating expenses
for the “Elimination and Corporate Assets or Expenses” increased by ¥58 million ($584 thousand)
and the operating profit and the assets decreased by the same amounts, compared to the amounts
that would have been reported under the previous accounting method.
Due to the revised Corporation Tax Law of Japan, effective April 1,2007, the salvage values of
tangible fixed assets acquired before April 1, 2007 are additionally depreciated to their nominal
values equally over five years commencing from the years immediately after the year in which the
depreciated bases have been reached to the 5% of their acquisition costs.
Consequently, the operating expenses in the “Japan”segment for the year ended March 31, 2008
increased by ¥4,195 million ($41,871 thousand), the operating profit decreased by ¥4,195 million
($41,871 thousand), the assets decreased by ¥4,281 million ($42,733 thousand), the operating
expenses for the “Elimination and Corporate Assets or Expenses” increased by ¥55 million ($557
thousand), the operating profit decreased by ¥55 million ($557 thousand), and the assets decreased
by ¥57 million ($578 thousand), compared to the amounts that would have been reported under the
previous accounting method.
(2) Change in the estimated useful lives and salvage value in the “Japan”segment
In the year ended March 31, 2008, Universal Can Corporation, a consolidated subsidiary, changed
the estimated useful lives and its salvage value of some tangible fixed assets upon an available
time and recent disposal value. Consequently, the assets in the “Japan”segment for the year
78

Mitsubishi Materials Corporation and Consolidated Subsidiaries
NOTES TO CONSOLIDATED FINANCIAL STATEMENTS
March 31, 2008, 2007 and 2006
(Continued)
52
ended March 31, 2008 decreased by ¥1,400 million ($13,981 thousand), compared to the amounts
that would have been reported under the previous accounting method.
(3) Change in accounting method for income for industrial waste treatment in the “Japan” segment
In the past, the income for industrial waste treatment in the “Cement” segment had been deducted
from the cost of sales. For the year ended March 31, 2007, the Company changed its accounting
method to include such income in the sales amount. This change was made to reflect the revenue
structure of the “Cement” segment more appropriately as the industrial waste treatment has
increased and become core revenue in the “Cement” segment.
Consequently, the sales, the operating expense, and the operating profit in the “Japan” for the
year ended March 31, 2007 increased by ¥12,197 million, ¥11,917 million, and ¥279 million
respectively, compared to the amounts that would have been reported by the previous accounting
method.
(4) Adoption of “Accounting Standard for Measurement of Inventories” in the “Japan” segment
Effective from the year ended March 31, 2007, the Company and the domestic consolidated
subsidiaries adopted “Accounting Standard for Measurement of Inventories” (Statement No.9
issued by the Accounting Standards Board of Japan on July 5, 2006).
Consequently, the operating expenses in the “Japan” for the year ended March 31, 2007 increased
by ¥5,740 million, and the operating profit and the assets decreased by the same amount,
compared to the amounts that would have been reported by the previous accounting method.
(5) Change in useful lives of the equipment in the “Japan”segment and the “U.S.A.” segment
In the year ended March 31, 2007, the Company shortened the useful lives of the equipment at
Sanda Factory (Sanda, Hyogo prefecture) for production of semiconductors from 13 to 4 years
considering the high capacity utilization due to the increase in the production demand and the
shortening of the product lifecycle.
Mitsubishi Polycrystalline Silicon America Corp. (Alabama), the consolidated subsidiary, also
shortened the useful lives of the equipment from the range from 5 to 30 years (21 years on
average) to the range from 3 to 20 years (17 years on average). That is because the operating rate
of the equipment has been over its original capacity since the year ended March 31,2006 due to
the continuous high demand in silicon wafers.
Consequently, the operating expenses in the “Japan”segment for the year ended March 31, 2007
increased by ¥158 million, and the operating profit decreased by the same amount, compared to
79

Mitsubishi Materials Corporation and Consolidated Subsidiaries
NOTES TO CONSOLIDATED FINANCIAL STATEMENTS
March 31, 2008, 2007 and 2006
(Continued)
53
the amounts that would have been reported by the previous accounting method. In the same way,
the operating expenses for the “U.S.A.”segment for the year ended March 31, 2007 increased by
¥532 million, and the operating profit decreased by the same amount.
This effect on assets of the “Japan”segment and the “U.S.A.”segment was not material.
(6) Change in allocation method for operating expenses
In the past, the basic R&D expenses and the administrative expenses for the corporate had been
allocated to each business segment in “Japan”, according to a certain allocation bases that mainly
reflect the degree of benefit. In the year ended March 31, 2006, the Company has reviewed the
scope of unallocatable operating expenses, and started to allocate some expenses directly to the related business segments, and other expenses to each business segment according to the
allocation bases that reflect the degree of offering services.
This change was made to reflect the performance of each business segment more adequately, following the change in internal control system at the Company to clarify the further benefit
assessment through transforming the headquarters organization into a shared service unit, or
elaborating the burden on each segment arising from each development theme, and others. By the previous allocating method, the total amount of unallocatable operating expenses for the
year ended March 31, 2006 was ¥8,490 million, and the amounts of operating expenses and
operating profit for each segment were as follows:
Year ended March 31, 2006
Millions of yen
Japan U.S.A. Europe Asia Others Total
Eliminationand
corporateexpenses Consolidated
Operating expenses ¥925,879 ¥71,032 ¥13,753 ¥176,744 ¥2,725 ¥1,190,133 ¥(115,415) ¥1,074,718
Operating profit 56,639 10,996 644 8,083 1,035 77,397 (8,415) 68,982
(7) Change in scope of corporate assets
In the past, the deferred tax asset of the Company had been classified as a corporate asset. In the year ended March 31, 2006, the Company started to classify it as an asset of each business segment, if its
source can be attributed to a particular segment. This change was made to reflect the performance of each business segment more adequately, following the change in internal control system at the Company to clarify the responsibility for recovering a deferred tax asset, and others. By the previous
method, the total amount of corporate assets as of March 31, 2006 was ¥194,224 million, and the amounts of assets for each segment were as follows:
As of March 31, 2006
Millions of yen
Japan U.S.A. Europe Asia Others Total
Eliminationand
corporateassets Consolidated
Assets ¥1,260,100 ¥93,670 ¥35,636 ¥124,029 ¥4,437 ¥1,517,872 ¥91,574 ¥1,609,446
80

Mitsubishi Materials Corporation and Consolidated Subsidiaries
NOTES TO CONSOLIDATED FINANCIAL STATEMENTS
March 31, 2008, 2007 and 2006
(Continued)
54
(c) Overseas sales by geographic area for the years ended March 31, 2008, 2007 and 2006, were as
follows:
Year ended March 31, 2008
Millions of yen
U.S.A. Europe Asia Others Total
Overseas sales ¥93,080 ¥26,872 ¥447,270 ¥6,539 ¥573,763
Consolidated net sales 1,659,286
Percentage of overseas sales
to consolidated net sales 5.6% 1.6% 27.0% 0.4% 34.6%
Year ended March 31, 2007
Millions of yen
U.S.A. Europe Asia Others Total
Overseas sales ¥100,393 ¥38,979 ¥213,219 ¥6,506 ¥ 359,099
Consolidated net sales 1,452,108
Percentage of overseas sales
to consolidated net sales 6.9% 2.7% 14.7% 0.4% 24.7%
Year ended March 31, 2006
Millions of yen
U.S.A. Europe Asia Others Total
Overseas sales ¥88,987 ¥36,186 ¥138,529 ¥5,018 ¥268,720
Consolidated net sales 1,143,700
Percentage of overseas sales
to consolidated net sales 7.8% 3.2% 12.1% 0.4% 23.5%
Year ended March 31, 2008
Thousands of U.S. dollars
U.S.A. Europe Asia Others Total
Overseas sales $929,043 $268,211 $4,464,224 $65,269 $5,726,749
Consolidated net sales 16,561,397
Percentage of overseas sales
to consolidated net sales 5.6% 1.6% 27.0% 0.4% 34.6%
81
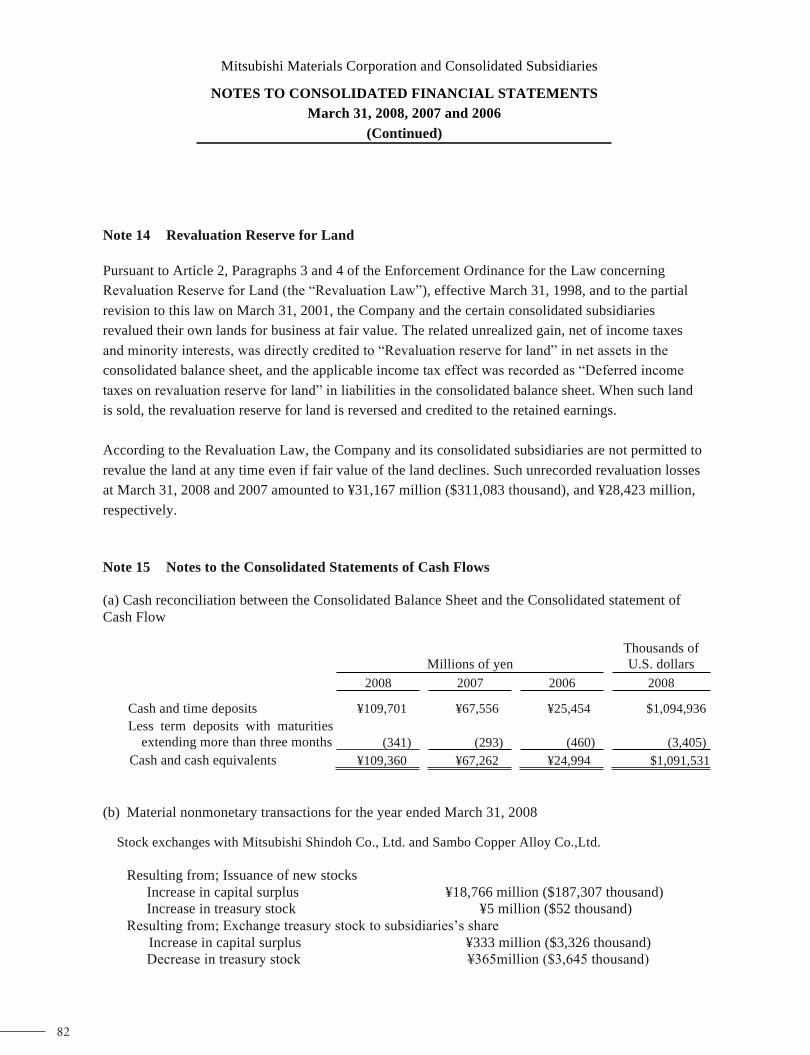
Mitsubishi Materials Corporation and Consolidated Subsidiaries
NOTES TO CONSOLIDATED FINANCIAL STATEMENTS
March 31, 2008, 2007 and 2006
(Continued)
55
Note 14 Revaluation Reserve for Land
Pursuant to Article 2, Paragraphs 3 and 4 of the Enforcement Ordinance for the Law concerning
Revaluation Reserve for Land (the “Revaluation Law”), effective March 31, 1998, and to the partial
revision to this law on March 31, 2001, the Company and the certain consolidated subsidiaries
revalued their own lands for business at fair value. The related unrealized gain, net of income taxes
and minority interests, was directly credited to “Revaluation reserve for land” in net assets in the
consolidated balance sheet, and the applicable income tax effect was recorded as “Deferred income
taxes on revaluation reserve for land” in liabilities in the consolidated balance sheet. When such land
is sold, the revaluation reserve for land is reversed and credited to the retained earnings.
According to the Revaluation Law, the Company and its consolidated subsidiaries are not permitted to
revalue the land at any time even if fair value of the land declines. Such unrecorded revaluation losses
at March 31, 2008 and 2007 amounted to ¥31,167 million ($311,083 thousand), and ¥28,423 million,
respectively.
Note 15 Notes to the Consolidated Statements of Cash Flows
(a) Cash reconciliation between the Consolidated Balance Sheet and the Consolidated statement of
Cash Flow
Millions of yen Thousands of U.S. dollars
2008 2007 2006 2008
Cash and time deposits ¥109,701 ¥67,556 ¥25,454 $1,094,936
Less term deposits with maturitiesextending more than three months (341) (293) (460) (3,405)
Cash and cash equivalents ¥109,360 ¥67,262 ¥24,994 $1,091,531
(b) Material nonmonetary transactions for the year ended March 31, 2008
Stock exchanges with Mitsubishi Shindoh Co., Ltd. and Sambo Copper Alloy Co.,Ltd.
Resulting from; Issuance of new stocks
Increase in capital surplus ¥18,766 million ($187,307 thousand) Increase in treasury stock ¥5 million ($52 thousand)
Resulting from; Exchange treasury stock to subsidiaries’s share
Increase in capital surplus ¥333 million ($3,326 thousand) Decrease in treasury stock ¥365million ($3,645 thousand)
82

Mitsubishi Materials Corporation and Consolidated Subsidiaries
NOTES TO CONSOLIDATED FINANCIAL STATEMENTS
March 31, 2008, 2007 and 2006
(Continued)
56
(c) Summary of assets and liabilities of new consolidated subsidiaries due to the acquisition of stocks
One of the former affiliated companies of the Company named Mitsubishi Shindoh Co., Ltd. and its subsidiary named Gotoh MFG Co., Ltd. became new consolidated subsidiaries of the Company
due to the acquisition of stocks in the year ended March 31, 2007. At the start of their
consolidation, summary of their assets and liabilities, the acquisition cost of stocks, and the payment for acquisition were as follows:
Millions of yen
Current assets ¥ 31,940
Fixed assets 24,957
Current liabilities (24,877)
Long-term liabilities (11,733)
Negative goodwill (19)
Minority interests (9,928)
Acquisition cost of stocks 10,338
Carrying value under the equity method (5,585)
Additional acquisition cost of stocks 4,753
Cash and cash equivalents of the acquired companies (1,164)
Net payment for acquisition ¥ 3,588
(d) Material nonmonetary transactions for the year ended March 31, 2007
Increase in common stock by the issuance of new
stocks due to the exercise of stock acquisition rights ¥17,705 million
Increase in capital surplus by the issuance of new stocks due to the exercise of stock acquisition rights ¥17,600 million
Decrease in convertible bond-type bonds
with stock acquisition rights ¥35,306 million
83

Mitsubishi Materials Corporation and Consolidated Subsidiaries
NOTES TO CONSOLIDATED FINANCIAL STATEMENTS
March 31, 2008, 2007 and 2006
(Continued)
57
(e) Effect of the integration of aluminum can business
On October 1, 2005, the Company and Hokkai Can Co., Ltd. established a new joint company
named “Universal Can Corporation”, and contributed their aluminum can businesses to the new
company for integration purpose. The Company acquired 80% of equity share of Universal Can
Corporation in exchange of its contributed assets and liabilities for aluminum can business. At the
time of integration, the assets and liabilities succeeded from Hokkai Can Co., Ltd. and included in
the accompanying consolidated balance sheet were as follows
Millions of yen
Current assets ¥ 8,112
Noncurrent assets 11,558
Total assets ¥ 19,670
Current liabilities ¥ 9,788
Noncurrent liabilities 2,050
Total liabilities ¥ 11,838
(f) Effect of the integration of sintered parts business
On December 1, 2005, the Company and Plansee Holding AC, an Austrian company, established a
new joint holding company named “Plansee Mitsubishi Material Global Sinter Holding, S.A.”
(“PMGH”) as an affiliate under the equity method, and transferred their sintered parts businesses to
PMGH for integration purpose. At the time of integration, the assets and liabilities transferred from
the Company to PMGH were as follows:
Millions of yen
Current assets ¥ 10,221
Noncurrent assets 15,712
Total assets ¥ 25,933
Current liabilities ¥ 16,519
Noncurrent liabilities 646
Total liabilities ¥ 17,165
84

Mitsubishi Materials Corporation and Consolidated Subsidiaries
NOTES TO CONSOLIDATED FINANCIAL STATEMENTS
March 31, 2008, 2007 and 2006
(Continued)
58
Note 16 Net Income per Share of Common Stock
Reconciliation of the numbers and amounts used in the basic and diluted net income per share of
common stock computation for the years ended March 31, 2008, 2007, and 2006 was as follows:
Year ended March 31, 2008 Millions of
yen Thousands Yen U.S. dollars
Net income
Weighted-
average shares
Net income per share
Net income per share
Basic net income per share:
Net income ¥74,268
Net income available to common
shareholders 74,268 1,255,864 ¥59.1 $0.59
Effect of dilutive securities:
Convertible bonds - -
Stock acquisition rights - -
Diluted net income per share:
Net income for computation ¥74,268 1,255,864 ¥59.1 $0.59
Year ended March 31, 2007 Millions of
yen Thousands Yen
Net income
Weighted-
average shares
Net income per share
Basic net income per share:
Net income ¥71,382
Net income available to common
shareholders 71,382 1,183,236 ¥60.3
Effect of dilutive securities:
Convertible bonds - -
Stock acquisition rights - 65,046
Diluted net income per share:
Net income for computation ¥71,382 1,248,282 ¥57.1
85

Mitsubishi Materials Corporation and Consolidated Subsidiaries
NOTES TO CONSOLIDATED FINANCIAL STATEMENTS
March 31, 2008, 2007 and 2006
(Continued)
59
Year ended March 31, 2006 Millions of
yen Thousands Yen
Net income
Weighted-average shares
Net income per share
Basic net income per share:
Net income ¥58,803
Bonuses to directors by an
appropriation of retained earnings 130
Net income available to common
shareholders 58,673 1,134,224 ¥51.7
Effect of dilutive securities:
Convertible bonds 143 47,917
Stock acquisition rights - 114,533
Diluted net income per share:
Net income for computation ¥58,816 1,296,674 ¥45.4
Note 17 Related Party Transactions
Significant transactions with related parties for the year ended March 31, 2008 was as follows:
Millions of yen
March 31, 2008
Name of related individual Borrowings
Interestpayments
Short-term bankloans
Long-termdebts
Prepaidexpenses
Other current assets
Accruedexpenses
Akio Utsumi ¥26,180 ¥663 ¥7,800 ¥28,443 ¥58 ¥29 ¥57
Note: These transactions were made by Akio Utsumi (Corporate Auditor of the Company), as Representative Director of The Mitsubishi UFJ Trust and Banking Corporation.
The interest rate for the debts was reasonably determined, considering the market interest rate.
No pledged assets were furnished.
Thousands of U.S. dollars
March 31, 2008
Name of related individual Borrowings
Interestpayments
Short-term bankloans
Long-termdebts
Prepaidexpenses
Other current assets
Accruedexpenses
Akio Utsumi $261,303 $6,619 $77,852 $283,893 $578 $291 $577
Significant transactions with related parties for the year ended March 31, 2007 was as follows:
Millions of yen
March 31, 2007
Name of related individual Borrowings
Interestpayments
Short-term bankloans
Long-termdebts
Prepaidexpenses
Other current assets
Accruedexpenses
Akio Utsumi ¥ 4,125 ¥ 632 ¥ 7,176 ¥19,593 ¥ 65 ¥ 11 ¥ 28
The Company had no significant transaction with related parties for the year ended March 31, 2006.
86
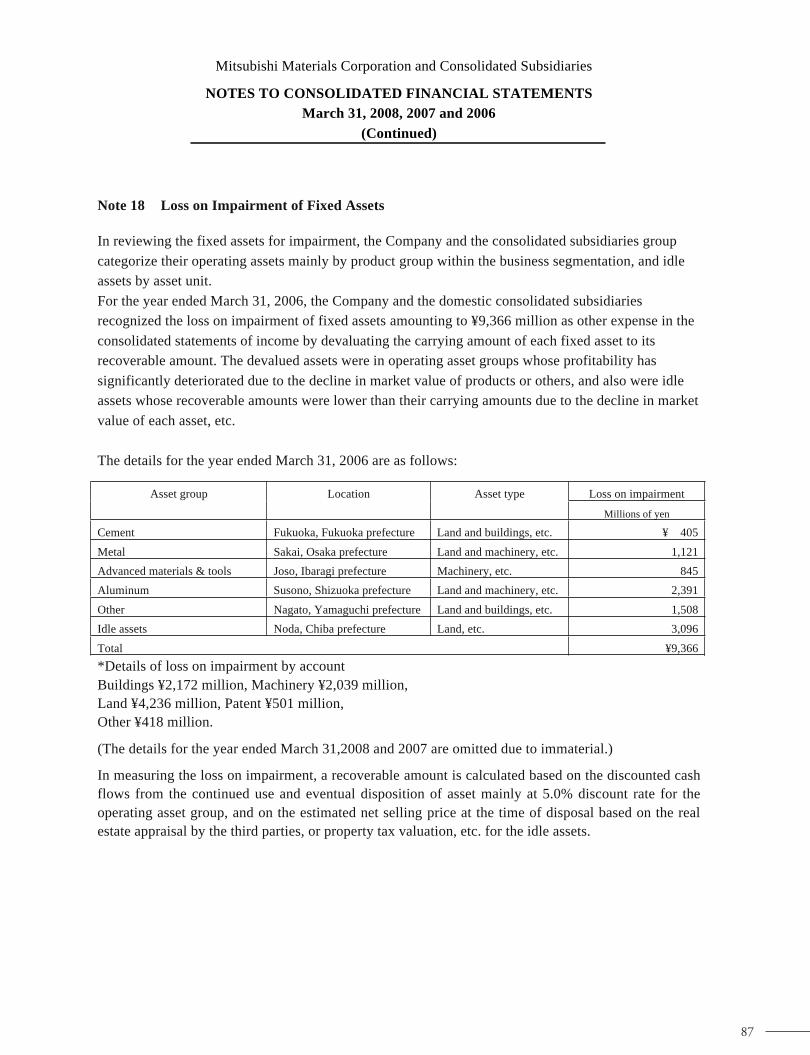
Mitsubishi Materials Corporation and Consolidated Subsidiaries
NOTES TO CONSOLIDATED FINANCIAL STATEMENTS
March 31, 2008, 2007 and 2006
(Continued)
60
Note 18 Loss on Impairment of Fixed Assets
In reviewing the fixed assets for impairment, the Company and the consolidated subsidiaries group
categorize their operating assets mainly by product group within the business segmentation, and idle
assets by asset unit.
For the year ended March 31, 2006, the Company and the domestic consolidated subsidiaries
recognized the loss on impairment of fixed assets amounting to ¥9,366 million as other expense in the
consolidated statements of income by devaluating the carrying amount of each fixed asset to its
recoverable amount. The devalued assets were in operating asset groups whose profitability has
significantly deteriorated due to the decline in market value of products or others, and also were idle
assets whose recoverable amounts were lower than their carrying amounts due to the decline in market
value of each asset, etc.
The details for the year ended March 31, 2006 are as follows:
Asset type Loss on impairment Asset group Location
Millions of yen
Cement Fukuoka, Fukuoka prefecture Land and buildings, etc. ¥ 405
Metal Sakai, Osaka prefecture Land and machinery, etc. 1,121
Advanced materials & tools Joso, Ibaragi prefecture Machinery, etc. 845
Aluminum Susono, Shizuoka prefecture Land and machinery, etc. 2,391
Other Nagato, Yamaguchi prefecture Land and buildings, etc. 1,508
Idle assets Noda, Chiba prefecture Land, etc. 3,096
Total ¥9,366
*Details of loss on impairment by account
Buildings ¥2,172 million, Machinery ¥2,039 million,
Land ¥4,236 million, Patent ¥501 million,
Other ¥418 million.
(The details for the year ended March 31,2008 and 2007 are omitted due to immaterial.)
In measuring the loss on impairment, a recoverable amount is calculated based on the discounted cash
flows from the continued use and eventual disposition of asset mainly at 5.0% discount rate for the
operating asset group, and on the estimated net selling price at the time of disposal based on the real
estate appraisal by the third parties, or property tax valuation, etc. for the idle assets.
87

Mitsubishi Materials Corporation and Consolidated Subsidiaries
NOTES TO CONSOLIDATED FINANCIAL STATEMENTS
March 31, 2008, 2007 and 2006
(Continued)
61
Note 19 Information on Net Assets
(a) Type and Number of Shares Issued and Treasury Stock For the year ended March 31, 2008 and 2007, information on shares issued and treasury stock is
presented as follows:
Type of shares
issued
Type of
treasury stocks Common stocks *1,2 Common stocks
*3,4,5,6
Number of shares as of March 31, 2006 1,147,917,921 3,530,426 Increase during the year ended March 31,2007 104,174,565 804,031
Decrease during the year ended March 31, 2007 - 644,082
Number of shares as of March 31, 2007 1,252,092,486 3,690,375 Increase during the year ended March 31,2008 26,862,844 740,026
Decrease during the year ended March 31, 2008 - 3,613,973
Number of shares as of March 31, 2008 1,278,955,330 816,428
*1. Increase in the number of shares issued during the year ended March 31, 2007
Issuance of new shares due to the exercise of stock acquisition rights 104,174,565 shares
*2. Increase in the number of shares issued during the year ended March 31, 2008
Issuance of new shares due to stock exchanges 26,862,844 shares *3. Increase in the number of treasury stocks during the year ended March 31, 2007
Purchase of less-than-one-unit shares 603,291 shares Increase resulting from changes of equity shares in affiliates 200,740 shares
*4. Decrease in the number of treasury stocks during the year ended March 31, 2007 Sales of less-than-one-unit shares 31,482 shares Sales of the Company’s shares by affiliated companies 612,600 shares
*5. Increase in the number of treasury stocks during the year ended March 31, 2008
Purchase of less-than-one-unit shares 718,658 shares Increase resulting from changes of equity shares in affiliates 400 shares Increase in shares held by subsidiaries and affiliate due to stock exchanges 20,968 shares
*6. Decrease in the number of treasury stocks during the year ended March 31, 2008 Sales of less-than-one-unit shares 39,742 shares Decrease by stock exchanges 3,145,051 shares Sales of the Company’s shares by affiliated companies 429,180 shares
(b) Dividends
1. Dividend payment
Approvals by shareholders’ meeting held on May 10, 2007 are as follows:
Type of shares Common stock Total amount of dividends ¥4,995 million ($49,858 thousand)
Dividends per share ¥4 ($0.03)
Record date March 31, 2007 Effective date June 4, 2007
Approvals by board of directors’ meeting held on November 8, 2007 are as follows:
Type of shares Common stock Total amount of dividends ¥5,001 million ($49,924 thousand)
Dividends per share ¥4 ($0.03)
Record date September 30, 2007 Effective date December 7, 2007
88

Mitsubishi Materials Corporation and Consolidated Subsidiaries
NOTES TO CONSOLIDATED FINANCIAL STATEMENTS
March 31, 2008, 2007 and 2006
(Continued)
62
2. Dividends whose record date is attributable to the year ended March 31, 2008, but to be effective after this fiscal year
Approvals by board of directors’ meeting held on May 12, 2008 are as follows:
Type of shares Common stock Total amount of dividends ¥5,112 million ($51,029 thousand)
Source Retained earnings
Dividends per share ¥4 ($0.03)
Record date March 31, 2008 Effective date June 3, 2008
Note 20 Notes with Maturity on the Year-end Dates
The year-end date of 2007, namely, March 31, 2007 was a bank holiday. Notes receivable and payable
with maturity on the date were accordingly settled and accounted for on April 2, 2007.
Notes maturing at March 31, 2007 included in the accompanying consolidated balance sheet as of
March 31, 2007 were as follows:
Millions of yen
Notes receivable ¥5,100
Notes payable ¥5,172
Note 21 Business Combination
(a) Mitsubishi Materials Polycrystalline Silicon Co.,Ltd. was merged with the Company.
The details of this merger is as follows:
1. Names of combined parties and description of business
Company name Description of business
Mitsubishi Materials Corporation
(The “Company”)
Production and sales of cement and secondary
cement products; smelting/refining, processing
and sales of copper, gold, silver and other
metals; production and sales of superhard tools,
powder metallurgy, highly efficient materials,
and diamond tools; and production and sales of
electronic materials and components and
polycrystalline silicon.
Mitsubishi Materials Polycrystalline Silicon
Co.,Ltd.
Production and sales of polycrystalline silicon.
2. Legal structure of the business combination
89

Mitsubishi Materials Corporation and Consolidated Subsidiaries
NOTES TO CONSOLIDATED FINANCIAL STATEMENTS
March 31, 2008, 2007 and 2006
(Continued)
63
This is the merger with the Company as a surviving company and Mitsubishi Materials
Polycrystalline Silicon Co.,Ltd. as a company that ceases to exist.
3. Name of company after business combination
There is no change to the company name.
4. Summary of transactions
Mitsubishi Materials Polycrystalline Silicon Co.,Ltd. was merged with the Company on April 1,
2007. Polycrystalline silicon market is expanding, as the demand stays high in the solar cell and
semiconductor market. The purpose of this merger is to stimulate further growth and development
of polycrystalline silicon business as one of our core business by accelerating its decision making
and boosting its technological development capacities through our direct management.
5. Summary of accounting procedure
The Company adopted the accounting procedures for a commonly-controlled business combination
based on the accounting standards, “Accounting Standards for Business Combination” issued by
Business Accounting Council on October 31, 2003, Guidance on Accounting Standard for Business
Combinations and Accounting Standard for Business Divestitures (Guidance No.10 issued by the
Accounting Standards Board of Japan on December 27, 2005).
(b) The share exchange agreement to make Ryoko Sangyo Co., Ltd. a wholly owned subsidiary of the
Company.
The details of this share exchange is as follows:
1. Names of combined parties and description of business
Company name Description of business
Mitsubishi Materials Corporation
(The “Company”)
Production and sales of cement and secondary
cement products; smelting/refining, processing
and sales of copper, gold, silver and other
metals; production and sales of superhard tools,
powder metallurgy, highly efficient materials,
and diamond tools; and production and sales of
electronic materials and components and
polycrystalline silicon.
Ryoko Sangyo Co., Ltd Purchase, sales, import and export of
non-ferrous metal bullion, metal products,
electronic materials, construction materials,
industrial machines, chemical products, heavy
chemicals, and other materials.
90

Mitsubishi Materials Corporation and Consolidated Subsidiaries
NOTES TO CONSOLIDATED FINANCIAL STATEMENTS
March 31, 2008, 2007 and 2006
(Continued)
64
2. Legal structure of the business combination
The share exchange to make Ryoko Sangyo Co., Ltd. a wholly owned subsidiary of the Company.
3. Name of company after business combination
There is no change to the company name.
4. Summary of transactions
On August 1, 2007 the Company and Ryoko Sangyo Co., Ltd. have signed the share exchange to
make Ryoko Sangyo Co., Ltd. a wholly owned subsidiary of the Company.
The purpose of the share exchange is to accelerate its decision making, to improve operating agility,
and to enhance the trading business as a main trading company in our group.
The Company will use a simplified share exchange procedure that does not require the approval of a
general meeting of its shareholders pursuant to Article 796, Paragraph 3, of the Corporation Law.
5. Summary of accounting procedure
The Company adopted the accounting procedures for a commonly-controlled business combination
based on the accounting standards, “Accounting Standards for Business Combination” issued by
Business Accounting Council on October 31, 2003, Guidance on Accounting Standard for Business
Combinations and Accounting Standard for Business Divestitures (Guidance No.10 issued by the
Accounting Standards Board of Japan on December 27, 2005).
6. Acquisition cost of the additional shares of the subsidiary
(1) Acquisition cost details:
Common stock of the Company: ¥1,283 million ($12,807 thousand)
Expenses related to the acquisition: ¥20 million ($207 thousand)
Total acquisition cost: ¥1,303 million ($13,014 thousand)
(2) Allotment ratio of shares and type of the share
The Company will issue 1 share for each share of Ryoko Sangyo Co., Ltd.’s common stock.
However, the Company will not issue any shares for the 4,514,949 shares of Ryoko Sangyo Co.,
Ltd.’s common stock that the Company currently holds.
(3) Methods of calculation for the share exchange ratio
To ensure the fairness and appropriateness of the share exchange ratio, the Company designated
aMidAs Partners, Inc and Ryoko Sangyo Co., Ltd. designated Ernst & Young Transaction
Advisory Service Co., Ltd. as their respective third party advisors to perform the calculation of
the share exchange ratio. The share exchange ratio was approved after the discussion between the
Company and Ryoko Sangyo Co., Ltd. considered the calculation results, such as the market
value average method, adjusted fair value net worth method, and the discounted cash flow (DCF).
91
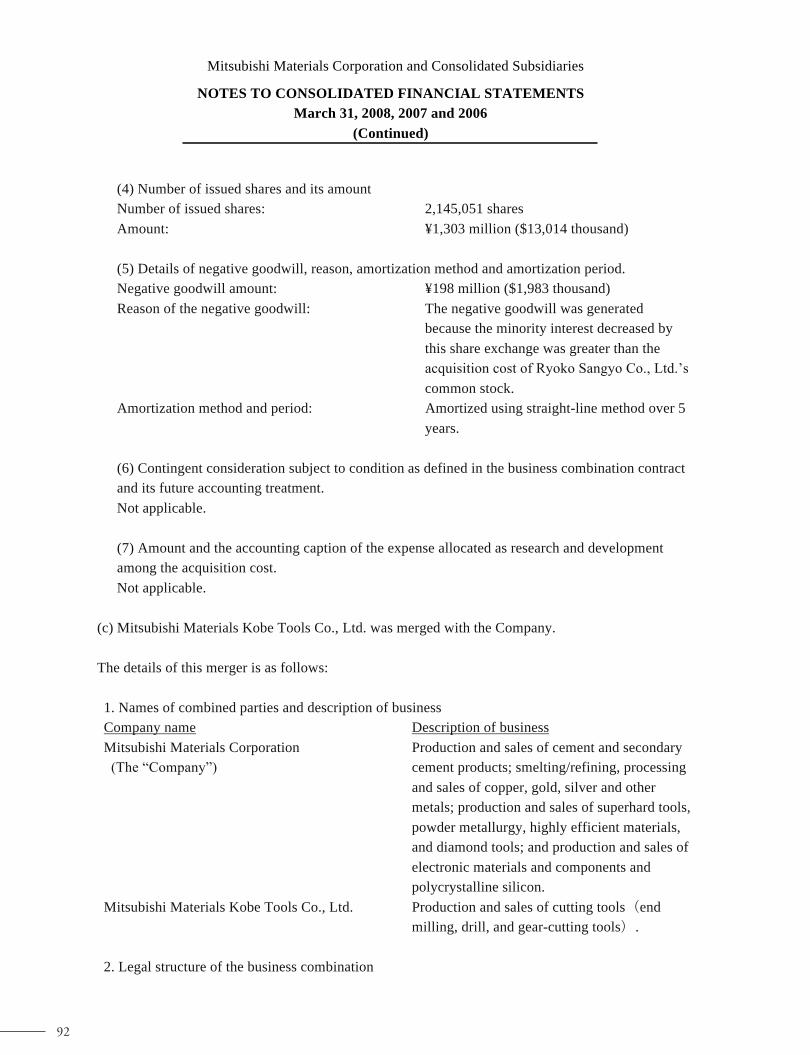
Mitsubishi Materials Corporation and Consolidated Subsidiaries
NOTES TO CONSOLIDATED FINANCIAL STATEMENTS
March 31, 2008, 2007 and 2006
(Continued)
65
(4) Number of issued shares and its amount
Number of issued shares: 2,145,051 shares
Amount: ¥1,303 million ($13,014 thousand)
(5) Details of negative goodwill, reason, amortization method and amortization period.
Negative goodwill amount: ¥198 million ($1,983 thousand)
Reason of the negative goodwill: The negative goodwill was generated
because the minority interest decreased by
this share exchange was greater than the
acquisition cost of Ryoko Sangyo Co., Ltd.’s
common stock.
Amortization method and period: Amortized using straight-line method over 5
years.
(6) Contingent consideration subject to condition as defined in the business combination contract
and its future accounting treatment.
Not applicable.
(7) Amount and the accounting caption of the expense allocated as research and development
among the acquisition cost.
Not applicable.
(c) Mitsubishi Materials Kobe Tools Co., Ltd. was merged with the Company.
The details of this merger is as follows:
1. Names of combined parties and description of business
Company name Description of business
Mitsubishi Materials Corporation
(The “Company”)
Production and sales of cement and secondary
cement products; smelting/refining, processing
and sales of copper, gold, silver and other
metals; production and sales of superhard tools,
powder metallurgy, highly efficient materials,
and diamond tools; and production and sales of
electronic materials and components and
polycrystalline silicon.
Mitsubishi Materials Kobe Tools Co., Ltd. Production and sales of cutting tools end
milling, drill, and gear-cutting tools .
2. Legal structure of the business combination
92

Mitsubishi Materials Corporation and Consolidated Subsidiaries
NOTES TO CONSOLIDATED FINANCIAL STATEMENTS
March 31, 2008, 2007 and 2006
(Continued)
66
This is the merger with the Company as a surviving company and Mitsubishi Materials Kobe Tools
Co., Ltd. as a company that ceases to exist.
3. Name of company after business combination
There is no change to the company name.
4. Summary of transactions
On October 1, 2007 Mitsubishi Materials Kobe Tools Co., Ltd. was merged with the Company.
Cutting tools market is expanding, as the growth stays steady in the automobile industry and the
growth remains high in the aeronautic industry. The purpose of this merger is to reinforce the
products field with high growth potential by accelerating its decision making and streamlining the
human resources through our direct management.
5. Summary of accounting procedure
The Company adopted the accounting procedures for a commonly-controlled business combination
based on the accounting standards, “Accounting Standards for Business Combination” issued by
Business Accounting Council on October 31, 2003, Guidance on Accounting Standard for Business
Combinations and Accounting Standard for Business Divestitures (Guidance No.10 issued by the
Accounting Standards Board of Japan on December 27, 2005).
(d) The share exchange to make Sambo Copper Alloy Co., Ltd. a wholly owned subsidiary of the
Company.
The details of this share exchange is as follows:
1. Names of combined parties and description of business
Company name Description of business
Mitsubishi Materials Corporation
(The “Company”)
Production and sales of cement and secondary
cement products; smelting/refining, processing
and sales of copper, gold, silver and other
metals; production and sales of superhard tools,
powder metallurgy, highly efficient materials,
and diamond tools; and production and sales of
electronic materials and components and
polycrystalline silicon.
Sambo Copper Alloy Co., Ltd. Manufacture and sales of copper and copper
alloy products, and fabricated products.
2. Legal structure of the business combination
The share exchange to make Sambo Copper Alloy Co., Ltd. a wholly owned subsidiary of the
Company.
93
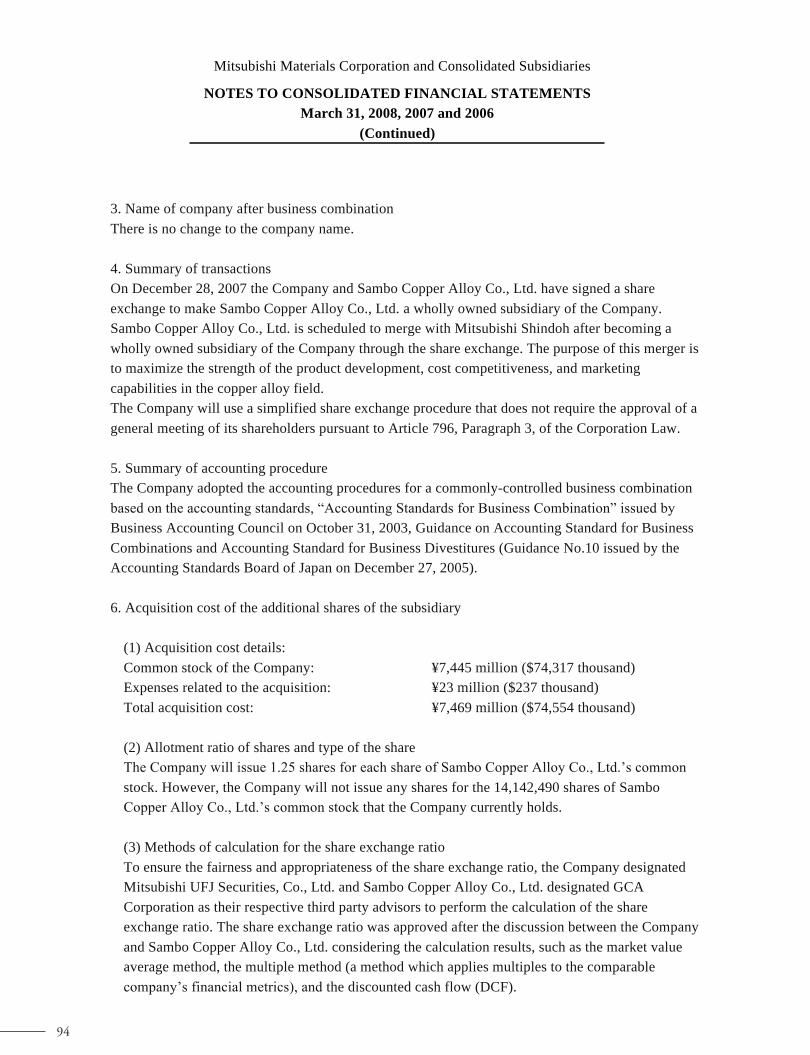
Mitsubishi Materials Corporation and Consolidated Subsidiaries
NOTES TO CONSOLIDATED FINANCIAL STATEMENTS
March 31, 2008, 2007 and 2006
(Continued)
67
3. Name of company after business combination
There is no change to the company name.
4. Summary of transactions
On December 28, 2007 the Company and Sambo Copper Alloy Co., Ltd. have signed a share
exchange to make Sambo Copper Alloy Co., Ltd. a wholly owned subsidiary of the Company.
Sambo Copper Alloy Co., Ltd. is scheduled to merge with Mitsubishi Shindoh after becoming a
wholly owned subsidiary of the Company through the share exchange. The purpose of this merger is
to maximize the strength of the product development, cost competitiveness, and marketing
capabilities in the copper alloy field.
The Company will use a simplified share exchange procedure that does not require the approval of a
general meeting of its shareholders pursuant to Article 796, Paragraph 3, of the Corporation Law.
5. Summary of accounting procedure
The Company adopted the accounting procedures for a commonly-controlled business combination
based on the accounting standards, “Accounting Standards for Business Combination” issued by
Business Accounting Council on October 31, 2003, Guidance on Accounting Standard for Business
Combinations and Accounting Standard for Business Divestitures (Guidance No.10 issued by the
Accounting Standards Board of Japan on December 27, 2005).
6. Acquisition cost of the additional shares of the subsidiary
(1) Acquisition cost details:
Common stock of the Company: ¥7,445 million ($74,317 thousand)
Expenses related to the acquisition: ¥23 million ($237 thousand)
Total acquisition cost: ¥7,469 million ($74,554 thousand)
(2) Allotment ratio of shares and type of the share
The Company will issue 1.25 shares for each share of Sambo Copper Alloy Co., Ltd.’s common
stock. However, the Company will not issue any shares for the 14,142,490 shares of Sambo
Copper Alloy Co., Ltd.’s common stock that the Company currently holds.
(3) Methods of calculation for the share exchange ratio
To ensure the fairness and appropriateness of the share exchange ratio, the Company designated
Mitsubishi UFJ Securities, Co., Ltd. and Sambo Copper Alloy Co., Ltd. designated GCA
Corporation as their respective third party advisors to perform the calculation of the share
exchange ratio. The share exchange ratio was approved after the discussion between the Company
and Sambo Copper Alloy Co., Ltd. considering the calculation results, such as the market value
average method, the multiple method (a method which applies multiples to the comparable
company’s financial metrics), and the discounted cash flow (DCF).
94

Mitsubishi Materials Corporation and Consolidated Subsidiaries
NOTES TO CONSOLIDATED FINANCIAL STATEMENTS
March 31, 2008, 2007 and 2006
(Continued)
68
(4) Number of issued shares and its amount
Number of issued shares: 10,658,262 shares
Amount: ¥7,469 million ($74,554 thousand)
(5) Details of goodwill, reason, amortization method, amortization period.
Goodwill amount: ¥2,195 million ($21,914 thousand)
Reason of the goodwill: The goodwill was generated because
minority interest decreased by this share
exchange was smaller than the acquisition
cost of Sambo Copper Alloy Co., Ltd.’s
common stock.
Amortization method and period: Amortized using straight-line method over 5
years.
(6) Contingent consideration subject to condition as defined in the business combination contract
and its accounting treatment.
Not applicable.
(7) Amount and the accounting caption name of the expense allocated as research and
development among the acquisition cost.
Not applicable.
(e) The share exchange to make Mitsubishi Shindoh Co., Ltd. a wholly owned subsidiary of the
Company.
The details of this share exchange is as follows:
1. Names of combined parties and description of business
Company name Description of business
Mitsubishi Materials Corporation
(The “Company”)
Production and sales of cement and secondary
cement products; smelting/refining, processing
and sales of copper, gold, silver and other
metals; production and sales of superhard tools,
powder metallurgy, highly efficient materials,
and diamond tools; and production and sales of
electronic materials and components and
polycrystalline silicon.
Mitsubishi Shindoh Co., Ltd. Manufacture and sales of copper and copper
alloy products, and thin-film products.
95
Mitsubishi Materials Corporation and Consolidated Subsidiaries
NOTES TO CONSOLIDATED FINANCIAL STATEMENTS
March 31, 2008, 2007 and 2006
(Continued)
69
2. Legal structure of the business combination
The share exchange to make Mitsubishi Shindoh Co., Ltd. a wholly owned subsidiary of the
Company.
3. Name of company after business combination
There is no change to the company name.
4. Summary of transactions
On February 1, 2008 the Company and Mitsubishi Shindoh Co., Ltd. have signed a share exchange
agreement to make Mitsubishi Shindoh Co., Ltd. a wholly owned subsidiary of the Company.
Mitsubishi Shindoh Co., Ltd. is scheduled to merge with Sambo Copper Alloy Co., Ltd. after
becoming a wholly owned subsidiary of the Company through the share exchange. The purpose of
this merger is to maximize the strength of the product development, cost competitiveness, and
marketing capabilities in the copper alloy field.
The Company will use a simplified share exchange procedure that does not require the approval of a
general meeting of its shareholders pursuant to Article 796, Paragraph 3, of the Corporation Law.
5. Summary of accounting procedure
The Company adopted the accounting procedures for a commonly-controlled business combination
based on the accounting standards, “Accounting Standards for Business Combination” issued by
Business Accounting Council on October 31, 2003, Guidance on Accounting Standard for Business
Combinations and Accounting Standard for Business Divestitures (Guidance No.10 issued by the
Accounting Standards Board of Japan on December 27, 2005).
6. Acquisition cost of the additional shares of the subsidiary
(1) Acquisition cost details:
Common stock of the Company: ¥12,019 million ($119,963 thousand)
Expenses related to the acquisition: ¥38 million ($387 thousand)
Total acquisition cost: ¥12,057 million ($120,350 thousand)
(2) Allotment ratio of shares and type of the share
The Company will issue 0.56 shares for each share of Mitsubishi Shindoh Co., Ltd.’s common
stock. However, the Company will not issue any share for the 31,977,199 shares of Mitsubishi
Shindoh Co., Ltd.’s common stock that the Company currently holds.
(3) Methods of calculation for the share exchange ratio
To ensure the fairness and appropriateness of the share exchange ratio, the Company designated
Mitsubishi UFJ Securities, Co., Ltd. and Mitsubishi Shindoh Co., Ltd. designated GCA
Corporation as their respective third party advisors to perform the calculation of the share
exchange ratio. The share exchange ratio was approved after the discussion between the
96

Mitsubishi Materials Corporation and Consolidated Subsidiaries
NOTES TO CONSOLIDATED FINANCIAL STATEMENTS
March 31, 2008, 2007 and 2006
(Continued)
70
Company and Mitsubishi Shindoh Co., Ltd. considering the calculation results, such as the market
value average method, the multiple method (a method which applies multiples to the comparable
company’s financial metrics), and the discounted cash flow (DCF).
(4) Number of issued shares and its amount
Number of issued shares: 17,204,582 shares
Amount: ¥12,057 million ($120,350 thousand)
(5) Details of goodwill, reason, amortization method, amortization period.
Goodwill amount: ¥2,435 million ($24,307 thousand)
Reason of the goodwill: The goodwill was generated because the
minority interest decreased by this share
exchange was smaller than the acquisition
cost of Mitsubishi Shindoh Co., Ltd.’s
common stock.
Amortization method and period: Amortized using straight-line method over 5
years.
(6) Contingent consideration subject to condition as defined in the business combination contract
and its accounting treatment.
Not applicable.
(7) Amount and the accounting caption of the expense allocated as research and development
among the acquisition cost.
Not applicable.
Note 22 Subsequent events
(a) Change in scope of consolidation
As additional acquisition of 36.7% equity shares of Robertson’s Ready Mix, Ltd., RRM Properties,
Ltd., and Robertson’s Transport, Ltd. (the “Robertson’s” in all) by MCC Development Corporation,
which is the consolidated subsidiary of the Company in the United States, was completed on March 31,
2008 (after the balance sheet date of December 31, 2007 of MCC Development Corporation), the
Robertson’s was added to the scope of consolidation and its account is to be included in the
Company’s consolidated financial statements from the year ending March 31,2009.
1. Purpose of additional acquisition
In the Southern California on which the Company bases its cement business, further growth of
population and stronger demand for cement in the long term are expected. Therefore, MCC
Development Corporation acquired additional equity shares of the “Robertson’s” to strengthen the
business base in the region and enhance the cement business in the United States.
97
Mitsubishi Materials Corporation and Consolidated Subsidiaries
NOTES TO CONSOLIDATED FINANCIAL STATEMENTS
March 31, 2008, 2007 and 2006
(Continued)
71
2. Acquisition cost and ownership before and after acquisition
Equity shares acquired: 36.7% Acquisition cost: ¥86,972 million ($868,073 thousand)
Equity shares before additional acquisition: 33.3%
Equity shares after additional acquisition: 70%
3. Details of the subsidiaries (1) Corporate names: Robertson’s Ready Mix, Ltd.
RRM Properties, Ltd.
Robertson’s Transport, Ltd. (2) Main business: Production and sales of ready-mixed concrete and aggregate material.
(3) Location: Corona, CA, USA
(4) Recent business results: Net sales: ¥75,034 million ($748,918 thousand)
Net income: ¥21,912 million ($218,707 thousand)
Total assets: ¥30,367 million ($303,100 thousand)
Net assets: ¥8,719 million ($87,034 thousand)
Since the legal entity of the Robertson’s is partnership, MCC Development Corporation as a partner
pays any taxes according to percentage of ownership interest under path-through taxation rule.
(b) Acquisition of treasury stock
At the meeting of Board of Directors held on May 12, 2008, the Board resolved acquisition of its
treasury stock under Article 156 of the Corporation Law of Japan, as applied pursuant to Article 165
(3) of the Corporation Law, as detailed below:
1. Reason for acquisition of its treasury stock
For the purpose of comprehensive return to shareholders and promotion of expeditious capital
strategies.
2. Details of acquisition
(1) Method of purchase: Purchase through market transactions by a trust bank
(2) Class of shares to be acquired: Shares of common stock
(3) Number of shares to be acquired: Up to 10,000,000 shares
(4) Total amount of shares to be acquired: Up to ¥5,000 million ($49,905 thousand) (5) Schedule of acquisition: From May 13, 2008 to June 13, 2008
98

3
Independent Auditors’ Report
To the Shareholders and the Board of Directors of
Mitsubishi Materials Corporation:
We have audited the accompanying consolidated balance sheets of Mitsubishi Materials Corporation (a
Japanese corporation) and consolidated subsidiaries as of March 31, 2008 and 2007, the related
consolidated statements of income for each of the three years in the period ended March 31, 2008, the consolidated statement of net assets for the year ended March 31, 2008 and 2007, the consolidated
statements of shareholders’ equity for the year ended March 31, 2006 and the consolidated statements
of cash flows for each of the three years in the period ended March 31, 2008, expressed in Japanese yen.
These consolidated financial statements are the responsibility of the Company’s management. Our
responsibility is to independently express an opinion on these consolidated financial statements based
on our audits.
We conducted our audits in accordance with auditing standards generally accepted in Japan. Those
standards require that we plan and perform the audit to obtain reasonable assurance about whether the
financial statements are free of material misstatement. An audit includes examining, on a test basis,
evidence supporting the amounts and disclosures in the financial statements. An audit also includes
assessing the accounting principles used and significant estimates made by management, as well as evaluating the overall financial statement presentation. We believe that our audits provide a
reasonable basis for our opinion.
In our opinion, the consolidated financial statements referred to above present fairly, in all material
respects, the consolidated financial position of Mitsubishi Materials Corporation and consolidated
subsidiaries as of March 31, 2008 and 2007, and the consolidated results of their operations and their
cash flows for each of the three years in the period ended March 31, 2008, in conformity with accounting
principles generally accepted in Japan.
Without qualifying our opinion, we draw attention to the following:
(1) As discussed in Note 2 (h), Mitsubishi Materials Corporation, the domestic consolidated
subsidiaries and affiliates under the equity method have adopted the new accounting standard
for impairment of fixed assets in the year ended March 31, 2006.
(2) As discussed in Note 13, Mitsubishi Materials Corporation has changed its method of business
segment classification in the year ended March 31, 2006.
(3) As discussed in Note 2 (d), Mitsubishi Materials Corporation and the domestic consolidated
subsidiaries have adopted the new accounting standard for measurement of inventories in the
year ended March 31, 2007.
(4) As discussed in Note 2 (r), Mitsubishi Materials Corporation and the domestic consolidated
subsidiaries have adopted the new accounting standard for presentation of net assets in the
balance sheet and the revised accounting standard for treasury shares and appropriation of legal
reserve in the year ended March 31, 2007. (5) As discussed in Note 2 (u), Mitsubishi Materials Corporation has changed its accounting
method of income for industrial waste treatment in the “Cement” segment in the year ended
March 31, 2007.
(6) As discussed in Note 22 (a), as additional acquisition of equity shares of Robertson’s Ready Mix,
Ltd., RRM Properties, Ltd., and Robertson’s Transport, Ltd. (the “Robertson’s” in all) by MCC
Development Corporation in the United States was completed after the balance sheet date of
December 31, 2007 of MCC Development Corporation, the Robertson’s was added to the scope
of consolidation and its account is to be included in the Company’s consolidated financial
statements from the year ending March 31, 2009.
The U.S. dollar amounts in the accompanying consolidated financial statements with respect to the year ended March 31, 2008 are presented solely for convenience. Our audit also included the translation of
yen amounts into U.S. dollar amounts and, in our opinion, such translation has been made on the basis
described in Note 1 to the consolidated financial statements.
Tokyo, Japan
June 27, 2008
99

100
Main Consolidated Subsidiaries LineofBusiness PercentageofOwnership
Cement
MCCDevelopmentCorp. Investmentincement-relatedindustries 70%
MitsubishiCementCorp. Productionandsalesofcement 67%
MitsubishiMaterialsKenzaiCorp. Productionandsalesofconcreteproductsandotherbuildingmaterials 100%
RyokoLimeIndustryCo.,Ltd. Productionandsalesoflimestone 100%
TokyoHosoKogyoCo.,Ltd. Construction 96%
Metals
MitsubishiShindohCo.,Ltd. Productionandsalesofcopper,copperalloyandbrasssemis 100%
OnahamaSmelting&RefiningCo.,Ltd. Smeltingandrefiningofcopper 50%
PT.Smelting Smelting,refiningandsalesofcopper 61%
Advanced Materials & Tools
JapanNewMetalsCo.,Ltd. Productionandsalesoftungstenandmolybdenum 89%,11%(indirectly)
MitsubishiMaterialsToolsCo.,Ltd. Salesofcuttingtools 100%
MitsubishiMaterialsU.S.A.Corp. SurveysintheUnitedStatesandsalesoffabricatedmetalproducts 100%
MitsubishiMaterialsC.M.I.Co.,Ltd. Productionandsalesoftungstenalloy,electriccontactsandmotors 100%
Electronic Materials & Components
JEMCOInc. Productionandsalesofchemicalproducts 100%
MitsubishiPolycrystallineSiliconAmericaCorp. Productionandsalesofpolycrystallinesilicon 100%
Aluminum
UniversalCanCorp. Productionandsalesofaluminumbeveragecans 80%
MitsubishiAluminumCo.,Ltd. Productionandsalesofaluminumsheets,extrusionandfoil 88%
TachibanaMetalManufacturingCo.,Ltd. Productionandsalesoffabricatedaluminumproducts 63%(indirectly)
Others
MitsubishiMaterialsEnergyCorp. Salesoffuel 100%
MitsubishiMaterialsTechnoCorp. Technicalengineeringandconstruction 100%
MitsubishiNuclearFuelCo.,Ltd. Productionandsalesofnuclearfuelsforpowergeneration 66%
DiaConsultantsCo.,Ltd. Soilanalysisandconsulting 81%,3%(indirectly)
DiasaltCorp. Productionandsalesofsalt 95%
Material-FinanceCo.,Ltd. Financing 100%
MitsubishiMaterialsRealEstateCorp. Realestate 100%
RyokoSangyoCorp. Trading 100%
Main Affiliates* LineofBusiness PercentageofOwnership
Cement
P.S.MitsubishiConstructionCo.,Ltd.** Construction 40%,1%(indirectly)
Ube-MitsubishiCementCorp. Salesofcement 50%
Metals
Kobelco&MaterialsCopperTube,Ltd. Productionandsalesofcoppertubesandrelatedproducts 45%
MitsubishiCableIndustriesCo.,Ltd.** Productionandsalesofelectricwireandcable 37%
Advanced Materials & Tools
PlanseeMitsubishiMaterialsGlobalSinterHoldingS.A. Productionandsalesofpowdermetallurgicalproducts 50%
Electronic Materials & Components
SUMCOCORPORATION** Productionandsalesofsiliconwafers 28%
*Companiestowhichtheequitymethodisapplied**CompanieswhosesharesarelistedontheTokyoStockExchange
Main Consolidated Subsidiaries and Affiliates (AsofJune27,2008)

101
• CanadaMitsubishiMaterialsCorp.VancouverOfficeRepresentative office
• MexicoMMCMetaldeMexicoS.A.Sales of cemented carbide products
• United StatesMCCDevelopmentCorp.Investment in cement-related industries
MitsubishiCementCorp.Production and sales of cement
MitsubishiMaterialsU.S.A.Corp.Surveys in the United States and sales of fabricated metal products
MitsubishiPolycrystallineSiliconAmericaCorp.Production and sales of polycrystalline silicon
MMCElectronicsAmericaInc.Sales of electronic parts
RFMInc.Production of cemented carbide products
THERMALEX,Inc.Production and sales of aluminum extrusion
• BrazilMMC-MetaldoBrasilLtda.Sales of cemented carbide products
• ChileMitsubishiMaterialsCorp.ChileOfficeRepresentative office
• FranceMMCMetalFranceS.A.R.L.Sales of cemented carbide products
• GermanyMMCHardmetal(Holdings)EuropeGmbHHolding company for fabricated metal products
MMCHartmetallGmbHSales of cemented carbide products
• ItalyMMCItaliaS.R.L.Sales of cemented carbide products
• LuxembourgPlanseeMitsubishiMaterialsGlobalSinterHoldingS.A.Production and sales of powder metallurgical products
• NetherlandsMMNetherlandsCo.Holding company for copper mine
• RussiaMMCHardmetalRussiaLtd.Sales of cemented carbide products
• SpainMitsubishiMaterialsEspanaS.A.SociedadUnipersonaProduction and sales of cemented carbide products
• United KingdomMMCHardMetalU.K.Ltd.Sales of fabricated metal products
• IndiaSonaOkegawaPrecisionForgingsLtd.Production and sales of precision forging gears for automobiles
MMCHardmetalIndiaPVT.Ltd.Sales of cemented carbide products
• IndonesiaPT.HigashifujiIndonesiaProduction and sales of micromotors
PT.MMCMetalFabricationProduction and sales of nickel-base alloy fabricated products
PT.SmeltingSmelting, refining and marketing of copper
• MalaysiaHigashifuji(Malaysia)Sdn.Bhd.Production and sales of micromotors
MMCElectronics(M)Sdn.Bhd.Production and sales of electronic parts
• People’s Republic of China
(HongKongSAR)
MMCElectronics(H.K.)Ltd.Sales of electronic parts
(Otherareas)
MAChinaExtrusion(Suzhou)Co.,Ltd.Production and sales of aluminum extrusion
MitsubishiMaterialsCorp.ShanghaiOfficeRepresentative office
MMCShanghaiCo.,Ltd.Sales of electronic parts
TianjinTianlingCarbideToolsCo.,Ltd.Production and sales of cemented carbide products
YantaiMitsubishiCementCo.,Ltd.Production and sales of cement
• SingaporeMMCElectronics(Singapore)Pte.Ltd.Sales of electronic parts
MMCMetalSingaporePte.Ltd.Sales of cemented carbide products
• South KoreaMMCElectronicsKoreaInc.Sales of electronic parts
• TaiwanMUEMaterialsTaiwanCo.,Ltd.Production and sales of sputtering targets
• ThailandHigashifujiThailandCo.,Ltd.Production and sales of micromotors
MMCElectronics(Thailand)Co.,Ltd.Production and sales of electronic parts
MMCTools(Thailand)Co.,Ltd.Production and sales of cemented carbide products
MitsubishiMaterialsCorp.SoutheastAsiaRegionalOfficeRepresentative office
MUANG-MAX(Thailand)Co.,Ltd.Production and sales of aluminum extrusion
• VietnamNghiSonCementCorporationProduction and sales of cement
• AustraliaMitsubishiMaterials(Australia)Pty.Ltd.
International Network (AsofJune27,2008)
North America
South America
Europe
Asia
Oceania

102
<memo>

103
Corporate Data (Nonconsolidated) (As of March 31, 2008)
Investor Information (As of March 31, 2008)
Date Established April 1, 1950
Headquarters 1-5-1, Otemachi, Chiyoda-ku, Tokyo 100-8117, Japan
Number of Employees 4,448
Number of Manufacturing Plants (Domestic) 17
Number of R&D Institutes (Domestic) 2
Number of Sales Offices (Domestic) 6
Major Shareholders
Japan Trustee Services Bank, Ltd. (Trust account)
The Master Trust Bank of Japan, Ltd. (Trust account)
The Bank of Tokyo–Mitsubishi UFJ Ltd.
The Meiji Yasuda Mutual Life Insurance Co.
State Street Bank and Trust Company 505103
Annual Meeting of Shareholders The annual meeting of shareholders of the Company is normally held in June each year in Tokyo.
Distribution of Shareholders
● Japanese financial institutions 29.82%
● Japanese securities companies 2.08%
● Other Japanese corporations 18.19%
● Foreign corporations and individuals 24.11%
● Japanese individual investors and others 25.73%
● Japanese government and other public organizations 0.01%
● Treasury stock 0.06%
Shares of Common StockAuthorized: 2,683,162,000
Issued and Outstanding: 1,278,955,330
Capital ¥119,457 million
Number of Shareholders 142,335
Stock Listings Tokyo Stock Exchange and Osaka Securities Exchange
Transfer Agent of Common Stock The Mitsubishi UFJ Trust and Banking Corp.1-4-5, Marunouchi, Chiyoda-ku, Tokyo 100-8212, Japan
Independent Certified Public Accountants KPMG AZSA & Co.
For Further Information, Contact
Corporate Communications & IR Dept. Mitsubishi Materials Corporation1-5-1, Otemachi, Chiyoda-ku, Tokyo 100-8117, JapanTel: +81-3-5252-5206Fax: +81-3-5252-5272E-mail: [email protected]
The Principles We Stand On
For People, Society and the Earth
Corporate Philosophy
As a diversified materials company, Mitsubishi Materials has contributed to the creation of an affluent society through the supply of basic materials indispensable for the world.
Today, our activities cover a wide range, from the manufacture of basic materials to fabricated products and new materials with high-performance features, and further to the provision of systems and engineering services.
To respond to the various needs of society, we are constantly tackling research and development on new technologies and products and endeavor to provide ever more superior products, systems and services to the world.
We will continue to address the requirements of the world in a new era, such as technical innovation, development of information technology, globalization and a heightened awareness of the environmental protection.
At the same time, we will carefully and efficiently use natural resources and raw materials that are the gift of the Earth, and will support building social systems based upon resource recycling.
It is thus our principles to serve people, society and the Earth through our varied business activities.

1-5-1, Otemachi, Chiyoda-ku, Tokyo 100-8117, Japanhttp://www.mmc.co.jp/
This annual report is printed on recycled paper.
Printed in Japan
Annual Report 2008For the Year Ended March 31, 2008
Promote growth strategies
aimed at evolution
and innovation
Mitsubishi M
aterials Corporation Annual Report 2008