promotion of cholangiocarcinoma growth by diverse cancer
TRANSCRIPT

Article
Promotion of cholangiocar
cinoma growth by diversecancer-associated fibroblast subpopulationsGraphical abstract
Highlights
d The majority of CAF in ICC are derived from hepatic
stellate cells
d Inflammatory CAF promote ICC through HGF and its
receptor MET
d myCAF promote ICC through Has2/hyaluronic acid
d CAF-derived type I collagen contributes to stiffness but does
not promote ICC growth
Affo et al., 2021, Cancer Cell 39, 1–17June 14, 2021 ª 2021 Elsevier Inc.https://doi.org/10.1016/j.ccell.2021.03.012
Authors
Silvia Affo, Ajay Nair,
Francesco Brundu, ..., Xin Chen,
Andrea Califano, Robert F. Schwabe
In brief
Intrahepatic cholangiocarcinoma (ICC) is
an extraordinarily stiff liver tumor due to
abundant scar-forming cancer-
associated fibroblasts (CAF). Here, Affo
et al. determine the origin and functions of
CAF, and uncover distinct CAF subsets,
promoting ICC growth via different
therapeutically targetable mediators.
Thus, CAF and their mediators may serve
as therapeutic targets for ICC.
ll

Please cite this article in press as: Affo et al., Promotion of cholangiocarcinoma growth by diverse cancer-associated fibroblast subpopulations, CancerCell (2021), https://doi.org/10.1016/j.ccell.2021.03.012
ll
Article
Promotion of cholangiocarcinoma growth by diversecancer-associated fibroblast subpopulationsSilvia Affo,1 Ajay Nair,2,24 Francesco Brundu,2,24 Aashreya Ravichandra,1,24 Sonakshi Bhattacharjee,1
Michitaka Matsuda,3 LiKang Chin,4 Aveline Filliol,1 Wen Wen,1 Xinhua Song,5 Aubrianna Decker,6 Jeremy Worley,2
Jorge Matias Caviglia,1 Lexing Yu,1 Deqi Yin,1 Yoshinobu Saito,1 Thomas Savage,7 Rebecca G. Wells,5 Matthias Mack,8
Lars Zender,9,10,11 Nicholas Arpaia,7,12 Helen E. Remotti,13 Raul Rabadan,2 Peter Sims,14 Anne-Laure Leblond,15
Achim Weber,15 Marc-Oliver Riener,15 Brent R. Stockwell,6,16 Jellert Gaublomme,6 Josep M. Llovet,17,18,19
George K. Michalopoulos,20 Ekihiro Seki,3 Daniela Sia,18 Xin Chen,5 Andrea Califano,1,2,12,14,21,22
and Robert F. Schwabe1,12,23,25,*1Department of Medicine, Columbia University, New York, NY 10032, USA2Department of Systems Biology, Columbia University Irving Medical Center, New York, NY 10032, USA3Department of Medicine, Division of Digestive and Liver Diseases, Cedars-Sinai Medical Center, Los Angeles, CA 90024, USA4Department of Medicine, Penn Physical Sciences in Oncology Center PSOC@Penn, University of Pennsylvania, Philadelphia,
PA 19104, USA5Department of Bioengineering and Therapeutic Sciences and Liver Center, University of California, San Francisco, CA 94158, USA6Department of Biological Sciences, Columbia University, New York, NY 10027, USA7Department of Microbiology and Immunology, Vagelos College of Physicians and Surgeons, Columbia University, New York,
NY 10032, USA8Department of Nephrology, University Hospital Regensburg, 93053 Regensburg, Germany9Department of Medical Oncology and Pneumology, University Hospital Tuebingen, 72076 Tuebingen, Germany10German Cancer Research Consortium (DKTK), German Cancer Research Center (DKFZ), 69120 Heidelberg, Germany11iFIT Cluster of Excellence EXC 2180, University of Tuebingen, 72076 Tuebingen, Germany12Herbert Irving Comprehensive Cancer Center, Columbia University, New York, NY 10032, USA13Department of Pathology & Cell Biology, Columbia University, New York, NY 10032, USA14Department of Systems Biology, Columbia University, New York, NY 10032, USA15Department for Pathology and Molecular Pathology, Z€urich University Hospital, 8091 Z€urich, Switzerland16Department of Chemistry, Columbia University, New York, NY 10027, USA17Liver Cancer Translational Research Laboratory, Institut d’Investigacions Biomediques August Pi i Sunyer, Hospital Clınic, Universitat de
Barcelona, 08036 Barcelona, Spain18Mount Sinai Liver Cancer Program, Divisions of Liver Diseases, Tisch Cancer Institute, Icahn School of Medicine at Mount Sinai, New York,
NY 10029, USA19Institucio Catalana de Recerca i Estudis Avancats, Barcelona, Spain20Department of Pathology, University of Pittsburgh, Pittsburgh, PA 15213, USA21Department of Biomedical Informatics, Columbia University, New York, NY 10032, USA22Department of Biochemistry & Molecular Biophysics, Columbia University, New York, NY 10032, USA23Institute of Human Nutrition, Columbia University, New York, NY 10032, USA24These authors contributed equally25Lead contact
*Correspondence: [email protected]
https://doi.org/10.1016/j.ccell.2021.03.012
SUMMARY
Cancer-associated fibroblasts (CAF) are a poorly characterized cell population in the context of liver cancer.Our study investigates CAF functions in intrahepatic cholangiocarcinoma (ICC), a highly desmoplastic livertumor. Genetic tracing, single-cell RNA sequencing, and ligand-receptor analyses uncovered hepatic stellatecells (HSC) as the main source of CAF and HSC-derived CAF as the dominant population interacting with tu-mor cells. Inmice, CAF promotes ICC progression, as revealed by HSC-selective CAF depletion. In patients, ahigh panCAF signature is associated with decreased survival and increased recurrence. Single-cell RNAsequencing segregates CAF into inflammatory and growth factor-enriched (iCAF) and myofibroblastic(myCAF) subpopulations, displaying distinct ligand-receptor interactions. myCAF-expressed hyaluronansynthase 2, but not type I collagen, promotes ICC. iCAF-expressed hepatocyte growth factor enhancesICC growth via tumor-expressed MET, thus directly linking CAF to tumor cells. In summary, our data demon-strate promotion of desmoplastic ICC growth by therapeutically targetable CAF subtype-specific mediators,but not by type I collagen.
Cancer Cell 39, 1–17, June 14, 2021 ª 2021 Elsevier Inc. 1

llArticle
Please cite this article in press as: Affo et al., Promotion of cholangiocarcinoma growth by diverse cancer-associated fibroblast subpopulations, CancerCell (2021), https://doi.org/10.1016/j.ccell.2021.03.012
INTRODUCTION
models. Our study reveals HSC-derived CAF as the populationCancer-associated fibroblasts (CAF) are an abundant but insuf-
ficiently characterized cell type in the tumor microenvironment
(TME) that may promote or restrain tumor growth in a context-
and organ-specific manner (Biffi and Tuveson, 2020; Erez
et al., 2010; Kalluri, 2016; Ozdemir et al., 2014; Rhim et al.,
2014; Sahai et al., 2020; Su et al., 2018). Themechanisms under-
lying CAF-mediated tumor promotion or restriction remain
incompletely understood. Recent studies have revealed CAF di-
versity by transcriptomics (Biffi and Tuveson, 2020; Chen and
Song, 2019; Costa et al., 2018; Elyada et al., 2019; Ohlund
et al., 2017; Su et al., 2018; Zhang et al., 2020). As an additional
contributor to diversity, CAF may arise from different cellular
sources including resident fibroblasts, pericytes, mesenchymal
stem cells, bone marrow, and adipocytes (Biffi and Tuveson,
2020; Chen and Song, 2019; Sahai et al., 2020). However, the
in vivo role of CAF subpopulations and associated mediators
remain largely elusive. Moreover, many insights into CAF are
derived from genetically engineered mouse models of pancre-
atic ductal adenocarcinoma (PDAC) and breast cancer, with
only a few studies of other organs including the liver.
Cholangiocarcinoma (CCA), the second most common pri-
mary malignancy of the liver, is a desmoplastic tumor with
abundant CAF, few therapeutic options, and dismal prognosis
(Banales et al., 2020; Rizvi et al., 2018b). The increased inci-
dence of CCA is largely due to a rise in intrahepatic CCA (ICC)
(Banales et al., 2020), possibly attributable to increased non-
alcoholic fatty liver disease (Banales et al., 2020; Clements
et al., 2020). ICC shares anatomic, embryologic, and genetic fea-
tures with PDAC. However, while the contribution of CAF to tu-
mor growth has been the subject of numerous in vivo studies
in PDAC, the functions of CAF in CCA have not been studied
thoroughly in vivo. In PDAC, tumor restriction by a-smooth
muscle actin-positive (aSMA+) CAF in vivo contrasts the tumor-
promoting effects of CAF observed in vitro, emphasizing the
importance of careful in vivo studies. Moreover, there is
increased evidence for diverse functions of CAF subtypes,
notably myofibroblastic CAF (myCAF) and inflammatory CAF
(iCAF) (Biffi and Tuveson, 2020), but in vivo functions of these
CAF subpopulations and their mediators, in particular CAF-
secreted extracellular matrix (ECM), remain largely elusive. While
it is widely assumed that crosslinked type I collagen promotes
tumors via increased stiffness and mechanosensitive signaling
(Barbazan and Matic Vignjevic, 2019; Levental et al., 2009;
Northey et al., 2017), ECM can also provide a mechanical barrier
restricting tumor spread (Egeblad et al., 2010; Liotta, 1986).
Insights on CAF functions in ICC are derived from in vitro
studies (Affo et al., 2017; Sirica, 2011) and a single in vivo study
using an orthotopic implantation model and BCL2 inhibitor navi-
toclax, which depletes CAF but may also affect tumor and
hematopoietic cells (Mertens et al., 2013). In contrast to other or-
gans, fibroblast ontogeny is well defined in the liver, with hepatic
stellate cells (HSC) contributing 85%–95%of fibroblasts (Meder-
acke et al., 2013). Here, we took advantage of Lrat-Cre-trans-
genic mice (Mederacke et al., 2013) as a powerful tool to trace
and functionally manipulate this well-defined fibroblast precur-
sor population, providing insights into CAF biology in ICC and
the role of CAF-derived mediators in endogenously arising ICC
2 Cancer Cell 39, 1–17, June 14, 2021
that most intensely interacts with tumor cells, promoting ICC
growth via CAF subtype-specific mediators but not type I
collagen. Our data expand insights into pathways that drive
the growth of this deadly tumor and challenge paradigms on
collagen as the central tumor-promoting mediator.
RESULTS
Hepatic stellate cell-derived CAF are the main tumor-interacting population in ICCHepatic overexpression of oncogenic driver KRASG12D in combi-
nation with p19 CRISPR (KRAS/p19), or myr-AKT in combination
with either YAPS127A (YAP/AKT), NICD1 (NICD/AKT), or
FBXW7Df (FBXW7Df/AKT) via the Sleeping Beauty system,
delivered by hydrodynamic tail vein injection (Fan et al., 2012;
Seehawer et al., 2018; Wang et al., 2019), resulted in the devel-
opment of histopathologically confirmed cytokeratin 7- and 19-
positive ICC. All tumors were desmoplastic, displaying high
Acta2 and Col1a1 mRNA (Figures 1A and 1B) and abundant
Col1a1-GFP and aSMA-positive CAF (Figures 1B, S1A, and
S1B). Using Lrat-Cre-driven lox-stop-lox-TdTomato (TdTom)
as a faithful strategy to label HSC (Mederacke et al., 2013), we
observed that 85%–95% of Col1a1-GFP+ CAF and 85%–93%
of aSMA+ CAF in these four desmoplastic ICC models were
marked by Lrat-Cre-driven TdTom, suggesting HSC origin (Fig-
ures 1B, S1A, and S1B). All subsequent studies, including sin-
gle-cell RNA sequencing (scRNA-seq), CAF depletion, and
HSC-selective knockouts were performed in two ICC models:
YAP/AKT-induced ICC as most widely used AKT-driven ICC
model, and KRAS/p19-induced ICC incorporating KRASG12D
as a common mutation in ICC (Table S1). Lrat-Cre tracing was
confirmed by scRNA-seq in four murine ICC samples (n = 3
YAP/AKT, n = 1 KRAS/p19). 91.9% ± 2.8% of panCAF, defined
by an scRNA-seq signature (Table S2), expressed an HSC signa-
ture, including Lrat, Desmin, Colec11, and Rgs5, whereas only
6.3% ± 2.3% expressed Msln, Upk3b, Gpm6a, and Upk1b as
markers of portal fibroblasts (PF), a second fibrogenic popula-
tion in the liver with mesothelial characteristics (Figures 1C and
S1C–S1J; Table S2). Comparison of HSC-CAF with fibrosis-
associated HSC from biliary fibrosis, induced by either ligation
of the common bile duct or 3-week diet containing 0.1% 3,5-di-
ethoxycarbonyl-1,4-dihydrocollidine (DDC), revealed most
genes and pathways as shared but uncovered higher activation
in HSC-CAF (Figure 1D and Table S3), suggesting differentiation
of HSC into highly activated HSC-CAF in the TME. To determine
mechanisms through which HSC-CAF affect ICC, we analyzed
ligand-receptor interactions by CellPhoneDB (Vento-Tormo
et al., 2018). In murine scRNA-seq samples (n = 4), CAF were
the predominant cell population interacting with tumor cells,
and among these, HSC-CAF represented the subpopulation
with the most ligand-receptor interactions with tumor cells (Fig-
ures 1E, 1F, and S1K–S1N). scRNA-seq analysis of human ICC
(n = 6) and hilar CCA (n = 1) samples confirmed the predomi-
nance of HSC-CAF (90.7% ± 6.4% of all CAF in ICC, 100% in
CCA), expressing RGS5, LUM, and COLEC11, and low abun-
dance PF-CAF (9.3% ± 6.4% of all CAF in ICC, not detected
in CCA), expressing MSLN and UPK1B (Figures 1G, 1H,
S1H, and S1J; Table S1). Similar to mice, we found strong

A
C
D
G H I
E F
B
Figure 1. The majority of CAF are HSC derived and closely interact with tumor cells in ICC
(A) Acta2 and Col1a1mRNA expression in murine ICC. Data shown as mean ± SEM. Significance for each model was calculated by two-sided unpaired t test or
Mann-Whitney test versus its own control, *p < 0.05, **p < 0.01, ***p < 0.001.
(B) Representative photographs, CK19 and CK7 IHC confocal microscopy and quantifications, showing colocalization of Lrat-Cre induced TdTom with CAF
markersCol1a1-GFP and aSMA in four murine ICCmodels (n = 3/model) in Lrat-Cre+TdTom+Col1a1-GFP+mice. Data shown asmean ± SEM. Scale bars, 50 mm.
(C) Representative UMAPs of scRNA-seq HSC and PF signature scores HSCmarkers Colec11, Lum, Des, and Lrat, and PF markerMsln in KRAS/p19 (n = 1) and
YAP/AKT-induced ICC (n = 3), with the percentage of CAF populations on the right.
(legend continued on next page)
llArticle
Cancer Cell 39, 1–17, June 14, 2021 3
Please cite this article in press as: Affo et al., Promotion of cholangiocarcinoma growth by diverse cancer-associated fibroblast subpopulations, CancerCell (2021), https://doi.org/10.1016/j.ccell.2021.03.012

llArticle
Please cite this article in press as: Affo et al., Promotion of cholangiocarcinoma growth by diverse cancer-associated fibroblast subpopulations, CancerCell (2021), https://doi.org/10.1016/j.ccell.2021.03.012
ligand-receptor interactions between panCAF and tumor cells,
and between HSC-CAF and tumor cells, in human ICC (n = 5)
and human CCA (n = 1) (Figures 1G, 1H, S1M, and S1N). Impor-
tantly, a high panCAF signature, developed from our scRNA-seq
data, as well as high ACTA2mRNA expression, were associated
with decreased survival and increased recurrence risk in ICC pa-
tients in the Sia cohort (Sia et al., 2013) (Figures 1I and S1O; Ta-
ble 1) as was high aSMA protein in tissuemicroarrays (TMA) from
the Riener cohort (Riener et al., 2010) (Figure S1P). Moreover, a
high panCAF signature was significantly enriched in the ICC pro-
liferation subclass versus the inflammation subclass (Sia et al.,
2013) and was associated with moderate to poor cell differenti-
ation and intraneural invasion (Table 1). Together, these findings
support our hypothesis that HSC-CAFmodulate ICC biology and
outcomes and suggest that this may be mediated through direct
interactions with tumor cells.
To extend our findings beyond the liver, we analyzed scRNA-
seq CAF data from KPC-induced PDAC and identified pancre-
atic stellate cells (PSC)-CAF and mesothelial CAF as main CAF
populations (Figures 2A). PSC-CAF only weakly expressed
HSC markers Lrat, Des, or Rgs5 (Figure 2B), but they shared
most stellate cells (SC) genes in a global SC signature with
HSC-CAF (Figures 2C and S2A–S2E). Similar to PF-CAF in
ICC, mesothelial CAF in PDAC highly expressed Msln, Upk1b,
Upk3b, and Gpm6a (Figure 2D). These data suggest similar
CAF ontogeny in pancreas and liver, consistent with the finding
that both organs contain SC (Ohlund et al., 2017; Senoo
et al., 2017).
HSC-derived CAF promote ICC growthTo elucidate CAF functions in ICC, we depleted HSC-CAF by
crossing Lrat-Cre transgenic mice with lox-stop-lox-Hbegf
(Cre-inducible diphtheria toxin receptor = iDTR transgenic
mice); or depleted aSMA+ CAF, representing the more myofibro-
blastic subpopulation of CAF (Biffi and Tuveson, 2020), as shown
by colocalization of aSMAwithCol1a1-GFP+ or co-expression of
Acta2 with Col1a1 mRNA in the HSC-CAF population (Figures
S3A and S3B), via aSMA-driven thymidine kinase. Depletion by
either strategy during the last 2 weeks of our tumor models
reduced CAF by up to 85% with concomitantly reduced fibrosis
(Figures 3A–3C, S3C, and S3D). Depleting CAF by either
approach suppressed ICC development, evidenced by signifi-
cant reductions of the liver/body weight ratio and CK19+ tumor
area (Figures 3A–3C). In contrast, when CAF were depleted
early, which led to a transient decrease but almost full recovery
2 weeks later, tumor growth was not affected (Figures S3E and
S3F). As a complementary approach, we deleted Pdgrfb via
Lrat-Cre, which decreased aSMA and fibrosis and also reduced
ICC formation (Figures S3G and S3H). Next, we sought to under-
(D) Heatmap of genes from bulk RNA-seq with >2log fold change and p < 0.01 in q
diet (n = 4), HSC-CAF from YAP/AKT (n = 4), and KRAS/p19 (n = 3) when compa
(E and F) CellPhoneDB analysis showing the number of ligand-receptor interaction
in KRAS/p19-and YAP/AKT-induced ICC.
(G and H) Representative UMAPs and heatmaps of scRNA-seq showing (G) cell p
HSC and PF signature scores and percentage (n = 6), and number of ligand-recep
calculated by Mann-Whitney test.
(I) Overall survival in 119 ICC patients with low (n = 59) and high (n = 60) panCAF
See also Figure S1 and Tables S1–S3.
4 Cancer Cell 39, 1–17, June 14, 2021
stand how CAF promote ICC development. CAF-depleted mice
displayed significantly reduced tumor cell proliferation, whereas
apoptosis was unaltered or even reduced in tumors of CAF-
depleted mice (Figures 3D, 3E, and S3I). Consistent with the
low immunogenicity of oncogene-driven tumors, we observed
only few infiltrating CD3+ T cells and no significant differences
of lymphocyte and myeloid subsets between CAF-depleted
and non-depleted mice (Figures 3F and S3J–S3M), with the
exception of CD4+FOXP3+ regulatory T cells (Treg). The
observedminor reduction of CD4+FOXP3+ Treg after CAF deple-
tion (Figure 3F) is consistent with the ability of CAF to promote
differentiation of T lymphocytes into Treg (Costa et al., 2018).
Moreover, HSC promoted ICC growth when co-injected with
tumor cells intoRag2 knockoutmice (Figure S3N), suggesting tu-
mor promotion by direct HSC-CAF in the absence of adaptive
immunity, in this subcutaneous model. As nuclear factor kB
(NF-kB) regulates CAF-mediated inflammation and tumor
growth in the skin (Erez et al., 2010), we studied its role in ICC.
Deletion of NF-kB subunit RelA via Lrat-Cre was efficient but
did not reduce ICC growth (Figures S3O and S3P). In summary,
our studies suggest that direct CAF-tumor interactions trigger tu-
mor cell proliferation and represent a major mechanism through
which CAFmay promote ICC growth, whereasmodulation of cell
death, adaptive immunity, or inflammation appear to only play
minor roles in the investigated models.
CAF promote tumor growth independently of type IcollagenNext, we sought to uncover mediators through which HSC-
derived CAF promote ICC growth. To test the hypothesis that
CAF in ICC may be functionally diverse with distinct pathways
and ligand-receptor interactomes, we analyzed murine and hu-
man CAF by scRNA-seq. By this approach, we uncovered sub-
populations of inflammatory and growth factor-enriched CAF
(iCAF) and myCAF, as well as CAF-expressing PF/mesothelial
markers, termed mesothelial CAF (mesCAF) (Figures 4A and
S4A–S4D). Some CAF, fitting multiple categories, were denoted
as ‘‘multi-CAF,’’ and few CAF, not fitting above categories, as
‘‘other CAF.’’ iCAF were part of the HSC cluster, expressing
high levels of quiescence markers Lrat, Reln, and Rgs5, and
low activation markers Col1a1, Acta2, Col8a1, Col15a1, Crlf1,
and Fbn2 (Figures 4A, S4A, and S4B), and were enriched for in-
flammatory, growth factor, and antigen-presentation genes as
well as receptor-ligand, growth factor, and cytokine activity
pathways (Figures 4A, S4A, and S4B; Table S4). myCAF were
also part of the HSC-CAF cluster, but expressing lower
HSC quiescence and higher activation markers than iCAF
(Figures 4A and S4A–S4D) and enriched for ECM pathways
(Table S5). Using Rgs5 as marker for the iCAF population and
uiescent HSC (n = 4), HSC from bile duct ligation (n = 4), HSC from 0.1% DDC
red with quiescent HSC (n = 4).
s between (E) all cell populations and (F) HSC-CAF and PF-CAFwith tumor cells
opulations and the number of ligand-receptor interactions between all cells, (H)
tor interactions (n = 5) in human ICC. Data shown as mean ± SEM. Significance
signature.

Table 1. Correlation between humanpanCAF andmyCAF signatureswith clinicopathological parameters in a human cohort of 119 ICC
patients
panCAF low panCAF high Total p value myCAF low myCAF high Total p value
n (%) 59 60 119 59 60 119
Molecular class
Proliferation class 18 (31) 54 (90) 72 (60) 0.0001 20 (34) 52 (87) 72 (60) 0.0001
Inflammation class 41 (69 6 (10) 47 (40) 39 (66) 8 (13) 47 (40)
Demographics
Sex, n (%)
Male 28 (47) 37 (62) 65 (55) 0.142 29 (49) 36 (60) 65 (55) 0.272
Age, years
Median (IQR) 62 (54–70) 64 (55–70) 64 (54–70) 0.91 62 (53–71) 64 (56–69) 64 (54–70) 0.901
Race, n (%)
Caucasian 56 (96) 52 (86) 108 (92) 0.178 56 (97) 52 (87) 108 (92) 0.018
African American 1 (2) 1 (2) 2 (2) 2 (3) 0 (0) 2 (2)
Asian 0 (0) 3 (5) 3 (3) 0 (0) 3 (5) 3 (2)
Other 1 (2) 4 (7) 5 (3) 0 (0) 5 (8) 5 (4)
Viral hepatitis, n (%)
Hepatitis C 11 of 57 (19) 8 of 60 (13) 19 (16) 0.267 12 (21) 7 (12) 19 (16) 0.219
Hepatitis B 5 (9) 6 (10) 11 (9) 1 7 (12) 4 (7) 11 (9) 0.362
Cirrhosis, n (%) 8 (15) 12 (23) 20 (19) 0.331 8 (15) 12 (20) 20 (19) 0.458
Total bilirubin, n (%)
>1 mg/dL 14 (25) 10 (18) 24 (21) 0.492 13 (24) 11 (19) 24 (21) 0.648
Serum ALT, n (%)
>40 IU/L 12 (21) 19 (33) 31 (27) 0.206 12 (21) 19 (33) 31 (27) 0.209
Tumor features (pathologic)
Tumor diameter, cm
Median (IQR) 6 (4–9) 7 (5–9) 6 (4–9) 0.096 6 (4–8) 7 (5–11) 6 (4–9) 0.095
Tumor number, n (%)
Single 47 (80) 52 (87) 99 (83) 0.337 48 (81) 51 (85) 99 (83) 0.632
Multiple 12 (20) 8 (13) 20 (17) 11 (19) 9 (15) 20 (17)
Cell differentiation, n (%)
Well 14 (30) 4 (8) 18 (19) 0.009 11 (24) 7 (14) 18 (19) 0.298
Moderate-poor 33 (70) 44 (92) 77 (81) 35 (76) 42 (86) 77 (81)
Stagea, n (%)
I + II 36 (62) 34 (57) 58 (49) 0.579 38 (64) 32 (54) 70 (59) 0.349
III + IV 22 (38) 26 (43) 21 (36) 27 (46) 48 (41)
Macrovascular invasion, n (%) 4 (7) 12 (20) 16 (13) 0.058 4 (3) 12 (20) 24 (20) 0.058
Invasion of peritoneum, n (%) 0 (0) 4 (7) 4 (3) 0.119 0 (0) 4 (7) 4 (3) 0.119
Infiltration of resection
margins, n (%)
22 (37) 32 (53) 54 (45) 0.1 21 (36) 33 (55) 54 (45) 0.09
Invasion of bile duct, n (%) 1 (2) 5 (8) 6 (5) 0.207 1 (2) 5 (83) 6 (5) 0.207
Intraneural invasion, n (%) 4 (7) 16 (27) 20 (17) 0.006 4 (7) 16 (27) 20 (17) 0.006
Satellites, n (%) 14 (24) 15 (25) 29 (24) 0.837 15 (25) 17 (28) 32 (27) 0.837
Variables included here have less than 10% of missing values except for cell differentiation (n = 24, 20%missing). IQR, interquartile range. p values in
boldface are significant.aData according to the AJCC TNM stage, 7th edition.
llArticle
Please cite this article in press as: Affo et al., Promotion of cholangiocarcinoma growth by diverse cancer-associated fibroblast subpopulations, CancerCell (2021), https://doi.org/10.1016/j.ccell.2021.03.012
Col1a1-GFP and SERPINF1 as markers for myCAF, we
confirmed these in situ as separate populations of TdTom+
Rgs5highCol1a1-GFPlow HSC-CAF, reminiscent of iCAF, and
TdTom+Rgs5lowCol1a1-GFPhigh HSC-CAF, reminiscent of
myCAF, in both murine ICC models (Figure 4B); and high
RGS5 and low SERPINF1 (resembling iCAF) and low RGS5
Cancer Cell 39, 1–17, June 14, 2021 5

A
C
D
B
Figure 2. Comparison of CAF from ICC and PDAC
(A) UMAPs showing cell populations detected by scRNA-seq in KPC-induced mouse PDAC from Hosein et al. (2019).
(B) UMAPs showing the normalized expression levels of panCAF and HSC markers in PDAC-KPC.
(C and D) Violin plots showing the (C) global SC signature and (D) PF signature scores and UMAPs for each gene of these signatures. The width of each violin plot
indicates the kernel density of the expression values.
See also Figure S2.
llArticle
Please cite this article in press as: Affo et al., Promotion of cholangiocarcinoma growth by diverse cancer-associated fibroblast subpopulations, CancerCell (2021), https://doi.org/10.1016/j.ccell.2021.03.012
and high SERPINF1 (resembling myCAF) CAF in human ICC
(Figure 4C). However, there appeared to be no specific spatial
distribution of iCAF and myCAF in murine or human ICC. myCAF
and iCAF strongly interacted with tumor cells in CellPhoneDB
ligand-receptor analysis in murine ICC (Figures 4D and S4E)
and in human ICC and CCA (Figures 4D and S4F). myCAF repre-
sented 32.5% ± 4.6% of CAF in murine ICC, 26.2% ± 3.9% of
CAF in human ICC (Figure 4A), and 66.8% in human CCA.
Notably, high expression of the scRNA-seq-derived myCAF
signature was associated with decreased survival (Figure 5A)
and showed a trend toward higher recurrence in the Sia cohort
(Sia et al., 2013) (Figure S4G). The myCAF signature was en-
riched in the ICC proliferation subclass versus the inflammation
subclass and was associated with intraneural invasion (Table
1). There were also differences in the myCAF signature in regard
to racial background, but subgroupswere too small for meaning-
ful subgroup analysis. As desmoplasia, collagen content and
stiffness are closely intertwined and thought to impact on tumor
growth via mechanosensitive signals (Barbazan and Matic Vi-
gnjevic, 2019; Levental et al., 2009; Northey et al., 2017), we first
6 Cancer Cell 39, 1–17, June 14, 2021
focus on type I collagen as tumor-modulating myCAF candidate
mediator in ICC. Col1a1 was strongly upregulated in murine and
human ICC and increased in CAF versus quiescent HSC (Figures
1A and 5B). ScRNA-seq and CellPhoneDB analysis revealed that
Col1a1was enriched in myCAF while a cognate receptor,DDR1,
was expressed in tumor cells (Figures 5C and 5D), suggesting
COL1A1-DDR1 as a link between myCAF and tumor cells be-
sides pure collagen-mediated mechanosensitive signals. Dele-
tion of Col1a1 from HSC via Lrat-Cre was highly efficient in
KRAS/p19- and YAP/AKT-induced ICC (Figure 5E) and was
accompanied by decreased tumor stiffness and decreased
expression of YAP, a mechanosensitive transcriptional co-acti-
vator with key roles in CCA (Marti et al., 2015) (Figures 5F and
S5A). Along this line, culturing ICC cells on stiff surfaces
increased proliferation of human ICC line HuCCT-1 (Figure S5B).
However, despite reduced stiffness and decreased mechano-
sensitive signals, Col1a1 deletion in HSC-CAF did not inhibit
tumor growth in either ICC model (Figures 5G and 5H). As an
additional approach, we deleted type I collagen in all liver cells
via Mx1-Cre. Deletion of Col1a1 via Mx1-Cre at different time
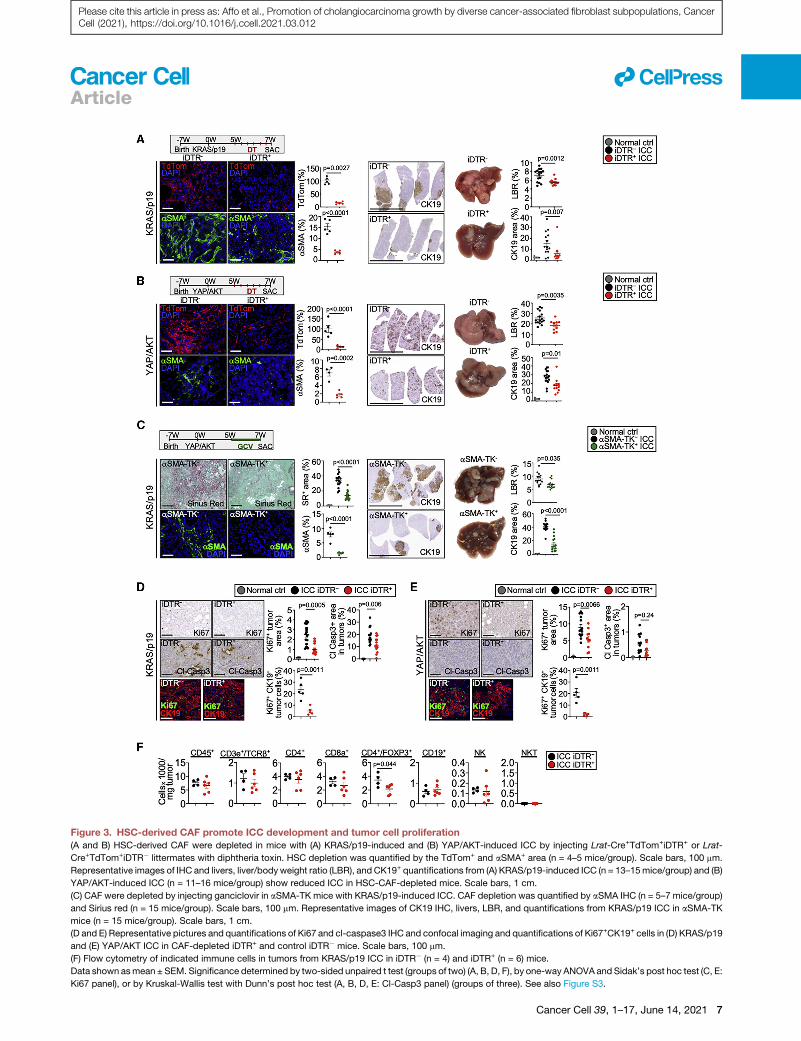
Figure 3. HSC-derived CAF promote ICC development and tumor cell proliferation
(A and B) HSC-derived CAF were depleted in mice with (A) KRAS/p19-induced and (B) YAP/AKT-induced ICC by injecting Lrat-Cre+TdTom+iDTR+ or Lrat-
Cre+TdTom+iDTR� littermates with diphtheria toxin. HSC depletion was quantified by the TdTom+ and aSMA+ area (n = 4–5 mice/group). Scale bars, 100 mm.
Representative images of IHC and livers, liver/bodyweight ratio (LBR), and CK19+ quantifications from (A) KRAS/p19-induced ICC (n = 13–15mice/group) and (B)
YAP/AKT-induced ICC (n = 11–16 mice/group) show reduced ICC in HSC-CAF-depleted mice. Scale bars, 1 cm.
(C) CAF were depleted by injecting ganciclovir in aSMA-TK mice with KRAS/p19-induced ICC. CAF depletion was quantified by aSMA IHC (n = 5–7 mice/group)
and Sirius red (n = 15 mice/group). Scale bars, 100 mm. Representative images of CK19 IHC, livers, LBR, and quantifications from KRAS/p19 ICC in aSMA-TK
mice (n = 15 mice/group). Scale bars, 1 cm.
(D and E) Representative pictures and quantifications of Ki67 and cl-caspase3 IHC and confocal imaging and quantifications of Ki67+CK19+ cells in (D) KRAS/p19
and (E) YAP/AKT ICC in CAF-depleted iDTR+ and control iDTR� mice. Scale bars, 100 mm.
(F) Flow cytometry of indicated immune cells in tumors from KRAS/p19 ICC in iDTR� (n = 4) and iDTR+ (n = 6) mice.
Data shown asmean ± SEM. Significance determined by two-sided unpaired t test (groups of two) (A, B, D, F), by one-way ANOVA and Sidak’s post hoc test (C, E:
Ki67 panel), or by Kruskal-Wallis test with Dunn’s post hoc test (A, B, D, E: Cl-Casp3 panel) (groups of three). See also Figure S3.
llArticle
Cancer Cell 39, 1–17, June 14, 2021 7
Please cite this article in press as: Affo et al., Promotion of cholangiocarcinoma growth by diverse cancer-associated fibroblast subpopulations, CancerCell (2021), https://doi.org/10.1016/j.ccell.2021.03.012

A
B
D
C
Figure 4. CAF subpopulations and their ligand-receptor interactome in ICC
(A) Representative UMAPs of indicated genes, CAF subpopulations, and their percentages in KRAS/p19 (n = 1), YAP/AKT-induced (n = 3), and human ICC (n = 6).
Data shown as mean ± SEM. Significance determined by one-way ANOVA followed by Sidak’s post hoc test (mouse) or Kruskal-Wallis test with Dunn’s post hoc
test (human).
(legend continued on next page)
llArticle
8 Cancer Cell 39, 1–17, June 14, 2021
Please cite this article in press as: Affo et al., Promotion of cholangiocarcinoma growth by diverse cancer-associated fibroblast subpopulations, CancerCell (2021), https://doi.org/10.1016/j.ccell.2021.03.012

llArticle
Please cite this article in press as: Affo et al., Promotion of cholangiocarcinoma growth by diverse cancer-associated fibroblast subpopulations, CancerCell (2021), https://doi.org/10.1016/j.ccell.2021.03.012
points was also highly efficient but again did not reduce tumor
growth while reducing stiffness (Figures S5C–S5G). Conditional
deletion of the above-discussed collagen receptor Ddr1 (Fig-
ure S5H), which was highly increased in human and mouse
ICC (Figures 5I and S5I), from the hepatocyte/tumor cell
compartment by AAV8-TBG-Cre led to inconclusive results,
with increased liver/body weight ratio and CK19+ tumor area in
KRAS/p19 ICC, but slightly reduced liver/body weight ratio and
unaltered CK19+ area in YAP/AKT ICC (Figures 5J and 5K). In
sum, our data show that neither COL1A1 nor DDR1 are essential
for ICC growth.
Myofibroblastic CAF promote tumor growth viahyaluronan synthase 2We next investigated additional COL1A1-independent pathways
through which myCAF, which strongly interacted with tumor
cells (Figure 6A), could promote ICC growth. Focusing on differ-
entially expressed matrisome genes in myCAF (Figure 6B), we
identified hyaluronan synthase 2 (Has2) as one the most upregu-
lated genes in myCAF and also in bulk RNA-seq of isolated HSC-
CAF (Figure 6B and Table S6). Of note, hyaluronan (HA) has been
linked to tumor promotion, therapy resistance, and poor out-
comes in various tumors including PDAC (McCarthy et al.,
2018; Provenzano et al., 2012; Toole, 2004). CellPhoneDB anal-
ysis revealed multiple HA receptors including Cd44, Hmmr, and
Lyve1 on various cell types, reflecting the complex HA biology
(Figures 6C and 6D). In addition to binding various receptors,
HA bioactivity is also determined by receptor-independent
biomechanical properties and its molecular size/degradation,
with high-molecular-weight HA being considered anti-tumori-
genic and low-molecular-weight HA being pro-inflammatory
and tumor-promoting (Cyphert et al., 2015; Tian et al., 2013).
For this reason, our primary focus was to investigate HAS2/HA
as potential myCAF effector rather than defining its diverse
cellular and receptor targets and mechanisms of action in ICC.
Paralleling the high induction of Has2 mRNA in CAF, HA was
abundant in both ICC models (Figure 6E), co-localizing with
CAF but not with tumor cells (Figures S6A and S6B) and
decreasing strongly after depleting HSC-CAF (Figures S6C and
S6D). The predominant expression of HA in myCAF was shown
by higher HA in Col1a1-GFPhigh than in Col1a1-GFPlow TdTom+
HSC-CAF in murine ICC (Figure S6E). To determine the role of
HAS2, we crossed Has2fl/fl mice with Lrat-Cre mice (Has2DHSC),
resulting in >98.5% reduction of Has2 mRNA in HSC and
reduced HA in ICC (Figure S6F). Tumors were significantly
decreased in Has2DHSC mice in both ICC models, with
decreased liver/body weight ratio and CK19+ tumor area (Fig-
ures 6F and 6G). Different from Col1a1DHSC mice, tumors from
Has2DHSC mice did not show differences in stiffness (Figure 6H)
or YAP/TAZ expression (Figure 6I). Consistent with our findings
in CAF-depleted mice, Has2DHSC tumors showed a significant
(B) Representative confocal microscopy and quantifications show high RGS5 i
TdTom+Col1a1-GFP+ mice (n = 3 tumors/model). Data shown as mean ± SEM. S
(C) Representative confocal microscopy and quantifications show high expression
and vice versa (n = 3 tumors). Data shown as mean ± SEM. Significance determ
(D) Representative heatmaps of CellPhoneDB analysis showing the number of li
cells in KRAS/p19 (n = 1) and YAP/AKT ICC (n = 3), and in human ICC (n = 5).
See also Figure S4; Tables S4 and S5.
reduction of tumor cell proliferation (Figure 6J). The deletion of
Cd44, widely considered the main receptor for HA, from the he-
patocyte/tumor cell compartment was efficient but did not
reduce ICC development (Figures 6K, S6G, and S6H). Moreover,
different molecular weight and types of HA failed to induce tumor
cell proliferation in CCA cell lines (Figure S6I). Likewise, the
modest increase of proliferation by conditioned medium from
Has2-transgenic HSC (Yang et al., 2019) was not blocked by hy-
aluronidase treatment or CD44 antibody (Figures S6J and S6K).
Together with our CellPhoneDB analysis, these findings suggest
that HAS2mediates its tumor-promoting effects through interac-
tions with non-tumor cells or receptors other than CD44. HA was
also significantly increased in human ICC and co-localized with
CAF but not with tumor cells (Figures 6L, S6B, S6L, and S6M).
Importantly, tissue microarray analysis revealed a strong trend
toward worsened survival in CCA patients with higher HA
expression (Figures 6M and S6L). Similar to our findings in
mice, HAS2 was expressed in HSC-CAF, and within those in
the myCAF subpopulation in human ICC and CCA (Figures 6N
and S6M). Similar to mice, CellPhoneDB showed significant in-
teractions between myCAF and tumor cells in human ICC, but
also revealed interactions ofHAS2-expressing CAFwith multiple
HA receptors, including CD44, HMMR, and LYVE1, and multiple
cell types (Figures 4D, S6N, and S6O).
Inflammatory CAF promote ICC via HGF-METiCAF represented 48.5% ± 2.3% of CAF in murine ICC, 53.1% ±
6.2% of CAF in human ICC (Figure 4A), and 14% in human CCA.
iCAF interacted strongly with tumor cells in CellPhoneDB (Fig-
ures 4D and 7A). To identify a candidate through which iCAF
may modulate ICC growth, we analyzed scRNA-seq data for
ligand-receptor interactions, focusing on differentially expressed
cytokines and growth factors (Figure 7B). Among these, we
uncovered hepatocyte growth factor (HGF)-MET as a well-
established growth-promoting ligand-receptor pair, with high
relevance for liver regeneration (Michalopoulos and DeFrances,
1997) and the TME (Hanahan and Coussens, 2012). Notably,
HGF is abundantly expressed in HSC and CAF (Friedman,
2008; Kalluri, 2016). Complementary to the strong expression
of Hgf in iCAF, its receptor Met was highly expressed in tumor
cells (Figures 7C and 7D), thus representing a candidate
ligand-receptor pair directly linking CAF to tumor cells. The
higher expression of HGF in iCAF than in myCAF was validated
by ELISA (Figure S7A). Using RNAScope and immunohisto-
chemistry (IHC), we confirmed that Hgf and Has2 mRNA as
well as HA and RGS5 were localized in distinct HSC-CAF sub-
sets in mouse and human ICC, respectively (Figures S7B and
S7C). Next, we deleted Hgf in HSC-derived CAF via Lrat-Cre
(HgfDHSC), which was highly efficient (Figure S7D). HgfDHSC
mice displayed reduced ICC development, with decreased
liver/body weight ratio and CK19+ tumor area in our two ICC
n Col1a1-GFPlow iCAF and low RGS5 in Col1a1-GFPhigh myCAF in Lrat-Cre+
ignificance determined by two-sided unpaired t test. Scale bars, 50 mm.
of iCAFmarker RGS5 in cells with low expression of myCAFmarker SERPINF1
ined by two-sided unpaired t test. Scale bars, 50 mm.
gand-receptor interactions between iCAF, myCAF, and mesCAF and all other
Cancer Cell 39, 1–17, June 14, 2021 9

A
D
E
G
J K
H I
F
B C
Figure 5. Col1a1 affects tumor stiffness but not tumor growth in ICC
(A) Overall survival in 119 ICC patients with low (n = 59) and high (n = 60) myCAF signature.
(B) Col1a1 mRNA in quiescent HSC (n = 4) and HSC-derived CAF from KRAS/p19-induced (n = 3) and YAP/AKT-induced (n = 4) ICC and COL1A1 mRNA
expression in non-tumor (NT) and tumor (T) tissues (n = 11) from ICC patients.
(legend continued on next page)
llArticle
10 Cancer Cell 39, 1–17, June 14, 2021
Please cite this article in press as: Affo et al., Promotion of cholangiocarcinoma growth by diverse cancer-associated fibroblast subpopulations, CancerCell (2021), https://doi.org/10.1016/j.ccell.2021.03.012

llArticle
Please cite this article in press as: Affo et al., Promotion of cholangiocarcinoma growth by diverse cancer-associated fibroblast subpopulations, CancerCell (2021), https://doi.org/10.1016/j.ccell.2021.03.012
models (Figures 7E and S7E). Conversely, the deletion of HGF
receptorMet in the hepatocyte/tumor compartment significantly
reduced ICC growth (Figure 7F). HGF promoted proliferation in
human and murine CCA tumor cells, including the newly estab-
lished KRAS/p19-derived CGKP19 line (Figures 7G, S7F, and
S7G), confirming direct effects of HGF on tumor cells. Moreover,
Ki67-positive tumor cells were significantly reduced in the
HgfDHSC and MetDHep ICC models (Figures 7H and S7H). Phos-
phokinase screening and immunoblotting revealed strong phos-
phorylation of ERK and AKT in HGF-treated human and mouse
tumor cells, and HGF-induced proliferation was blunted after
pharmacologic ERK inhibition (Figures 7I, 7J, and S7I–S7K). As
in vivo correlate, we observed a strong reduction of phospho-
ERK in ICC in HgfDHSC mice (Figure 7K). scRNA-seq validated
the high expression of HGF in HSC-derived iCAF in human ICC
and CCA, while MET was expressed in tumor cells (Figures 7L
and S7L). CellPhoneDB in ICC and CCA patients confirmed
strong interactions between iCAF and tumor cells (Figure 4D)
including interactions via iCAF-expressed HGF and tumor-ex-
pressed MET (Figures 7M and S7M). Together, these findings
suggest the HGF-MET axis as a key tumor-promoting ligand-
receptor pair, directly linking iCAF to tumor cells in mice and
patients via ERK-mediated tumor cell proliferation.
DISCUSSION
Our study, combining depletion, inhibition, and conditional
knockout strategies in mice with survival analysis in two patient
cohorts, firmly establishes a tumor-promoting role of CAF in ICC,
contrasting their largely tumor-repressive role in PDAC (Ozdemir
et al., 2014; Rhim et al., 2014). Moreover, our scRNA-seq, Cell-
PhoneDB, and co-injection studies suggest that tumor-promot-
ing effects of CAF are mediated through direct HSC-CAF-tumor
interactions, but do not exclude the presence of additional tu-
mor-promoting mechanisms, including immunomodulation. (1)
We found similar CAF ontogeny with SC-derived and mesothe-
lial/PF-derived CAF as the main populations in PDAC; (2) we
employed KRAS as tumor driver and the same CAF depletion
strategy as previous studies in PDAC (Ozdemir et al., 2014).
However, while SC-CAF are abundant in early-stage PDAC,
mesothelial CAF appear to be more abundant in advanced
PDAC (Hosein et al., 2019). Thus, differences in CAF subtype
or differences in tumor biology more likely contribute to different
roles of CAF in ICC and PDAC rather than different technical or
(C) Ligand-receptor interactions between COL1A1-expressing myCAF and other
(D) Representative UMAPs of indicated genes in KRAS/p19 ICC, YAP/AKT ICC,
(E) Representative images and quantification of Sirius red staining and Col1a1 qP
(n = 12 each). Scale bars, 100 mm.
(F) Storage modulus G0 (a measure of elasticity) in Col1a1f/f (n = 3) and Col1a1DHS
Curves are mean ± SEM. Using two-way ANOVA, *p% 0.05, **p% 0.01, ****p% 0
and TAZ western blot and quantifications normalized to GAPDH in Col1a1f/f and
(G and H) Representative images of CK19 IHC, livers, LBR, and quantifica
(n = 12–13 mice/group) in Col1a1f/f and Col1a1DHSC. Scale bars, 1 cm.
(I) DDR1 mRNA expression in NT and T (n = 11 each) from ICC patients.
(J and K) Representative images and quantifications of CK19 IHC, livers, and LBR
(n = 12–14 mice/group) in Ddr1f/f and Ddr1DHep mice. Scale bars, 1 cm.
Data shown as mean ± SEM. Significance determined by two-sided unpaired t te
one-way ANOVA followed by Sidak’s post hoc test (B mouse, F) (groups of three
depletion approaches. Even though PF/mesCAF were rare in
ICC, we cannot exclude that they contribute to ICC growth.
Recent studies in various cancers have revealed CAF diversity
(Biffi and Tuveson, 2020; Chen and Song, 2019; Costa et al.,
2018; Elyada et al., 2019; Ohlund et al., 2017; Su et al., 2018;
Zhang et al., 2020), but the functions of specific CAF subtype
mediators remain poorly understood. Here, we assign specific
in vivo functions to iCAF andmyCAFmediators via CAF-selective
knockout to prove causation, thus complementing previous
in vitro studies on CAF subtypes in breast cancer (Costa et al.,
2018; Friedman et al., 2020) and PDAC (Elyada et al., 2019; Oh-
lund et al., 2017). iCAF represent growth factor- and cytokine-
enriched HSC-CAF in a lower activation status expressing high
levels ofHGF, whilemyCAF are strongly activated HSC-CAF, en-
riched in COL1A1 and HAS2/HA. Our in vivo data suggest that
HGF and HAS2 represent distinct iCAF and myCAF mediators
and that their pro-tumorigenic effects converge at the level of tu-
mor cell proliferation. With fibrosis-associated HSC and HSC-
CAF sharing most genes and pathways and iCAF and myCAF
subpopulations displaying different degrees of fibroblastic acti-
vation, we propose that HSC first differentiate into iCAF, which
subsequently give rise tomyCAF. It is likely that the iCAF andmy-
CAF states are transient and that CAF can shuttle between these
states. CellPhoneDB analysis, in vitro studies, and conditional
knockout studies suggested different mechanisms through
which iCAF and myCAF mediators affect tumor cells, with
iCAF-associated HGF acting directly on tumor cells and my-
CAF-associated HA possibly acting indirectly. Hence, these
CAF subtype mediators represent potential therapeutic targets.
While clinical targeting of HA has proved to be difficult, possibly
because of inflammationmediated by degradation products (Cy-
phert et al., 2015; Ramanathan et al., 2019), targeting the HGF-
MET pathway is clinically established with several Food and
Drug Administration-approved drugs (Comoglio et al., 2018).
Further studies are needed to identify the target cell(s) and the
underlying receptor-dependent or receptor-independent mech-
anisms through which myCAF-expressed HAS2/HA operate.
However, the finding that depletion of myCAF via aSMA-driven
thymidine kinase reduces tumor growth in ICC while increasing
tumor growth in PDAC may point toward a stronger rationale
for targeting HA in ICC than in PDAC.
Surprisingly, abolishing CAF-derived type I collagen in this
highly desmoplastic tumor did not reduce growth despite
reduced stiffness, thus challenging a long-standing paradigm
that links collagen-mediated stiffness to desmoplastic tumor
cells in mouse and human ICC.
and human ICC.
CR in Col1a1f/f and Col1a1DHSC KRAS/p19 ICC (n = 9 each) and YAP/AKT ICC
C (n = 4) mice in a KRAS/p19 ICC and in control liver (n = 2) by shear rheometry.
.0001, #0.05 < p% 0.10 versus control (black) or versus Col1a1DHSC (red). YAP
Col1a1DHSC (NT n = 1 each, T n = 5 each).
tions from (G) KRAS/p19 ICC (n = 9 mice/group) and (H) YAP/AKT ICC
from (J) KRAS/p19 ICC (n = 10–12 mice/group) and (K) YAP/AKT-induced ICC
st (E, F, G, H, I, K) or Mann-Whitney test (B human, F, J) (groups of two); and by
). See also Figure S5.
Cancer Cell 39, 1–17, June 14, 2021 11

A
B
E
F G
IH
J
L M N
K
C D
Figure 6. myCAF-derived HAS2 mediates tumor promotion
(A) Representative CellPhoneDB showing the number of interactions between myCAF and other cells in murine ICC.
(B) Heatmap of genes differentially expressed in myCAF versus iCAF and mesCAF in KRAS/p19 and YAP/AKT ICC.
(C) Representative CellPhoneDB ligand-receptor pairs linking myCAF to other cells.
(legend continued on next page)
llArticle
12 Cancer Cell 39, 1–17, June 14, 2021
Please cite this article in press as: Affo et al., Promotion of cholangiocarcinoma growth by diverse cancer-associated fibroblast subpopulations, CancerCell (2021), https://doi.org/10.1016/j.ccell.2021.03.012

llArticle
Please cite this article in press as: Affo et al., Promotion of cholangiocarcinoma growth by diverse cancer-associated fibroblast subpopulations, CancerCell (2021), https://doi.org/10.1016/j.ccell.2021.03.012
growth (Barbazan and Matic Vignjevic, 2019; Levental et al.,
2009; Northey et al., 2017). Our in vitro data, showing increased
tumor cell proliferation on stiff plates, in conjunction with our
in vivo data, revealing decreased stiffness and decreased YAP
expression in tumors from Col1a1-deleted mice, suggest that
type I collagenmay activate tumor-promoting mechanosensitive
and additional tumor-suppressive pathways in parallel, and that
the balance of these two determines the net effect, which was
unaltered tumor growth in Col1a1DHSC ICC. It is possible that
type I collagen-mediated tumor suppression in ICC is due to its
function as mechanical barrier (Egeblad et al., 2010; Liotta,
1986) and that the tumor-restrictive functions of aSMA+ myCAF
in PDAC, observed in depletion experiments (Ozdemir et al.,
2014; Rhim et al., 2014), are due to their ability to establish a me-
chanical barrier via type I collagen.
Future studies need to determine whether iCAF and myCAF
populations promote tumor growth through similar pathways in
other desmoplastic tumors including extrahepatic cholangiocar-
cinoma, and whether myCAF- and iCAF-secreted HGF and HA
represent therapeutic targets for ICC. As our analyses focused
on European and North American cohorts and as racial back-
ground may affect CAF signature enrichment (Table 1), it would
also be important to extend our studies to ICC from other regions
such as Asia, where the underlying pathophysiology and genetic
drivers differ because of the high prevalence of fluke infections.
While clinical studies targeting CAF in PDAC have been disap-
pointing (Catenacci et al., 2015; Ramanathan et al., 2019), the
potent tumor-promoting role of CAF and CAF mediators in
ICC, contrasting tumor-suppressive effects of aSMA+ CAF in
PDAC,may provide a stronger rationale for targeting CAF or their
mediators in ICC.
STAR+METHODS
Detailed methods are provided in the online version of this paper
and include the following:
d KEY RESOURCES TABLE
d RESOURCE AVAILABILITY
(D) Rep
(E) Rep
3–4). S
(F and G
in Has2
(H) Stor
ICC an
control
(I) YAP
(J) Rep
and qu
(K) Rep
(L) Rep
(M) Sur
(N) Rep
Data sh
ANOVA
B Lead contact
B Materials availability
B Data and code availability
resentative UMAPs of indicated genes in KRAS/p19 and YAP/AKT ICC.
resentative micrographs and quantifications of HA IHC and Has2mRNA in live
cale bars, 1 cm.
) Representative images of CK19 IHC, livers, LBR, and CK19+ area fromKRASf/f and Has2DHSC mice. Scale bars, 1 cm.
agemodulus G0 (a measure of elasticity) and loss modulus G00 (a measure of vis
d control liver (n = 2) by shear rheometry. Curves are mean ± SEM. Using two-w
(black) or versus Has2DHSC (red).
and TAZ western blot and quantifications normalized to GAPDH in Has2f/f an
resentative Ki67 IHC fromKRAS/p19 (n = 16–20mice/group) and YAP/AKT ICC
antification (n = 5/group) in Has2f/f and Has2DHSC mice. Scale bars, 100 mm.
resentative images of CK19 IHC, livers, LBR, and CK19+ area from Cd44f/f (n
resentative pictures and quantifications of HA IHC and HAS2 mRNA in huma
vival of CCA patients with low (n = 50) or high (n = 16) HA expression.
resentative UMAPs of HAS2 and CD44 in human ICC.
own asmean ± SEM (E–L). Significance determined by two-sided unpaired t te
followed by Sidak’s post hoc test (E, G, and J) or Kruskal-Wallis with Dunn’s
d EXPERIMENTAL MODEL AND SUBJECT DETAILS
B Human specimens
B Mice
B Cell lines
d METHOD DETAILS
B Liver fibrosis mouse models
B Plasmids and cholangiocarcinoma mouse models
B Generation of a cholangiocarcinoma cell line
B Cell culture
B HSC and CAF isolation
B Immune cell isolation and flow cytometry
B Rheometry
B Immunoblotting
B Enzyme-linked immunosorbant assay
B Immunohistochemistry and immunofluorescence
B RNAscope
B Fibrosis quantification
B RNA isolation and qPCR
B Bulk RNA sequencing
B Single cell RNA-sequencing
B Single cell RNA-sequencing analysis
B Global stellate cell and PF signatures
B CellPhoneDB analysis
B Clinical parameter analysis in human ICC
d QUANTIFICATION AND STATISTICAL ANALYSIS
SUPPLEMENTAL INFORMATION
Supplemental information can be found online at https://doi.org/10.1016/j.
ccell.2021.03.012.
ACKNOWLEDGMENTS
This work was supported by: NIH R01CA228483 (R.F.S., X.C.); R01CA190844
(R.F.S.); P30CA013696 (Columbia University Cancer Center); R01DK085252,
P01CA233452 (E.S.); R01CA190606 (X.C.); P30DK026743 (UCSF Liver Center);
5U54CA193417 (R.W.); R35CA197745. S10 OD012351, S10 OD021764 (A.C.);
R03DK101863 (J.M.C); P01CA87497, R35CA209896, R61NS109407 (B.R.S);
US Department of Defense grant CA150272P3 (J.M.L.); Swiss National Science
Foundation SNF310030_146940 (A.W., A.L.); Deutsche Forschungsgemein-
schaft FOR2314, SFB-TR209, Gottfried Wilhelm Leibniz Program, and ERC
‘CholangioConcept’ (L.Z.). S.A. was funded by an American Liver Foundation
Postdoctoral Research Fellowship Award, a Cholangiocarcinoma Foundation’s
Innovation Award, and a Research Scholar Award from the American
rs of KRAS/p19 ICC (n = 9–15), YAP/AKT ICC (n = 16), and control mice (n =
/p19 ICC (n = 16–20mice/group) and YAP/AKT ICC (n = 13–19mice/group)
cosity) in tumors fromHas2f/f andHas2DHSCmice (n = 4 each) in KRAS/p19
ay ANOVA, *p% 0.05, **p% 0.01, ****p% 0.0001, #0.05 < p% 0.10 versus
d Has2DHSC mice (NT n = 1, T n = 3 each).
(n = 13–19mice/group), and Ki67-CK19 co-staining, confocal microscopy,
= 9) and Cd44Dhep (n = 9) in KRAS/p19-induced ICC. Scale bars, 1 cm.
n ICC (n = 5) and matching non-tumor (n = 5). Scale bars, 100 mm.
st (J and K) orMann-Whitney test (F and G) (groups of two); and by one-way
post hoc test (F and G) (groups of three). See also Figure S6 and Table S6.
Cancer Cell 39, 1–17, June 14, 2021 13

A
B
E
G
I
L M
J K
H
F
C D
Figure 7. iCAF-derived HGF promotes ICC development and proliferation
(A) Number of ligand-receptor interactions between iCAF and other cells in ICC.
(B) Heatmap of genes differentially expressed in iCAF versus myCAF and mesCAF in KRAS/p19 and YAP/AKT ICC.
(C) Ligand-receptor pairs linking iCAF to other cells shown as log2 mean.
(legend continued on next page)
llArticle
14 Cancer Cell 39, 1–17, June 14, 2021
Please cite this article in press as: Affo et al., Promotion of cholangiocarcinoma growth by diverse cancer-associated fibroblast subpopulations, CancerCell (2021), https://doi.org/10.1016/j.ccell.2021.03.012
llArticle
Please cite this article in press as: Affo et al., Promotion of cholangiocarcinoma growth by diverse cancer-associated fibroblast subpopulations, CancerCell (2021), https://doi.org/10.1016/j.ccell.2021.03.012
Gastroenterological Association; S.B. by Deutsche Forschungemeinschaft
grant GZ:BH 155/1-1; A.F. by Recherche Medicale’s postdoctoral fellowship
SPE20170336778 and an American Liver Foundation’s Postdoctoral Research
Award.We thank Drs. Liang Zhao and Ellen Pure (University of Pennsylvania) for
CD44 floxed mice; Susanne Dettwiler, Fabiola Prutek, Andre Fitsche, Christine
Mittmann, and Marcel Glonkler (University of Z€urich) for TMA sections and IHC;
Dr. Gregory Gores (Mayo Clinic, Rochester, MN) for CCA cell lines; and Drs.
Timothy Wang and Kenneth Olive (Columbia University) for critical reading.
AUTHOR CONTRIBUTIONS
Conceptualization, R.F.S. and S.A.; Methodology, R.F.S., S.A., X.C., R.G.W.,
A.N., F.B., and D.S.; Experimentation, S.A., A.N., F.B., A.R., S.B., T.S., M. Mat-
suda., L.C., A.F., W.W., Y.S., J.W., D.Y., X.S., A.D., J.M.C., L.Z., H.E.R., A.L.L.,
and D.S.; Writing, R.F.S. and S.A.; Funding acquisition, R.F.S., X.C., and S.A.;
Resources, R.F.S., N.A., A.W., M.-O.R., M. Mack, B.R.S., J.G., G.K.M., L.Y.,
J.M.L., D.S., E.S., R.R., P.S., X.C., and A.C.; Supervision, R.F.S.
DECLARATION OF INTERESTS
A.C. is founder, equity holder, and consultant of DarwinHealth. Columbia Uni-
versity is an equity holder in DarwinHealth.
Received: July 30, 2020
Revised: January 26, 2021
Accepted: March 29, 2021
Published: April 29, 2021
REFERENCES
Affo, S., Yu, L.X., and Schwabe, R.F. (2017). The role of cancer-associated fi-
broblasts and fibrosis in liver cancer. Annu. Rev. Pathol. 12, 153–186.
Algul, H., Treiber, M., Lesina, M., Nakhai, H., Saur, D., Geisler, F., Pfeifer, A.,
Paxian, S., and Schmid, R.M. (2007). Pancreas-specific RelA/p65 truncation
increases susceptibility of acini to inflammation-associated cell death
following cerulein pancreatitis. J. Clin. Invest. 117, 1490–1501.
Aparicio, L., Bordyuh, M., Blumberg, A.J., and Rabadan, R. (2020). A random
matrix theory approach to Denoise single-cell data. Patterns (N Y) 1, 100035.
Banales, J.M., Marin, J.J.G., Lamarca, A., Rodrigues, P.M., Khan, S.A.,
Roberts, L.R., Cardinale, V., Carpino, G., Andersen, J.B., Braconi, C., et al.
(2020). Cholangiocarcinoma 2020: the next horizon in mechanisms and man-
agement. Nat. Rev. Gastroenterol. Hepatol. 17, 557–588.
Bankhead, P., Loughrey, M.B., Fernandez, J.A., Dombrowski, Y., McArt, D.G.,
Dunne, P.D., McQuaid, S., Gray, R.T., Murray, L.J., Coleman, H.G., et al.
(2017). QuPath: open source software for digital pathology image analysis.
Sci. Rep. 7, 16878.
Barbazan, J., and Matic Vignjevic, D. (2019). Cancer associated fibroblasts: is
the force the path to the dark side? Curr. Opin. Cell Biol. 56, 71–79.
Barbie, D.A., Tamayo, P., Boehm, J.S., Kim, S.Y., Moody, S.E., Dunn, I.F.,
Schinzel, A.C., Sandy, P., Meylan, E., Scholl, C., et al. (2009). Systematic
(D) Representative UMAPs of Hgf and Met in KRAS/p19 and YAP/AKT ICC.
(E and F) Representative images of CK19 IHC, livers, LBR, and CK19+ area from (E
each) in KRAS/p19 ICC. Scale bars, 1 cm.
(G) Cell counts of ICC cells lines after HGF or vehicle treatment (n = 5 each) for 4
(H) Representative Ki67 IHC in Hgff/f and HgfDHSC (n = 10–11) and c-Metf/f and c
scopy, and quantification (n = 5/group) in KRAS/p19-induced ICC. Scale bars, 1
(I) Phosphokinase array and western blot for phospho and total ERK1/2 and AKT
(J) Number of HuCCT-1 cells treated with HGF or vehicle for 48 h in the presenc
(K) Phospho-ERK1/2 IHC and quantifications in KRAS/p19 ICC from Hgf f/f and H
(L) Representative UMAPs of HGF and MET in human ICC.
(M) HGF-MET interactions linking iCAF to other populations in CellPhoneDB in o
Data shown as mean ± SEM (E–H, J, K). Significance determined by two-sided un
two), or ANOVA test followed by Sidak’s post hoc test (E, F, H, J) (groups of thre
RNA interference reveals that oncogenic KRAS-driven cancers require
TBK1. Nature 462, 108–112.
Biffi, G., and Tuveson, D.A. (2020). Diversity and biology of cancer-associated
fibroblasts. Physiol. Rev. 101, 147–176.
Blondel, V.D., Guillaume, J.-L., Lambiotte, R., and Lefebvre, E. (2008). Fast un-
folding of communities in large networks. J. Stat. Mech. Theor. Exp 6, 10008.
Buchtler, S., Grill, A., Hofmarksrichter, S., Stockert, P., Schiechl-Brachner, G.,
Rodriguez Gomez, M., Neumayer, S., Schmidbauer, K., Talke, Y.,
Klinkhammer, B.M., et al. (2018). Cellular origin and functional relevance of
collagen I production in the kidney. J. Am. Soc. Nephrol. 29, 1859–1873.
Catenacci, D.V., Junttila, M.R., Karrison, T., Bahary, N., Horiba, M.N., Nattam,
S.R., Marsh, R., Wallace, J., Kozloff, M., Rajdev, L., et al. (2015). Randomized
phase ib/II study of gemcitabine plus placebo or vismodegib, a hedgehog
pathway inhibitor, in patients with metastatic pancreatic cancer. J. Clin.
Oncol. 33, 4284–4292.
Caviglia, J.M., Yan, J., Jang, M.K., Gwak, G.Y., Affo, S., Yu, L., Olinga, P.,
Friedman, R.A., Chen, X., and Schwabe, R.F. (2018). MicroRNA-21 and
Dicer are dispensable for hepatic stellate cell activation and the development
of liver fibrosis. Hepatology 67, 2414–2429.
Chen, X., and Song, E. (2019). Turning foes to friends: targeting cancer-asso-
ciated fibroblasts. Nat. Rev. Drug Discov. 18, 99–115.
Chowdhury, S., Castro, S., Coker, C., Hinchliffe, T.E., Arpaia, N., and Danino,
T. (2019). Programmable bacteria induce durable tumor regression and sys-
temic antitumor immunity. Nat. Med. 25, 1057–1063.
Clements, O., Eliahoo, J., Kim, J.U., Taylor-Robinson, S.D., and Khan, S.A.
(2020). Risk factors for intrahepatic and extrahepatic cholangiocarcinoma: a
systematic review and meta-analysis. J. Hepatol. 72, 95–103.
Comoglio, P.M., Trusolino, L., and Boccaccio, C. (2018). Known and novel
roles of the MET oncogene in cancer: a coherent approach to targeted ther-
apy. Nat. Rev. Cancer 18, 341–358.
Costa, A., Kieffer, Y., Scholer-Dahirel, A., Pelon, F., Bourachot, B., Cardon, M.,
Sirven, P., Magagna, I., Fuhrmann, L., Bernard, C., et al. (2018). Fibroblast het-
erogeneity and immunosuppressive environment in human breast cancer.
Cancer Cell 33, 463–479.e10.
Cyphert, J.M., Trempus, C.S., and Garantziotis, S. (2015). Size matters: mo-
lecular weight specificity of hyaluronan effects in cell biology. Int. J. Cell
Biol. 2015, 563818.
Egeblad, M., Rasch, M.G., and Weaver, V.M. (2010). Dynamic interplay be-
tween the collagen scaffold and tumor evolution. Curr. Opin. Cell Biol. 22,
697–706.
Elyada, E., Bolisetty, M., Laise, P., Flynn, W.F., Courtois, E.T., Burkhart, R.A.,
Teinor, J.A., Belleau, P., Biffi, G., Lucito, M.S., et al. (2019). Cross-species sin-
gle-cell analysis of pancreatic ductal adenocarcinoma reveals antigen-pre-
senting cancer-associated fibroblasts. Cancer Discov. 9, 1102–1123.
Erez, N., Truitt, M., Olson, P., Arron, S.T., and Hanahan, D. (2010). Cancer-
associated fibroblasts are activated in incipient neoplasia to orchestrate tu-
mor-promoting inflammation in an NF-kappaB-dependent manner. Cancer
Cell 17, 135–147.
) Hgf f/f and Hgf DHSC liver (n = 10–11) and (F) c-Metf/f and c-MetDHep liver (n = 5
8 h.
-MetDHep livers (n = 5 each) mice and Ki67-CK19 co-staining, confocal micro-
00 mm.
in HGF-treated HuCCT-1 cells.
e of MEK1/2 inhibitor U0126 or vehicle.
gf DHSC mice (n = 10–11).
ne representative human ICC sample.
paired t test (E, F, G: CGKP19, K), Mann-Whitney test (G: HuCCT1) (groups of
e). See also Figure S7.
Cancer Cell 39, 1–17, June 14, 2021 15

llArticle
Please cite this article in press as: Affo et al., Promotion of cholangiocarcinoma growth by diverse cancer-associated fibroblast subpopulations, CancerCell (2021), https://doi.org/10.1016/j.ccell.2021.03.012
Fan, B., Malato, Y., Calvisi, D.F., Naqvi, S., Razumilava, N., Ribback, S., Gores,
G.J., Dombrowski, F., Evert, M., Chen, X., and Willenbring, H. (2012).
Cholangiocarcinomas can originate from hepatocytes in mice. J. Clin.
Invest. 122, 2911–2915.
Franzen, O., Gan, L.M., and Bjorkegren, J.L.M. (2019). PanglaoDB: a web
server for exploration of mouse and human single-cell RNA sequencing
data. Database 2019, https://doi.org/10.1093/database/baz046.
Friedman, S.L. (2008). Hepatic stellate cells: protean, multifunctional, and
enigmatic cells of the liver. Physiol. Rev. 88, 125–172.
Friedman, G., Levi-Galibov, O., David, E., Bornstein, C., Giladi, A., Dadiani, M.,
Mayo, A., Halperin, C., Pevsner-Fischer, M., Lavon, H., et al. (2020). Cancer-
associated fibroblast compositions change with breast cancer progression
linking the ratio of S100A4+ and PDPN+ CAFs to clinical outcome. Nat.
Cancer 1, 692–708.
Hanahan, D., and Coussens, L.M. (2012). Accessories to the crime: functions
of cells recruited to the tumor microenvironment. Cancer Cell 21, 309–322.
Hosein, A.N., Huang, H., Wang, Z., Parmar, K., Du, W., Huang, J., Maitra, A.,
Olson, E., Verma, U., and Brekken, R.A. (2019). Cellular heterogeneity during
mouse pancreatic ductal adenocarcinoma progression at single-cell resolu-
tion. JCI Insight 5, e129212.
Huh, C.G., Factor, V.M., Sanchez, A., Uchida, K., Conner, E.A., and
Thorgeirsson, S.S. (2004). Hepatocyte growth factor/c-met signaling pathway
is required for efficient liver regeneration and repair. Proc. Natl. Acad. Sci.
U S A 101, 4477–4482.
Ilicic, T., Kim, J.K., Kolodziejczyk, A.A., Bagger, F.O., McCarthy, D.J., Marioni,
J.C., and Teichmann, S.A. (2016). Classification of low quality cells from single-
cell RNA-seq data. Genome Biol. 17, 29.
Kalluri, R. (2016). The biology and function of fibroblasts in cancer. Nat. Rev.
Cancer 16, 582–598.
Kononen, J., Bubendorf, L., Kallioniemi, A., Barlund,M., Schraml, P., Leighton,
S., Torhorst, J., Mihatsch,M.J., Sauter, G., and Kallioniemi, O.P. (1998). Tissue
microarrays for high-throughput molecular profiling of tumor specimens. Nat.
Med. 4, 844–847.
Krempen, K., Grotkopp, D., Hall, K., Bache, A., Gillan, A., Rippe, R.A., Brenner,
D.A., and Breindl, M. (1999). Far upstream regulatory elements enhance posi-
tion-independent and uterus-specific expression of the murine alpha1(I)
collagen promoter in transgenic mice. Gene Expr. 8, 151–163.
Levental, K.R., Yu, H., Kass, L., Lakins, J.N., Egeblad, M., Erler, J.T., Fong,
S.F., Csiszar, K., Giaccia, A., Weninger, W., et al. (2009). Matrix crosslinking
forces tumor progression by enhancing integrin signaling. Cell 139, 891–906.
Liotta, L.A. (1986). Tumor invasion and metastases—role of the extracellular
matrix: Rhoads Memorial Award lecture. Cancer Res. 46, 1–7.
Lun, A.T., Bach, K., and Marioni, J.C. (2016). Pooling across cells to normalize
single-cell RNA sequencing data with many zero counts. Genome Biol. 17, 75.
Ma, L., Hernandez, M.O., Zhao, Y., Mehta, M., Tran, B., Kelly, M., Rae, Z.,
Hernandez, J.M., Davis, J.L., Martin, S.P., et al. (2019). Tumor cell biodiversity
drives microenvironmental reprogramming in liver cancer. Cancer Cell 36,
418–430.e16.
Marti, P., Stein, C., Blumer, T., Abraham, Y., Dill, M.T., Pikiolek, M., Orsini, V.,
Jurisic, G., Megel, P., Makowska, Z., et al. (2015). YAP promotes proliferation,
chemoresistance, and angiogenesis in human cholangiocarcinoma through
TEAD transcription factors. Hepatology 62, 1497–1510.
Matsumoto, K., Li, Y., Jakuba, C., Sugiyama, Y., Sayo, T., Okuno, M., Dealy,
C.N., Toole, B.P., Takeda, J., Yamaguchi, Y., and Kosher, R.A. (2009).
Conditional inactivation of Has2 reveals a crucial role for hyaluronan in skeletal
growth, patterning, chondrocyte maturation and joint formation in the devel-
oping limb. Development 136, 2825–2835.
McCarthy, J.B., El-Ashry, D., and Turley, E.A. (2018). Hyaluronan, cancer-
associated fibroblasts and the tumor microenvironment in malignant progres-
sion. Front. Cell Dev. Biol. 6, 48.
McInnes, L., and Healy, J. (2018). UMAP: uniform manifold approximation and
projection for dimension reduction. arXiv, 1802.03426 https://arxiv.org/abs/
1802.03426.
16 Cancer Cell 39, 1–17, June 14, 2021
Mederacke, I., Hsu, C.C., Troeger, J.S., Huebener, P., Mu, X., Dapito, D.H.,
Pradere, J.P., and Schwabe, R.F. (2013). Fate tracing reveals hepatic stellate
cells as dominant contributors to liver fibrosis independent of its aetiology.
Nat. Commun. 4, 2823.
Mederacke, I., Dapito, D.H., Affo, S., Uchinami, H., and Schwabe, R.F. (2015).
High-yield and high-purity isolation of hepatic stellate cells from normal and
fibrotic mouse livers. Nat. Protoc. 10, 305–315.
Mertens, J.C., Fingas, C.D., Christensen, J.D., Smoot, R.L., Bronk, S.F.,
Werneburg, N.W., Gustafson, M.P., Dietz, A.B., Roberts, L.R., Sirica, A.E.,
and Gores, G.J. (2013). Therapeutic effects of deleting cancer-associated fi-
broblasts in cholangiocarcinoma. Cancer Res. 73, 897–907.
Michalopoulos, G.K., and DeFrances, M.C. (1997). Liver regeneration. Science
276, 60–66.
Mu, X., Pradere, J.P., Affo, S., Dapito, D.H., Friedman, R., Lefkovitch, J.H., and
Schwabe, R.F. (2016). Epithelial transforming growth factor-beta signaling
does not contribute to liver fibrosis but protects mice from cholangiocarci-
noma. Gastroenterology 150, 720–733.
Northey, J.J., Przybyla, L., and Weaver, V.M. (2017). Tissue force programs
cell fate and tumor aggression. Cancer Discov. 7, 1224–1237.
Ohlund, D., Handly-Santana, A., Biffi, G., Elyada, E., Almeida, A.S., Ponz-
Sarvise, M., Corbo, V., Oni, T.E., Hearn, S.A., Lee, E.J., et al. (2017). Distinct
populations of inflammatory fibroblasts and myofibroblasts in pancreatic can-
cer. J. Exp. Med. 214, 579–596.
Ozdemir, B.C., Pentcheva-Hoang, T., Carstens, J.L., Zheng, X., Wu, C.C.,
Simpson, T.R., Laklai, H., Sugimoto, H., Kahlert, C., Novitskiy, S.V., et al.
(2014). Depletion of carcinoma-associated fibroblasts and fibrosis induces
immunosuppression and accelerates pancreas cancer with reduced survival.
Cancer Cell 25, 719–734.
Phaneuf, D., Moscioni, A.D., LeClair, C., Raper, S.E., and Wilson, J.M. (2004).
Generation of a mouse expressing a conditional knockout of the hepatocyte
growth factor gene: demonstration of impaired liver regeneration. DNA Cell
Biol. 23, 592–603.
Pradere, J.P., Kluwe, J., De Minicis, S., Jiao, J.J., Gwak, G.Y., Dapito, D.H.,
Jang, M.K., Guenther, N.D., Mederacke, I., Friedman, R., et al. (2013).
Hepatic macrophages but not dendritic cells contribute to liver fibrosis by pro-
moting the survival of activated hepatic stellate cells in mice. Hepatology 58,
1461–1473.
Provenzano, P.P., Cuevas, C., Chang, A.E., Goel, V.K., Von Hoff, D.D., and
Hingorani, S.R. (2012). Enzymatic targeting of the stroma ablates physical bar-
riers to treatment of pancreatic ductal adenocarcinoma. Cancer Cell 21,
418–429.
Ramanathan, R.K., McDonough, S.L., Philip, P.A., Hingorani, S.R., Lacy, J.,
Kortmansky, J.S., Thumar, J., Chiorean, E.G., Shields, A.F., Behl, D., et al.
(2019). Phase IB/II randomized study of FOLFIRINOX plus pegylated recombi-
nant human hyaluronidase versus FOLFIRINOX alone in patients with metasta-
tic pancreatic adenocarcinoma: swog S1313. J. Clin. Oncol. 37, 1062–1069.
Raudvere, U., Kolberg, L., Kuzmin, I., Arak, T., Adler, P., Peterson, H., and Vilo,
J. (2019). g:Profiler: a web server for functional enrichment analysis and con-
versions of gene lists (2019 update). Nucleic Acids Res. 47, W191–W198.
Reich, M., Liefeld, T., Gould, J., Lerner, J., Tamayo, P., and Mesirov, J.P.
(2006). GenePattern 2.0. Nat. Genet. 38, 500–501.
Reimand, J., Isserlin, R., Voisin, V., Kucera, M., Tannus-Lopes, C.,
Rostamianfar, A., Wadi, L., Meyer, M., Wong, J., Xu, C., et al. (2019).
Pathway enrichment analysis and visualization of omics data using
g:Profiler, GSEA, Cytoscape and EnrichmentMap. Nat. Protoc. 14, 482–517.
Rhim, A.D., Oberstein, P.E., Thomas, D.H., Mirek, E.T., Palermo, C.F., Sastra,
S.A., Dekleva, E.N., Saunders, T., Becerra, C.P., Tattersall, I.W., et al. (2014).
Stromal elements act to restrain, rather than support, pancreatic ductal adeno-
carcinoma. Cancer Cell 25, 735–747.
Riener, M.O., Vogetseder, A., Pestalozzi, B.C., Clavien, P.A., Probst-Hensch,
N., Kristiansen, G., and Jochum, W. (2010). Cell adhesion molecules P-cad-
herin and CD24 are markers for carcinoma and dysplasia in the biliary tract.
Hum. Pathol. 41, 1558–1565.

llArticle
Please cite this article in press as: Affo et al., Promotion of cholangiocarcinoma growth by diverse cancer-associated fibroblast subpopulations, CancerCell (2021), https://doi.org/10.1016/j.ccell.2021.03.012
Rizvi, S., Fischbach, S.R., Bronk, S.F., Hirsova, P., Krishnan, A.,
Dhanasekaran, R., Smadbeck, J.B., Smoot, R.L., Vasmatzis, G., and Gores,
G.J. (2018a). YAP-associated chromosomal instability and cholangiocarci-
noma in mice. Oncotarget 9, 5892–5905.
Rizvi, S., Khan, S.A., Hallemeier, C.L., Kelley, R.K., and Gores, G.J. (2018b).
Cholangiocarcinoma - evolving concepts and therapeutic strategies. Nat.
Rev. Clin. Oncol. 15, 95–111.
Rousseeuw, P.J. (1987). Silhouettes: a graphical aid to the interpretation and
validation of cluster analysis. J. Comput. Appl. Math. 20, 53–65.
Sahai, E., Astsaturov, I., Cukierman, E., DeNardo, D.G., Egeblad, M., Evans,
R.M., Fearon, D., Greten, F.R., Hingorani, S.R., Hunter, T., et al. (2020). A
framework for advancing our understanding of cancer-associated fibroblasts.
Nat. Rev. Cancer 20, 174–186.
Seehawer, M., Heinzmann, F., D’Artista, L., Harbig, J., Roux, P.F., Hoenicke,
L., Dang, H., Klotz, S., Robinson, L., Dore, G., et al. (2018). Necroptosis micro-
environment directs lineage commitment in liver cancer. Nature 562, 69–75.
Senoo, H., Mezaki, Y., and Fujiwara,M. (2017). The stellate cell system (vitamin
A-storing cell system). Anat. Sci. Int. 92, 387–455.
Sia, D., Hoshida, Y., Villanueva, A., Roayaie, S., Ferrer, J., Tabak, B., Peix, J.,
Sole, M., Tovar, V., Alsinet, C., et al. (2013). Integrative molecular analysis of
intrahepatic cholangiocarcinoma reveals 2 classes that have different out-
comes. Gastroenterology 144, 829–840.
Sirica, A.E. (2011). The role of cancer-associated myofibroblasts in intrahe-
patic cholangiocarcinoma. Nat. Rev. Gastroenterol. Hepatol. 9, 44–54.
Stuart, T., Butler, A., Hoffman, P., Hafemeister, C., Papalexi, E., Mauck, W.M.,
3rd, Hao, Y., Stoeckius, M., Smibert, P., and Satija, R. (2019). Comprehensive
integration of single-cell data. Cell 177, 1888–1902.e21.
Su, S., Chen, J., Yao, H., Liu, J., Yu, S., Lao, L., Wang, M., Luo, M., Xing, Y.,
Chen, F., et al. (2018). CD10(+)GPR77(+) cancer-associated fibroblasts pro-
mote cancer formation and chemoresistance by sustaining cancer stemness.
Cell 172, 841–856.e16.
Tian, X., Azpurua, J., Hine, C., Vaidya, A., Myakishev-Rempel, M., Ablaeva, J.,
Mao, Z., Nevo, E., Gorbunova, V., and Seluanov, A. (2013). High-molecular-
mass hyaluronan mediates the cancer resistance of the naked mole rat.
Nature 499, 346–349.
Toole, B.P. (2004). Hyaluronan: from extracellular glue to pericellular cue. Nat.
Rev. Cancer 4, 528–539.
Vento-Tormo, R., Efremova, M., Botting, R.A., Turco, M.Y., Vento-Tormo, M.,
Meyer, K.B., Park, J.E., Stephenson, E., Polanski, K., Goncalves, A., et al.
(2018). Single-cell reconstruction of the early maternal-fetal interface in hu-
mans. Nature 563, 347–353.
Wang, J., Dong, M., Xu, Z., Song, X., Zhang, S., Qiao, Y., Che, L., Gordan, J.,
Hu, K., Liu, Y., et al. (2018). Notch2 controls hepatocyte-derived cholangiocar-
cinoma formation in mice. Oncogene 37, 3229–3242.
Wang, J., Wang, H., Peters, M., Ding, N., Ribback, S., Utpatel, K., Cigliano, A.,
Dombrowski, F., Xu, M., Chen, X., et al. (2019). Loss of Fbxw7 synergizes with
activated Akt signaling to promote c-Myc dependent cholangiocarcinogene-
sis. J. Hepatol. 71, 742–752.
Yang, Y.M., Noureddin, M., Liu, C., Ohashi, K., Kim, S.Y., Ramnath, D., Powell,
E.E., Sweet, M.J., Roh, Y.S., Hsin, I.F., et al. (2019). Hyaluronan synthase
2-mediated hyaluronan production mediates Notch1 activation and liver
fibrosis. Sci. Transl. Med. 11, eaat9284.
Zhang, M., Yang, H., Wan, L., Wang, Z., Wang, H., Ge, C., Liu, Y., Hao, Y.,
Zhang, D., Shi, G., et al. (2020). Single cell transcriptomic architecture and
intercellular crosstalk of human intrahepatic cholangiocarcinoma. J. Hepatol.
73, 1118–1130.
Cancer Cell 39, 1–17, June 14, 2021 17

llArticle
Please cite this article in press as: Affo et al., Promotion of cholangiocarcinoma growth by diverse cancer-associated fibroblast subpopulations, CancerCell (2021), https://doi.org/10.1016/j.ccell.2021.03.012
STAR+METHODS
KEY RESOURCES TABLE
REAGENT or RESOURCE SOURCE IDENTIFIER
Antibodies
Rabbit Monoclonal anti-Phospho-p44/42 MAPK
(Erk1/2) (Thr202/Tyr204) XP�Cell Signaling Cat# 4370; RRID: AB_2315112
Rabbit Monoclonal anti-p44/42 MAPK (Erk1/2) (137F5) Cell Signaling Cat# 4695; RRID: AB_390779
Rabbit Monoclonal anti-Phospho-Akt (Ser473) (D9E) XP� Cell Signaling Cat# 4060; RRID: AB_2315049
Rabbit polyclonal anti-Akt Cell Signaling Cat# 9272; RRID: AB_329827
Rabbit Monoclonal anti-YAP/TAZ (D24E4) Cell Signaling Cat# 8418; RRID: AB_10950494
Rabbit Monoclonal anti-DDR1 (D1G6) XP� Cell Signaling Cat# 5583; RRID: AB_10694842
Goat anti-rabbit IgG-HRP Santa Cruz Cat# sc-2004; RRID: AB_631746
Mouse Monoclonal anti-GAPDH-Peroxidase Sigma Cat# G9295; RRID: AB_1078992
Rabbit monoclonal anti-Cytokeratin 19 Abcam Cat# ab133496;
RRID: AB_11155282
Rabbit Polyclonal anti-Cytokeratin 7 Thermo Fisher Scientific Cat# 15539-1-AP;
RRID: AB_2249769
Rabbit Monoclonal Recombinant Anti-Ki67 antibody [SP6] Abcam Cat#ab16667;
RRID: AB_302459
Rat Monoclonal anti-Ki-67 (SolA15), eBioscience� Thermo Fisher Scientific Cat#14569880;
RRID: AB_10853185
Rabbit Polyclonal anti-Cleaved Caspase-3 (Asp175) Cell Signaling Cat# 9661;
RRID: AB_2341188
Rabbit monoclonal anti-CD3 [SP7] Abcam Cat# ab16669;
RRID: AB_443425
Mouse Monoclonal Anti-Actin, a-Smooth Muscle - FITC Sigma Cat# F3777; RRID: AB_476977
Mouse Monoclonal Anti-Smooth muscle actin (clone BS66) Nordic Biosite Cat: # BSH-7459
Rabbit Polyclonal anti-RGS5 Abcam Cat# ab196799
Goat Polyclonal anti-SerpinF1/PEDF R&D Cat# AF1177;
RRID:AB_2187173
Donkey Polyclonal anti-rabbit Alexa Fluor 488 Life Technologies Cat# A21206; RRID: AB_2535792
Donkey Polyclonal anti-mouse Alexa Fluor 488 Life Technologies Cat# A21202; RRID: AB_141607
Streptavidin, Alexa Fluor 594 Life Technologies Cat: # S11227
Streptavidin, Alexa Fluor 647 Life Technologies Cat# S21374; RRID: AB_2336066
Rat Monoclonal BUV395 Rat Anti-Mouse CD45
Clone 30-F11
BD Biosciences Cat# 564279; RRID: AB_2651134
Rat Monoclonal BUV496 Anti-Mouse CD45R/B220
(clone RA3-6B2)
BD Biosciences Cat# 564662; RRID:
AB_2722578
Armenian Hamster Monoclonal BUV737 Anti-Mouse
CD11c (clone HL3)
BD Biosciences Cat# 564986; RRID:
AB_2739034
Rat Monoclonal Brilliant Violet 510� anti-mouse/human
CD11b Antibody (clone M1/70)
BioLegend Cat# 101263; RRID: AB_2629529
Armenian Hamster Monoclonal Brilliant Violet 711�anti-mouse CD103 (clone 2B8)
BioLegend Cat# 121435; RRID:
AB_2686970
Rat Monoclonal PerCP-Cyanine5.5 Anti-Mouse
CD19 (clone 1D3)
Tonbo biosciences Cat# 65-0193; RRID: AB_2621887
Rat Monoclonal violetFluor� 450 Anti-Mouse MHC
Class II (I-A/I-E) (clone M5/114.15.2)
Tonbo biosciences Cat# 75-5321; RRID: AB_2621965
Mouse Monoclonal PE/Cyanine7 anti-mouse CD64
(FcgRI) (clone X54-5/7.1)
BioLegend Cat# 139314; RRID: AB_2563904
(Continued on next page)
e1 Cancer Cell 39, 1–17.e1–e11, June 14, 2021

Continued
REAGENT or RESOURCE SOURCE IDENTIFIER
Rat Monoclonal APC Anti-Mouse F4/80 Antigen
(clone BM8.1)
Tonbo biosciences Cat# 20-4801; RRID: AB_2621602
Ghost Dye� Red 780 Tonbo biosciences Cat# 13-0865
Mouse Monoclonal BUV395 Anti-Mouse NK-1.1
Clone PK136
BD Biosciences Cat# 564144; RRID: AB_2738618
Mouse Monoclonal BUV496 Anti-Human CD3
Clone UCHT1
BD Biosciences Cat# 564809; RRID: AB_2744388
Rat Monoclonal BUV737 Anti-Mouse CD4,
clone RM4-5
BD Biosciences Cat# 564933; RRID: AB_2732918
Rat Monoclonal anti-FOXP3 (FJK-16s),
eFluor 450, eBioscience�ThermoFisher Scientific Cat# 48-5773-80; RRID: AB_1518813
Mouse Monoclonal Brilliant Violet 510�anti-human CD45, clone HI30
BioLegend Cat# 304036; RRID: AB_2561940
Armenian Hamster Monoclonal BV711
Anti-Mouse TCR b Chain, clone H57-597
BD Biosciences Cat# 563135; RRID: AB_2738023
Armenian Hamster Monoclonal BV786
Anti-Mouse CD69, clone H1.2F3
BD Biosciences Cat# 564683; RRID: AB_2738890
Rat Monoclonal PerCP-Cyanine5.5
anti-Mouse CD19, clone 1D3
Tonbo biosciences Cat# 65-0193; RRID: AB_2621887
Rat Monoclonal APC anti-Mouse CD8a
(53-6.7), clone 53-6.7
Tonbo biosciences Cat# 20-0081; RRID: AB_2621550
Rat Monoclonal anti-Mouse CD44, Alexa
Fluor�488, clone KM81
Cedarlane Cat# CL8944AF4
Rat IgG2a Isotype Control ThermoFisher Scientific Cat# 02-9688; RRID: AB_2532970
Bacterial and virus strains
AAV.TBG.PI.Cre.rBG (AAV8) Addgene Cat: Addgene# 107787-AAV8
pAAV.TBG.PI.Null.bGH (AAV8) Addgene Cat: Addgene# 105536-AAV8
Biological samples
Human hilar cholangiocarcinoma Columbia University,
New York, NY
IRB- AAAN7562
Human intrahepatic cholangiocarcinoma
tissue for RNA and IHC
Columbia University,
New York, NY
IRB- AAAN2452-M01Y06
Human tissue microarrays University Hospital
Zurich, CH
Ethic committee: PB_2018_00252
Chemicals, peptides, and recombinant proteins
Recombinant Mouse HGF Protein R&D Cat# 2207-HG
Recombinant Human HGF Protein R&D Cat# 294-HG
Recombinant Human Aggrecan aa20-675/His, biotin R&D CUSTOM-Protein
U-0126 ERK-inhibitor Cayman Chemical Cat# 70970
Hyaluronidase from bovine testes Type IV-S Millipore Sigma Cat# H4272
Hyaluronan (High MW) R&D Cat# GLR002
Hyaluronan (Medium MW) R&D Cat# GLR004
Hyaluronan (Low MW) R&D Cat# GLR001
Hyaluronic acid sodium salt from rooster comb Millipore Sigma Cat# H5388
HEALON� PRO OVD Johnson and Johnson vision
Hyaluronic acid potassium salt - from Cockscomb Carbosynth Cat# 31799-91-4
DMEM - Dulbecco’s Modified Eagle Medium ThermoFisher Scientific Cat# 11965118
DMEM, high glucose, HEPES, no phenol red ThermoFisher Scientific Cat# 21063029
Foundation Fetal Bovine Serum GeminiBio Cat# 900-108
Trypsin-EDTA (0.25%), phenol red ThermoFisher Scientific Cat# 25200056
Gentamicin ThermoFisher Scientific Cat# 15710072
(Continued on next page)
llArticle
Cancer Cell 39, 1–17.e1–e11, June 14, 2021 e2
Please cite this article in press as: Affo et al., Promotion of cholangiocarcinoma growth by diverse cancer-associated fibroblast subpopulations, CancerCell (2021), https://doi.org/10.1016/j.ccell.2021.03.012

Continued
REAGENT or RESOURCE SOURCE IDENTIFIER
Penicillin-Streptomycin-Glutamine ThermoFisher Scientific Cat# 10378016
Protease from Streptomyces griseus Type XIV Millipore Sigma Cat# P5147-5G
Collagenase D from Clostridium histolyticum Millipore Sigma Cat# 11088882001
DNase I grade II, from bovine pancreas Millipore Sigma Cat: #10104159001
Gey’s Balanced Salt Solution Millipore Sigma Cat# G9779
Percoll pH 8.5-9.5 Millipore Sigma Cat# P4937
Collagenase A from Clostridium histolyticum Millipore Sigma Cat# 10103578001
RPMI 1640 ThermoFisher Scientific Cat# 11835030
Nycodenz Cosmobio Cat# 1002424
PhosSTOP Millipore Sigma Cat# 4906845001
cOmplete�, Mini Protease Inhibitor Cocktail Millipore Sigma Cat# 11836153001
Amersham� Protran� Western blotting
membranes, nitrocellulose
Millipore Sigma Cat# GE10600006
Restore� Western Blot Stripping Buffer ThermoFisher Scientific Cat# 21059
RIPA buffer Fisher Scientific Cat# R3792
QuantaBlu� Fluorogenic Peroxidase Substrate Kit ThermoFisher Scientific Cat# 15169
TRIzol� Reagent ThermoFisher Scientific Cat# 15596018
Ganciclovir Invivogen Cat# sud-gcv
Diphtheria Toxin from Corynebacterium diphtheriae Millipore Sigma Cat# D0564
Poly (I:C) GE Healthcare Cat# 27473201
SoftSubstrates plates, rigidity 2kPa, 16kPa, 64kPa SoftSubstrates, MuWells Cat# 2kPa-6W; # 16kPa-6W;
# 64kPa-6W
High binding BINDING 96 WELL PLATES, STERILE Greiner BIO-ONE Cat# 655077
Opal 520 Reagent Perkin Elmer Cat# FP1487001KT
Opal 690 Reagent Perkin Elmer Cat# FP1488001KT
Critical commercial assays
Proteome Profiler Human Phospho-Kinase Array Kit R&D Cat# ARY003B
RNeasy Micro Kit Qiagen Cat# 74004
Hyaluronan ELISA Duo set R&D Cat# DY3614
Mouse HGF DuoSet ELISA R&D Cat# DY2207
SuperSignal� West Femto Maximum
Sensitivity Substrate
ThermoFisher Scientific Cat# 32106
Vectastatin Elite ABC-HRP kit Vector Laboratories Cat# PK-6100;
RRID: AB_2336819
DAB Peroxidase (HRP) Substrate Kit
(with Nickel), 3,3’-diaminobenzidine
Vector Laboratories Cat# SK-4100;
RRID: AB_2336382
BrdU Cell Proliferation Kit Millipore Sigma Cat# 2752
Quant-iT PicoGreen dsDNA Assay Kit ThermoFisher Scientific Cat# P11496
Multi Tissue Dissociation Kit 1 Miltenyi Biotec Cat# 130-110-201
Chromium Single Cell 3’ Reagent Kits v2 10x Genomics Cat# PN-120237
Chromium Single Cell 3’ Reagent Kits v3 10x Genomics Cat# PN-1000268
RNAscope� Multiplex Fluorescent Reagent Kit v2 Advanced Cell Diagnostic Cat# 323100
Deposited data
Bulk RNA-seq data This paper GEO: GSE154170
scRNA-seq data This paper GEO: GSE154170
Mendeley data This paper https://doi.org/10.17632/3982j75df7.1
Human intrahepatic cholangiocarcinoma Zhang et al., 2020
PMID: 32505533
GEO: GSE142784
Human intrahepatic cholangiocarcinoma Ma et al., 2019.
PMID: 31588021
GEO: GSE125449
(Continued on next page)
llArticle
e3 Cancer Cell 39, 1–17.e1–e11, June 14, 2021
Please cite this article in press as: Affo et al., Promotion of cholangiocarcinoma growth by diverse cancer-associated fibroblast subpopulations, CancerCell (2021), https://doi.org/10.1016/j.ccell.2021.03.012

Continued
REAGENT or RESOURCE SOURCE IDENTIFIER
Human intrahepatic cholangiocarcinoma
microarray
Sia et al., 2013.
PMID: 23295441
GEO: GSE32225
Mouse model of pancreatic ductal
adenocarcinoma
Hosein et al., 2019.
PMID: 31335328
GEO: GSE125588
Experimental models: cell lines
Human: HuCCT-1 From Dr. Gregory Gores RRID: CVCL_0324
Human: MzChA-1 From Dr. Gregory Gores RRID: CVCL_6932
Mouse: SB1 From Dr. Gregory Gores Rizvi et al., 2018a.
PMID: 29464042
Mouse: CGKP19 This paper N/A
Experimental models: organisms/strains
Mouse: C57BL/6J, TdTomato Ai14 reporter Jackson Laboratory Cat# JAX:007914; RRID: IMSR_JAX:007914
Mouse: Rosa26-iDTR (iDTR) Jackson Laboratory Cat# JAX:007900; RRID: IMSR_JAX:007900
Mouse: Mx1-Cre Jackson Laboratory Cat# JAX:003556; RRID: IMSR_JAX:003556
Mouse: Rag2 KO Jackson Laboratory
Cat# JAX:008449; RRID: IMSR_JAX:008449
Mouse: Ddr1tm1a Infrafrontier/EMMA Cat# EM:09692; RRID: IMSR_EM:09692
Mouse: Col1a1-GFP reporter From Dr. David Brenner MGI: 4458034
Mouse: Lrat-Cre Mederacke et al., 2013.
PMID: 24264436
N/A
Mouse: aSMA-TK From Dr. Raghu Kalluri
Cat# JAX:031155; RRID: IMSR_JAX:031155
Mouse: Col1a1 fl/fl From Dr. Matthias Mack;
Buchtler et al., 2018. PMID:
29777019
N/A
Mouse: Hgf fl/fl From Dr. GK. Michalopoulos;
Phaneuf et al., 2004. PMID:
15383179
N/A
Mouse: Lrat-Cre Has2 fl/fl From Dr. Ekihiro Seki,
Yang et al., 2019. PMID:
31189722
N/A
Mouse: aSMA-HAS2Tg From Dr. Ekihiro Seki,
Yang et al., 2019. PMID:
31189722
N/A
Mouse: Met fl/fl From Dr. GK. Michalopoulos;
Huh et al., 2004. PMID:
15070743
N/A
Mouse: Cd44 fl/fl From Dr. Ellen Pure N/A
Mouse: RelA fl/fl From Dr. Roland M. Schmid;
Algul et al., 2007.PMID:
17525802
N/A
Oligonucleotides
RNAscope� Probe - Mm-Has2-C2 Advanced Cell Diagnostic Cat# 465171-C2
RNAscope� Probe - Mm-Hgf-C3 Advanced Cell Diagnostic Cat# 315631-C3
Recombinant DNA
pCaggs- KRASG12D (human) Laboratory of Dr. Lars Zender N/A
SB13 Laboratory of Dr. Lars Zender N/A
CRISPR/Cas9 sg-p19 (pX330-sg-p19) Laboratory of Dr. Lars Zender N/A
pT3-EF1a-HA-myr-Akt (mouse) Laboratory of Dr. Xin Chen RRID: Addgene_31789
pT3-EF1a-YAPS127A (human) Laboratory of Dr. Xin Chen RRID: Addgene_86497
(Continued on next page)
llArticle
Cancer Cell 39, 1–17.e1–e11, June 14, 2021 e4
Please cite this article in press as: Affo et al., Promotion of cholangiocarcinoma growth by diverse cancer-associated fibroblast subpopulations, CancerCell (2021), https://doi.org/10.1016/j.ccell.2021.03.012
Continued
REAGENT or RESOURCE SOURCE IDENTIFIER
pT3-EF1a-HA-FBXW7DF (human) Laboratory of Dr. Xin Chen;
Wang et al., 2019. PMID:
31195063
N/A
pT3-EF1a-NICD1 (mouse) Laboratory of Dr. Xin Chen RRID: Addgene_46047
pT3-CK19-GFP Laboratory of Dr. Xin Chen;
this paper
N/A
Software and algorithms
Cell Ranger version v3.1.0 10x Genomics https://support.10xgenomics.com/
single-cell-gene-expression/software/
downloads/latest
Scanpy v1.4.6 Fabian J. Theis lab, Genome
Biology 2018
https://scanpy.readthedocs.io/
en/stable
PanglaoDB Franzen et al., 2019, baz046 https://www.panglaodb.se
g:Profiler (version e99_eg46_p14_f929183) Raudvere et al., 2019 https://biit.cs.ut.ee/gprofiler/gost
CellPhoneDB v.2.0.0 Vento-Tormo et al., 2018.
PMID: 30429548
https://www.cellphonedb.org
R v3.5.0 The R Project for Statistical
Computing
https://www.r-project.org
Python v3.7.4 Python Software Foundation https://www.python.org
IBM SPSS version 24 IBM http://www.ibm.com
GraphPad Prism v.8.0 GraphPad Software https://www.graphpad.com
Fiji ImageJ v2.0.0-rc-69/1.52p Image J https://imagej.net/Fiji
FlowJo (v10.6.2) N/A www.flowjo.com
BioRender ªBioRender biorender.com
QuPath v.0.1.3 Queen’s University, Belfast,
Northern Ireland
https://qupath.github.io
LEICA Digital Image Hub 4.0 image server Leica N/A
Other
gentleMACS Octo Dissociator Miltenyi Biotec Cat# 130-095-937
NovaSeq 6000 Sequencing System Illumina N/A
Nano-Zoomer Digital Pathology scanner Hamamatsu, Japan N/A
Slide scanner Leica Cat# SCN400
Bioanalyzer 2100 Agilent Technologies Model G2939B
llArticle
Please cite this article in press as: Affo et al., Promotion of cholangiocarcinoma growth by diverse cancer-associated fibroblast subpopulations, CancerCell (2021), https://doi.org/10.1016/j.ccell.2021.03.012
RESOURCE AVAILABILITY
Lead contactFurther information and requests for resources and reagents used in this study should be directed to the lead contact and corre-
sponding author, Robert F. Schwabe ([email protected]).
Materials availabilityThematerials used in this study are listed in the Key resources table. Materials generated in our laboratory are available upon request.
Data and code availabilityThe RNA-seq and sc-RNA-seq data reported in this study have been deposited in the Gene Expression Omnibus database (GEO)
under the accession number GEO: GSE154170. Original data have been deposited to Mendeley Data: https://doi.org/10.17632/
3982j75df7.1. A previously published cohort of clinically annotated intrahepatic cholangiocarcinoma (Sia et al., 2013) of 119 patients
(GEO: GSE32225) was used to determine the association between panCAF andmyCAF gene expression signatures and survival and
other clinical parameters. The human ICC sc-RNA-seq data analysis were based on the Zhang et al., 2020, GEO: GSE142784 and the
Ma et al., 2019, GEO: GSE125449. To identify the ontogeny of CAF in PDAC, we analyzed scRNA-seq data fromKPC-inducedmouse
PDAC, using the Hosein et al., 2019, GEO: GSE125588.
e5 Cancer Cell 39, 1–17.e1–e11, June 14, 2021

llArticle
Please cite this article in press as: Affo et al., Promotion of cholangiocarcinoma growth by diverse cancer-associated fibroblast subpopulations, CancerCell (2021), https://doi.org/10.1016/j.ccell.2021.03.012
EXPERIMENTAL MODEL AND SUBJECT DETAILS
Human specimensFresh surgical tissue for single cell RNA-sequencingwas obtained from a hilar, mainly extrahepatic cholangiocarcinomawith invasion
of liver, gallbladder and periductal tissue cholangiocarcinoma patient (n=1) undergoing surgical resection at Columbia University
Irving Medical Center. Written informed consent was obtained from the patient at study entry and the study was approved by
Columbia University Medical Center Institutional Review Board (IRB) (protocol number: IRB- AAAN7562). Frozen tissues and paraffin
slides from paired tumor and non-tumor intrahepatic cholangiocarcinoma cases were used to extract RNA and perform IHC, respec-
tively. Written informed consent was obtained from each patient at the time of recruitment and samples were collected under the
supervision of the Columbia University Medical Center Institutional Review Board (Protocol Number: IRB- AAAN2452-M01Y06).
Patient records were anonymized and de-identified. Studies were conducted in accordance with National Institutes of Health and
institutional guidelines for human subject research. Two tissue microarrays (TMA) were constructed from formalin-fixed and
paraffin-embedded tumor tissues of 19 intrahepatic cholangiocarcinoma (ICC), 59 extrahepatic cholangiocarcinoma (ECC), 39
gallbladder carcinoma (GBC) and 20 normal liver tissues at Department of Pathology and Molecular Pathology, University Hospital
Zurich as previously described (Kononen et al., 1998; Riener et al., 2010). GBC samples were not analyzed in the current study.
Clinicopathological features have been previously described (Riener et al., 2010) and the study was approved by the local ethics
committee (PB_2018_00252).
MiceAll animal care and experimental procedures were performed in accordance with the ‘‘Guide for the Care and Use of Laboratory
Animals’’ of the National Institutes of Health and were approved by Columbia University Institutional Animal Care and Use Commit-
tee. Male mice, aged 6-8 weeks old (unless otherwise specified) were used for the experiments. All mice were housed in a specific
pathogen-free facility, in microisolators in ventilated racks, and fed a regular chow diet. C57BL/6J, TdTomato Ai14 reporter (lox-stop-
lox) (TdTom), Rosa26-iDTR (lox-stop-lox-Hbegf Cre-inducible diphtheria toxin receptor) transgenic mice (iDTR), Rag2 KO andMx1-
Cre mice were obtained from the Jackson Laboratory. Ddr1tm1a mice were obtained from Infrafrontier. Col1a1-GFP reporter mice
(Krempen et al., 1999) and Lrat-Cre mice (Mederacke et al., 2013) were previously described and at least five time backcrossed
to C57Bl/6. For HSC-selective deletion of Col1a1, Hgf, Has2 and RelA, Lrat-Cre mice were crossed with mice carrying floxed alleles
of Col1a1 (Buchtler et al., 2018), Hgf (Phaneuf et al., 2004), Has2 (Matsumoto et al., 2009) and RelA (Algul et al., 2007). For genetic
HSC depletion, Lrat-Cre+ iDTR+ TdTom or LratCre+ iDTR- TdTom controls were injected with diphtheria toxin (Sigma, i.p. 0.5 mg/kg)
as indicated. For depletion of a-SMA+ CAF, mice expressing aSMA-driven thymidine kinase (aSMA-TK) (Ozdemir et al., 2014), kindly
provided by Raghu Kalluri and at least five time backcrossed to C57Bl/6, were injected with ganciclovir (InvivoGen,10 mg/kg) as indi-
cated. For HAS2 overexpression in a-SMA+HSC, aSMA-HAS2Tgmice (Yang et al., 2019) were used.Mx1-Cre activation for the dele-
tion of Col1a1 was induced by 3 i.p. injections of poly(I:C) (10mg/kg; GE Healthcare), given every other day before or after tumor in-
duction, as specified in the figure legend. To generate mice with Ddr1 conditional potential, Ddr1tm1a mice were bred with mice
expressing Ella-driven flippase. For deletion of Ddr1, Met (Huh et al., 2004), and Cd44 (kindly provided by Pure E.), four week old
mice were infected with an AAV8-TBG-Cre (131011 genome copies i.v.) as described (Mu et al., 2016).
Cell linesHuman intrahepatic cholangiocarcinoma cell line HuCCT-1, cholangiocarcinoma cell line MzChA-1, and mouse SB1 intrahepatic
cholangiocarcinoma cell line (Rizvi et al., 2018a) were a kind gift from Dr. Gregory Gores. Cells, including the CGKP19 cell line
that we generated and described in method details , were cultured in DMEM with 10% FBS and antibiotics.
METHOD DETAILS
Liver fibrosis mouse modelsBiliary liver fibrosis was induced in eight-weeks-old mice subjected to ligation of the common bile duct (BDL) as previously described
(Pradere et al., 2013). Mice were euthanized 14 days after the surgery. As a second model of well-established cholestatic liver
fibrosis, mice were treated with diet containing 0.1% 3,5-diethoxycarbonyl-1,4-dihydrocollidine (DDC) for three weeks (Caviglia
et al., 2018).
Plasmids and cholangiocarcinoma mouse modelsSleeping beauty transposase SB13, pCaggs-KRASG12D (human) transposon plasmid and CRISPR/Cas9 sg-p19 (pX330-sg-p19)
were provided by L. Zender, University of T€ubingen, Germany. pT3-EF1a-HA-myr-Akt (mouse), pT3-EF1a-YAPS127A (human),
pT3-EF1a-HA-FBXW7DF (human), pT3-EF1a-NICD1 (mouse) were previously described (Fan et al., 2012; Wang et al., 2018,
2019). A tumor-selective GFP reporter plasmid was constructed using the CK19 promoter to drive GFP expression (pT3-CK19-
GFP). The NICD1/AKT, YAP/AKT and FBXW7DF/AKT ICC models have been previously described (Wang et al., 2018, 2019). For in-
duction of ICC, plasmids were injected into six to seven weeks old mice by hydrodynamic tail vein injection (HDTV) at 20 mg:5 mg ratio
of transposon to transposase-encoding plasmid (YAP/AKT, NICD/AKT and FBXW7DF/AKTmodels) or 25 mg:5 mg ratio of transposon
to transposase-encoding plasmid and 10mg CRISPR/Cas9 sgRNA-p19 plasmid (KRAS/p19 model).
Cancer Cell 39, 1–17.e1–e11, June 14, 2021 e6

llArticle
Please cite this article in press as: Affo et al., Promotion of cholangiocarcinoma growth by diverse cancer-associated fibroblast subpopulations, CancerCell (2021), https://doi.org/10.1016/j.ccell.2021.03.012
Generation of a cholangiocarcinoma cell lineMice were injected by hydrodynamic tail vein injection with KRASG12D and CRISPR/Cas9 sg-p19 together with 40 mg of pT3-CK19-
GFP plasmid. For tumor cell isolation, mouse livers were perfused six weeks later through the inferior vena cava as described (Me-
deracke et al., 2015), using increased concentrations of collagenase. Tumors were separated, mechanically dissociated and further
digestedwith trypsin-EDTA (Gibco) andDNase (Roche) and sorted for GFP by flow cytometry using a BDAria II Cell Sorter. Cells were
named CGKP19 and were grown in DMEM supplemented with antibiotics and 10%FBS. Their ability to give rise to CCA in vivo was
confirmed by injecting 13106 cells subcutaneously in the left flank or in the spleen of C57BL/6J mice. CK19 expression was
confirmed by Western blot and IHC.
Cell cultureTo determine cell proliferation, 5 x 10⁴ cells were plated in 12 well plates in growthmedia for 24 hr and after overnight starvation, were
treated with recombinant human or recombinant mouse HGF 25 ng/mL (R&D) or vehicle in presence or absence of U-0126 ERK-in-
hibitor (Cayman Chemical) (5 mM) as specified in each figure legend. After 48 hr treatment, cells were fixed with 4% PFA and stained
with HOECHST (ThermoFischer Scientific) 1:10,000 in PBS, visualized with Olympus IX71S1F-3 microscope and counted using Fiji
Software. Proteome Profiler Human Phospho-Kinase Array Kit (R&D) was used to determine the phosphorylation of multiple kinases
in human HuCCT-1 and in mouse CGKP19 cell lines after 10 min incubation with HGF at 25 ng/mL, accordingly to manufacturer’s
instructions. Quant-iT PicoGreen dsDNA Assay Kit (ThermoFisher Scientific) was used to measure proliferation assessed as the
amount of double-stranded DNA (dsDNA) accordingly to the manufacturer’s instructions, in HuCCT-1 plated on 2kPa, 16 kPa and
64 kPa plates (SoftSubstrates, MuWells) for 72 hr. BrdU cell proliferation assay was assessed as previously described with some
modifications (Yang et al., 2019). Briefly, primary HSCs isolated from wild type or aSMA-HAS2Tg mice were cultured for 7 days
and then supernatants were collected. Tumor cells, starved overnight in 0.1% FBS medium, were treated with the HSC conditioned
medium (HSC-CM) for 20 to 36 hr. The BrdUwas added to culturemedium and incubated for additional 5 to 24 hr. BrdU incorporation
was assessed according to manufacturer’s instruction (Millipore Sigma). For the hyaluronidase treatment, supernatants from HSC
culture were incubated with hyaluronidase (Sigma) with a final concentration 100 U/mL for 1hr at 37�C. Hyaluronic acid concentration
was measured by using Hyaluronan ELISA Duo set according to manufacturer’s instruction (R&D systems). For CD44 blocking ex-
periments, tumor cells were treated with anti-mouse CD44 antibody (Cedarlane, clone:KM-81) with a final concentration 0.2 mg/mL
for 1 hr, and then treated with HSC-CM. Rat IgG2a (ThermoFischer Scientific) was used as control. For HA treatment, tumor cells
were cultured with DMEM supplemented with 10%FBS and antibiotics for 24 hr. After starvation, cells were treated with hyaluronan
lowmolecular weight (R&D), hyaluronan mediummolecular weight (R&D), hyaluronan high molecular weight (R&D), HA Potasium salt
from cockscomb (Carbosynth), HEALONPROOVD (Johnson and Johnson Vision) and hyaluronic acid sodium salt from rooster comb
100 mg/mL (Millipore Sigma) all at 100 mg/mL. After 36hr, the BrdU was added to culture medium and the cells were incubated for
additional 3 hr. BrdU incorporation was assessed according to manufacturer’s instruction (Millipore Sigma).
HSC and CAF isolationMouse HSC were isolated by in situ liver perfusion as described (Mederacke et al., 2015; Pradere et al., 2013), the cells were further
purified by FACS using endogenous retinoid fluorescence (Mederacke et al., 2015) or by Lrat-Cre-induced TdTomato fluorescence.
CAFs from Lrat-Cre+ TdTom Col1a1-GFP+ mice were isolated following above tumor cell isolation protocol with somemodifications.
Before FACS sorting, cells were subjected to a separation gradient using Nycodenz 34%. CAF were sorted for GFP; HSC-derived
CAFs were sorted by GFP and TdTomato double-positive signal, on a BD Aria II Cell Sorter, followed by RNA sequencing or scRNA
sequencing.
Immune cell isolation and flow cytometryMyeloid and lymphoid subsets were isolated from the tumors and quantitatively analyzed as previously described (Chowdhury et al.,
2019) with somemodifications. Briefly, after mechanical homogenization, the tumors were digested with collagenase A (1 mg mL�1;
Roche) and DNase I (0.5 mg mL�1; Roche) in isolation buffer (RPMI 1640 supplemented with 5% FBS, 1% L-glutamine, 1%
penicillin–streptomycin and 10 mM HEPES) for 45 min shaking (150 rpm) at 37�C. Cells were filtered through 100 mm cell strainers,
washed in isolation buffer and stained. Myeloid cells were stained immediately, and lymphoid subset underwent a separation
gradient using Percoll (67%, 40%), followed by staining. Dead cells were excluded by staining with Ghost Dye cell viability reagent.
Extracellular antibodies included: anti-B220 (BD) (1:200), anti-CD19 (Tonbo) (1:200), anti-CD45 (BD and Biolegend) (1:400), anti-CD4
(BD) (1:400), anti-CD8 (Tonbo) (1:400), anti-NK1.1 (BD) (1:300), anti-CD11b (BD) (1:500), anti-CD11c (BD) (1:200), anti-F4/80 (Tonbo)
(1:500), and anti-MHC class II (Tonbo) (1:400) antibodies. Intracellular antibodies included: anti-CD3e (BD) (1:400), anti-TCRb (BD)
(1:300) and anti-FOXP3 (Thermo) (1:300). Cells were fixed using the FOXP3/transcription factor staining buffer set (Tonbo) according
to the manufacturer’s protocol. Samples were analyzed using a BD LSRFortessa cell analyzer.
RheometryTumor samples were cut from livers using a stainless-steel punch when >8mm, and cylindrical samples were cut manually
when <8mm and the diameter was determined from optical images. Parallel plate shear rheometry was carried out using a Kinexus
rheometer (Malvern Panalytical, Westborough, MA). Samples were attached to the top and bottom plates with fibrin glue made by
mixing 10 mL of 5mg/mL salmon fibrinogen and 10 mL of 150 U/ml salmon thrombin (Sea Run Holdings, Freeport, ME) for each side of
e7 Cancer Cell 39, 1–17.e1–e11, June 14, 2021

llArticle
Please cite this article in press as: Affo et al., Promotion of cholangiocarcinoma growth by diverse cancer-associated fibroblast subpopulations, CancerCell (2021), https://doi.org/10.1016/j.ccell.2021.03.012
the sample. The upper plate (8 mm diameter) was lowered until contact wasmade as determined by the application of 400 Pa normal
stress, and the sample was allowed to sit for 5min to ensure attachment to themetal plates. Shear storagemodulus G0, lossmodulus
G00, and normal force were measured by applying a low oscillatory shear strain of 2% at a frequency of 1 rad/s at room temperature.
Simultaneously, samples were subjected to small stepwise axial strains in tension (0, 10, and 20%) followed by compression
(�10, �15, �20, and �25%), between which the samples were allowed to relax for 2 min. Samples were kept hydrated during ex-
periments with PBS. The equilibrium G0 and G00 after 2 min of relaxation were plotted against axial strain.
ImmunoblottingWhole-cell and tissue extracts were prepared using RIPA buffer containing PhosSTOP phosphatase inhibitor (Roche) and cOmplete
protease inhibitor (Roche). Proteins were subjected to 10% SDS–PAGE and blotted on a nitrocellulose membrane (Sigma) with a
semi-dry blot system (BioRad). Membranes were incubated with the following primary antibodies: p-ERK1/2 (1:2000, Cell Signaling,
#4370), ERK1/2 (1:1000, Cell Signaling, #4695), p-AKT (1:2000, Cell Signaling, #4060), AKT (1:1000 Cell Signaling, #9272), YAP/TAZ
(1:1000, Cell Signaling, #8418), DDR1 (1:1000, Cell Signaling, #5583) followed by incubation with horseradish peroxidase-conjugated
secondary antibody against rabbit IgG (1:5000, Santa Cruz, #sc-2004). GAPDH (1:15,000, Sigma, #G9295) was used as loading con-
trol. Blots were visualized using SuperSignal West Femto Maximum Sensitivity Substrate (ThermoFisher Scientific) and bands were
quantified with ImageJ software. If necessary, stripping was performed with Restore Western Blot Stripping Buffer (ThermoFisher
Scientific).
Enzyme-linked immunosorbant assayCAFs from Lrat-Cre+ LSL-TdTom Col1a1-GFP+ mice were isolated following the above CAF isolation protocol from YAP/AKT and
KRAS/p19-induced ICC models. iCAF were sorted by GFPlow and TdTomato double-positive signal, and myCAF were sorted by
GFPhigh and TdTomato double-positive signal on a BD Aria II Cell Sorter and were quickly plated in a high binding 96-well plate
(Greiner Bio-one) in white DMEM supplemented with 10% FBS and antibiotics. 24 hours later the supernatants were collected
and used to perform the Mouse HGF DuoSet ELISA (R&D) following the manual’s instructions. To increase the sensitivity, we
used the QuantaBlu Fluorogenic Peroxidase Substrate Kit (ThermoFisher Scientific) to detect the signal. The SpectraMax iD3
(Molecular Devices) microplate reader was used to detect the signal and read the results.
Immunohistochemistry and immunofluorescenceParaffin-embedded or frozen liver sections 5-mm thickness, were incubated with the following primary antibodies: CK19 (1:500,
Abcam), CK7 (1:2000, ThermoFisher), Ki67 (1:100, Abcam and 1:100 e-Biosciences), cleaved caspase-3 (1:200, Cell Signaling),
CD3 (1:200, Abcam), p-ERK1/2 (1:300, Cell Signaling), a-SMA (1:250, Sigma), SERPINF1 (1:200, NovusBio), RGS5 (1:50 Abcam).
For detection of hyaluronic acid in liver sections and TMAs, HABP recombinant protein (rhAggrecan aa20-675/His, biotinylated,
R&D Systems) was used at a concentration of 4 mg/mL, as previously described (Yang et al., 2019). Detection was performed using
either the Vectastatin Elite ABC-HRP kit (Vector Laboratories) with DAB Peroxidase Substrate kit (Vector Laboratories) or a fluores-
cent secondary antibody with various fluorescent conjugates (donkey anti-rabbit Alexa Fluor 488, 1:500, Life Technologies; donkey
anti-mouse Alexa Fluor 488, 1:500, Life Technologies) with streptavidin signal amplification (Alexa Fluor 594/647, 1:500, Life Tech-
nologies), followed by counterstaining with either hematoxylin or DAPI (Thermo Fisher Scientific). IHC for smoothmuscle actin (1:350,
Nordic Biosite) in the TMAs, was performed using the conventional Ventana BenchMark platform (Roche) and OptiView DAB kit for
secondary antibody and color development (760-700, Roche). Non-fluorescence image acquisition was performed with a Leica
SCN400 slide scanner or Olympus IX71S1F-3 microscope coupled to a QImaging Retiga camera. Quantification of DAB positive
area was performed using the LEICA Digital Image Hub 4.0 image server. Fluorescence images were captured at 10x, 20x or 40x
magnification using Olympus I371S1F-3 microscope or Nikon A1 confocal laser microscope (Nikon Instruments). Images were
analyzed using Fiji ImageJ and Adobe Photoshop. Col1a1-GFP and RGS5, HA and RGS5, SERPINF1 and RGS5 costainings were
quantified bymeasuring the stained area for each antibody in a specific cell; counting was evaluated in n = 20 ± 5 cells for each tumor
(n = 3) and the cells were categorized into high and low using the median as cut-off and the ratio was determined.
RNAscopeFrozen liver sections 10-mm thickness from two different cholangiocarcinoma mouse models (YAP/AKT and KRAS/p19) were ob-
tained from Lrat-Cre LSL-TdTomato mice and were imaged with RNAscope. The RNAscope Multiplex Fluorescent Reagent Kit v2
including RNAscope Multiplex Fluorescent Detection Kit (PN 323110), RNAscope H202 and Protease Reagents (PN 322381) and
RNAscope Target Retrieval reagents (322000), RNAscope Wash Buffer (PN 310091), the pretreatment TSA buffer (322809), and
detection reagents for manual amplification from Advanced Cell Diagnostic were used to spatially detect via in situ hybridization
Hgf and Has2 using the RNAscope Probe-Mm-Hgf-C3 (ACD; Cat No. 315631-C3) and the RNAscope Probe-Mm-Has2-C2 (ACD;
Cat No. 465171-C2) specific probes respectively, following the RNAscope Multiplex Fluorescent v2 Assay Protocol, optimized for
fixed-frozen samples. Chromogenic detection was performed using a horseradish peroxidase (HPR) construct specific to each
gene-dedicated imaging channel and a fluorescent Opal reagent. Has2 was stained with Opal 520 Reagent (PerkinElmer,
FP1487001KT), and Hgf was stained with Opal 690 Reagent (PerkinElmer, FP1488001KT). Each Opal reagent dye was diluted
1:1500 in RNAscope Multiplex TSA Buffer. Nuclei were stained with DAPI (40,6-diamidino-2-phenylindole) and coverslips were
mounted over slides in Fluoro-Gel (EMS; 17,985-10) and imaged by a Nikon A1 confocal laser microscope (Nikon Instruments).
Cancer Cell 39, 1–17.e1–e11, June 14, 2021 e8

llArticle
Please cite this article in press as: Affo et al., Promotion of cholangiocarcinoma growth by diverse cancer-associated fibroblast subpopulations, CancerCell (2021), https://doi.org/10.1016/j.ccell.2021.03.012
Images were analyzed using Fiji ImageJ. For each model (YAP/AKT and KRAS/p19) 5 tumors were evaluated. The Hgf and Has2
stained area in a specific cell was evaluated in n = 20 ± 8 cells for each tumor and the cells were categorized into high and low
gene expression using the median ratio as cut-off.
Fibrosis quantificationHepatic fibrosis was determined by picrosirius red staining as previously described (Pradere et al., 2013). Pictures for quantification
of picrosirius red staining were taken in a minimum 5 low-power fields/mouse using a polarized light filter and quantified by Adobe
Photoshop software.
RNA isolation and qPCRTotal RNA was isolated from cells and liver tissue by column purification and on column DNAse treatment (Roche Diagnostics).
Following reverse transcription using High Capacity cDNAReverse Transcription Kits (Applied Biosystems), mRNA levels were deter-
mined by quantitative real-time PCR on Applied Biosystems QuantStudio 5 Real-Time PCR System, using PerfeCTa qPCR FastMix
(Quanta) and ABI Taqman primer-probes. All qPCRs were quantified using relative standard curves and normalized to expression
of 18s.
Bulk RNA sequencingRNA was extracted using the RNeasy Micro or Mini Kit (Qiagen) with on-column DNAse digestion accordingly to manufacturer in-
structions. RNA (RNA integrity number [RIN] >8, as determined by Bioanalyzer 2100, Agilent Technologies) was used to construct
libraries using Illumina TruSeq RNA Preparation Kit according to the manufacturer’s instructions. 20M paired-end 100bp sequencing
was performed using the Illumina NovaSeq 6000 at Columbia Genome Center. RTA (Illumina) was used for base calling and
bcl2fastq2 (version 2.19) for converting BCL to fastq format, coupled with adaptor trimming. A pseudoalignment to a kallisto index
was created from transcriptomes (Human: GRCh38; Mouse: GRCm38) using kallisto (0.44.0). Differentially expressed genes were
tested using DESeq2. Normalization was done internally using DESeq2’s specialized algorithm and normalization to compare across
samples, was performed using the TPM (transcripts per million) method. All heatmaps were generated using the ComplexHeatmap
R/bioconductor package v2.4.2 (Gu, Z. (2016). Complex heatmaps reveal patterns and correlations in multidimensional genomic
data. The functional enrichment analysis was performed using g:Profiler (version e99_eg46_p14_f929183) with g_SCS multiple
testing correction method applying significance threshold of 0.05 (Raudvere et al., 2019; Reimand et al., 2019).
Single cell RNA-sequencingCAF-enriched but diverse cell populations from KRAS/p19-and YAP/AKT-induced ICC tumor specimens were obtained following
isolation protocol described above for CAF from Lrat-Cre+ LSL-TdTomato Col1a1-GFP+ mice. For n = 2 YAP/AKT ICC samples
(YAP/AKT ICC1 and YAP/AKT ICC3), cells were sorted for Col1a1-driven GFP. To obtain CAF-enriched samples containing multiple
cell populations for a more detailed CellPhoneDB analysis, we combined Col1a1-GFP+ cells (70%) from n = 1 YAP/AKT (YAP/AKT
ICC2) and n = 1 KRAS/p19 ICC sample with the respective unpurified cell suspension (30%) after sorting on a BD Aria II Cell Sorter.
Tumor specimen from above described CCA patient was freshly dissociated, minced to 2–4 mm sized pieces and subsequently
digested to single cell suspension using Multi Tissue Human Tumor Dissociation Kit 1 (Miltenyi Biotec) and a gentleMACS
OctoDissociator (Miltenyi Biotec) according to the manufacturer’s instructions. The dissociated sample was processed for scRNA
sequencing and this sample is referred as ‘‘human CCA’’ in the manuscript. Previously published scRNA sequencing datasets of
human ICC samples (Ma et al., 2019; Zhang et al., 2020) were included. These datasets included as analysis are in total 6 human
ICC samples, but one sample (GSE142784/GSM4240156_ICC32S = Human ICC4) contained an insufficient number of tumor cells
for CellPhoneDB analysis. Specifically, sample ICC4 (GSM4240156_ICC32S - humanICC_S2D2) yielded 5661 cells in the raw counts
data and 4892 cells after QC filtering with mitochondrial gene cut-off of 50% and UMI count threshold of 40,000, which was one
magnitude higher than the 498 cells reported to be analyzed by Zhang et. Al, who used a very stringent mitochondrial gene cut-
off. The slightly lower quality of this sample may have contributed to someminor discrepancies with other samples from our analysis.
Samples and the associated downstream analyses are summarized in Table S1. Among these GSE142784/GSM4240155_ICC24S
(Human ICC1) and GSE142784/GSM4240156_ICC32S (Human ICC4), were CAF-enriched samples, all others were non-enriched
samples. From Zhang et al. (GSE138709 = Human ICC2), 5 tumors (GSM4116580, GSM4116581, GSM4116583, GSM4116584,
GSM4116585) from 4 different patients were merged using ‘‘MergeSeurat’’ function in Seurat v2.4 (Stuart et al., 2019) and the
raw counts were used for further analysis described in the methods. From these, only GSM4116585 (Human ICC2-1),
GSM4116584 (Human ICC2-2) and GSM4116583 (Human ICC2-3) were included to investigate HSC-CAF/PF-CAF, iCAF/myCAF/
mesCAF percentages and analyze ligand-receptor interactions by CellphoneDB as other samples did not have enough CAF for these
analyses. From Ma et al. (GSE125449 Set1 = Human ICC3), we extracted raw counts of 6 ICC patients: S11_P06_LCP29,
S09_P04_LCP25, S08_P03_LCP26, S12_P07_LCP30, S20_P12_LCP35, S19_P11_LCP39. Only human S11_P06_LCP29 (Human
ICC3-1) was included to investigate HSC-CAF/PF-CAF, iCAF/myCAF/mesCAF percentages and analyze ligand-receptor interac-
tions by CellphoneDB as other samples did not have enough CAF for these analyses.
e9 Cancer Cell 39, 1–17.e1–e11, June 14, 2021

llArticle
Please cite this article in press as: Affo et al., Promotion of cholangiocarcinoma growth by diverse cancer-associated fibroblast subpopulations, CancerCell (2021), https://doi.org/10.1016/j.ccell.2021.03.012
Single cell RNA-sequencing analysisMouse and human tumor specimens were processed as previously described and freshly isolated cells were counted on Countess II
automated cell counter (ThermoFisher) and were loaded on a 10x Chromium instrument (10x Genomics). Single-cell RNA-seq
libraries were prepared using the Chromium Single Cell 30 v2 or v3 Reagent Kit (10x Genomics) according to manufacturer’s instruc-
tions. 12 cycles of cDNA amplification and 12 cycles of library amplification were performed, and samples were sequenced on an
Illumina NovaSeq 6000 Sequencing System at the JP Sulzberger Columbia Genome Center. 10x Genomics Cellranger pipeline
was used to process the data (YAP/AKT v2.1.1(ICC1), v4.0.0 (ICC2 and ICC3); KRAS/p19 and human ICCs and hilar CCA v3.1.0).
BCL files were demultiplexedwith 10x Cell Ranger’smkfastq command and analysis and alignment were performed using Cell Rang-
er’s count command with Cell Ranger’s reference mm10. Single-cell count matrices were loaded into scanpy AnnData objects
(scanpy v1.4.6) and ribosomal protein genes were removed. We analyzed QC metrics (total number of counts, number of genes de-
tected, percentage of mitochondrial RNA) to identify and remove outliers in the distribution of cells (Ilicic et al., 2016). Each cell was
normalized using pool-derived size factors (Lun et al., 2016) and each normalizedmatrix was then log-transformed. Principal compo-
nent analysis was performed on the resulting matrices (scanpy v1.4.6). To identify significant principal components, we exploited
RandomMatrix Theorymethodologies through the randomly algorithm (Aparicio et al., 2020).We applied UMAP (McInnes and Healy,
2018) to visualize the distribution of cells in the projection of the significant principal components. UMAPs were used to show the
normalized expression levels of indicated signatures and genes. To identify cell sub-populations, we chose the Louvain algorithm
for community detection (Blondel et al., 2008) with different values for the resolution parameter, comparing the average Silhouette
score across all cells for each clustering (Rousseeuw, 1987). Differentially expressed genes were computed using the Wilcoxon
Rank-Sum test (as implemented in scanpy), and we labeled the different populations using the genes differentially up-regulated in
each population. Cell populations including CAF, hepatocytes, T and B lymphocytes, dendritic cells, endothelial cells, myeloid cells,
monocytes and neutrophils, were identified using specific markers genes (Table S2) and confirmed by PanglaoDB (Franzen et al.,
2019). Mouse scores for panCAF andCAF subpopulation signatures were computed as previously defined (Elyada et al., 2019). Clus-
ters having at least 49% of cells with positive pan-CAF score were considered further for analysis of CAF subtypes (mouse ICC pan-
CAF signature: Col1a1, Col1a2, Col3a1, C1s1, Acta2, C1ra, Serpinf1, Pdgfrb, Col12a1). HSC-CAF and PF-CAF scores were calcu-
lated using the HSC and PF signatures in Table S2 and HSC-CAF, PF-CAF and other-CAF percentages of total pan-CAF were
calculated for each sample. Some murine and human cells with the HSC-CAF cluster also expressed Myh11 and Actg2, vascular
smooth muscle cell markers (Figure S1H), but they were positive for the HSC signature and were considered HSC (Table S2) since
they did not cluster distinctly from HSC, suggesting that these cells represent an HSC-CAF subtype rather than an own entity.
Another population sharing endothelial andHSCmarkers (emHSC) was found inmice fromYAP/AKT-induced ICC, andwas analyzed
as a distinct cell population (Table S2); this population was negative for the panCAF score. Within panCAF, CAF subpopulation score
distributions were analyzed, and a CAF subpopulation label was assigned to each cell if the corresponding score was higher than
0.125 (higher than 0 to reduce the number of cells with multiple labels). Afterward, we sorted all cells into three sets: i) single-CAF
(cells with a single label), ii) multi-CAF (cells with more than one label), iii) other-CAF (cells with no label). A new signature for different
CAF subpopulations was computed on single-CAF for each sample by selecting differentially expressed genes between the different
subpopulations (q < 0.05, log-FC > 1). Only single-CAF within each sample were considered in the previous step and 3 different pop-
ulations were identified and named as iCAF, myCAF and mesCAF accordingly to their DGE and pathways enrichment (described in
Results and Tables S4 and S5). To produce a single-CAF consensus signature for each different CAF subpopulation, the genes differ-
entially expressed for each population were refined by keeping only i) genes present in both YAP/AKT ICC1 and KRAS/p19 samples
signatures, and ii) genes that after step (i) were mutually exclusive between CAF subpopulations (iCAF, myCAF and mesCAF mouse
signatures are displayed in Table S2). The inter-sample set of CAF subpopulations signatures (consensus signature) was then reap-
plied to panCAF of both samples, and the refined number of cells (and percentage) of the different labeled subpopulations was
computed. In human ICC dataset, PDAC-defined CAF signatures (Elyada et al., 2019) and the mouse ICC CAF signatures were
used to define the cell clusters corresponding to panCAF and CAF subpopulations iCAF, myCAF and mesCAF. The panCAF human
signature was computed by obtaining the differentially expressed genes (q < 0.05, log-FC > 1) in panCAF cluster compared to all
other cell types and manually selecting genes with panCAF specific expression (human panCAF signature: COL1A1, COL1A2,
COL3A1, C1S, ACTA2, C1R, SERPINF1, PDGFRB). HSC-CAF and PF-CAF clusters were determined from the HSC and PF signa-
tures in Table S2 as described previously inmouse. TheCAF subpopulations iCAF,myCAF andmesCAF clusters obtainedwere inde-
pendently validated by their differential gene expression and GO enrichment analysis. iCAF, myCAF and mesCAF signatures were
computed by obtaining the differentially expressed genes (q < 0.05 and log-FC > 1 or top 20 genes) in the respective CAF subpop-
ulation cluster compared to the rest of panCAF (human signature in Table S2). These panCAF and CAF subpopulation signatures
were then reapplied to all human ICCs and CCA samples to obtain and quantify CAF populations as mentioned previously in mouse.
The CAF subpopulation score threshold was selected to minimize the number of cells with multiple labels. The violins showing the
signature scores were computed for each cells the difference between average expression of gene signature with average expres-
sion of a set of randomly selected genes. The width of each violin plot indicates the kernel density of the expression values.
Global stellate cell and PF signaturesTo identify the ontogeny of CAF in PDAC, we analyzed scRNA-seq data from KPC-induced mouse PDAC, using the ‘early KIC’
sample from GEO: GSE125588 (Hosein et al., 2019). To determine a gene signature that could identify both HSC PSC-derived
CAF, we determined the top 100 differentially expressed genes between HSC-CAF and PF-CAF in KRAS/p19-induced ICC and
Cancer Cell 39, 1–17.e1–e11, June 14, 2021 e10

llArticle
Please cite this article in press as: Affo et al., Promotion of cholangiocarcinoma growth by diverse cancer-associated fibroblast subpopulations, CancerCell (2021), https://doi.org/10.1016/j.ccell.2021.03.012
YAP/AKT-induced ICC1, as well as between the fibroblast populations identified as ‘‘1‘‘ and ‘‘2’’ (strongly marked by HSC marker
Cygb and weakly marked by HSC markers Des, Lrat and Rgs5, hence candidate PSC-CAF) and as ‘‘3’’ in the original paper (Hosein
et al., 2019) (marked by multiple mesothelial markers, hence candidate mesothelial CAF). Among these differentially expressed
genes, 11 genes (see Table S2 and Figure S2) were identified as common to all three models and clearly differentiated HSC and
PSC-derived CAF from PF-CAF in ICC or mesothelial CAF in PDAC. Thus, they form a global stellate cell signature. The global PF
signature was based on the hepatic PF signature of Msln, Gpm6a, Upk1b and Upk3b, and included Krt19, in addition (Table S2).
CellPhoneDB analysisCellPhoneDB (Vento-Tormo et al., 2018), a curated repository of ligands, receptors, their subunit architectures and interactions with
an integrated statistical framework to infer cell-cell communication networks between cell types in single-cell transcriptomics data,
was used to identify ligand-receptor interactions in n = 4 mouse samples of ICC, n = 5 human ICC and n = 1 human hilar CCA. After
identifying different cell types in our scRNA-seq datasets as described above, we followed recommended procedures for preparation
of input files using CellPhoneDB v.2.0.0 (Vento-Tormo et al., 2018). We updated the original CellPhoneDB repository with novel in-
teractions and complexes curated from literature using ‘cellphonedb database generate’ command. All CellPhoneDB statistical anal-
ysis were performed with this updated database and percentage cell expression threshold of 1%. Cell-cell interactions heatmaps
showing number of interactions, Log2mean (Molecule 1, Molecule 2) and log10(p value), were generated using pheatmap R package
and ligand-receptor interactions were visualized using ggplot2 R.
Clinical parameter analysis in human ICCThe association between panCAF and myCAF gene expression signatures and overall survival as well as other clinical parameters
shown in Table 1, was tested in a previously published cohort of clinically annotated intrahepatic cholangiocarcinoma (Sia et al.,
2013). Survival data were available for 119 patients along with matched whole-genome gene expression data (GSE32225). For
the testing of human ICC ACTA2, panCAF signature: COL1A1, COL1A2, COL3A1, C1S, ACTA2, C1R, SERPINF1, PDGFRB and
myCAF signature (see Table S2), an enrichment score was calculated for each patient using the single-sample Gene Set Enrichment
Analysis (ssGSEA)methodology (Barbie et al., 2009) implemented in Gene Pattern (Reich et al., 2006). Patients were then categorized
into high and low enrichment score or high and low gene expression using the median as cut-off. Kaplan-Meier method and log rank
test were performed to analyze the association of gene signatures and gene expression with overall survival using IBM SPSS version
24 (http://www.ibm.com/). Overall Survival was defined as the time between surgical resection and death of any cause or loss to
follow-up. All reported p values are 2-sided and p < 0.05 was considered significant.
The association betweenHA expression and overall survival was tested in the above-described TMAs from the Riener (Riener et al.,
2010) cohort by quantifying the percentage of the HA-positive stained area in ICC and ECC patients using Fiji ImageJ. Survival data
were available for 16 ICC and 50 ECC patients. Patients were categorized into high and low HA expression using the third quartile as
cut-off (cut-off = 65.41). 16 patients (5 ICC and 11 ECC) had a score >65.41 and 50 patients (11 ICC and 39 ECC) had expression
<65.41. The association between aSMA expression and overall survival was tested in the above-described TMAs by digitization us-
ing a Nano-Zoomer Digital Pathology scanner (Hamamatsu, Japan) at the maximum in-built magnification of 400X. Image analysis
was processed in QuPath v.0.1.3 (Queen’s University, Belfast, Northern Ireland). TMA slides were dearrayed and preprocessed as
previously described (Bankhead et al., 2017). After dearraying, TMAs were manually curated. Cell-detection was conducted using
QuPath’s built-in ‘‘Positive cell detection’’ (Bankhead et al., 2017). For each core, the total number of positive cells, irrespective of
localization, was assessed. Survival data were available for 17 ICC and 60 ECC patients. Patients were categorized into high and
low aSMA expression using the median as cut-off (cut-off = 34.71). 40 patients (11 ICC and 29 ECC) had a score >34.71 and 37 pa-
tients (6 ICC and 31 ECC) had expression <34.71. Kaplan-Meier method and log rank test were performed to analyze the association
of gene signatures and gene expression with overall survival using GraphPad Prism v.8.0.
QUANTIFICATION AND STATISTICAL ANALYSIS
GraphPad Prism v.8.0 was used for statistical analyses. D’Agostino-Pearson omnibus normality test, Anderson-Darling test and
Shapiro-Wilk normality test were performed to assess data distribution. For statistical analysis of parametric data, the two-tailed
unpaired Student’s t test was used for groups of two; one-way ANOVA followed by Sidak multiple comparison posthoc tests for
comparison of more than two groups. For non-parametric data, the Mann-Whitney U test was used for groups of two; Kruskal-Wallis
test followed by Dunn multiple comparison posthoc test was used for comparison of more than two groups.
e11 Cancer Cell 39, 1–17.e1–e11, June 14, 2021