proofs of utility, innovation, profitability and concept
TRANSCRIPT

ICED13/211 1
INTERNATIONAL CONFERENCE ON ENGINEERING DESIGN, ICED13 19-22 AUGUST 2013, SUNGKYUNKWAN UNIVERSITY, SEOUL, KOREA
PROOFS OF UTILITY, INNOVATION, PROFITABILITY
AND CONCEPT FOR INNOVATION SELECTION
Bernard YANNOU (1), Benjamin ZIMMER (2), Romain FAREL (1), Marija JANKOVIC (1), Julie STAL-LE CARDINAL (1) 1: Ecole Centrale Paris, France; 2: Sol'iage, France
ABSTRACT Selecting innovative ideas or projects and comparing them in terms of their potential of value creation
in business contexts is a fundamental design task. To that end, we propose to assess four proofs of
Utility, Profitability, Innovation and Concept at different levels of maturity along the innovation
process. This model has been successfully applied in two situations of practical size. A first
experimentation has validated its usefulness for providing a common analysis framework to a
multidisciplinary jury of a National innovation grant within an innovation cluster. A second
experimentation has validated that an aggregate indicator of the four proof ratings averaged on a set of
representative jury members is highly correlated with the estimated potential of value creation of this
innovation. This work is a first step towards an automation of innovation selection in a collaborative
manner.
Keywords: design selection, idea selection, innovation process, innovation indicator, innovation
management
Contact:
Prof. Dr. Ing. Bernard Yannou
Ecole Centrale Paris
Laboratoire Genie Industriel
Chatenay-Malabry
92290
France
2
1 INTRODUCTION
In different entrepreneurship or intrapreneurship situations, there are times where a more or less
developed idea or concept must be presented and evaluated by investors to raise public and/or private
funds in order to move up a step in the development of a new product and/or service (the process of
maturity of an idea or a research project, or go/no-go of a detailed design phase). Yet, currently, no
clear method exists to select ideas or concepts with a strong potential for success in the market in the
context of a start-up or of an existing business. There is engineering design literature that emphasizes
idea generation processes, but outside of the context of business and industry. There is also
management science and technology management literature that emphasizes mainly factors external to
the innovation project. The success of the innovation project in the market will be based upon these
factors, which are generally measured by experts using a business plan. But there exists little or
nothing to evaluate the more or less great potential for success in the market of a radical innovation
concept or idea presented to a jury of experts. A radical innovation methodology, called Radical
Innovation Design® (Yannou et al., 2011; Yannou et al., 2012) was recently proposed for
multidisciplinary and business contexts, in order to maximize the potential for success of a radical
innovation in a business context. Accordingly, a UIPC-proofs model has already been proposed and
applied in (Zimmer et al., 2012), standing for four groups of proof indicators: proofs utility, proofs of
profitability, proofs of innovation, and proofs of concept. These proof indicators aim at assessing the
potential of value creation of an innovative idea/project in a business or company context. It has been
shown in (Zimmer et al., 2012) that this model was highly inspiring to provide a unified framework to
assess the potential of innovations in a multidisciplinary way and to make the jury members conscious
of their selection decision. The demonstration was made that this procedure was truly appreciated but
not that the UIPC-model could be used as a predictor or detector of radical innovations with high
potential to be successful. This is the objective of the present paper through two large
experimentations.
2 LITERATURE REVIEW OF SELECTION METHODS FOR RADICAL
INNOVATION PROJECTS
Our study is focused on radical innovation, which is, according to Garcia and Calantone (Garcia et al.,
2002), innovation that does not answer expressed needs, but that rouses a demand that was not first
articulated by the users before launch. These innovations are therefore riskier and more uncertain than
incremental innovations (Boly, 2004). Wright defines innovations in (Wright, 2012) as “we defined
innovation as the successful exploitation of new ideas to increase customer value or create wealth for
a company. Innovation is therefore outcome-oriented, with the outcomes being aligned with a
company’s overall strategy. However, within this broad definition, it is possible to define three levels
of innovation based on the degree of “newness” and the degree of “value add””. He provides a
remarkably simple schema to figure out incremental innovations and radical innovations, passing by
substantial innovations (see Figure 3, left part). This is a representation of an innovation in a 2D plane
with coordinates: Degree of Newness and Degree of Value-Add. But, of course, no practical
measurement indicators and tools are provided for that; at this stage, this is an analogical and
qualitative tool.
These ideas are born of a creative process largely described in the field of engineering design.
According to Shah et al. (Shah et al., 2000), the literature in the domain of engineering design
suggests that “a wide range of formal methods have been devised and used for idea generation in
conceptual design. Experimental evidence is needed to support claims regarding the effectiveness of
these methods in promoting idea generation in engineering design.”In this field, the literature focuses
more on the creative process and the exploration process that make it possible to produce a concept
that creates the most value, and it focuses less on the scheduled launching of a new product and/or
service into the market in a business context. According to Wadell et al. ((Wadell et al., 2010), the
upstream phases of the innovation project are the discovery of an opportunity, analysis of this
opportunity, generation of an idea, selection of an idea, and definition of a concept. Several models
exist to measure the efficiency of this ideation process. Shah et al. (Shah et al., 2003) proposed four
separate effectiveness measures: novelty, variety, quality and quantity. Novelty measures how unusual
or unexpected an idea is as compared to other ideas. Variety is a size measure of the explored solution
3
space. Quality is a measure of the feasibility of an idea and how close it comes to meeting design
specifications. Quantity is the total number of ideas generated. While Shah et al. argued that due to
aggregation, information loss can occur in an overall effectiveness measure and thus it will not benefit
a design team, they also pointed out a real need for a unique indicator to support project comparison.
Sarkar and Chakrabarti (Sarkar et al., 2011) addressed methods for assessing innovation in such a way
as to integrate the notion of development deadlines and degree of creativity—two factors they found
missing in Shah’s metrics. They also highlighted the need to define the degree of creativity of products
where creativity is considered a function of novelty and usefulness.
But the whole innovation process that transforms an innovative idea into a new product and/or service
that sees a relative success in a market has barely been touched upon. In addition, the aforementioned
works do not address the supervision of a stream of innovative ideas, managing theses ideas or
prototypal projects in terms of their maturity and potential of creating value or being successful in the
context of the company.
In our study, we are seeking to know if we can measure the potential for market success of a new
product and/or service as early as the upstream phases of the conception of an idea, concept, or first
prototype. This question is addressed more in innovation marketing and technology management
literature, where the authors (Astebro, 2004; Cooper, 2001) consider that the goal sought is the
probability that a new idea reaches market rather than simply being “innovative”. These authors
propose innovation management methods to direct the selection process and the process of
transforming an idea into a successful scheduled launch of a product into a market. Cooper (Cooper,
2001) proposes a method, Stages and Gates®, that models the innovation process systematically and
sequentially, beginning with the phase of discovery of an opportunity and terminating with the
scheduled launch of a new product. The probability of success of a new product and/or service in a
market is described as the culmination of a harmonious synchrony of these “stages” and “gates”.
Astebro (Astebro, 2004) proposes a prediction model of the factors of success or non-success of an
innovation project, based on the identification of 36 criteria. This model predicts the relative success,
to 80.9%, of an innovation project, but it is for incremental innovations. In the end, these methods and
models seem to be well-suited to existing businesses that are equipped for R&D in an operational
mindset and that realize incremental innovations. However, they seem less suitable for radical
innovations tied to a mindset of exploration, headed by entrepreneurs, often on their own, where the
market is known for its complexity and uncertainty. These methods and models offer reference points
to formalize and finalize the drafting of a business case while the business wishes to innovate in an
incremental manner, but they do not measure value, innovation, or concept potentials of a radical
innovation project drawn from need, as proposed by the Radical Innovation Design® methodology
(Yannou et al., 2011; Yannou et al., 2012). In these publications (Yannou et al., 2011; Yannou et al.,
2012), the authors demonstrate that this methodology solidifies the proofs of utility, innovation,
profitability and concept throughout the innovation process from the framing of the problem – so-
called problem setting stage – to its resolution – problem solving stage. Using these three types of
proofs is very effective in the secure direction of the development and launching of a radical
innovation; Yannou et al. (Yannou et al., 2011; Yannou et al., 2012) have shown that there are strong
conditional probabilities between creation of actual values and the contribution to solidification of
proofs during the phases of problem setting and conceptual design. This methodology is
complementary to the SynOpp® method in innovation management (Filion et al., 2010). This method
dynamically formalizes, builds, and measures a business case, an aid to the three types of proofs in the
Radical Innovation Design® methodology (Zimmer et al., 2012). SynOpp® allows the entrepreneur
and the expert to follow, guide, and assess the creation of opportunity from its origins to the beginning
of its exploitation. The business case is created in order to assemble the studies that demonstrate that
the project owner is capable, that the environment is ready, and that the project is innovative. These
are also the three conditions addressed in the Millier (Millier, 1999) model that lead to innovation
projects. SynOpp® reconsiders the business plan, criticized more and more by investors for radical
innovations for which, by definition, we cannot go by an experience from the market to correctly
foresee extrapolations of new market areas. The business plan allows the investor to measure the
relationship between the project owner, the opportunity, the context, and the risks in which the project
is developed (Sahlman, 1997). A business plan defines the concept, market, business model, marketing
plan, product development plan, action plan, project team, risk analysis, and financial projections
including R&D investments (Abrams, 2003; Sahlman, 1997).

4
Finally, we keep in mind that there are selection methods for incremental innovation projects in the
fields of marketing and innovation and technology management. There are also methods to support or
predict the success of a new incremental innovation project in the market. We show that existing tools,
such as the business plan, are not sufficiently suitable for measuring and demonstrating the potential
for success of a radical innovation project in the market. Finally, we note that new methods have been
developed for creating a business case. However, we note that these methods do not explain the radical
innovation project selection procedure enough, nor do they sufficiently explain the role of the experts
who analyze these business cases.
3 ROBUSTIFICATION OF UIPC PROOFS ALONG A RADICAL INNOVATION
DESIGN PROCESS
With regard to this company context (rarely considered as an input to an innovation process), the goal
of RID is to innovate as much as possible, creating positive differentiation in the market and changing
the conventional rules of competition. In its essence, RID is a systematic exploration/exploitation
process which progresses through four stages.
1) Exploration of value creation opportunities around the initial idea or statement. The initial
idea/statement is systematically redefined in a more legitimate ideal need. Within this new
exploration perimeter, existing usages, needs and product experiences are populated, investigated
and benchmarked so as to yield input for stage #2.
2) Definition of a promising and coherent perimeter of ambition which is a subset of the
aforementioned ideal need. This perimeter of ambition must represent an opportunistic potential of
value creation in the context of the company ecosystem.
3) Definition of value promising product-service scenarios, a.k.a. briefs, starting from the perimeter of
ambition. These briefs must be qualified (often by storyboards) and quantified (market size and
consumers’ willingness-to-pay).
4) For each brief studied, a systematic listing of value tracks and value drivers, a.k.a. innovation leads
(see the use of RID methodology in the context of EADS company (Rianantsoa et al., 2011)) are
performed. Each innovation lead is then investigated in the form of a systematic creativity
workshop. Findings are combined into consistent design concepts which are subsequently sketched
or prototyped and assessed.
Figure 1. The RID innovation wheel: From initial idea to feasibility and innovation dossier… through ideal need, perimeter of ambition, brief(s), concepts
The RID methodology is organized following Herbert Simon’s approach around a two-part macro-
process: the problem setting macro-stage and the problem solving macro-stage. Figure 1 represents
these two macro-stages within the RID innovation wheel. Of the four radical exploration/exploitation
stages identified above, the first two belong to the problem setting macro-stage, and the two last

5
belong to the problem solving macro-stage. The RID innovation wheel spans transition from the initial
idea or statement to the feasibility and innovation dossier, passing through intermediate results
including ideal need, perimeter of ambition, brief(s), and concepts. In practice, a series of micro-stages
are defined and documented with expected intermediate results and reports, practical examples for
inspiration and a toolbox. It has been shown in recent works (see (Yannou et al., 2011; Yannou et al.,
2012)) that the quality of the innovative design outcomes was highly dependent of the quality of these
RID expected intermediate results and that the overall quality of the problem solving was
probabilistically dependent of the overall quality of the problem setting.
A determining concept of RID is the consideration of the conceptual design stage as an investigation
process. Investigation is understood as exploring all potential leads and then refining and evaluating
conceptual designs that appear to be potential value makers. This investigation is supported by four
types of proofs that are built and reinforced throughout the process:
• The proofs of utility (noted U) for bringing evidence that it is differentiating for users and customers
from the existing solutions in terms of service utility.
• The proofs of innovation (noted I) for bringing evidence that “the invention may be protected and
the innovation may be communicated, perceived, understood and valued, i.e. it corresponds to a
certain willingness-to-pay”.
• The proofs of profitability (noted P) for the company and customers, i.e. a tendency to improve
brand image, to increase the average revenue per user, to conquer new markets or to make clients
more fidel (re-purchasing).
• The proofs of concept (noted C) for bringing evidence that “it works or it is likely to work in
situations the service is expected to be delivered”;
Definitions of these 4 types of proofs are provided in Table 1. It has also already proposed in (Zimmer
et al., 2012) that these proofs be examined along the innovation process, at least at the end of the RID
problem setting and the RID problem solving to ensure that tangible evidences have been provided to
convince of the value creation potential of the innovation. It has been hypothesized that Utility (U) and
Innovation (I) could already be assessed by experts from the exploration process of problem setting
and the resulting perimeter of ambition that embeds which important need or usage is expected to be
covered, which suffering is expected to be alleviated and / or which malfunctions of existing systems
expected to be improved. In the same manner, one must wait the problem solving stage and especially:
- the design briefs (usage or service scenarios) to assess Profitability (P) for users,
- and design concepts (design principles, architectures) and first prototypes to get an idea of
Profitability (P) for the company (because of resulting costs) and feasibilities (it really works as
expected, i.e. proofs of Concept C).
Therefore, in (Zimmer et al., 2012) – see also Table 1 -, two examination juries may be organized to
select the promising innovative ideas or projects. It has been proposed that adapted experts to the
corresponding proofs to assess be chosen. Roughly, it is proposed three bodies: A for Academics, E
for innovation Experts and I for Industry executives. The first problem setting jury (see Table 1) is
composed of members of A and E bodies, and the second problem solving jury is composed of
members of A, E and I bodies.
Table 1. Definition of the Utility-Innovation-Profitability-Concept proofs
RID stage Proof type Definition Juries bodies
Problem
setting
Proofs of
Utility (U)
Coverage of usage and needs situations of users /
stakeholders for which important needs are covered,
suffering alleviated and / or malfunctions of existing
systems improved
Proofs of
Innovation (I)
Real innovation, claimable, protectable, perceived and
valued by users and customers
Problem
solving
Proofs of
Profitability
(P)
Expected profitability for the company and customers.
Tendency to improve brand image, to increase the
average revenue per user, to conquer new markets or to
make more fidel clients (re-purchasing)
Proofs of
Concept (C)
The conceptual solution or prototype functions
effectively and efficiently in expected situations.
Technological and industrial feasibility
6
The two selection stages aim first to eliminate the low utility and low innovation projects and then to
eliminate the low profitability and low concept performance projects.
Two experimentations of practical size follow. The first concerns the evaluation of 20 innovative
projects within an innovation cluster for selecting a subset of 4 promising ones for further coaching
and start-up incubation. The second one concerns the evaluation of 15 innovation projects led in
university but with industrial clients. The two experimentations clearly demonstrate the usefulness of
our model:
- not only for allowing multidisciplinary experts to be stimulated to analyze with a common
language and to adopt a common vision in order to measure the potential success of a radical
innovation in the market,
- but also to use it as an automated rating and ranking method that is highly correlated with the
estimated potential to be successful on the market by experts.
4 FIRST EXPERIMENTATION OF PROJECT SELECTION AND COACHING
IN AN INNOVATION CLUSTER
Sol’iage (see www.soliage.com/) is a business and organization competency cluster, made of 50
institutions, that financially supports radical innovation projects headed by entrepreneurs as early as
the phases upstream of the design of a new product and/or service in gerontechnology (see (Harrington
et al., 2000)). Sol’iage started a radical innovation project selection procedure 9 years ago, in the
context of the “Charles Foix grant”. This procedure detects radical innovation projects that have strong
utility, innovation, profitability and concept potential relative to the pathological situations in
healthcare that are not yet covered by existing products and/or services and which have the potential to
create employment in existing or by start-up companies.
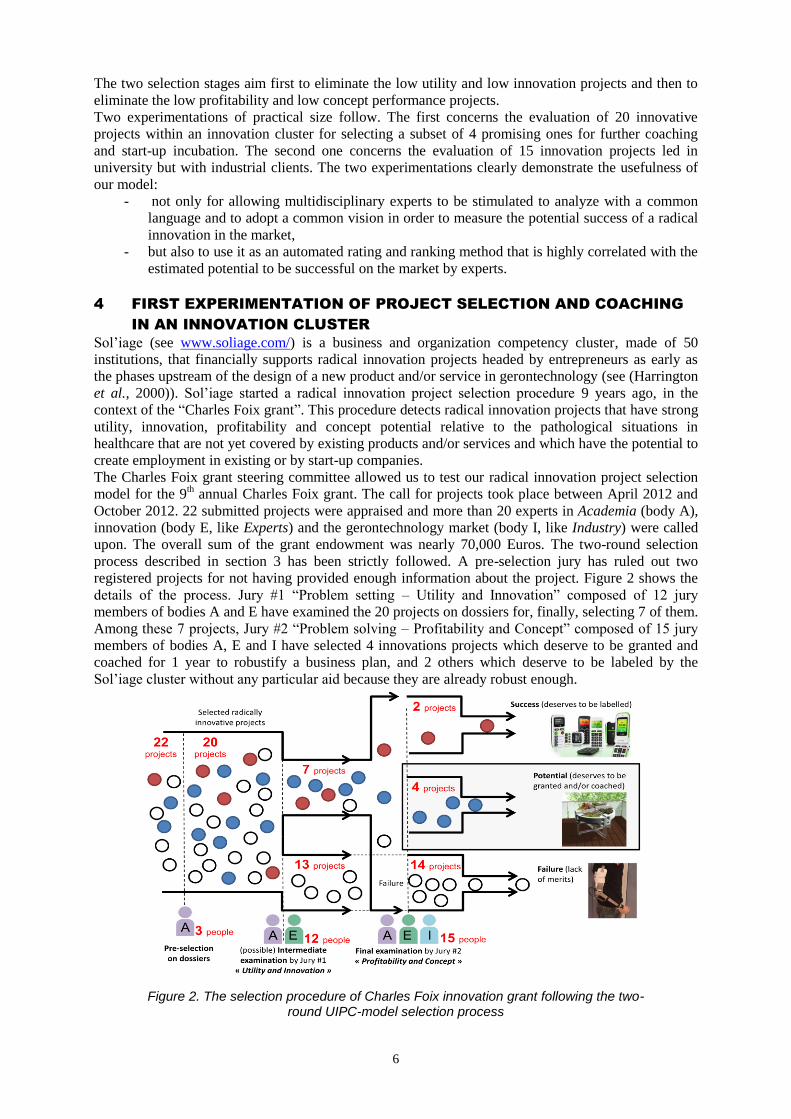
The Charles Foix grant steering committee allowed us to test our radical innovation project selection
model for the 9th annual Charles Foix grant. The call for projects took place between April 2012 and
October 2012. 22 submitted projects were appraised and more than 20 experts in Academia (body A),
innovation (body E, like Experts) and the gerontechnology market (body I, like Industry) were called
upon. The overall sum of the grant endowment was nearly 70,000 Euros. The two-round selection
process described in section 3 has been strictly followed. A pre-selection jury has ruled out two
registered projects for not having provided enough information about the project. Figure 2 shows the
details of the process. Jury #1 “Problem setting – Utility and Innovation” composed of 12 jury
members of bodies A and E have examined the 20 projects on dossiers for, finally, selecting 7 of them.
Among these 7 projects, Jury #2 “Problem solving – Profitability and Concept” composed of 15 jury
members of bodies A, E and I have selected 4 innovations projects which deserve to be granted and
coached for 1 year to robustify a business plan, and 2 others which deserve to be labeled by the
Sol’iage cluster without any particular aid because they are already robust enough.
Figure 2. The selection procedure of Charles Foix innovation grant following the two-round UIPC-model selection process

7
In addition, a detailed chart of 22 pieces of evidence of utility, innovation, profitability and concept
(see Table 2) has been carefully defined and sent to the two sets of jury members in advance to prepare
minds to discuss of a variety of aspects influencing the success of radical innovations. Table 2 shows
also that the rating of these 22 evidence pieces of UIPC proofs can serve, for the 4 selected projects to
be coached for one year, as well for a preliminary assessment of UIPC proof maturity, as for driving
the robustification process of the one-year coaching (not developed further in this paper).
For aiding the jury members to think aloud to a variety of selection dimensions, we provided them
with sheets of papers for each project. Under each of the 9 (for jury #1) and 13 (for jury #2),
respectively, evidence pieces, they were asked to assess two dimensions (see Table 3):
- the strength of evidence, i.e. the degree of certainty and persuasiveness of this evidence piece
- the level of potential, i.e. the power and pertinence of this evidence piece
For instance, one can be sure of an evidence which has low interest, leading to certainty=3 and
level=1.
Finally, these numbers that we incented jury members to deliver were not communicated to other
people but they were let to the self-appreciation of everyone and transmitted to us for further
correlations with selected projects. In definitive, juries had intense discussions and were free to make
their decisions to select or not the projects for the next round by a conventional vote procedure (not
detailed here).
Table 2.Detailed chart of 22 pieces of evidence of utility, innovation, profitability and concept proposed during the Charles Foix grant of innovative projects. To the right, the
initial assessment of the project next to the final assessment after the one-year coaching
Table 4 compares the post-calculated averaged ratings with the selected projects. It is remarkable to
notice that Jury #1 composed of 12 people has finally selected 7 projects for the second selection
round which have been ranked {1, 2, 3, 4, 5, 7, 8}, in just omitting project #19 ranked 6th with our
rating system. In addition, during the second selection round, Jury #2 has finally selected 4 projects
among 7 which have been ranked {1, 2, 3, 5}, in just omitting project #20 ranked 4th with our rating
system. We do not advocate for using our rating system systematically, but our experiment highlight
that our UIPC model and its 22 evidence chart has been a clear frame of reference for the much diverse
experts from the juries to develop a more collective vision of the expectations of a radical innovation
project. It was already confirmed by a recent study in (Zimmer et al., 2012) where a satisfaction
questionnaire was administered to the experts after their testing of our model. It showed that the
procedure we are proposing is effective. Firstly, it gives structure to a discussion on the interest of

8
allotting funding and/or support to an innovation project. Secondly, the use of an evaluation chart
allows the experts to create a common language in order to measure the success of a radical innovation
in the market.
Table 3. The two dimensions under which each piece of evidence is rated
Table 4. Final ratings calculated by us after collecting individual ratings and averaging them. The grey boxes outline the selected projects after the first and the second selection juries.
Project ID 1 2 3 4 5 6 7 8 9 10 11 12 13 14 15 16 17 18 19 20 21 22
1rst jury: U+I 20 4 12 17 11 9 X 15 10 16 7 19 1 18 12 8 X X 6 5 3 2
2nd jury: P+C 7 3 1 5 4 6 2
U+I+P+C 7 3 1 6 4 5 2
Figure 3. Our rating system based on the UIPC-model perfectly emulates the Newness/Value-Add described in (Wright, 2012), given in left part
It is also very satisfactory to plot Innovation (I) ratings (comparable to Degree of Newness in Figure
3a) and Utility (U) ratings (comparable to Degree of Value-Add in Figure 3a) into a 2D representation
in Figure 3 (right part) to figure out that it is a similar schema than the one proposed by Wright
{Wright. 2012 #1380} in Figure 3, left part. Indeed, the 7 selected projects after selection round #1 are
the ones in the right-upper corner of the plot after eliminating projects of low utility, low innovation
and keeping the ones combining at best both!
5 SECOND EXPERIMENTATION ON 15 PROJECTS IN UNIVERSITY
The second experimentation concerns the evaluation of 15 innovation projects led in Ecole Centrale
Paris during the “innovative design of products and services” course SE2200. These projects are based
onto 6 initial ideas provided by 6 companies which are themselves founding or participating members
of the Sol’iage innovation cluster. Therefore, the innovation sector was also about developing radical
product and/or service innovations for elderly people, for aiding them to live better and longer in
autonomy, happiness and respect. Naturally, these “industrial clients” of projects were composing the I
evaluation/selection body.
Here, the objective was not to select a promising innovative project but to provide a grade for the
pedagogical activity. The process followed has been different and simpler than the fist
experimentation’s:
- Only one jury was composed of A, E and I body members at the end of problem solving,
9
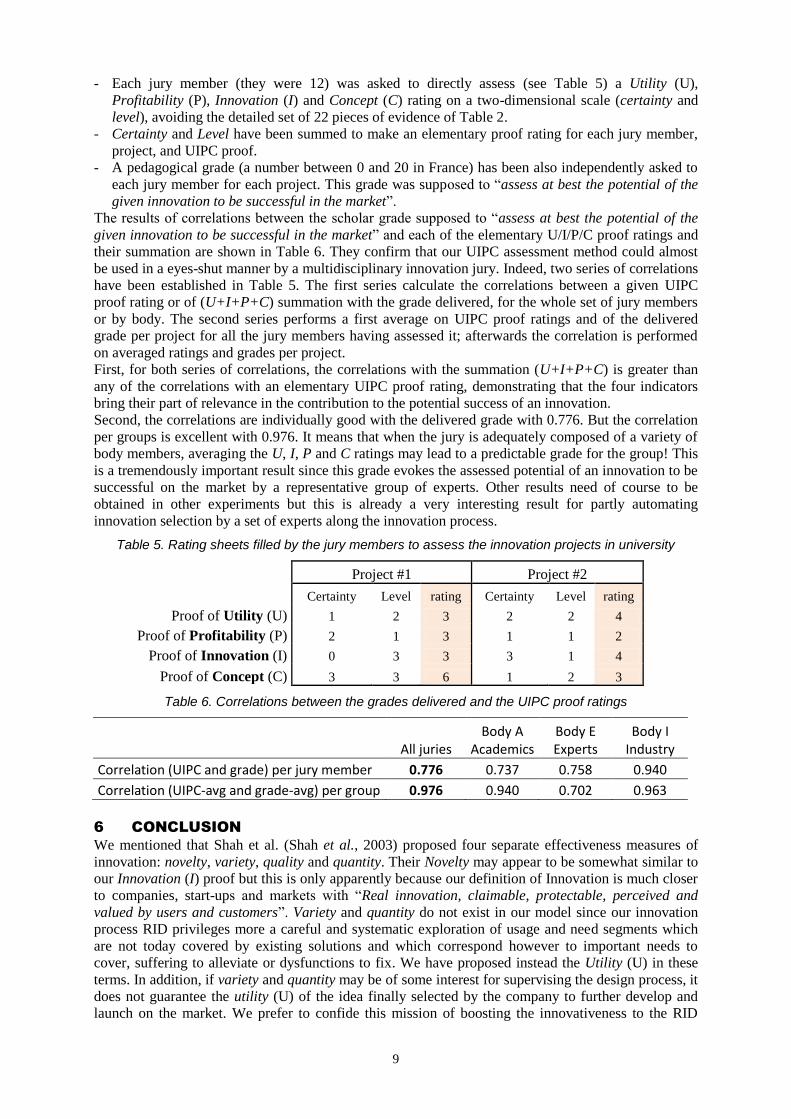
- Each jury member (they were 12) was asked to directly assess (see Table 5) a Utility (U),
Profitability (P), Innovation (I) and Concept (C) rating on a two-dimensional scale (certainty and
level), avoiding the detailed set of 22 pieces of evidence of Table 2.
- Certainty and Level have been summed to make an elementary proof rating for each jury member,
project, and UIPC proof.
- A pedagogical grade (a number between 0 and 20 in France) has been also independently asked to
each jury member for each project. This grade was supposed to “assess at best the potential of the
given innovation to be successful in the market”.
The results of correlations between the scholar grade supposed to “assess at best the potential of the
given innovation to be successful in the market” and each of the elementary U/I/P/C proof ratings and
their summation are shown in Table 6. They confirm that our UIPC assessment method could almost
be used in a eyes-shut manner by a multidisciplinary innovation jury. Indeed, two series of correlations
have been established in Table 5. The first series calculate the correlations between a given UIPC
proof rating or of (U+I+P+C) summation with the grade delivered, for the whole set of jury members
or by body. The second series performs a first average on UIPC proof ratings and of the delivered
grade per project for all the jury members having assessed it; afterwards the correlation is performed
on averaged ratings and grades per project.
First, for both series of correlations, the correlations with the summation (U+I+P+C) is greater than
any of the correlations with an elementary UIPC proof rating, demonstrating that the four indicators
bring their part of relevance in the contribution to the potential success of an innovation.
Second, the correlations are individually good with the delivered grade with 0.776. But the correlation
per groups is excellent with 0.976. It means that when the jury is adequately composed of a variety of
body members, averaging the U, I, P and C ratings may lead to a predictable grade for the group! This
is a tremendously important result since this grade evokes the assessed potential of an innovation to be
successful on the market by a representative group of experts. Other results need of course to be
obtained in other experiments but this is already a very interesting result for partly automating
innovation selection by a set of experts along the innovation process.
Table 5. Rating sheets filled by the jury members to assess the innovation projects in university
Project #1 Project #2
Certainty Level rating Certainty Level rating
Proof of Utility (U) 1 2 3 2 2 4
Proof of Profitability (P) 2 1 3 1 1 2
Proof of Innovation (I) 0 3 3 3 1 4
Proof of Concept (C) 3 3 6 1 2 3
Table 6. Correlations between the grades delivered and the UIPC proof ratings
All juries
Body A Academics
Body E Experts
Body I Industry
Correlation (UIPC and grade) per jury member 0.776 0.737 0.758 0.940
Correlation (UIPC-avg and grade-avg) per group 0.976 0.940 0.702 0.963
6 CONCLUSION
We mentioned that Shah et al. (Shah et al., 2003) proposed four separate effectiveness measures of
innovation: novelty, variety, quality and quantity. Their Novelty may appear to be somewhat similar to
our Innovation (I) proof but this is only apparently because our definition of Innovation is much closer
to companies, start-ups and markets with “Real innovation, claimable, protectable, perceived and
valued by users and customers”. Variety and quantity do not exist in our model since our innovation
process RID privileges more a careful and systematic exploration of usage and need segments which
are not today covered by existing solutions and which correspond however to important needs to
cover, suffering to alleviate or dysfunctions to fix. We have proposed instead the Utility (U) in these
terms. In addition, if variety and quantity may be of some interest for supervising the design process, it
does not guarantee the utility (U) of the idea finally selected by the company to further develop and
launch on the market. We prefer to confide this mission of boosting the innovativeness to the RID

10
process itself and to measure the effective potential of the framed problem or of the most promising
emerging brief and concept. Lastly, the proof of profitability and the proof of concept (it works well
and it is feasible) have been added as essential for innovation in a business perspective.
While Shah et al. (Shah et al., 2003) argued that due to aggregation, information loss can occur in an
overall effectiveness measure and thus it will not benefit a design team, they also pointed out a real
need for a unique indicator to support project comparison.
We believe we are on the way to get one aggregate indicator today, adapted to measure the potential of
a radical innovation in a business context. Our model is based on the presence of 4 proofs (see Table
1) to reveal this potential, this is the Utility-Innovation-Profitability-Concept (UIPC) model of proofs.
Each of the 4 proofs is a probabilistic measure composed of a degree of certainty and a level or
magnitude of potential (see Table 3).
This model has been used successfully a first time in the context of an innovation cluster to select,
grant and coach the most promising innovative ideas or projects. We clearly show that the selected
projects have almost been the best rated by the aggregate indicator UIPC (U+I+P+C) averaged on the
jury members carefully chosen to be complementary in 3 expert bodies. This model has been used
successfully a second time in the framework of delivering the final grade to innovation projects in an
engineering department. We find a remarkable correlation between the aggregate indicator UIPC
(U+I+P+C) averaged on the jury members for each project and the average grade assigned to the
project and which was assumed to “assess at best the potential of the given innovation to be successful
in the market”.
REFERENCES Yannou B., Jankovic M., Leroy Y., (2011) 'Empirical verifications of some Radical Innovation Design
principles onto the quality of innovative designs', Proceedings of ICED 2011, Copenhagen, Denmark
Yannou B., Jankovic M., Leroy Y., Okudan Kremer G.E. (2012) 'Observations from radical innovation
projects considering the company context', Journal of Mechanical Design, DOI: 10.1115/1.4023150
Zimmer B., Yannou B., Stal Le Cardinal J., (2012) 'Proposal of radical innovation project selection
model based on proofs of value, innovation and concept', Proceedings of International Design
Conference - Design 2012, Dubrovnik, Croatia, May 21-24
Garcia R., Calantone A. (2002) 'A critical look at technological innovation typology and
innovativeness terminology: a literature review', The Journal of Product Innovation Management, vol.
19, no. 2, pp. 110-132
Boly V. (2004) Ingénierie de l'innovation : Organisation et méthodologies des entreprises, Paris,
Hermes Lavoisier
Wright P. (2012) 'The three levels of innovation', CEO Forum, http://www.ceoforum.com.au/article-
detail.cfm?cid=6143&t=/Paul-Wright-Invetech/The-three-levels-of-innovation
Shah J.J., Kulkarni S.V., Vargas-Hernandez N. (2000) 'Evaluation of Idea Generation Methods for
Conceptual Design: Effectiveness Metrics and Design of Experiments', Journal of Mechanical Design,
vol. 122, no. 4, pp. 377-385
Wadell C.J., Olundh Sandstrom G., Janhager J., Norell Bergendahl J., (2010) 'Early stages user
involvement as a product innovation capability in the medical technology industry - a literature study',
Proceedings of International Design Conference - Design 2010, Dubrovnik, Croatia, May 17-20, pp.
1219-1228
Shah J., Vargas-Hernandez N. (2003) 'Metrics for measuring ideation effectiveness', Design Studies,
vol. 24, no. 2, pp. 111-134
Sarkar P., Chakrabarti A. (2011) 'Assessing design creativity', Design Studies, vol. 32, no. 4, pp. 348-
383
Astebro T. (2004) 'Key Success Factors for Technological Enterpreneurs' R&D Projects', IEEE
Transactions on Engineering Management, vol. 51, no. 3, pp. 314-321
Cooper R.G. (2001) Winning at new products: accelerating the process from idea to launch,
Cambridge, 3rd edition, Basic Books
Filion L.J., Ananou C. (2010) De l’intuition au projet d’entreprise : une nouvelle approche pour la
conception de projets d’affaires, Québec, Canada, Les éditions transcontinental et les éditions de la
fondation de l’entrepreneurship
Millier P. (1999) Marketing The Unknown: Developing Market Strategies For Technical Innovations,
New-York, John Wiley&sons

11
Sahlman W. (1997) 'How to write a great business plan', Harvard Business Review
Abrams R. (2003) The successful business plan secrets and strategies, Palo Alto, California, 4th
edition. The Planning Shop
Rianantsoa N., Yannou B., Redon R., (2011) 'Steering the value creation in an airplane design project
from the business strategies to the architectural concepts', Proceedings of ICED 2011, Copenhagen,
Denmark
Harrington T., Harrington M. (2000) Gerontechnology: Why and How, Maastricht. The Netherlands,
Shaker Publishing B.V.