propagating uncertainties in simulation assessments of r k ... · comprehensive inventory of ......
TRANSCRIPT

Approved for Public Release. DoD OPSR 13-S-2927. September 2013.
Propagating Uncertainties in Simulation Assessments of
R k t A till d M tRockets, Artillery and Mortars Intercept Alternatives
NDIA 16th Annual Systems Engineering Conference
28-31 October 2013
Frederick A AhrensFrederick A. [email protected]
520.794.9767
Copyright © 2013 Raytheon Company. All rights reserved. Customer Success Is Our Mission is a registered trademark of Raytheon Company.
Approved for Public Release. DoD OPSR 13-S-2927. September 2013.

Approved for Public Release. DoD OPSR 13-S-2927. September 2013.
Contents
Introduction: simulation errors within a risk framework
Summarizing a sensitivity analysis with descriptive statistics
Principles & past usage of uncertainty / risk analysis
Comprehensive inventory of error sources
Sources of uncertainty for life-cycle effectiveness
Life-cycle cost & effectiveness with error & uncertainty for the rockets, artillery and mortars (RAM) intercept examplemortars (RAM) intercept example
Concluding observations
2
Approved for Public Release. DoD OPSR 13-S-2927. September 2013.
Simulation errors within a risk framework
2 500
3,000
Millions
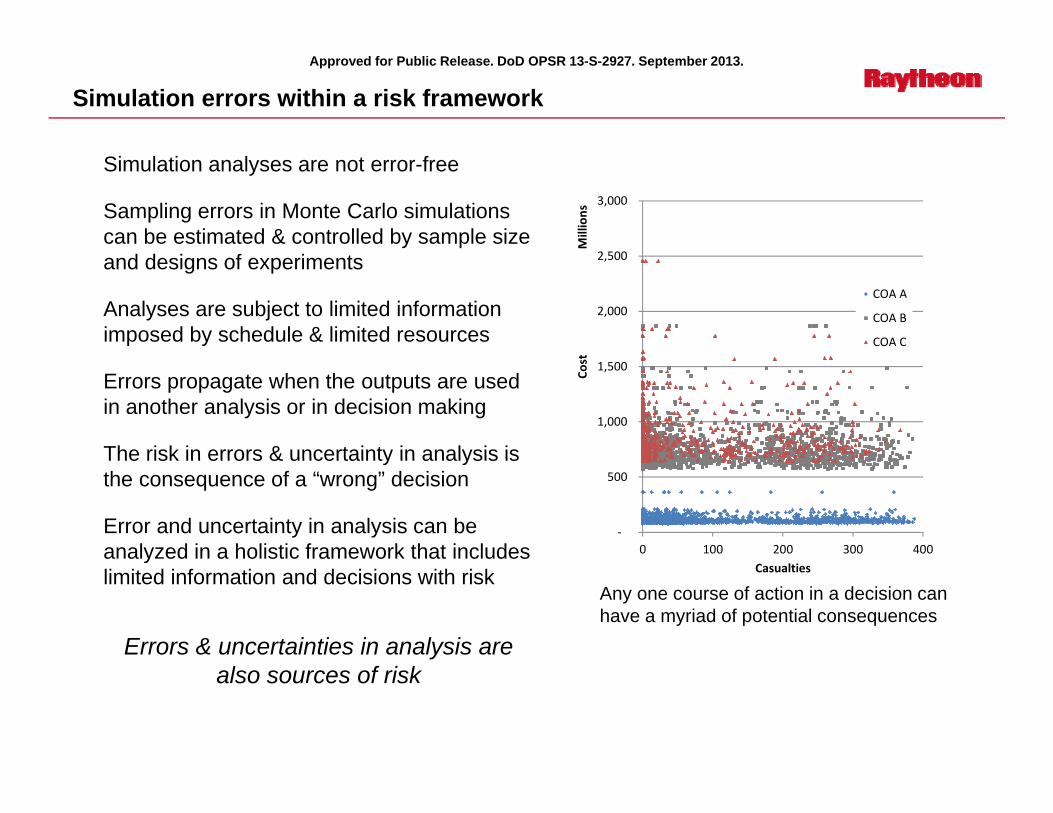
Simulation analyses are not error-free
Sampling errors in Monte Carlo simulations can be estimated & controlled by sample size
2,000
2,500
t
COA A
COA B
COA C
and designs of experiments
Analyses are subject to limited information imposed by schedule & limited resources
1,000
1,500
Cost
Errors propagate when the outputs are used in another analysis or in decision making
The risk in errors & uncertainty in analysis is
‐
500
0 100 200 300 400
The risk in errors & uncertainty in analysis is the consequence of a “wrong” decision
Error and uncertainty in analysis can be analyzed in a holistic framework that includes
Casualties
Errors & uncertainties in analysis are
ylimited information and decisions with risk
Any one course of action in a decision can have a myriad of potential consequences
also sources of risk

Approved for Public Release. DoD OPSR 13-S-2927. September 2013.
250
300NT DEVEL
Current practice in simulation analysis
Fixed-point assumptions conceal effects of unknowns on 200
NTDEVEL
0
50
100
150
200
250
0.10
0.28
0.46
0.64
0.82
1.00
0.19
0.37
0.55
0.73
0.91
Leakers
threat_size
Interceptor Interceptoroperational effectiveness analysisLikelihood of a “stressing scenario”Variations on the type of operationVariations in threat capabilities & tacticsVariations in terrain and weather
0
50
100
150
0 1 2 0 1 2
Leakers
scenario_type
NT Interceptor
Interceptor
Variations in terrain and weatherUnknown performance parameters for future solutions, threats and competitors
Assumptions should be transparentUse authoritative sources to validate fixed-point 0
50
100
150
200
0.67
0.83 .00
.17
.33
.50
0.75
0.92 .08
.25
.42
Leakers NT
Interceptor
DEVEL Interceptor
0
50
100
150
200
.00
.20
.40
.60
.80
.00
.10
.30
.50
.70
.90
Leakers NT
Interceptor
DEVEL Interceptor
passumptions
Authoritative sources, study advisory groups, program direction, subject matter experts, peer review
Even when “validated”, over-reliance on fixed-point assumptions can lead to an illusion of certainty (J i
0 0 1 1 1 1 0 0 1 1 1
cep_scale
0. 0. 0. 0. 0. 1. 0. 0. 0. 0. 0.
threat_standoff
0
50
100
150
200
Leakers NT
Interceptor
DEVEL Interceptor
0
50
100
150
200
Leakers NT
Interceptor
DEVEL Interceptor
assumptions can lead to an illusion of certainty (Janis 1973)
Employ extensive sensitivities to understand how assumptions affect the outcomes (Office of Aerospace Studies 2010, Morrow 2011) 100
150
200
eakers NT
Interceptor
DEVEL Interceptor
100
150
200
eakers NT
Interceptor
DEVEL Interceptor
0
85 88 91 93 96 99 86 89 92 95 98
primary_pk
0
50 60 70 79 89 99 55 65 75 84 94
second_pk
Expose, document and estimate all sources of errorAssumptions, inputs, modeling & simulation limitations, Monte Carlo sampling, response surface fit, generalization
0
50
6 17 28 38 49 60 11 22 33 44 55
Le
simul_eng
0
50
0.98
0.98
0.99
0.99
1.00
1.00
0.98
0.99
0.99
0.99
1.00
Le
fcr_avail
Comparisons and sensitivity analysis for RAM How to present comprehensive sensitivities in
a way that recognizes risks and facilitates decisions? The systems and threats in these examples are
notional and presented for illustrative purposes
intercepts simulation in EADSIM

Approved for Public Release. DoD OPSR 13-S-2927. September 2013.
Descriptive statistics summary of sensitivity studies
The graphics show summaries of 3600 Box & whisker plots of RAM defense simulations
150200250300350400
asua
lties
The graphics show summaries of 3600 engagement simulations and 600 cost outcomes
These show central location, spread and
Maximum
90 %-tileMedian10 %-tile
Expected value
p
050
100150
Sense & warn NT interceptor Devel interceptor
Caextreme-values of outcomes
Not a substitute for sensitivity graphs that link variation to particular factors
2.5
ons
Minimum
Cumulative probability graphs show more detail in the distributions but are less intuitive to some viewers
All f i ti i l d d1.0
1.5
2.0
fe cycle cost
Billio
All sources of variation are includedSensitivity of 16 factorsMonte Carlo variation within simulation
All points treated equally likely
0.0
0.5
Sense & warn NT interceptor Devel interceptor10
‐year lif
Alternative cumulative probability presentation
50%
100%
of observation
s
50%
100%
of observation
s
Sense & warn
NT Interceptor
All points treated equally likely
A descriptive statistics summary shows distributions of the data without inference
Alternative cumulative probability presentation
0%0.0 0.5 1.0 1.5 2.0 2.5Pe
rcen
t o
10‐year life cycle costBillions
0%0 200 400Pe
rcen
t
Casualties
p
Devel Interceptor
The systems and threats in these examples are notional and presented for illustrative purposes

Approved for Public Release. DoD OPSR 13-S-2927. September 2013.
Principles of an outcome-based risk analysis
A reality: decisions are made with Penny A reality: decisions are made with incomplete information
Expected values of consequences are not sufficient to evaluate alternatives
Mutual fund
ystock
000 investmen
t
worth
(Markowitz 1952, Kaplan & Garrick 1981)
Subjective probabilities represent the current state of knowledge (Jaynes
Bond
Return on $1,0
Without fire insurance
With fire insurance
Net
current state of knowledge (Jaynes1968)
Quantitative risk assessment approach: evaluate alternatives with
b bilit di t ib ti l f
fire insurance fire insurance
5 10
Common risk decisions are evaluated on extreme value as well as expected outcome
probability distribution on a scale of outcomes (Garrick & Christie 2008)
Transparency: the risk analysis should trace to the detailed sensitivities 2
3
4
5kelih
ood
ncy (per year)
10
The risk analysis should help identify the principal sources of risk
Risk is best understood in terms
0
1
2
0 1 2 3 4 5
Lik
Consequence
Freq
uen
F li i i id
10‐3
10 103 105
Risk is best understood in terms of a population of measurable
consequences
Consequence Fatalities per incident
A risk reporting matrix (AMSAA Risk Team, 2013)
Frequency of man-caused disasters (fires, explosions, air crashes, dam failures, Kaplan & Garrick, 1981)

Approved for Public Release. DoD OPSR 13-S-2927. September 2013.
Identify all sources of error and uncertainty in the analysis
In Monte Carlo error
0 0.5 1Probability of insurgent attack
0 1000 2000RAM attacks per 10 years
‐3 ‐2 ‐1 0 1 2 3
Response surface error (normalized)
In Monte Carlo error analysis, all sources of error and uncertainties are assigned probability distributions for
*
0 0.5 1Probability of major adversary
0.00% 100.00%Threat size(% of full strength)
0 0.5 1Probability of MRL attack0 200 400 600
Personnel at risk
distributions for samplingThe distributions should represent the current state of knowledge
*
0 0.5 1Threat standoff factor
0 0.5 1 1.5Threat CEP factor
0 10000 20000Surveillance radar range (m)
0 10000 20000Fire control radar range (m)
state of knowledgeCapability to change distributions & update results in real time can *
Fire control radar range (m)
0 20 40 60Simultaneous engagements0.97 0.98 0.99 1
FCR availability
0.8 0.9 1Launcher availability
0 1 2 3
facilitate presentation
80 90 100Primary PK
0 5 10 15C3I max reaction time (sec)0 0.5 1 1.5
Interceptor range factor
0 1 2 3Interceptor (NT) unit cost factor
0 1 2 3
0 1 2 3Other procurement cost factor
0 5 10 15C3I max kill assess time (sec)
0 0.5 1 1.5Interceptor speed factor
0 50 100Secondary PK
0 1 2 3Interceptor (Devel) unit cost factor 0 0.5 1 1.5
O&M cost factor
* Aleatory uncertainty, subject to averaging. Others are epistemic uncertainties.

Approved for Public Release. DoD OPSR 13-S-2927. September 2013.
Applications of uncertainty & risk analysis
Timson applies subjective probabilities and Monte Carlo
350
simulation to model probability distributions for critical performance parameters in engineering program management (1968)
Cuff demonstrates how quantitative risk analysis in
Weighted distributions of outputs from EADSIMWeights were derived from probability densities on the inputs
150
200
250
300
350
Leakers
performance, cost and schedule can support program decisions (1973)
Armacost & Pet-Edwards incorporate uncertainty in ice flow reporting in ice patrol operations planning (1995)
0
50
100
Sense & Warn NT Devel
Fredley (1995) includes uncertainty in numbers and types of future operations in a force structure analysis approach
Pate-Cornell & Guikema present a model for prioritizing terrorism threats and countermeasures in homeland
Maximum
90 % tilExpected
150200250300350400
Casualties
security (2002)
Monte Carlo sampling is used to propagate uncertainty of inputs in complex physics and environmental models (Christie, et al. 2005; Lloyd & Ries 2007)
90 %-tileMedian10 %-tile
Minimum
Expected value
050100150
Sense & Warn NT Devel
CSimulation-based sampling is used to propagate uncertainty through cost models (Anvari 2011)
Monte Carlo sampling has been used to propagate uncertainty in physical systems
and cost modeling The systems and threats in these examples are notional and presented for illustrative purposes

Approved for Public Release. DoD OPSR 13-S-2927. September 2013.
Linking vignette results to life-cycle cost effectiveness5000
ts
How will the acquisition will be judged after the fact?The acquisition was well-matched to the threat and operations that actually occurred; the investment could not have achieved greater ends elsewhere 5
50
500
mbe
r of inciden
t
The acquisition was exceeded by the threat; high casualties and constraints on joint commanderThe acquisition overmatched the actual threat to the extent that excess dollars could have been used to improve other Cumulative number of RAM incidents from March
2003 t M h 2013 (I B d C t 2013)
0.51 10 100
Num
Fatalities
capabilities
Sources of uncertainty for the life cycleWhat types of global threats will emerge?
2003 to March 2013 (Iraq Body Count, 2013)
10 0%
100.0%
cide
nts
What types of operations will be undertaken?How many vignettes will occur over the life cycle?What is the distribution of “vignette intensity” (numbers of threat RAM employed)? 0.1%
1.0%
10.0%
Percen
t of inc
threat RAM employed)?How should vignette to vignette variability be treated?
We can assign probability distributions to numbers of vignettes threat size and intensity to derive a
0.10 1.00Threat Size (% of full strength)
Threat size distribution used in this RAM intercept illustration. Full strength is 100, 200 or 300 threats, depending on type of scenario.of vignettes, threat size and intensity to derive a
probability distribution of life-cycle casualtiesthreats, depending on type of scenario.

Approved for Public Release. DoD OPSR 13-S-2927. September 2013.
100,000
Application to RAM intercept alternatives
Monte Carlo sampling of 3000 vignettes
60,000
80,000
sualties
Monte Carlo sampling of 3000 vignettes grouped into 200 futures
Grouping is necessary to separate epistemic and aleatory factors (epistemic
20,000
40,000
10‐year cas
p y ( pfactors should not be averaged over vignettes)
Discussion of alternatives can address t l ll t d l
Residual risk, >5,000 with probability 0.03
0Sense & warn
NT interceptor
Devel interceptor
3 000
extreme value as well as expected value outcomes
Distributions are highly skewed in this example
2,000
2,500
3,000
$)Millions
example
Ability to zoom the ordinate scale would help discriminate alternatives
500
1,000
1,50010
‐year cost ($
A RAM intercept comparison showing life cycle effectiveness and cost as
probability distributions
0Sense & warn
NT interceptor
Devel interceptorThe systems and threats in these examples are
notional and presented for illustrative purposes

Approved for Public Release. DoD OPSR 13-S-2927. September 2013.
Pulling the thread: cases resulting in >5,000 casualties for Devel interceptor
‐3 ‐2 ‐1 0 1 2 3
Variation between vignettes (normalized)
‐3 ‐2 ‐1 0 1 2 3
Response surface error (normalized)
0 1000 2000RAM attacks per 10 years
0 0.5 1Probability of insurgent attack Six of 200 samples
(3%) resulted in high 10 year casualties
0% 100%Threat size(% of full strength)
0 0.5 1Probability of marjor adversary
0 200 400 600Personnel at risk
0 0.5 1Probability of MRL attack
10-year casualtiesExcept for Threat Size and Number of RAM Attacks, these
0 10000 20000Surveillance radar range (m)0 0.5 1 1.5
Threat CEP factor
0 0.5 1Threat standoff factor
0 10000 20000Fire control radar range (m)
samples are representative of uncertainty distributions
0.97 0.98 0.99 1FCR availability
0.8 0.9 1Launcher availability
0 20 40 60Simultaneous engagements
Fire control radar range (m)
A source of risk is a decade of recurring RAM attacks at near full
0 0.5 1 1.5Interceptor range factor 0 5 10 15
C3I max reaction time (sec) 80 90 100Primary PK
recurring RAM attacks at near full threat strength
Remaining options are to re-evaluate the uncertainty improve alternative
0 0.5 1 1.5Interceptor speed factor
0 5 10 15C3I max kill assess time (sec)
the uncertainty, improve alternative resilience or accept the residual risk

Approved for Public Release. DoD OPSR 13-S-2927. September 2013.
Some observations
The need for sensitivities of many uncertainty factors makes modern designs of experiments y y g pmore attractive
The examples in this presentation used a space-filling design with 16 uncertainty factors and 410 scenarios
R li t th DOE f t i t f t f h lt ti th th ill b id b idReplicate the DOE of uncertainty factors for each alternative; then there will be side-by-side simulations of the alternatives
Bayesian inference can produce posterior probability densities of some simulation inputs that are anchored to past observationsp
Example: use past data on RAM incidents to develop the probability density of future incidents
Whether or not to use surrogate modelsIt is possible to run simulations with directly sampled random inputs, directly summarizing outputs without surrogate modelswithout surrogate modelsPro: surrogate models allow reconstruction of sensitivitiesPro: surrogate models allow real-time changes in the input probability densities for collaborative workshopsCon: surrogate models introduce an estimation error that needs to be incorporated into the errorCon: surrogate models introduce an estimation error that needs to be incorporated into the error modeling
If a surrogate model is used, Bayesian inference can produce a probability density of estimation error
12
Modern DOE and response surface methods facilitate simulation error & uncertainty analysis

Approved for Public Release. DoD OPSR 13-S-2927. September 2013.
Summary of Key Points
Errors & uncertainties in analysis are sources of risk
A descriptive statistics summary shows distributions of the data withoutA descriptive statistics summary shows distributions of the data without inference
Risk is understood in terms of a population of measurable consequences
Identify all sources of error and uncertainty
Monte Carlo sampling can be used to propagate uncertainty through simulations
Assign probability distributions to numbers of vignettes threat size and intensityAssign probability distributions to numbers of vignettes, threat size and intensity to derive a probability distribution of life-cycle benefits
Risk-based error and uncertainty analysis presents effectiveness and cost as probability distributionsprobability distributions
13

Approved for Public Release. DoD OPSR 13-S-2927. September 2013.
References
AMSAA Ri k T Ri k A t J 7 2013 Jaynes Edwin T "Prior Probabilities " IEEE Transactions on SystemsAMSAA Risk Team. Risk Assessment. January 7, 2013. http://web.amsaa.army.mil/RiskAssessment.html (accessed March 10, 2013).
Anvari, Mort. "Cost Risk and Uncertainty Analysis." MORS Risk, Trade Space & Analytics in Acquisition Special Meeting. Vienna, VA: MORS, 2011. 1-18.
Jaynes, Edwin T. Prior Probabilities. IEEE Transactions on Systems Science and Cybernetics 4, no. 3 (1968): 227-241.
Kaplan, Stanley, and B. John Garrick. "On the Quantitative Definition of Risk." Risk Analysis 1, no. 1 (1981): 11-27.
Lloyd, Shannon M., and Robert Ries. "Characterizing, Propagating, and Analyzing Uncertainty in Life Cycle Assessment A Survey of,
Armacost, Robert L., and Julia Pet-Edwards. Risk Management Model of IIP Operations, Annex K of Cost and Operational Effectiveness for Selected International Ice Patrol Alternatives. Final Report, Vienna, VA: EER Systems Corp., 1995.
Christie Michael A James Glimm John W Grove David M Higdon
and Analyzing Uncertainty in Life-Cycle Assessment, A Survey of Quantitative Approaches." Journal of Industrial Ecology 11, no. 1 (2007): 161-179.
Markowitz, Harry. "Portfolio Selection." Journal of Finance 7, no. 1 (March 1952): 77-91.
Christie, Michael A., James Glimm, John W. Grove, David M. Higdon, David H. Sharp, and Merri M. Wood-Shultz. "Error Analysis and Simulation of Complex Phenomena." Los Alamos Science, no. 29 (2005): 6-25.
Cuff, James D. "Risk-decision analysis in weapon's system acquisitions." Long Range Planning 6, no. 1 (1973): 49-55.
Morrow, Patrick K. "Analysis of Alternatives." Defense Acquisition University. February 2011. https://acc.dau.mil/adl/en-US/30371/file/61360/A3_%20Analysis_of_%20Alternatives_%20final.pdf (accessed June 23, 2013).
Office of Aerospace Studies. "Analysis of Alternatives (AoA) Handbook, A Practical Guide to Analyses of Alternatives."
Fredley, Michael L. "An Analytical Framework for Assessing Future Force Structure Requirements Under Uncertainty." Masters Thesis, Operational Sciences, Air Force Institute of Technology Air University, 1995.
Garrick, B. John, and Robert F. Christie. Quantifying and Controlling
Handbook, A Practical Guide to Analyses of Alternatives. Personnel and Readiness Information Managment (P&R IM). July 2010. http://www.prim.osd.mil/Documents/AoA_Handbook.pdf (accessed June 23, 2013).
Pate-Cornell, Elisabeth, and Seth Guikema. "Probabilistic Modeling of Terrorist Threats: A Systems Analysis Approach to Setting
y g gCatastrophic Risks. Burlington, MA: Academic Press, 2008.
Iraq Body Count. (2013, March). Database. Retrieved March 2013, from Iraq Body Count: http://www.iraqbodycount.org/database/download/ibc-incidents
Janis, Irving L. "Groupthink and Group Dynamics: A Social
Terrorist Threats: A Systems Analysis Approach to Setting Priorities Among Countermeasures." Military Operations Research 7, no. 4 (2002): 5-23.
Janis, Irving L. Groupthink and Group Dynamics: A Social Psychological Analysis of Defective Policy Decisions." Policy Studies Journal 2, no. 1 (1973): 19-25.
14

Pending Public Release Approval.
Backup Material

Approved for Public Release. DoD OPSR 13-S-2927. September 2013.
8 000
Application to RAM intercept alternatives (zoomed in)
Monte Carlo sampling of 3000 vignettes
6,000
8,000
ualties
o e Ca o sa p g o 3000 g e esgrouped into 200 futures
Grouping is necessary to separate epistemic and aleatory factors (epistemic f
2,000
4,000
10‐year casufactors should not be averaged over
vignettes)
Discussion of alternatives can address extreme value as well as expected value
0Sense & warn
NT interceptor
Devel interceptor
3 000
extreme value as well as expected value outcomes
Distributions are highly skewed in this example
2,000
2,500
3,000
$)Millions
Ability to zoom the ordinate scale would help discriminate alternatives
500
1,000
1,50010
‐year cost ($
A RAM intercept comparison showing life cycle effectiveness and cost as
probability distributions
0Sense & warn
NT interceptor
Devel interceptorThe systems and threats in these examples are
notional and presented for illustrative purposes
Approved for Public Release. DoD OPSR 13-S-2927. September 2013.
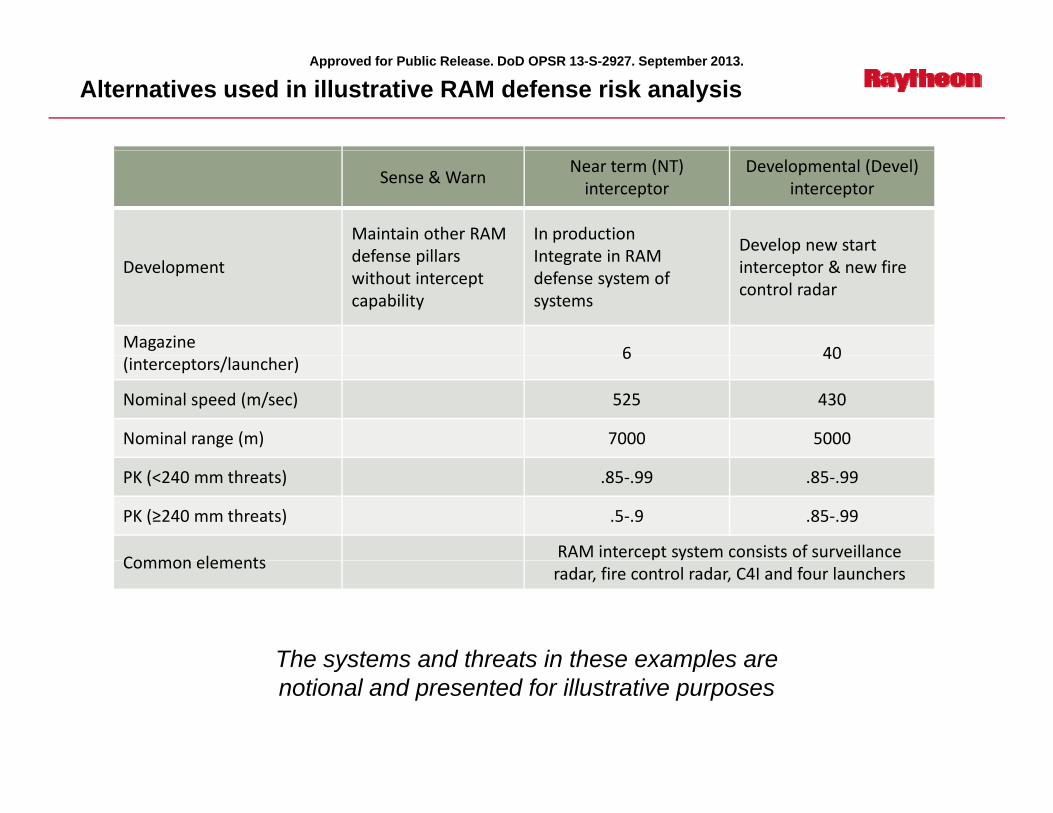
Alternatives used in illustrative RAM defense risk analysis
Sense & WarnNear term (NT) interceptor
Developmental (Devel) interceptor
Maintain other RAM defense pillars
In productionIntegrate in RAM
Develop new startDevelopment
defense pillars without intercept capability
Integrate in RAM defense system of systems
pinterceptor & new fire control radar
Magazine 6 40
(interceptors/launcher)6 40
Nominal speed (m/sec) 525 430
Nominal range (m) 7000 5000
PK (<240 mm threats) .85‐.99 .85‐.99
PK (≥240 mm threats) .5‐.9 .85‐.99
Common elementsRAM intercept system consists of surveillance
Common elementsradar, fire control radar, C4I and four launchers
The systems and threats in these examples areThe systems and threats in these examples are notional and presented for illustrative purposes

Approved for Public Release. DoD OPSR 13-S-2927. September 2013.
Error & uncertainty sources inventory
Source Description Source DescriptionSource Description
Threat size factor % of threat full strength scenario
Threat aiming Uncertainty multiplier of CEP
Source Description
Interceptor range Uncertainty scale factor of nominal range
PK Actual PK will vary from program requirementaccuracy
Threat standoff range
% between min & max range
Surveillance radar
requirement
Secondary PK NT alternative PK vs large caliber rockets
EADSIM internal sampling
PK success, threat & defense systems availability, impact points
rangeTypes of radars available in future is uncertainFire control radar
range
C3I decision time Uncertainty in time to clear
Response surface error
Errors due to DOE & interpolation
Vignette rate of occurrence
Mean occurrence rate per year
engagement
Kill assessment time Uncertainty in time to assess intercept
Simultaneous engagements
Number of interceptors in flight
% of each type vignette
Occurrence rate as % of total
Number of each type Actual number, each type of vignette over 10 years
P l t i k N b f l i d f d dengagements
FCR availability
Actual availability will differ from program requirementLauncher availability
Personnel at risk Number of personnel in defended area
Cost growth Uncertainty factors in program and ownership cost
Interceptor speed Uncertainty scale factor of nominal speed