propagation model tools using rec. itu-r p.1812 and p.1546 ... · propagation model tools using...
TRANSCRIPT

Propagation model tools using Rec. ITU-R P.1812 and P.1546
By Andrea ManaraBroadcasting Service Division
ITU HQ Geneva, 7 December, 2018

Short presentation Rec. ITU-R P.1812 and P.1546 propagation
models eTools calculations (new P.1812 fs contours!)
Demonstration of propagation calculations in eTools
Exercise session
Agenda

Comparison Rec. ITU-R P.1812 vs P.1546
Deterministic modelmodel all the physical phenomena which plays a role in VHF-UHF band
Path specificUses terrain profile (elevation above mean sea level).
30 MHz - 3 GHz 0.25 km - 3000 km 1% < time < 50% 1% < locations < 99% Rx and Tx hgt agl <= 3km
Empirical model based on extensive field measurements and statistical analysisPath generalThe effect of terrain only via:• Effective antenna height• Clearance Angle correction• Tropospheric scattering correction
30 MHz - 3 GHz 1 km - 1000 km 1% < time < 50% 1% < locations < 99% TX eff hgt <= 3km
Can be used for interference and coverage analyses!

Field-strength curves as functions of distance, antenna height, frequency and percentage time
• Land, warm sea, cold sea• 100, 600, 2000 MHz• time percentage: 1,10,50
Method • interpolation/extrapolation• mixed-path
Rec. ITU-R P. 1546
Important correction for refractivity index!!

Rec. ITU-R P. 1812
Refraction
Adapted from LS Telecom Propagation training material
Propagation mechanisms in the VHF/UHF band

eTools: Input parameters
Point to Point
Point to Area
ITU-R P.1812
Point to AreaITU-R P.1546
Environment Type

ATSC
50% locations
90% time
Coverage Analyses (wanted signal) (Report BT.2383-1)
DVB-T , DVB-T2, DTMB
95% locations
50% time
ISDB-T
95% locations
90% time
Analogue TV
50% locations
50% time
Rec. SM-851-1
Interference Analyses (un wanted signal)
50% locations
1% time
Report ITU-R BT.2383-1 (Note 19 on page 26)
Provides formula for applicability of Rec.
P.1546 for 90% of time.
WP 3K Liaison Statement to the Director BR (March
2017). The 90% formula is not generally applicable.
It errs on the conservative/safe side for the desired
signal in interference/compatibility analyses which
compare desired-to-undesired signal ratios
Reception Type
eTools: Input parameters
Percentage of time and location
N.B. If clutter heights are not given, the software uses the representative heights from Table 2
Clutter Type
Polarization

Beta Release! coverage analyses
1 degree resolution 10 degree resolution
eTools: rec. ITU-R P.1812 calculations
Point to Area

Point to Point
eTools: rec. ITU-R P.1812 calculations
Study FS variation on the path from TX to a RX point in the contours farthest from the TX in the P2A coverage analyses

GIS Analysesfield strength contours
Beta Release!
1) P.1812 vector data (location and fs)
2) Convert to raster 3) Interpolate to fill voids
4) Extract fs_wanted contour5) Simplify geometry
dB(μV/m)
OSGeo: GDAL/OGR open source libraries
6) Convert to KMZ
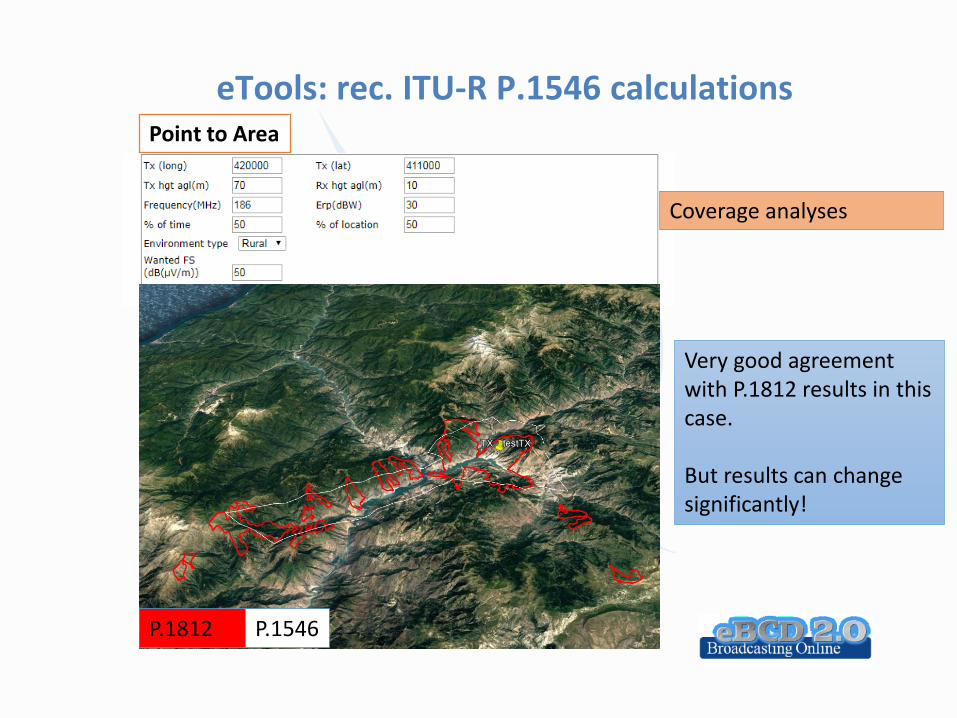
eTools: rec. ITU-R P.1546 calculationsPoint to Area
Very good agreement with P.1812 results in this case.
But results can change significantly!
P.1812 P.1546
Coverage analyses

eTools: rec. ITU-R P.1546 calculations
Very different results from P.1812!
Interference analyses
P.1812
P.1546
Point to Area

Use case: planning in Central America and Caribbean
eTools: CA_compat implements P.1546:• coverage analyses (wanted service area)• interference analyses
Terrain information considered only via effective antenna height
CA_Display: visualize compatibility analyses results and run detailed calculations
SLV
HND CNFS = 55.7 dB(μV/m)
FS = 21.9 dB(μV/m)

eTools: Rec. ITU-R P.1812 Point to Pointfield strength calculation (terrain data).
Use case: planning in Central America and Caribbean
FS = 21.9 dB(μV/m) P.1546 no terrain
FS = 13.7 dB(μV/m) P.1812 terrainThis value would bring the margin to an acceptable level!!!

Short-medium termP1546: Include terrain information
Clearance Angle and Tropospheric scattering corrections
P1812: move from 90m DEM to 30m DEMTry to reduce the time needed for
P1812P2A calculationLong termInclude more propagation models
Outlook

1.Submit a P1546P2A calculation to determine the coverage for a given service in your country. (Ex. Analogue TV: 50% time, 50% location, Emin = 55 dB(μV/m) in band III (162-230 MHz)
2.When the calculation completes (an e-mail will be sent to your e-mail account), analyze the resulting field strength contour using Google Earth.
3.Do you think terrain consideration would modify the results?4.Take a point at the edge of the coverage area where terrain should have
played a role. 5.Submit a corresponding P1812P2P calculation6.Which values of the FS do you obtain? How does it compare with P1546
results?7.Share the job with one or more of your neighbors. Verify that your neighbors
can access your test data.
Workshop exercise
