proper orthogonal decomposition as a technique for...
TRANSCRIPT

This is a repository copy of Proper Orthogonal Decomposition as a technique for identifying two-phase flow pattern based on electrical impedance tomography.
White Rose Research Online URL for this paper:http://eprints.whiterose.ac.uk/106694/
Version: Accepted Version
Article:
Polansky, J and Wang, M (2017) Proper Orthogonal Decomposition as a technique for identifying two-phase flow pattern based on electrical impedance tomography. Flow Measurement and Instrumentation, 53 (Part A). pp. 126-132. ISSN 0955-5986
https://doi.org/10.1016/j.flowmeasinst.2016.10.004
Crown Copyright © 2016 Published by Elsevier Ltd. Licensed under the Creative Commons Attribution-NonCommercial-NoDerivatives 4.0 International http://creativecommons.org/licenses/by-nc-nd/4.0/
[email protected]://eprints.whiterose.ac.uk/
Reuse
Unless indicated otherwise, fulltext items are protected by copyright with all rights reserved. The copyright exception in section 29 of the Copyright, Designs and Patents Act 1988 allows the making of a single copy solely for the purpose of non-commercial research or private study within the limits of fair dealing. The publisher or other rights-holder may allow further reproduction and re-use of this version - refer to the White Rose Research Online record for this item. Where records identify the publisher as the copyright holder, users can verify any specific terms of use on the publisher’s website.
Takedown
If you consider content in White Rose Research Online to be in breach of UK law, please notify us by emailing [email protected] including the URL of the record and the reason for the withdrawal request.
Proper Orthogonal Decomposition as a technique for
identifying two-phase flow pattern based on Electrical
Impedance Tomography
Jiri Polansky, Mi Wang
School of chemical and process engineering, University of Leeds,LS2 9JT, UK
Abstract
Collecting very large amount of data from experimental measurement is acommon practice in almost every scientific domain. There is a great need tohave specific techniques capable of extracting synthetic information, whichis essential to understand and model the specific phenomena. The ProperOrthogonal Decomposition (POD) is one of the most powerful data-analysismethods for multivariate and nonlinear phenomena. Generally, POD is a pro-cedure that takes a given collection of input experimental or numerical dataand creates an orthogonal basis constituted by functions estimated as the so-lutions of an integral eigenvalue problem known as a Fredholm equation. Byutilising POD to identify flow structure in horizontal pipeline, specially, forslag, plug and wavy stratified air-water flow regimes, this paper proposes anovel approach, in which POD technique extends the current evaluation pro-cedure of electrical impedance tomography applied on air-water flow measure-ment [32] . This extension is provided by implementation of the POD as anidentifier of typical horizontal multiphase flow regimes. The POD snapshotmatrices are reconstructed for electrical thomography measurement domainand specific flow conditions. Direct POD method introduced by Lumley andSnapshot POD method introduced by Sirovich are applied. It is expectedthat this study may provide new knowledge on two phase flow dynamicsin a horizontal pipeline and supportive information for further prediction ofmultiphase flow regime.
Email addresses: [email protected] (Jiri Polansky),[email protected] (Mi Wang)
Preprint submitted to Flow Measurement and Instrumentation August 3, 2016

Keywords: Proper orthogonal decomposition, Two-phase flow, Multiphaseflow regime, Electrical Impedance Tomography, Electrical CapacitanceTomography
1. Introduction
1.1. Classification and applications
Considering a gas-liquid two phase flow [35], the liquid and gas are re-garded as the continuous and dispersed phases respectively [7]. Gas-liquidflows are commonly observed in many industrial processes such as oil and gas[14, 33], chemical and pharmaceutical [10, 16, 19], transportation [20] and nu-clear industries [11, 8]. The relative distribution of the gas and liquid phasescan take many different configurations depending on the process conditions,such as the flow rates of the gas and liquid. The configuration of the gas andliquid phases is known as the flow regime [38]. The flow regime describes thepattern of the inner structure of the flow and important hydrodynamic fea-tures such as volume fraction, phase and velocity distributions. Two phaseflow regimes are often determined subjectively using direct methods such asthe eyeballing method, high speed photography method and the radial at-tenuation method [12]. Empirical flow regime maps such as the Baker chart[2, 34] are commonly used for approximate and rapid identification of theflow regime under specific operating conditions. However, due to their ap-proximate and subjective nature these techniques are not able to identifythe prevalent multiphase flow regime with the required degree of accuracy.Statistical analysis of the signal has also been used for identification of flowregimes [13].
1.2. Flow pattern prediction
The prediction of flow patterns for fully developed gas-liquid flows typ-ically employ mechanistic models that use different pressure drop and voidfraction estimation procedures for each flow pattern [17, 28] . Accurate pre-diction of heat transfer, void fraction and pressure drop in gas-liquid flow isimportant in the design and optimisation of the unit operations dealing withsuch systems [21]. Therefore different flow regimes require specific modellingequations to predict their respective transfer properties [4]. Hence in order toproduce a reliable design for a multiphase system it is imperative to be ableto accurately determine the prevalent flow regime. In the recognition of the
2
prevalent flow pattern one must consider the relative quantities of the phasesand the topology of their interfaces [34]. In two phase flow many other flowregimes are possible such as; stratified flow, bubbly flow, slug flow, plug flowand annular flow among others. The flow regime that is active depends on anumber of factors; the fluid transport and material properties, flow rates, flowdirection (co-current or counter-current), the shape and size of the conduitand the orientation (horizontal or vertical) [22]. Considering the orientationof the flow, due to differences in the densities of the phases, vertical flow pat-terns are different to those obtained in horizontal flow. An intrinsic differencebetween the two orientations is that horizontal flow patterns are generallynot axisymmetric. Because of this the measurement of gas/liquid multiphaseflow in horizontal pipes is inherently more difficult than that in vertical pipesdue to the flow regimes experienced in the former configuration. Therefore,this study focuses on horizontal gas-liquid flow in pipes.
1.3. Horizontal flow regimes
Typical flow regimes obtained in horizontal gas-liquid multiphase flowsare stratified flow, wavy stratified flow, slug flow, plug flow, bubble flow andannular flow [41]. In the bubble flow regime the bubbles are located near thetop of the pipe due to buoyancy effects. Increasing the superficial velocity ofthe gas will promote the coalescence of the bubbles resulting in plug flow. Afurther increase in the superficial gas velocity will cause the gas plugs to forma continuous layer of gas above liquid resulting in a smooth interface betweenthe gas and liquid which is termed stratified flow. In this flow regime thegas will move at a higher velocity than the liquid due to the lower viscosityand density of the gas phase. Once again increasing the superficial velocityof the gas will increase the interfacial stress and create wave flow. A furtherincrease in the gas flow rate will result in waves that are able to bridge thetop of the pipe and hence produce large slugs of air in the top section ofthe pipe and this is known as slug flow. At extremely high superficial gasvelocities annular flow is achieved whereby a thin liquid film flows along thepipe wall surrounding a centralised core of gas. A further increase in the gasflow rate will result in the formation of spray flow where the liquid phase isdistributed as small droplets within the gas phase [19].
1.4. Flow dynamics structure identification
In order to better understand the fluid dynamic nature of Gas-liquid flowsthis paper focuses on flow regimes and pressure drop identification using
3

statistical approaches based on Proper Orthogonal decomposition. POD isused to identify the flow dynamics structure in the tomography dataset.Fundamentals of physical, mathematical and numerical models of horizontalflow regimes recognition are developed and presented. Developed statisticalmethod exploits the fact that specific flow condition of specific gas and liquidphases thermophysical properties generate the unique and measurable flowinstabilities. To recognise gas-liquid flow instabilities which is caused bydifferent phase density, viscosity, surface tension and velocity, means indeedthe recognition of the prevalent regime moreover indicates the actual flowconditions of the monitored area. POD techniques allow to disassemble thecomplex flow dynamics structures acquired via tomography technology tothe fundamental dynamics structures.
2. Approach
The intention of developing a method for recognition of flow regime usingdecomposition mathematical technique comes from the fact that each regimeis characterised by typical dynamic behaviour [24]. To recognise the flow dy-namic structures, means indeed the recognition of the prevalent regime more-over indicates the actual flow conditions of the monitored area. The mainaim of the present study is to develop a method of flow regime recognition,which is based on Proper orthogonal decomposition (POD) supplemented byLinear stochastic estimation (LSE) [1, 5]. Additionally, the basic functionsdetermined by experimental investigation serve to the database and numeri-cal model validation. The schematic diagram of the concept is illustrated inFigure 1 . The highlighted blocks in the scheme present the current state ofthe research and the contribution to the complex method. We recognise twofundamental modes of this procedure, the learning mode and flow evaluationmode. The learning mode consists of the following tasks:
1. Provide experimental multiphase flow measurement for specific flowconditions.
2. Electrical conductivity respectively electrical permittivity of mixture.
3. Mass flow rates, viscosity, pressure and temperature data acquisition.
4. Tomography images reconstruction.
5. POD analyses of tomography images, respectively RAW data.
6. Collect and store POD modes into POD database.
7. Analyse the POD modes from theoretical fluid dynamics point of view.
4
8. Frequency and statistical analysis, detection of various flow instabilitymechanisms.
9. Coupling of the results with POD modes and specific flow conditions.
With a sufficiently extensive POD database the developed method couldbe operate on the second, flow evaluation mode. This one is consist of thefollowing tasks:
1. Provide multiphase flow measurement for unknown flow conditions.
2. Tomography data acquisition.
3. The thermo-physical fluid properties must be known or predicted (pres-sure, viscosity, temperature).
4. Concentration images reconstruction.
5. Concentration images, respectively unfiltered RAW data, POD analy-ses.
6. Actual POD modes comparing with POD database.
7. POD modes similarity recognition, flow instability identification.
8. Flow conditions, respectively flow patterns estimation.
2.1. Image reconstruction
The typical input data sets for POD fluid dynamics analysis are the Elec-trical resistivity tomography (ERT) or Electrical capacitance tomography(ECT) images of the phases concentration. The algorithms based on ModifiedSensitivity Back Projection, implemented as a default algorithm of IndustrialTomography Systems (ITS) software, was used for the ERT concentration es-timation of present study. The algorithms and techniques are introduced anddescribed in the literature [42, 39].
2.2. Proper Orthogonal Decomposition
Proper Orthogonal Decomposition finds applications in computationallyand experimental processing large amounts of high-dimensional data withthe aim of obtaining low-dimensional descriptions [24, 37]. Using POD, timeindependent basis functions were extracted from the EIT data and wereprojected onto the basis functions to generate reduced-order models. In thereduced-order models (ROMs) [6, 15] the large amount of experimental dataare replaced by a much smaller number of coefficients of ordinary differentialequations. These reduced-order models were applied to several referencecases; Liquid mass flow rate between 1 − 1000 kg/sm2, gas mass flow rate
5
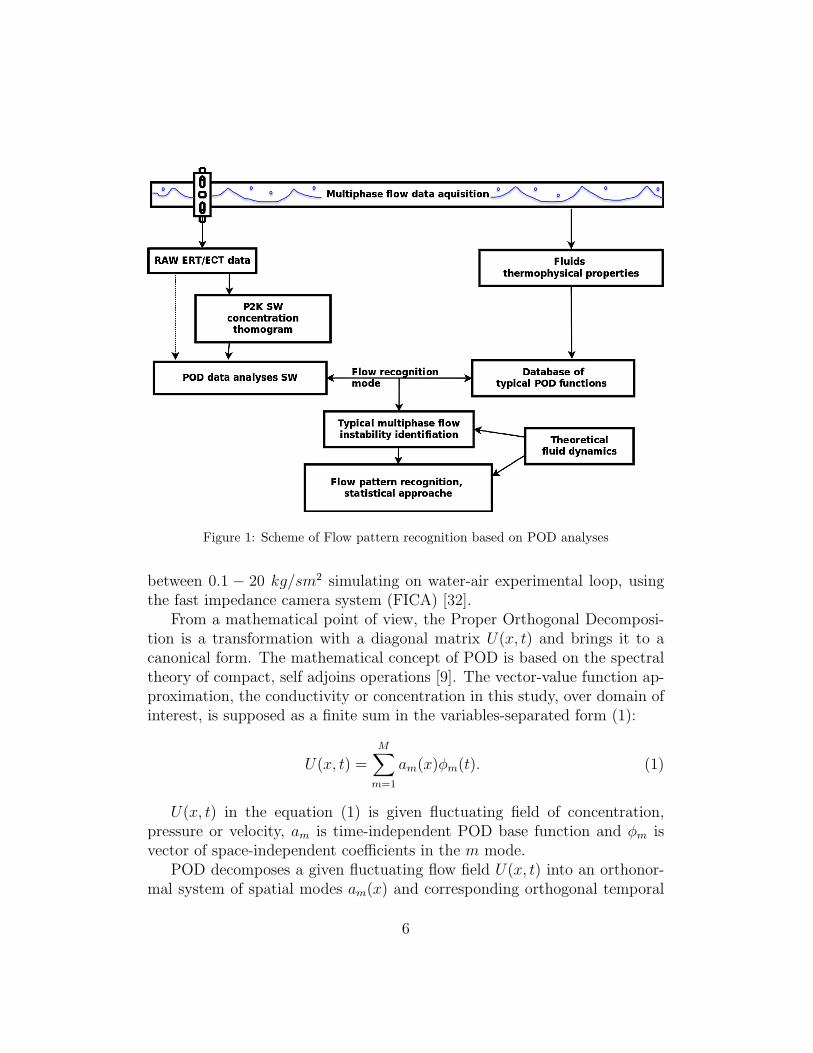
Figure 1: Scheme of Flow pattern recognition based on POD analyses
between 0.1 − 20 kg/sm2 simulating on water-air experimental loop, usingthe fast impedance camera system (FICA) [32].
From a mathematical point of view, the Proper Orthogonal Decomposi-tion is a transformation with a diagonal matrix U(x, t) and brings it to acanonical form. The mathematical concept of POD is based on the spectraltheory of compact, self adjoins operations [9]. The vector-value function ap-proximation, the conductivity or concentration in this study, over domain ofinterest, is supposed as a finite sum in the variables-separated form (1):
U(x, t) =M∑
m=1
am(x)φm(t). (1)
U(x, t) in the equation (1) is given fluctuating field of concentration,pressure or velocity, am is time-independent POD base function and φm isvector of space-independent coefficients in the m mode.
POD decomposes a given fluctuating flow field U(x, t) into an orthonor-mal system of spatial modes am(x) and corresponding orthogonal temporal
6

coefficients φm(t). This basis is optimal in the sense that a truncated seriesexpansion of the data in this basis has a smaller mean square truncationerror than a representation by any other basis. The POD provides a natu-ral ordering of the spatial modes by measure of their mean square temporalamplitude, such as kinetic energy in the case of velocity field [26]. In conjunc-tion with the Galerkin method a system of ordinary differential equations,called the Galerkin system, can be derived for the temporal evolution of thetemporal amplitudes.
Considering dimension of the tomography data matrix, the experimentaldata preferable uses direct POD approach, which is developed by Lumley[25]. In this case the average is temporal and evaluated as an ensembleaverage, based on the assumptions of stationary and ergodicity. On the otherhand, the variable U(x, t) is assimilated to the space variable x = (x, y, z)defined over the domain of interest (two measurement EIT planes consist ofthe 360 cells). In order to estimate the set of POD basis functions, Pythonparallel library MODRED [3] is used. The fundamental characteristics of thecalculation procedure are as follow:
• Collect, order and store the concentration vectors U(x, t) = [ui(x)], foreach frame of data acquisition i = 1,....,it.
• Compute each entry of the it × it correlation matrix H via [H]i,j =〈ui, uj〉.
• Compute the eigenvalues and eigenvectors of correlation matrix, writingHX = XΣ, where eigenvalues Σ is diagonal and real, eigenvector X isorthogonal, since H is symmetric.
• Sort the eigenvalues and corresponding eigenvectors in descending or-der.
• Select the number of modes M , truncate the matrices, keeping the
first M columns of X to obtain XM , and the first M rows and columnsof Σ to obtain ΣM .
• Compute the matrix of modes A = XM Σ−1/2M .
• Construct corresponding temporal coefficients φ individually via (2)
7

φm(t) =it∑
i=1
ui(x)[A]Ti,m, m = 1, ....M. (2)
φm in the equation (2) is temporal POD coefficients of the m mode, ui is thetemporal component of fluctuating field of concentration vector U(x, t) of iframe and A is the vector of time-idependent POD function.
The different number of modes is tested, M ∈ (3− 20) . The recon-structed image shows the dominant role of the first few modes. POD canbe applied for flow regime recognition using reduced number of modes (3modes), unlike the identification of fluid dynamics behaviour, in in whichhigher number of modes is required.
2.2.1. Direct versus Snapshot approach
The fundamental questions of the POD approach choice are: the inputdata collection, the inner product, the averaging operation (spatial or tem-
poral) and the variable ~X (spatial ~x = (x, y, z) or temporal t) .Schematic view of Direct and Snapshot approaches application for process
tomography data are shown on the Figure 2. In Classical direct method, theaverage operator < ∗ > is temporal. The snapshot POD method, whichis developed by Sirovich [31], is exact symmetry of the classical POD. Theaverage operator < ∗ > is evaluated as a space average over the domain ofinterest.
The snapshot approached is tested for experimental multiphase flow dataas an alternative POD method, however the snapshot approach is more suit-able for data of numerical investigation with regard to the typical correlationmatrix size.
2.3. Repeatability of developed approach
POD base functions database is developed for the specific device configu-ration and flow conditions. The function database should be used for patternestimation exclusively inside the known flow conditions area. Tomographydevice settings and configuration, such as sample frequency, geometry andnumber of electrodes, type of resistance network, algorithm of image recon-struction should correspond with reference measurements.
8

Figure 2: Schematic view of Direct (left) and Snapshot (right) POD approaches
The POD approach is basically incapable to recognise caution of flowinstabilities itself. The POD algorithm decompose the signal and order thefunction according the actual relevance of dynamics structures. The flow in-stabilities caused by different mechanics change the importance for differentflow conditions. It means, the same mechanism could occupy the differentbase functions position and must be recognised manually by experimental-ist. This additional information accompanies the function database and it isunique for given flow condition area.
2.4. Liquid-gas flow test rig
The experiments were carried out in a flow loop built at the Universityof Leeds with a 3.0 m long, 50 mm internal diameter, transparent, verti-cal and horizontal working section, which is shown in Figure 3. Air wasintroduced into the base of the working section via a central tube inside aY tee. A thermometer was used to provide continuous monitoring of thewater temperature. Two differential pressure sensors for measuring the dif-ferential pressure drop were placed along the column at around 2.5 m abovethe air distributor. The water volumetric flow rate Qw , varying from 0 to1.94 × 103 m3/s and the air volumetric flow rate Qa , varying from 0 to1.67× 104 m3/s were measured separately through a turbine flowmeter anda gas flow controller before they were mixed together. An EIT sensor with16 electrodes was mounted in the inner wall of the column. The electrodes
9

Figure 3: Liquid (water) - gas (air) experimental flow loop
were made of stainless steel with a contact area of 8 mm (width) by 16 mm(height). The data collection rate was 800 frames/s with an excitation signalfrequency of 10.0kHz.
2.5. Measurement matrix
The present POD method is tested via EIT and ECT data sets of hori-zontal and vertical pipeline orientation, two or three phase flow. The mea-surement points used for present study are shown on the Figure 4. The flowmap shows 10 variants of horizontal water-air flow configuration covered thePlug, Slug and Stratified flow regimes, see Figure 5, stacked concentrationtomogram on centerline cross-section of 2 inch pipeline.
3. Result and discussion
3.1. Results
Different flow regimes can be characterised through different structureof flow dynamics. In other words, each mode of POD can be used to rep-resent the prevalent flow regime within the pipeline, as shown in Figure 6.The estimation of the first dominant basic functions enables, with certain
10
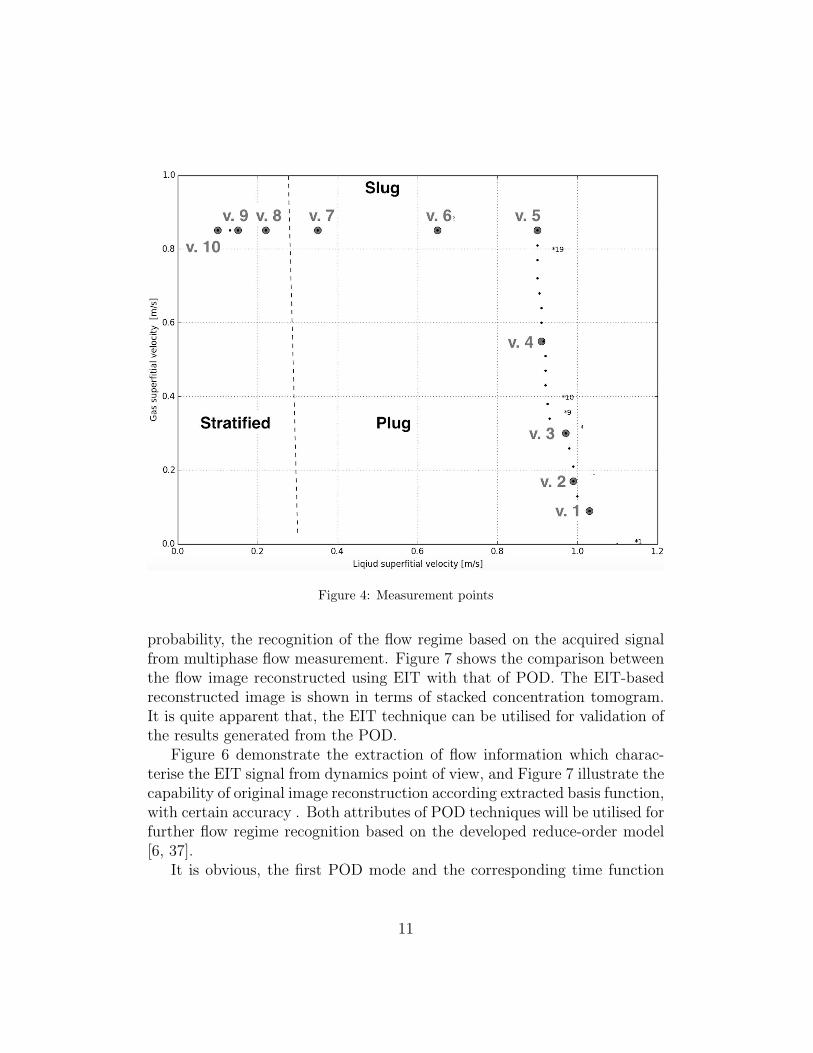
Figure 4: Measurement points
probability, the recognition of the flow regime based on the acquired signalfrom multiphase flow measurement. Figure 7 shows the comparison betweenthe flow image reconstructed using EIT with that of POD. The EIT-basedreconstructed image is shown in terms of stacked concentration tomogram.It is quite apparent that, the EIT technique can be utilised for validation ofthe results generated from the POD.
Figure 6 demonstrate the extraction of flow information which charac-terise the EIT signal from dynamics point of view, and Figure 7 illustrate thecapability of original image reconstruction according extracted basis function,with certain accuracy . Both attributes of POD techniques will be utilised forfurther flow regime recognition based on the developed reduce-order model[6, 37].
It is obvious, the first POD mode and the corresponding time function
11

Figure 5: Stacked concentration tomogram, red = water, blue = air.
in terms of dynamic behaviour is dominant for the most of multiphase flowregimes, see Figure 8, first three modes of time function φ. However, for theflow pattern recognition is eligible to analyse more than first mode, becausedifferent modes seems to be the carrier of different scale of flow instabilitiesgenerated by the various physical mechanisms. Especially the frequency anal-ysis of the time functions allow us to identify the different flow instabilitieswhich are recognised and record by the EIT measurement and decomposedby the POD analysis. The POD provides the study of instability on thedifferent temporal and spatial scales. Another techniques capable to analysethe experimental data sets, especially time variable signal, from dynamicspoint of view is wavelet transformation [15].
12

Figure 6: Normalised POD Basis functions of specific flow regimes, 1 mode
3.2. Conditions and limits of the POD method
There are two basic characteristics of a flow pattern, the degree of sep-aration of different concentrations and level of intermittency in the volumefraction. Both important parameters could be determined by using a differ-ent approaches to analyse the tomography data, such as a Neural network[23], Boolean logic analysis [29], stochastic flow modelling [30] and manyothers. The presented methods is based on the recognition of the typicaldynamic coherent structures in the fluid mixture. The sufficient time andspatial resolution of the measurement method is one of the fundamentalsprerequisite for successful specific flow instabilities recognition. The typicalfrequency of multiphase flow instabilities must be predicted before data ac-
13

Figure 7: Comparison of the POD-based reconstructed image with that of the EIT forhorizontal plug flow
quisition and that fact affects the choice of the sampling frequency. UsedFast impedance camera system with the frequency up to 1 kHz could besufficient for superficial gas and liquid velocity up to 20 m/s.
3.3. Error analyses
The accuracy of POD reconstruction is strongly depends on the numberof POD modes and flow conditions. The comparison of relative and absoluteerror for 3 and 4 modes reconstruction are shown on the Figure 9. Theerrors are calculated for 8000 frames (10s data acquisition). It is obvious,the reconstruction involving the fourth POD mode causes the reduction ofthe errors on the half, approximately. The accuracy of the measured signalreconstruction relates to the capability to use POD for data filtering andcompressing as well as an order of multiphase flow model reducing.
14

Figure 8: Normalised space independent functions φ(t) of horizontal Slug flow regime,comparison of first three modes
15

Figure 9: Relative and absolute error analyses of POD data reconstruction, left: the firstthree modes, right: the first four modes
16

4. Conclusions
Two-phase gas-liquid flow regime recognition using any decompositiontechnique could be promising methods for EIT data post-processing. Theproposed method is based on typical fluid dynamic structure and instabilityrecognition on the flow measurement, which is based on POD. The appli-cation of the method is based upon the database of typical basis functions.The database could be developed by multiphase flow experimental and nu-merical modelling and implementing the theory of multiphase flow instability[40]. The proposed method could be used to validate the numerical modelsbased on Large eddied simulation or Direct simulation approaches [36]. Also,to test and validate the established databases of typical basis functions forhorizontal gas-liquid flow, reported elsewhere [27].
A part of the present procedure is signal filtering of the electronic de-vices noise and noise induced by electrical tomography signal reconstructionalgorithm. In principle, this filtering could be as part of the POD meth-ods. However, this can work quite well if the estimated different POD modesare assigned for different types of dynamic behaviour. In other words, i.e.the external noise is clearly distinguished from fluid dynamics phenomena,otherwise, the filtering has to be performed separately from POD.
The accuracy of flow regime identification is depends on the frequency ofthe data obtained from the of electrical tomography systems. This impliesthat, the flow regime recognition can not be carried out on-line accordingto the principle of the statistical decomposition techniques. The speed offlow regime recognition depends on the number of frames acquired from thetomography system, and this number of the frames should take into accountall flow dynamic features related to the active flow regime. Nevertheless, themethod returns the preliminary information on regime identification, andthe higher the number of frames is, the more accurate identification of theregime can be achieved. Further increase the number of measured frameswill apparently increase the time length of POD evaluation.
The different POD approaches, direct versus Snapshot method, optimaltime of evaluating record, total number of evaluated POD mode, optimalsize of snapshot matrix, the number of modes used for estimation process,signal filtering, and dependencies of estimation accuracy of all mentionedparameters, is the subject of the present and complex future study.
17
5. Acknowledgement
This research was supported by European Association of National Metrol-ogy Institutes, project ENG58, Multiphase flow metrology in oil and gasproduction.
6. References
[1] Adrian R.J., On the role of conditional averages in turbulence theory,In J. L. Zakin & G. K. Patterson, editor, Turbulence in Liquids, pp.323-332, 1977
[2] Baker D., Simultaneous Flow of Oil and Gas, Oil and Gas J, 53, pp183-195., 1954
[3] Belson B.A., TU J.H., Rowley C.W., A parallelized model reductionlibrary, Princeton University, 2013
[4] Bertola V, Modelling and experimentation in Two-Phase Flow, Springer-Verlag Wien New York in 2003, ISBN 978-3-211-20757-4, ISBN 978-3-7091-2538-0 (eBook) DOI 10.1007/978-3-7091-2538-0
[5] Bonnet J.P., Cole D.R., Stochastic Estimation and proper orthogo-nal decomposition: Complementary techniques for identifying structure,Experiments in Fluid 17, 1994
[6] Brenner T.A., Practical Aspects of the Implementation of Reduced-Order Models Based on Proper Orthogonal Decomposition Texas A&MUniversity, PhD theses, 2011
[7] Brenner C.E., Fundamentals of Multiphase Flows, California Institute ofTechnology Pasadena, Cambridge University Press, ISBN 0521 848040,2005
[8] Coppolani P., Hassenboehler N., Joseph J., La chaudiere des reacteursa eau sous pression, ISBN: 2-86883-741-7 Paris, 2004
[9] Courant R., Hilbert D., Methods of mathematical physics, Vol. 1 JohnWiley & Sons, New-Yourk, 1953
[10] Cora J., Ordonez S. Diaz E., Mass Transfer Operations: AbsorptionAnd Extraction, Encyclopedia of Life Support Systems
18

[11] Delhaye J.M., Thermohydraulique des reacteurs, ISBN 13:9782759810949, Paris, 2008
[12] Deng, X, et al. (2001), The design of a dual plane ERT system forcross correlation measurement of bubbly gas/liquid flow. MeasurementScience and Technology. 2001, Vol. 12, pp. 1024-1031.
[13] Faray, Y., Wang, M. Jai, J., Automated horizontal slurry flow regimerecognition using statistical analysis of the ERT signal. Journal of Pro-cedia Engineering. 102, pp. 821-830, 2015
[14] Freese T. L.& Associates, Inc., The Transportation of Petroleum andDerived Products in the American Market, 2006
[15] Gordeyev S., POD,LSE and Wavelet decomposition: Literature Review,University of Notre dame
[16] Halvorsn I.J., Skogestad S., Distillation Theory, Norwegian Universityof Science and Technology, 2000
[17] Hewitt G.F., Roberyson D.N., Studies of Two-Phase Flow Patternsby Simultaneous X- ray and Flash Photography, Rept AERE-M2159,UKAEA, Harwell., 1969
[18] Hewitt G.F., Empirical and Phenomenological Models for MultiphaseFlows II. Horizontal Flows, Department of Chemical Engineering Impe-rial College London, UK, 2015
[19] Holland, F A, Bragg, R., Fluid Flow for Chemical Engineers. London :Edward Arnold, 1995. pp. 219-267., 1995
[20] Energy, transport and environment indicators, Eurostat, ISBN 978-92-79-41256-1, 2014
[21] Jassim E.W., Newell T.A., CHato J.C., Probabilistic Flow Regime MapModelling of Two- phase flow. Illinois : University of Illinois, pp. 1-6.,2006
[22] Kleinstreuer C., Two-Phase Flow: Theory and Application. New York :Taylor and Francis, pp. 69-75., 2003
19

[23] Khursiah Z.-M., Junita M.-S., Hafizah T., Najwan O.-A., Flow RegimeClassification Using Artificial Neural Network Trained on Electrical Ca-pacitance Tomography Sensor Data, Computer and Information ScienceISSN 1913-8989, Vol.1, No.1, 2008
[24] Laurent C., Bergman M., Post-processing of experimental and numericaldata, POD: an overwiew, von Karman Institute for Fluid Dynamics,Lecture Series, 2003
[25] Lumley J. L. The structure of inhomogeneous turbulent flows. In Atmo-spheric Turbulence and Radio Wave Propagation (ed. A. M. Yaglom &V. I. Tartarsky), p. 166. Nauka, Moscow. 1967
[26] Luchtenburg D.M., Noack B.R., Schlegel M., An introduction to thePOD Galerkin method for fluid flows with analytical examples andMATLAB source codes, Berlin Institute of Technology, Technical Re-port 01/2009
[27] Polansky J., Wang M., Faray Y., Numerical modelling of gas-liquidflow phenomena in horizontal pipelines, 12th International Symposiumon Experimenta Computational Aerothermodynamics of Internal Flows,2015, Genova, Italy
[28] Prasser H.M. , Basic model for two-phase flows, Swiss Federal Instituteof Technology, Zurich, 2015
[29] Ramskill P.N., Wang M., Boolean logic analysis for flow regime recogni-tion of gasliquid horizontal flow, Measurement Science and Technology,Vol. 22, No. 10, , 2011
[30] Sankowski D. , Mosorov V., Grudzien K., Mass flow measurements basedon a virtual channel concept, ISSN 2164-7143, pp.274 - 279, 5th Interna-tional Conference on Intelligent Systems Design and Applications, 2005
[31] Sirovich L., Turbulence and the dynamics of coherent structures, Quar-terly of Applied Mathematics XLV, No.3., pp.561-571, 1987
[32] Ramskill N.P.; Wang M. , Measurement and recognition of gas-liquidmultiphase horizontal flow regimes using electrical resistance tomogra-phy in: 6th World Congress in Industrial Process Tomography, pp.159-167. International Society for Industrial Process Tomography,2010
20
[33] Takacs G., Gas Lift Handbook, ISBN-10: 0878148051, 2004
[34] Tilton, Jason N., Fluid and Particle Dynamics. [book auth.] Robert HPerry and Don W Green. Perry’s Chemical Engineers’ Handbook - 8thEdition. New York : McGraw Hill, 2008
[35] Thomas J. Handratty, Physics of Gas-Liquid Flows, University of Illinoisat Urbana-Champaign, ISBN 978-1-107-04120-2, 2013
[36] Triggvason G., Scardavelli R. , Zaleski S., Direct Numerical Simulationsof Gas Liquid Multiphase Flows, The volume-of-fluid method pp. 95-132,ISBN:9780511975264, 2005
[37] Volkwein, Proper Orthogonal Decomposition: Theory and Reduced-Order Modelling, University of Konstanz, lecture note, 2013
[38] Wallis G.B., One-dimensional Two-phase Flow. New York : McGrawHill. p. Chapter 1., 1969
[39] Wang M., Industrial Tomography, Systems and Applications, ISBN 978-1-78242-123-8, Elsevier 2015
[40] Yadigaroglu G., Instabilities in two-phase flow, Swiss Federal Instituteof Technology, Zurich, 2015
[41] Yixin M.,Zhichu Z., Ling-an X., Xiaoping L., Yingxiang W., Applicationof electrical resistance tomography system to monitor gas/liquid two-phase flow in a horizontal pipe. Flow Measurement and Instrumentation.2001, Vol. 12, pp. 259-265.
[42] Yang W. Q., Lihui Peng Image reconstruction algorithms for electricalcapacitance tomography, Measurement Science and Technology, 0957-0233-14-1-201, 2003
21