properties of life what characteristics do living creatures have in common?
TRANSCRIPT
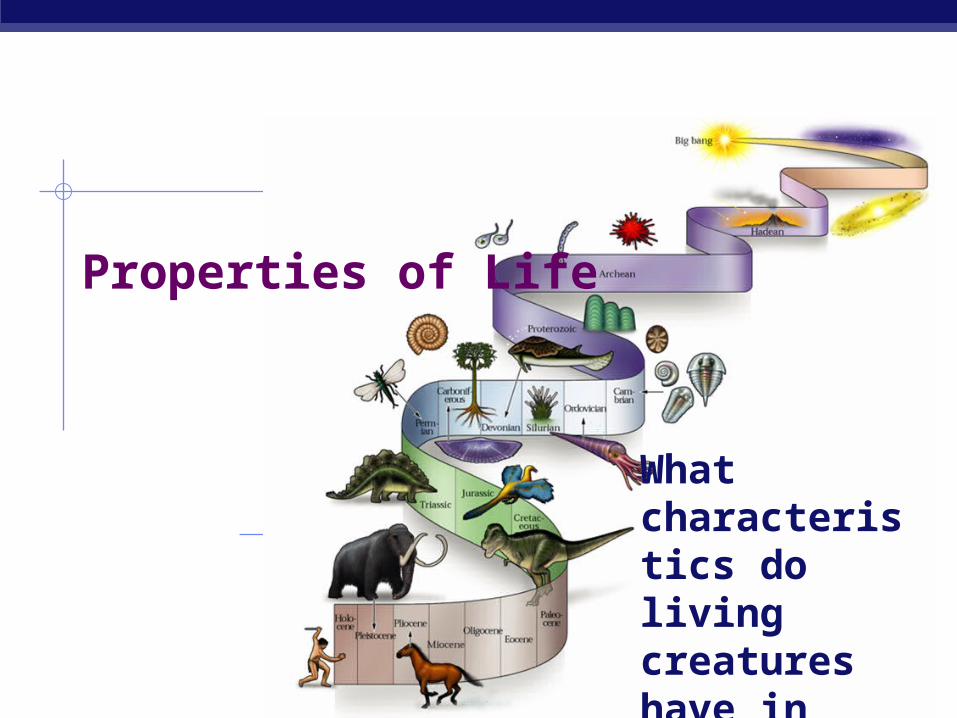
Properties of Life
What characteristics do living creatures have in common?
carbohydrates proteins
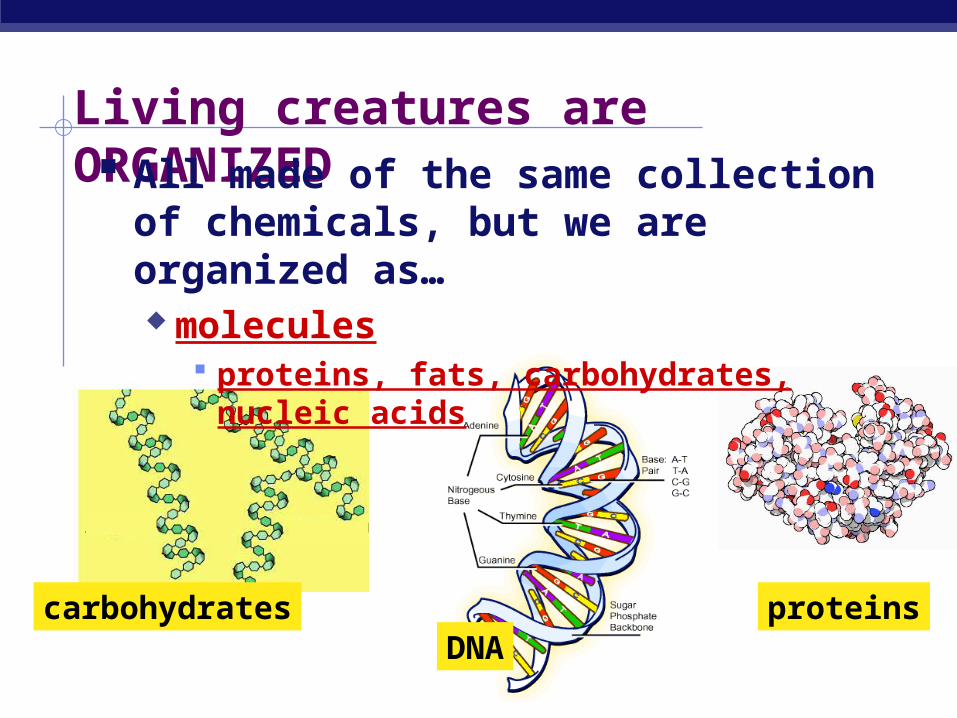
Living creatures are ORGANIZED All made of the same collection of
chemicals, but we are organized as… molecules
proteins, fats, carbohydrates, nucleic acids
DNA
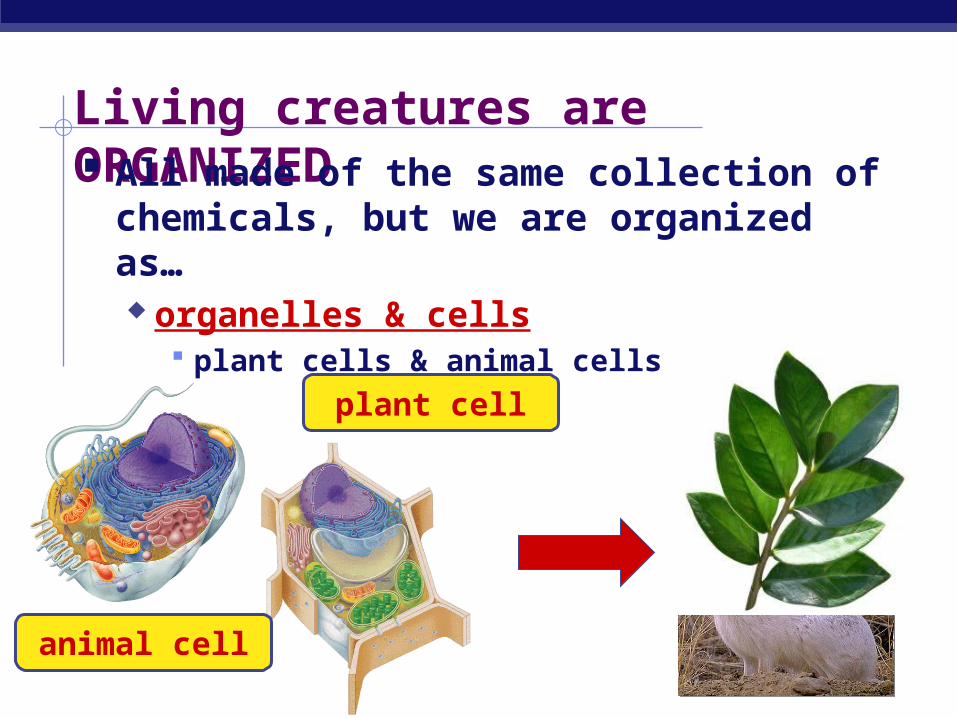
Living creatures are ORGANIZED All made of the same collection of
chemicals, but we are organized as… organelles & cells
plant cells & animal cells
animal cell
plant cell
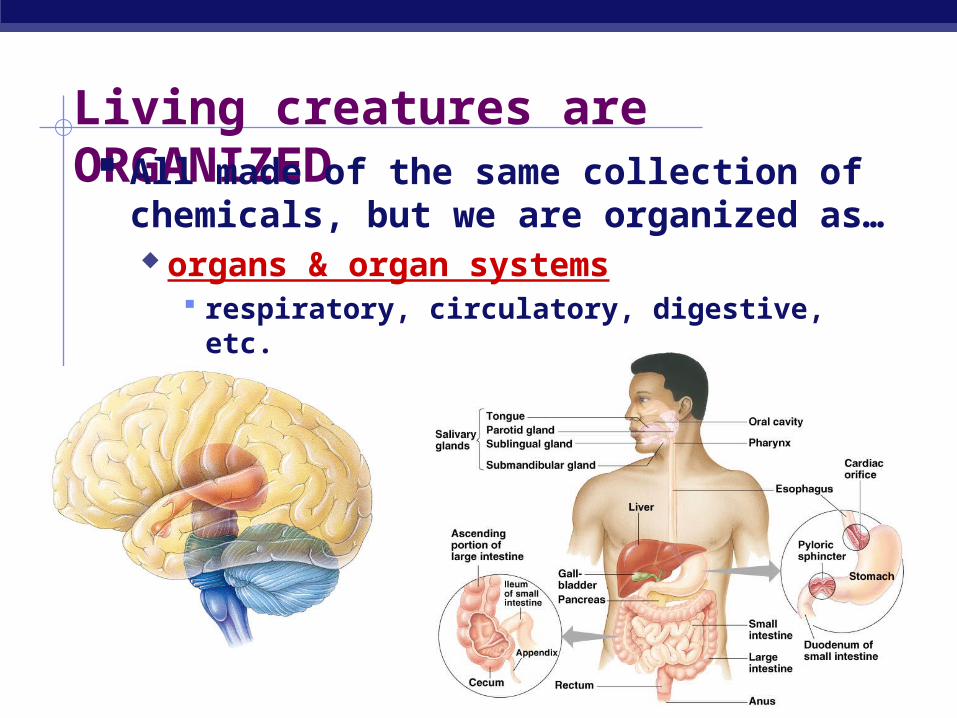
Living creatures are ORGANIZED All made of the same collection of
chemicals, but we are organized as… organs & organ systems
respiratory, circulatory, digestive, etc.
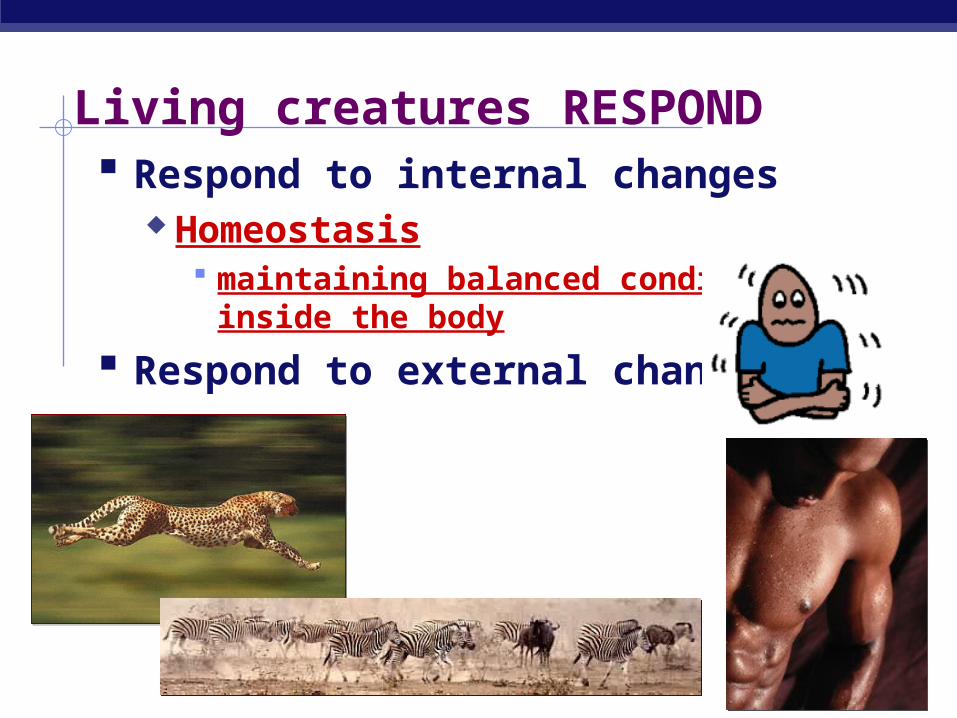
Living creatures RESPOND Respond to internal changes
Homeostasis maintaining balanced conditions inside the
body
Respond to external changes
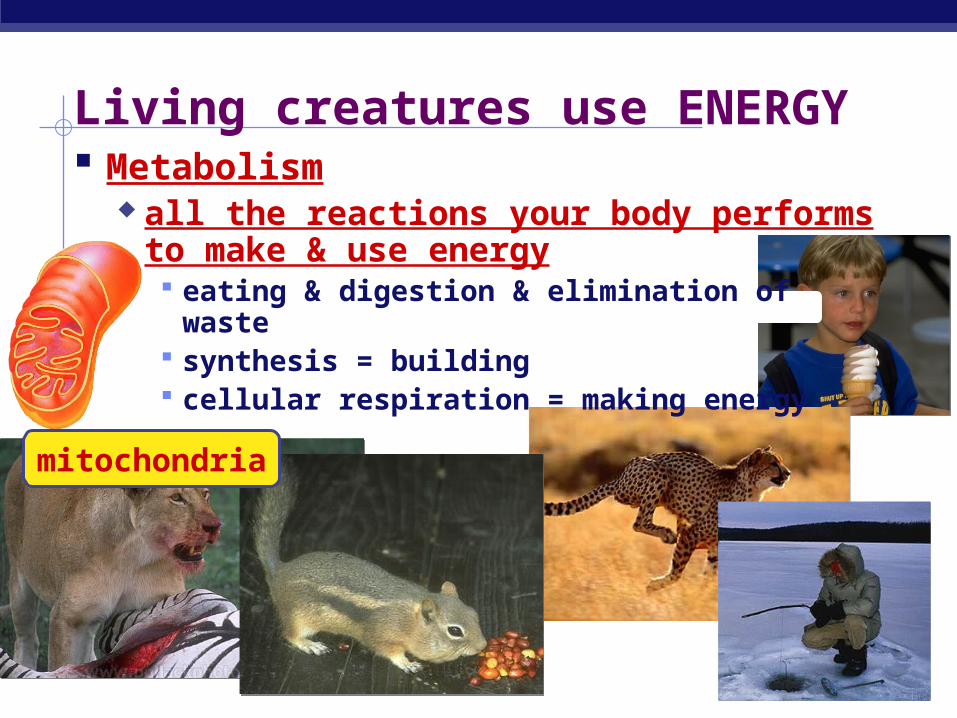
Living creatures use ENERGY
mitochondria
Metabolism all the reactions your body performs to
make & use energy eating & digestion & elimination of waste synthesis = building cellular respiration = making energy
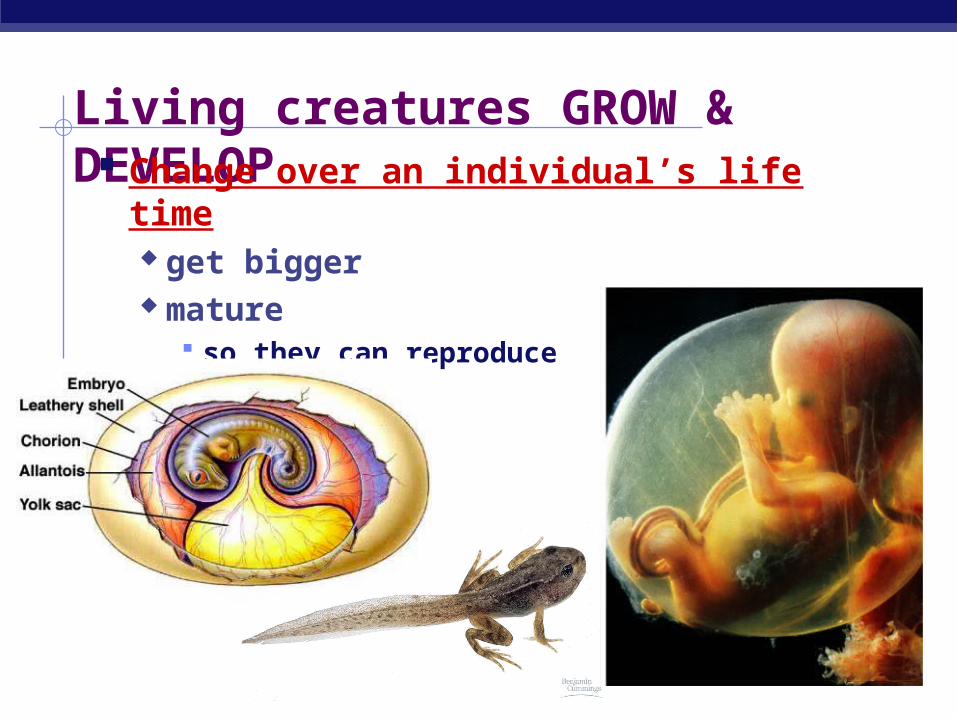
Living creatures GROW & DEVELOP Change over an individual’s life time
get bigger mature
so they can reproduce
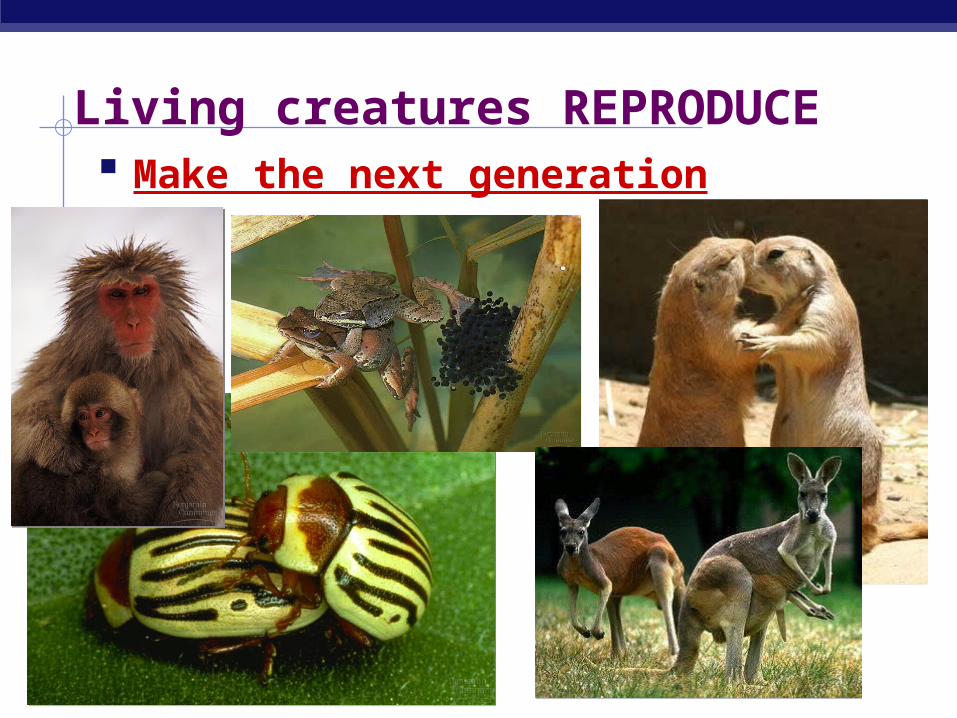
Living creatures REPRODUCE Make the next generation
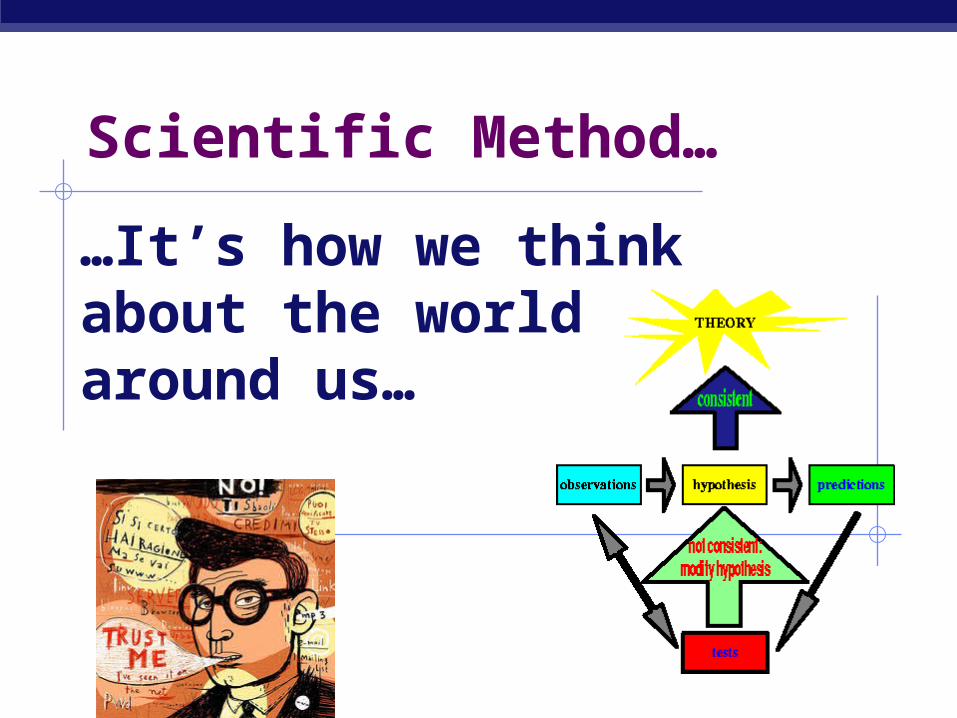
Scientific Method…
…It’s how we think about the world around us…
Scientific Method is…An organized approach to asking
questions and making discoveries.The way that scientists (and many non-
scientists) think about problems that they encounter.
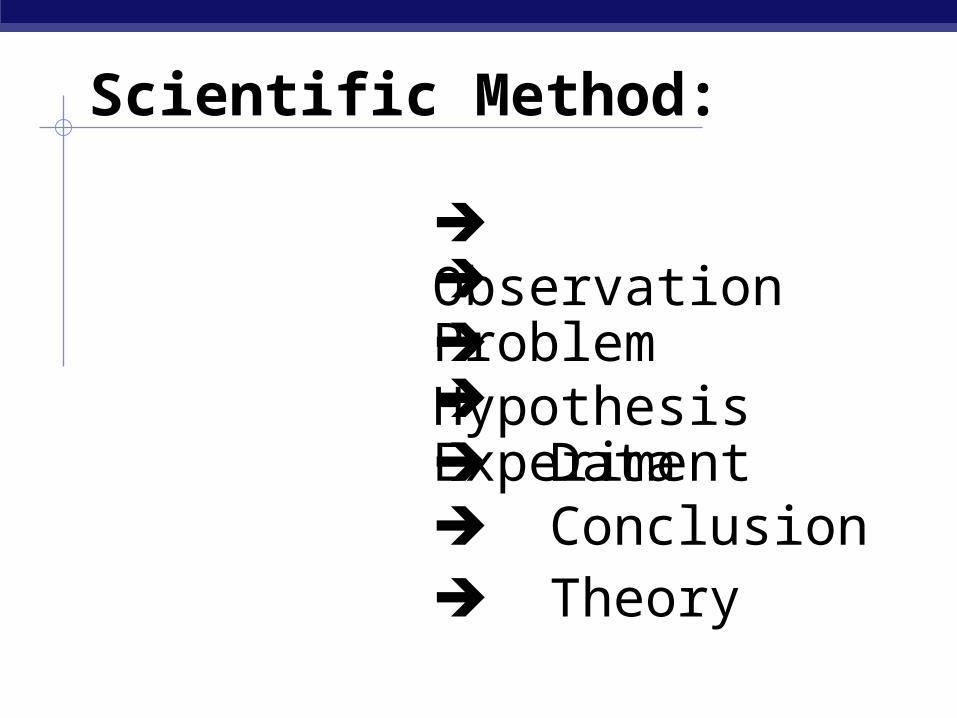
Scientific Method:
Observation Problem Hypothesis Experiment Data Conclusion Theory

Observations:
Information gathered using the five senses oror tools
Problem:
A question one might ask based on the observations that are made.
Hypothesis
A possible explanation of the problem that we wish to test. (it doesn’t have to be correct!!)
Many hypotheses can be made – they predict the outcome of an experiment.
hypothesis.gif
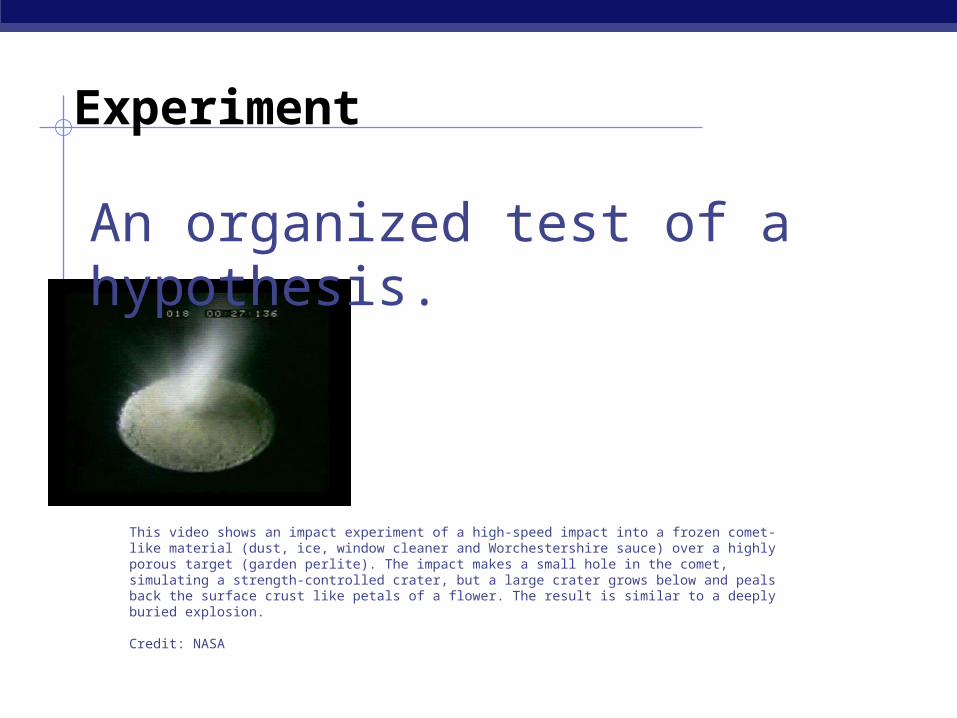
Experiment
This video shows an impact experiment of a high-speed impact into a frozen comet-like material (dust, ice, window cleaner and Worchestershire sauce) over a highly porous target (garden perlite). The impact makes a small hole in the comet, simulating a strength-controlled crater, but a large crater grows below and peals back the surface crust like petals of a flower. The result is similar to a deeply buried explosion.
Credit: NASA
An organized test of a hypothesis.
Data
The results of experiments. Data can be expressed as numbers or descriptions.
Example: the elephant is 3 meters tall.
Conclusion
What has been learned from the experiment.
Conclusions are supported by data.
Theory
A broad explanation of natural events that is strongly supported by a body of evidence - time tested by many people.
Example: The theory of gravity
Some other scientific method terms…
Inference – a possible explanation based on an observation.
Opinion – What someone thinks about something. We try to keep this out of science!
Some other scientific method terms…
Control – What we compare our data against. (usually helps to show what we already know)
Some other scientific method terms…Variable – that which is
manipulated in an experiment to get a result.
Some other scientific method terms… Independent Variable – When this
changes, it results in change in the other variable.
Dependent Variable - That which changes as a result of a change in the ind. Variable.
Validity:A good experiment should….Be easily repeatable.Have a large sample size Control
for as many variables as possible.
Graphing Your Data
Showing patterns & trends
A picture is worth a
thousand words!
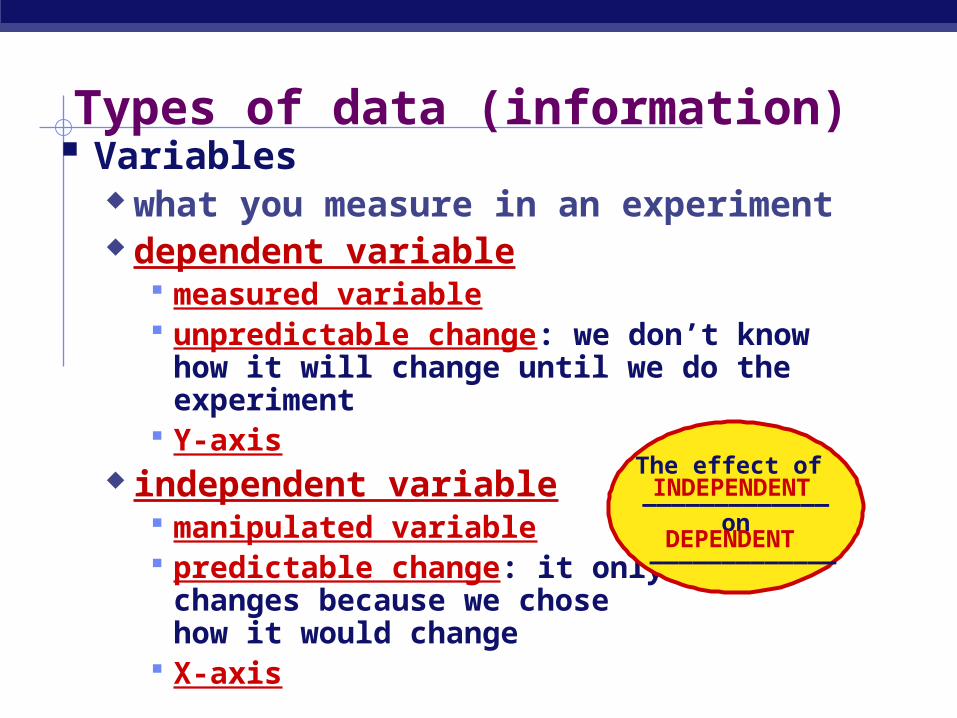
Types of data (information) Variables
what you measure in an experiment dependent variable
measured variable unpredictable change: we don’t know how it
will change until we do the experiment Y-axis
independent variable manipulated variable predictable change: it only
changes because we chose how it would change
X-axis
The effect of _____________
on _____________
INDEPENDENT
DEPENDENT
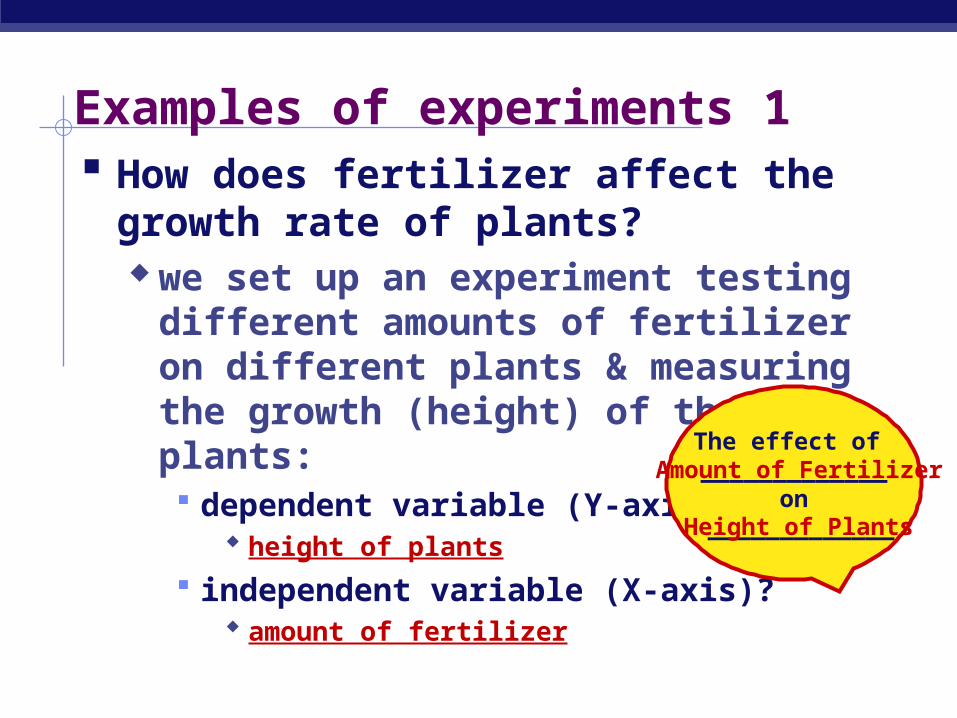
Examples of experiments 1 How does fertilizer affect the growth rate
of plants? we set up an experiment testing different
amounts of fertilizer on different plants & measuring the growth (height) of the plants: dependent variable (Y-axis)?
height of plants
independent variable (X-axis)? amount of fertilizer
The effect of _____________
on _____________
Amount of Fertilizer
Height of Plants
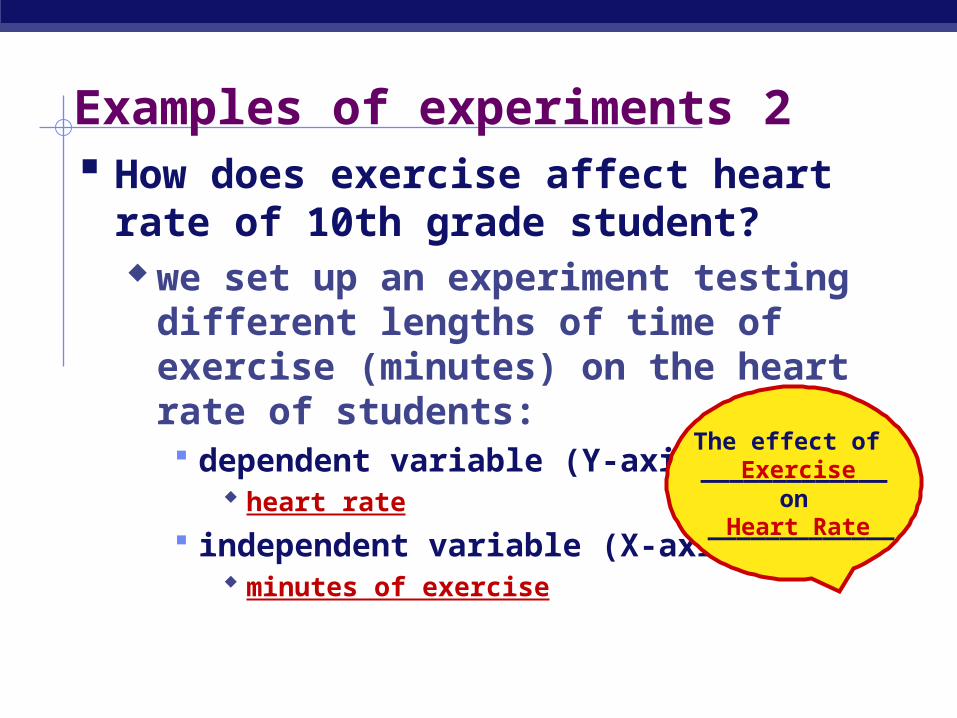
Examples of experiments 2 How does exercise affect heart rate of
10th grade student? we set up an experiment testing
different lengths of time of exercise (minutes) on the heart rate of students: dependent variable (Y-axis)?
heart rate
independent variable (X-axis)? minutes of exercise
The effect of _____________
on _____________
Exercise
Heart Rate
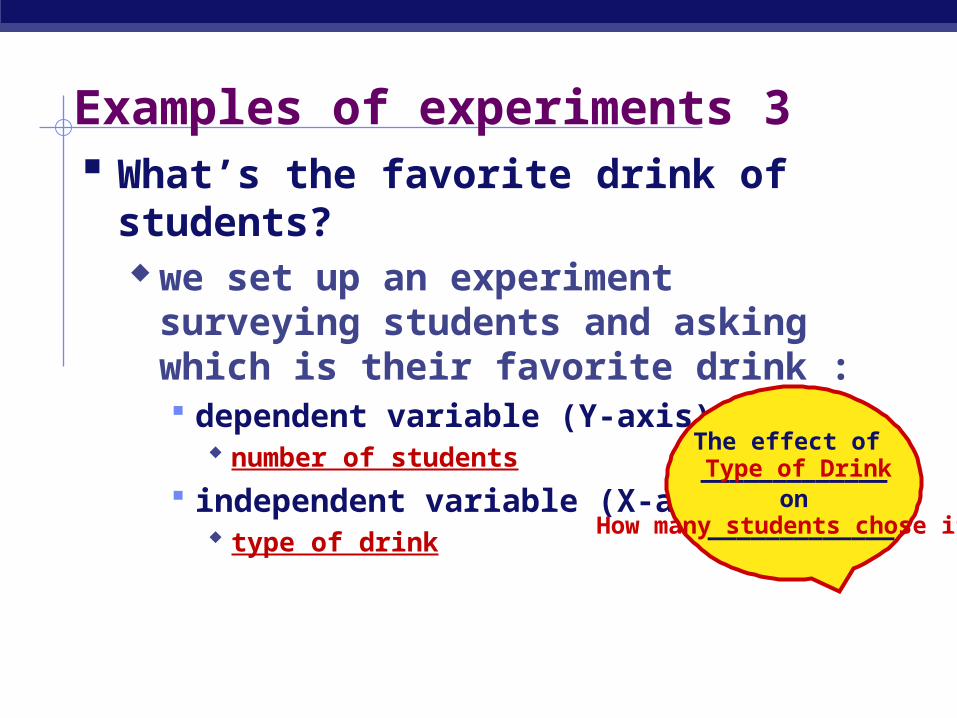
Examples of experiments 3 What’s the favorite drink of students?
we set up an experiment surveying students and asking which is their favorite drink : dependent variable (Y-axis)?
number of students
independent variable (X-axis)? type of drink
The effect of _____________
on _____________
Type of Drink
How many students chose it
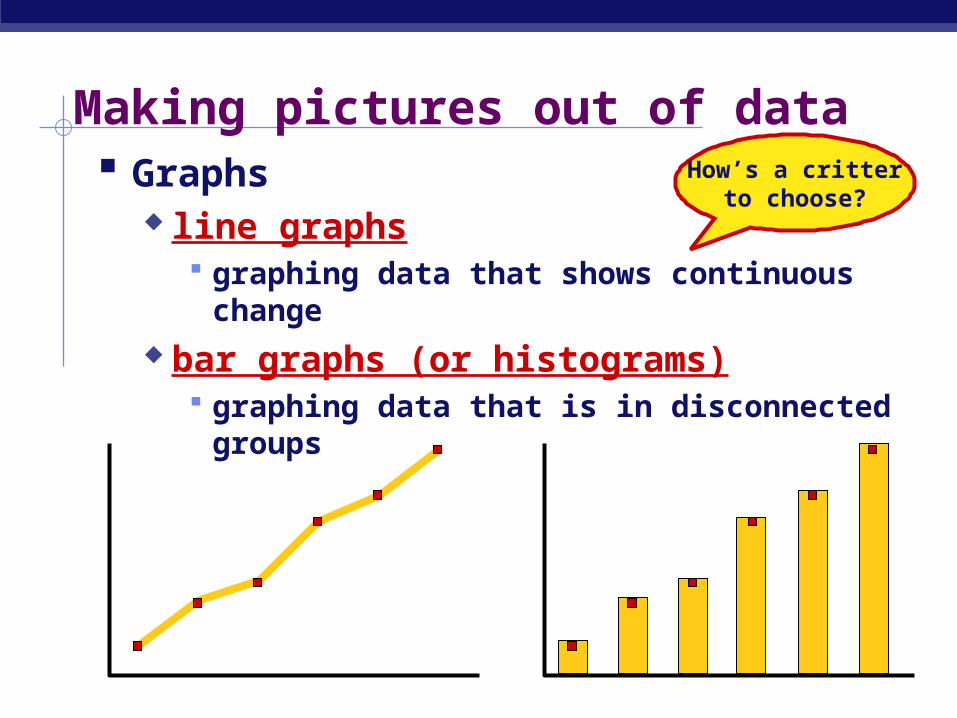
Making pictures out of data Graphs
line graphs graphing data that shows continuous change
bar graphs (or histograms) graphing data that is in disconnected groups
How’s a critterto choose?
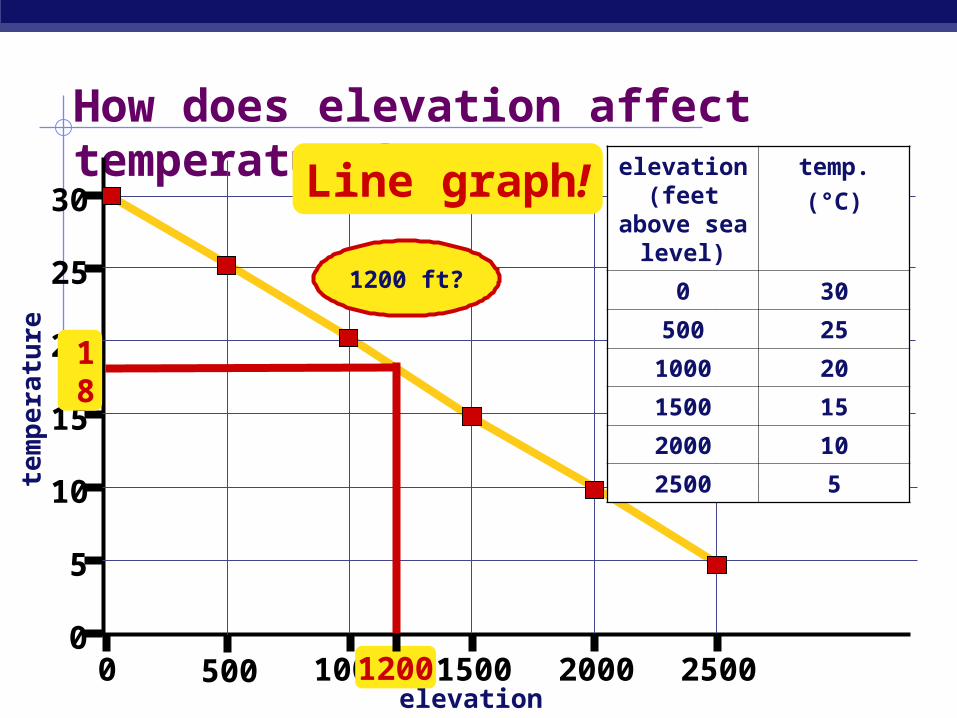
How does elevation affect temperature?
elevation
tem
pe
ratu
re
5
10
15
20
25
30
0 500 1000 1500 2000 25000
elevation (feet above sea level)
temp.
(°C)
0 30
500 25
1000 20
1500 15
2000 10
2500 5
1200 ft?
18
Line graph!
1200
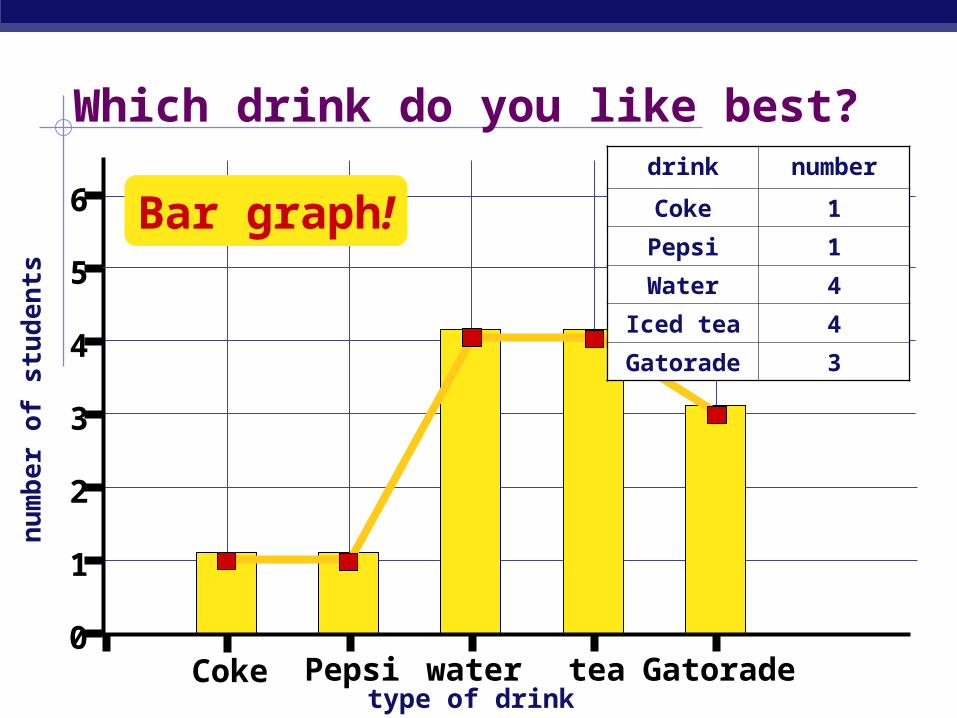
Which drink do you like best?
type of drink
nu
mb
er
of
stu
den
ts
1
2
3
4
5
6
Coke Pepsi water tea Gatorade0
drink number
Coke 1
Pepsi 1
Water 4
Iced tea 4
Gatorade 3
Bar graph!
• name and date• Title: Descriptive title explaining the purpose of the experiment. • Purpose: The question being answered in the experiment.
Lab Report Template
• Hypothesis: What you believe will happen, in the form of an “If, then” statement.
Lab Report Template
•Materials: List all materials used in the lab•Procedure: List step by step how to complete the lab•Data: Independent and Dependent variable listed
Lab Report Template
•Analysis: At least a paragraph that explains what your data shows•Conclusion: Ties lab together. Is hypothesis supported or refuted? Include any suggestions for improving the experiment. What could have been a source of error and give a suggestion for further research.
Lab Report Template