property and casualty companies—association edition … insurance company.pdf · annual statement...
TRANSCRIPT
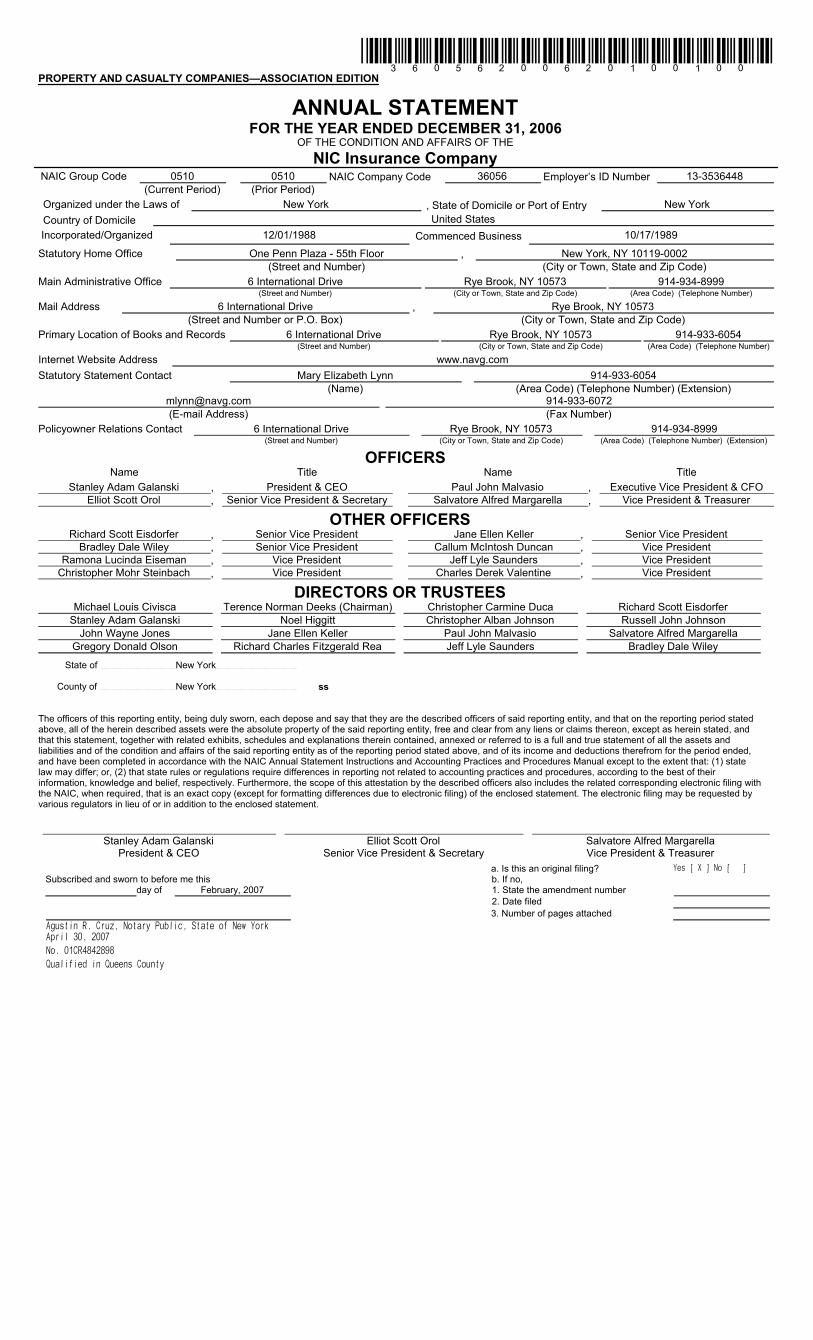
*36056200620100100*PROPERTY AND CASUALTY COMPANIES—ASSOCIATION EDITION
ANNUAL STATEMENTFOR THE YEAR ENDED DECEMBER 31, 2006
OF THE CONDITION AND AFFAIRS OF THE
NIC Insurance Company NAIC Group Code 0510 0510 NAIC Company Code 36056 Employer’s ID Number 13-3536448
(Current Period) (Prior Period)Organized under the Laws of New York , State of Domicile or Port of Entry New YorkCountry of Domicile United States
Incorporated/Organized 12/01/1988 Commenced Business 10/17/1989
Statutory Home Office One Penn Plaza - 55th Floor , New York, NY 10119-0002(Street and Number) (City or Town, State and Zip Code)
Main Administrative Office 6 International Drive Rye Brook, NY 10573 914-934-8999(Street and Number) (City or Town, State and Zip Code) (Area Code) (Telephone Number)
Mail Address 6 International Drive , Rye Brook, NY 10573(Street and Number or P.O. Box) (City or Town, State and Zip Code)
Primary Location of Books and Records 6 International Drive Rye Brook, NY 10573 914-933-6054(Street and Number) (City or Town, State and Zip Code) (Area Code) (Telephone Number)
Internet Website Address www.navg.comStatutory Statement Contact Mary Elizabeth Lynn 914-933-6054
(Name) (Area Code) (Telephone Number) (Extension)[email protected] 914-933-6072(E-mail Address) (Fax Number)
Policyowner Relations Contact 6 International Drive Rye Brook, NY 10573 914-934-8999(Street and Number) (City or Town, State and Zip Code) (Area Code) (Telephone Number) (Extension)
OFFICERSName Title Name Title
Stanley Adam Galanski , President & CEO Paul John Malvasio , Executive Vice President & CFOElliot Scott Orol , Senior Vice President & Secretary Salvatore Alfred Margarella , Vice President & Treasurer
OTHER OFFICERSRichard Scott Eisdorfer , Senior Vice President Jane Ellen Keller , Senior Vice President
Bradley Dale Wiley , Senior Vice President Callum McIntosh Duncan , Vice PresidentRamona Lucinda Eiseman , Vice President Jeff Lyle Saunders , Vice President
Christopher Mohr Steinbach , Vice President Charles Derek Valentine , Vice President
DIRECTORS OR TRUSTEESMichael Louis Civisca Terence Norman Deeks (Chairman) Christopher Carmine Duca Richard Scott Eisdorfer
Stanley Adam Galanski Noel Higgitt Christopher Alban Johnson Russell John Johnson John Wayne Jones Jane Ellen Keller Paul John Malvasio Salvatore Alfred Margarella
Gregory Donald Olson Richard Charles Fitzgerald Rea Jeff Lyle Saunders Bradley Dale Wiley
State of
County of
New York
New York ss
The officers of this reporting entity, being duly sworn, each depose and say that they are the described officers of said reporting entity, and that on the reporting period stated above, all of the herein described assets were the absolute property of the said reporting entity, free and clear from any liens or claims thereon, except as herein stated, and that this statement, together with related exhibits, schedules and explanations therein contained, annexed or referred to is a full and true statement of all the assets and liabilities and of the condition and affairs of the said reporting entity as of the reporting period stated above, and of its income and deductions therefrom for the period ended, and have been completed in accordance with the NAIC Annual Statement Instructions and Accounting Practices and Procedures Manual except to the extent that: (1) state law may differ; or, (2) that state rules or regulations require differences in reporting not related to accounting practices and procedures, according to the best of their information, knowledge and belief, respectively. Furthermore, the scope of this attestation by the described officers also includes the related corresponding electronic filing with the NAIC, when required, that is an exact copy (except for formatting differences due to electronic filing) of the enclosed statement. The electronic filing may be requested by various regulators in lieu of or in addition to the enclosed statement.
Stanley Adam Galanski Elliot Scott Orol Salvatore Alfred Margarella President & CEO Senior Vice President & Secretary Vice President & Treasurer
a. Is this an original filing? Yes [ X ] No [ ]Subscribed and sworn to before me this b. If no,
day of February, 2007 1. State the amendment number2. Date filed3. Number of pages attached
Agustin R. Cruz, Notary Public, State of New YorkApril 30, 2007No. 01CR4842898 Qualified in Queens County

ANNUAL STATEMENT FOR THE YEAR 2006 OF THE NIC Insurance Company
ASSETSCurrent Year Prior Year
1
Assets
2
Nonadmitted Assets
3
Net Admitted Assets(Cols. 1 - 2)
4
Net AdmittedAssets
1. Bonds (Schedule D) 105,789,943 105,789,943 88,940,625
2. Stocks (Schedule D):
2.1 Preferred stocks
2.2 Common stocks 3. Mortgage loans on real estate (Schedule B):
3.1 First liens
3.2 Other than first liens 4. Real estate (Schedule A):
4.1 Properties occupied by the company (less
$ encumbrances)
4.2 Properties held for the production of income
(less $ encumbrances)
4.3 Properties held for sale (less
$ encumbrances) 5. Cash ($ 1,157,072 , Schedule E, Part 1), cash equivalents
($ , Schedule E, Part 2) and short-term
investments ($ , Schedule DA) 1,157,072 1,157,072 15,802,640
6. Contract loans, (including $ premium notes)7. Other invested assets (Schedule BA) 8. Receivables for securities 13,155 13,155
9. Aggregate write-ins for invested assets 10. Subtotals, cash and invested assets (Lines 1 to 9) 106,960,170 106,960,170 104,743,265
11. Title plants less $ charged off (for Title insurers
only)12. Investment income due and accrued 877,285 877,285 759,794
13. Premiums and considerations:
13.1 Uncollected premiums and agents’ balances in the course of
collection 26,505,457 26,505,457 18,948,725
13.2 Deferred premiums, agents’ balances and installments booked but
deferred and not yet due (including $ earned
but unbilled premium)
13.3 Accrued retrospective premium14. Reinsurance:
14.1 Amounts recoverable from reinsurers
14.2 Funds held by or deposited with reinsured companies
14.3 Other amounts receivable under reinsurance contracts 15. Amounts receivable relating to uninsured plans 16.1Current federal and foreign income tax recoverable and interest thereon 16.2Net deferred tax asset17. Guaranty funds receivable or on deposit 18. Electronic data processing equipment and software19. Furniture and equipment, including health care delivery assets
($ ) 20. Net adjustment in assets and liabilities due to foreign exchange rates 21. Receivables from parent, subsidiaries and affiliates 22. Health care ($ ) and other amounts receivable23. Aggregate write-ins for other than invested assets 24. Total assets excluding Separate Accounts, Segregated Accounts and
Protected Cell Accounts (Lines 10 to 23) 134,342,913 134,342,913 124,451,784
25. From Separate Accounts, Segregated Accounts and Protected
Cell Accounts26. Total (Lines 24 and 25) 134,342,913 134,342,913 124,451,784
DETAILS OF WRITE-INS0901.
0902.
0903.
0998. Summary of remaining write-ins for Line 9 from overflow page 0999. Totals (Lines 0901 thru 0903 plus 0998)(Line 9 above)
2301.
2302.
2303.
2398. Summary of remaining write-ins for Line 23 from overflow page 2399. Totals (Lines 2301 thru 2303 plus 2398)(Line 23 above)
2

ANNUAL STATEMENT FOR THE YEAR 2006 OF THE NIC Insurance Company
LIABILITIES, SURPLUS AND OTHER FUNDS1
Current Year2
Prior Year
1. Losses (Part 2A, Line 34, Column 8)
2. Reinsurance payable on paid losses and loss adjustment expenses (Schedule F, Part 1, Column 6)
3. Loss adjustment expenses (Part 2A, Line 34, Column 9)
4. Commissions payable, contingent commissions and other similar charges
5. Other expenses (excluding taxes, licenses and fees) 51,000 43,000
6. Taxes, licenses and fees (excluding federal and foreign income taxes)
7.1Current federal and foreign income taxes (including $ 313,115 on realized capital gains (losses)) 894,615 1,008,721
7.2Net deferred tax liability
8. Borrowed money $ and interest thereon $
9. Unearned premiums (Part 1A, Line 37, Column 5)(after deducting unearned premiums for ceded reinsurance of $ 113,341,286 and including warrantyreserves of $ )
10. Advance premium
11. Dividends declared and unpaid:
11.1 Stockholders
11.2 Policyholders
12. Ceded reinsurance premiums payable (net of ceding commissions) 26,505,457 18,948,725
13. Funds held by company under reinsurance treaties (Schedule F, Part 3, Column 19)
14. Amounts withheld or retained by company for account of others
15. Remittances and items not allocated
16. Provision for reinsurance (Schedule F, Part 7)
17. Net adjustments in assets and liabilities due to foreign exchange rates
18. Drafts outstanding
19. Payable to parent, subsidiaries and affiliates 118,899 1,918
20. Payable for securities 966,000
21. Liability for amounts held under uninsured plans
22. Capital notes $ and interest thereon $
23. Aggregate write-ins for liabilities
24. Total liabilities excluding protected cell liabilities (Lines 1 through 23) 27,569,971 20,968,364
25. Protected cell liabilities
26. Total liabilities (Lines 24 and 25) 27,569,971 20,968,364
27. Aggregate write-ins for special surplus funds
28. Common capital stock 5,000,000 5,000,000
29. Preferred capital stock
30. Aggregate write-ins for other than special surplus funds
31. Surplus notes
32. Gross paid in and contributed surplus 86,000,000 86,000,000
33. Unassigned funds (surplus) 15,772,942 12,483,420
34. Less treasury stock, at cost:
34.1 shares common (value included in Line 28 $ )
34.2 shares preferred (value included in Line 29 $ )
35. Surplus as regards policyholders (Lines 27 to 33, less 34) (Page 4, Line 39) 106,772,942 103,483,420
36. Totals (Page 2, Line 26, Col. 3) 134,342,913 124,451,784
DETAILS OF WRITE-INS
2301.
2302.
2303.
2398. Summary of remaining write-ins for Line 23 from overflow page
2399. Totals (Lines 2301 through 2303 plus 2398) (Line 23 above)
2701.
2702.
2703.
2798. Summary of remaining write-ins for Line 27 from overflow page
2799. Totals (Lines 2701 through 2703 plus 2798) (Line 27 above)
3001.
3002.
3003.
3098. Summary of remaining write-ins for Line 30 from overflow page
3099. Totals (Lines 3001 through 3003 plus 3098) (Line 30 above)
3

ANNUAL STATEMENT FOR THE YEAR 2006 OF THE NIC Insurance Company
STATEMENT OF INCOME1
Current Year2
Prior YearUNDERWRITING INCOME
1. Premiums earned (Part 1, Line 34, Column 4)
DEDUCTIONS:
2. Losses incurred (Part 2, Line 34, Column 7) 3. Loss expenses incurred (Part 3, Line 25, Column 1) 4. Other underwriting expenses incurred (Part 3, Line 25, Column 2) 5. Aggregate write-ins for underwriting deductions 6. Total underwriting deductions (Lines 2 through 5) 7. Net income of protected cells 8. Net underwriting gain (loss) (Line 1 minus Line 6 plus Line 7)
INVESTMENT INCOME
9. Net investment income earned (Exhibit of Net Investment Income, Line 17) 5,125,582 2,705,995 10. Net realized capital gains (losses) less capital gains tax of $ (15,671) (Exhibit of Capital Gains (Losses)) (29,103) 58,872 11. Net investment gain (loss) (Lines 9 + 10) 5,096,478 2,764,867
OTHER INCOME
12. Net gain (loss) from agents' or premium balances charged off (amount recovered $ amount charged off $ )
13. Finance and service charges not included in premiums14. Aggregate write-ins for miscellaneous income 15. Total other income (Lines 12 through 14) 16. Net income before dividends to policyholders, after capital gains tax and before all other federal and foreign income taxes
(Lines 8 + 11 + 15) 5,096,478 2,764,867 17. Dividends to policyholders 18. Net income, after dividends to policyholders, after capital gains tax and before all other federal and foreign income taxes
(Line 16 minus Line 17) 5,096,478 2,764,867 19. Federal and foreign income taxes incurred 1,785,286 977,021 20. Net income (Line 18 minus Line 19) (to Line 22) 3,311,192 1,787,846
CAPITAL AND SURPLUS ACCOUNT
21. Surplus as regards policyholders, December 31 prior year (Page 4, Line 39, Column 2) 103,483,420 51,591,887 22. Net income (from Line 20) 3,311,192 1,787,846 23. Net transfers (to) from Protected Cell accounts 24. Change in net unrealized capital gains or (losses) less capital gains tax of $ (21,671) 103,686 25. Change in net unrealized foreign exchange capital gain (loss) 26. Change in net deferred income tax 27. Change in nonadmitted assets (Exhibit of Nonadmitted Assets, Line 26, Col. 3) 28. Change in provision for reinsurance (Page 3, Line 16, Column 2 minus Column 1) 29. Change in surplus notes 30. Surplus (contributed to) withdrawn from protected cells 31. Cumulative effect of changes in accounting principles 32. Capital changes:
32.1. Paid in 32.2. Transferred from surplus (Stock Dividend) 32.3. Transferred to surplus
33. Surplus adjustments: 33.1. Paid in 50,000,000 33.2. Transferred to capital (Stock Dividend) 33.3. Transferred from capital
34. Net remittances from or (to) Home Office 35. Dividends to stockholders 36. Change in treasury stock (Page 3, Lines 34.1 and 34.2, Column 2 minus Column 1) 37. Aggregate write-ins for gains and losses in surplus 38. Change in surplus as regards policyholders for the year (Lines 22 through 37) 3,289,522 51,891,533 39. Surplus as regards policyholders, December 31 current year (Line 21 plus Line 38) (Page 3, Line 35) 106,772,942 103,483,420
DETAILS OF WRITE-INS0501.0502.0503.0598. Summary of remaining write-ins for Line 5 from overflow page 0599. Totals (Lines 0501 through 0503 plus 0598) (Line 5 above) 1401.1402.1403.1498. Summary of remaining write-ins for Line 14 from overflow page 1499. Totals (Lines 1401 through 1403 plus 1498) (Line 14 above) 3701.3702.3703.3798. Summary of remaining write-ins for Line 37 from overflow page 3799. Totals (Lines 3701 through 3703 plus 3798) (Line 37 above)
4

ANNUAL STATEMENT FOR THE YEAR 2006 OF THE NIC Insurance Company
CASH FLOW1
Current Year2
Prior Year Cash from Operations1. Premiums collected net of reinsurance2. Net investment income 5,231,622 2,663,423 3. Miscellaneous income 4. Total (Lines 1 through 3) 5,231,622 2,663,423 5. Benefit and loss related payments 6. Net transfers to Separate, Segregated Accounts and Protected Cell Accounts7. Commissions, expenses paid and aggregate write-ins for deductions 8. Dividends paid to policyholders 9. Federal and foreign income taxes paid (recovered) $ 1,899,392 net of tax on capital gains (losses) 1,883,721 1,128,257
10. Total (Lines 5 through 9) 1,883,721 1,128,257 11. Net cash from operations (Line 4 minus Line 10) 3,347,901 1,535,166
Cash from Investments12. Proceeds from investments sold, matured or repaid:
12.1 Bonds 12,161,541 11,538,286 12.2 Stocks 12.3 Mortgage loans 12.4 Real estate 12.5 Other invested assets 12.6 Net gains or (losses) on cash, cash equivalents and short-term investments 76,728 364,546 12.7 Miscellaneous proceeds 735,271 12.8 Total investment proceeds (Lines 12.1 to 12.7) 12,238,269 12,638,103
13. Cost of investments acquired (long-term only):13.1 Bonds 29,292,165 56,650,310 13.2 Stocks 13.3 Mortgage loans 13.4 Real estate 13.5 Other invested assets 13.6 Miscellaneous applications 1,056,553 365,329 13.7 Total investments acquired (Lines 13.1 to 13.6) 30,348,718 57,015,639
14. Net increase (decrease) in contract loans and premium notes 15. Net cash from investments (Line 12.8 minus Line 13.7 minus Line 14) (18,110,449) (44,377,536)
Cash from Financing and Miscellaneous Sources16. Cash provided (applied):
16.1 Surplus notes, capital notes 16.2 Capital and paid in surplus, less treasury stock 50,000,000 16.3 Borrowed funds 16.4 Net deposits on deposit-type contracts and other insurance liabilities 16.5 Dividends to stockholders 16.6 Other cash provided (applied) 116,981 5,852
17. Net cash from financing and miscellaneous sources (Line 16.1 to Line 16.4 minus Line 16.5 plus Line 16.6) 116,981 50,005,852
RECONCILIATION OF CASH, CASH EQUIVALENTS AND SHORT-TERM INVESTMENTS18. Net change in cash, cash equivalents and short-term investments (Line 11, plus Lines 15 and Line 17) (14,645,568) 7,163,482 19. Cash, cash equivalents and short-term investments:
19.1 Beginning of year 15,802,640 8,639,158 19.2 End of year (Line 18 plus Line 19.1) 1,157,072 15,802,640
5

ANNUAL STATEMENT FOR THE YEAR 2006 OF THE NIC Insurance Company
Part 1
NONEPart 1A
NONE
6, 7
ANNUAL STATEMENT FOR THE YEAR 2006 OF THE NIC Insurance Company
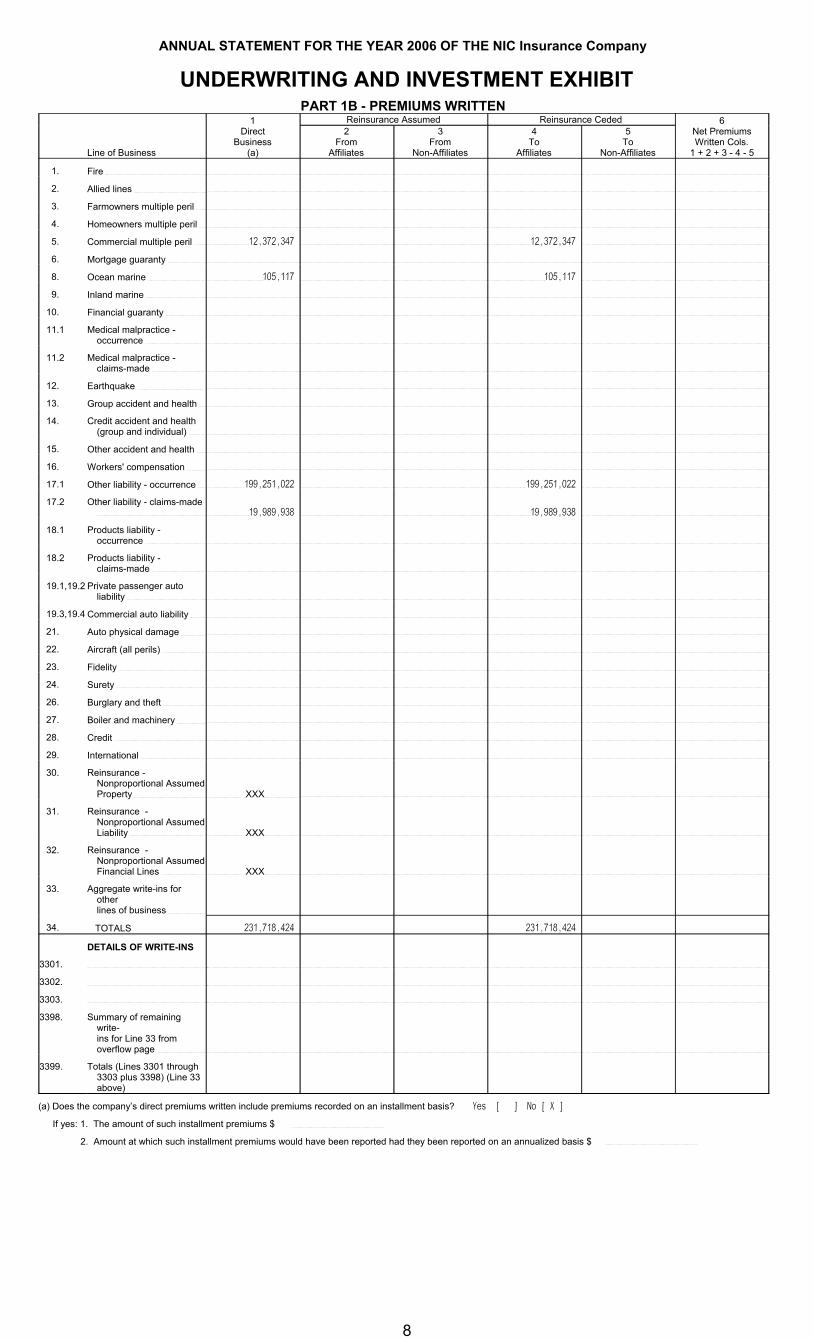
UNDERWRITING AND INVESTMENT EXHIBITPART 1B - PREMIUMS WRITTEN
1 Reinsurance Assumed Reinsurance Ceded 6
Line of Business
DirectBusiness
(a)
2From
Affiliates
3From
Non-Affiliates
4To
Affiliates
5To
Non-Affiliates
Net PremiumsWritten Cols.
1 + 2 + 3 - 4 - 5
1. Fire
2. Allied lines
3. Farmowners multiple peril
4. Homeowners multiple peril
5. Commercial multiple peril 12,372,347 12,372,347
6. Mortgage guaranty
8. Ocean marine 105,117 105,117
9. Inland marine
10. Financial guaranty
11.1 Medical malpractice - occurrence
11.2 Medical malpractice - claims-made
12. Earthquake
13. Group accident and health
14. Credit accident and health(group and individual)
15. Other accident and health
16. Workers' compensation
17.1 Other liability - occurrence 199,251,022 199,251,022
17.2 Other liability - claims-made 19,989,938 19,989,938
18.1 Products liability -occurrence
18.2 Products liability -claims-made
19.1,19.2 Private passenger autoliability
19.3,19.4 Commercial auto liability
21. Auto physical damage
22. Aircraft (all perils)
23. Fidelity
24. Surety
26. Burglary and theft
27. Boiler and machinery
28. Credit
29. International
30. Reinsurance - Nonproportional Assumed Property XXX
31. Reinsurance - Nonproportional Assumed Liability XXX
32. Reinsurance - Nonproportional Assumed Financial Lines XXX
33. Aggregate write-ins for otherlines of business
34. TOTALS 231,718,424 231,718,424
DETAILS OF WRITE-INS
3301.
3302.
3303.
3398. Summary of remaining write-ins for Line 33 fromoverflow page
3399. Totals (Lines 3301 through 3303 plus 3398) (Line 33 above)
(a) Does the company’s direct premiums written include premiums recorded on an installment basis? Yes [ ] No [ X ]
If yes: 1. The amount of such installment premiums $
2. Amount at which such installment premiums would have been reported had they been reported on an annualized basis $
8

ANNUAL STATEMENT FOR THE YEAR 2006 OF THE NIC Insurance Company
UNDERWRITING AND INVESTMENT EXHIBITPART 2 - LOSSES PAID AND INCURRED
Losses Paid Less Salvage 5 6 7 8
Line of Business
1
Direct Business
2
ReinsuranceAssumed
3
ReinsuranceRecovered
4
Net Payments(Cols. 1 + 2 - 3)
Net LossesUnpaid
Current Year(Part 2A, Col. 8)
Net LossesUnpaid
Prior Year
Losses IncurredCurrent Year
(Cols. 4 + 5 - 6)
Percentage of Losses Incurred
(Col. 7, Part 2)to Premiums Earned
(Col. 4, Part 1)1. Fire 2. Allied lines 3. Farmowners multiple peril 4. Homeowners multiple peril 5. Commercial multiple peril 63,127 63,127 6. Mortgage guaranty 8. Ocean marine 9. Inland marine
10. Financial guaranty 11.1 Medical malpractice - occurrence 11.2 Medical malpractice - claims-made 12. Earthquake 13. Group accident and health 14. Credit accident and health (group and individual) 15. Other accident and health 16. Workers' compensation 17.1 Other liability - occurrence 13,291,680 13,291,680 17.2 Other liability - claims-made 4,974,567 4,974,567 18.1 Products liability - occurrence 18.2 Products liability - claims-made 19.1,19.2 Private passenger auto liability 19.3,19.4 Commercial auto liability 21. Auto physical damage 22. Aircraft (all perils) 23. Fidelity 24. Surety 26. Burglary and theft 27. Boiler and machinery 28. Credit 29. International 30. Reinsurance - Nonproportional Assumed Property XXX31. Reinsurance - Nonproportional Assumed Liability XXX32. Reinsurance - Nonproportional Assumed Financial Lines XXX33. Aggregate write-ins for other lines of business 34. TOTALS 18,329,374 18,329,374
DETAILS OF WRITE-INS3301.3302.3303.3398. Summary of remaining write-ins for Line 33 from overflow page 3399. Totals (Lines 3301 through 3303 + 3398) (Line 33 above)
9

ANNUAL STATEMENT FOR THE YEAR 2006 OF THE NIC Insurance Company
UNDERWRITING AND INVESTMENT EXHIBITPART 2A - UNPAID LOSSES AND LOSS ADJUSTMENT EXPENSES
Reported Losses Incurred But Not Reported 8 9
Line of Business
1
Direct
2
ReinsuranceAssumed
3Deduct Reinsurance
Recoverable from Authorized and Unauthorized Companies
4
Net Losses Excl. Incurred ButNot Reported
(Cols. 1 + 2 - 3)
5
Direct
6
ReinsuranceAssumed
7
ReinsuranceCeded
Net LossesUnpaid
(Cols. 4 + 5 + 6 - 7)
Unpaid Loss AdjustmentExpenses
1. Fire 2. Allied lines 3. Farmowners multiple peril 4. Homeowners multiple peril 5. Commercial multiple peril 1,451,707 1,451,707 5,680,720 5,680,720 6. Mortgage guaranty 8. Ocean marine 23,404 23,404 9. Inland marine
10. Financial guaranty 11.1 Medical malpractice - occurrence 11.2 Medical malpractice - claims-made 12. Earthquake 13. Group accident and health (a)14. Credit accident and health (group and individual) 15. Other accident and health (a)16. Workers' compensation 17.1 Other liability - occurrence 25,932,074 25,932,074 200,083,122 200,083,122 17.2 Other liability - claims-made 2,648,861 2,648,861 28,121,267 28,121,267 18.1 Products liability - occurrence 18.2 Products liability - claims-made 19.1,19.2 Private passenger auto liability 19.3,19.4 Commercial auto liability 21. Auto physical damage 22. Aircraft (all perils) 23. Fidelity 24. Surety 26. Burglary and theft 27. Boiler and machinery 28. Credit 29. International 30. Reinsurance - Nonproportional Assumed Property XXX XXX31. Reinsurance - Nonproportional Assumed Liability XXX XXX32. Reinsurance - Nonproportional Assumed Financial Lines XXX XXX33. Aggregate write-ins for other lines of business 34. TOTALS 30,032,641 30,032,641 233,908,513 233,908,513
DETAILS OF WRITE-INS 3301. 3302. 3303. 3398. Summary of remaining write-ins for Line 33 from overflow page 3399. Totals (Lines 3301 through 3303 + 3398) (Line 33 above) (a) Including $ for present value of life indemnity claims.
10
ANNUAL STATEMENT FOR THE YEAR 2006 OF THE NIC Insurance Company
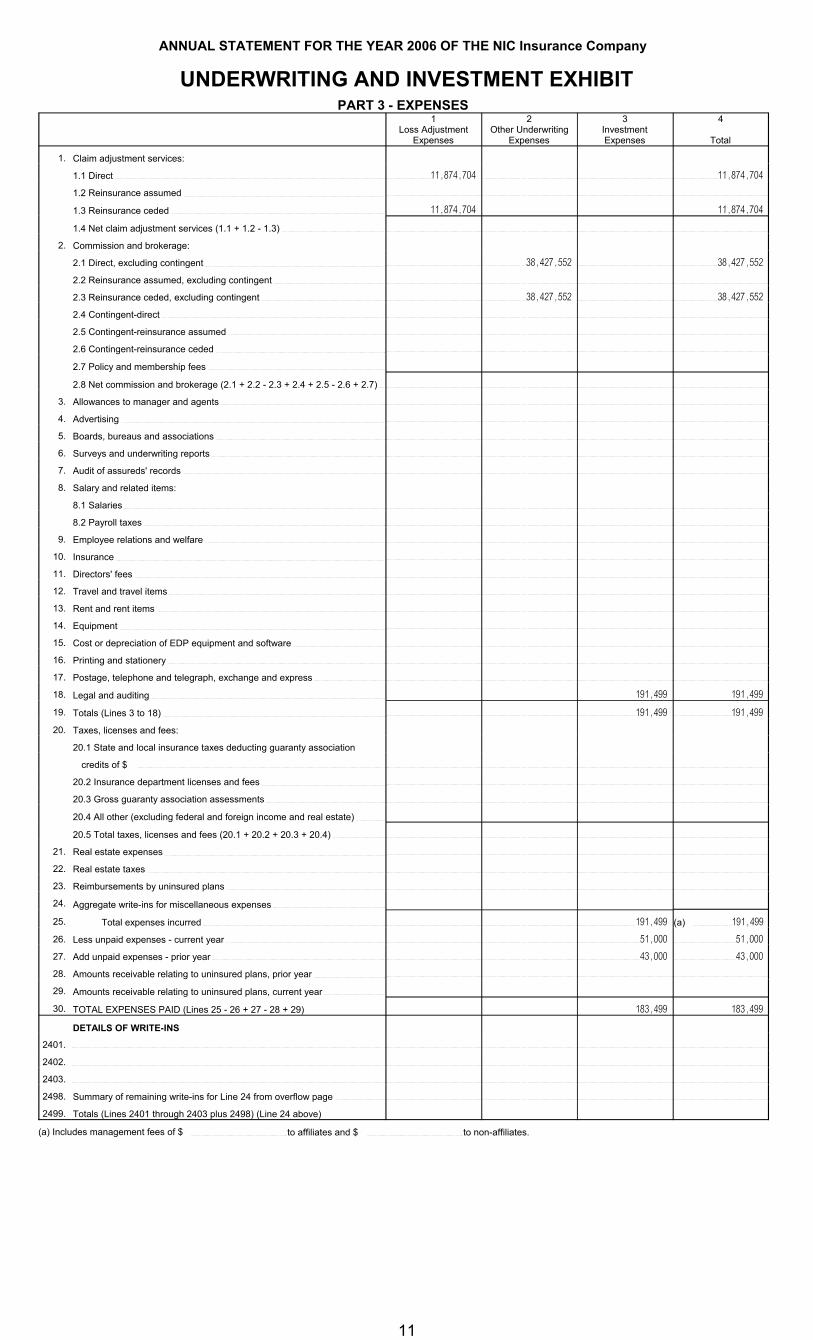
UNDERWRITING AND INVESTMENT EXHIBITPART 3 - EXPENSES
1Loss Adjustment
Expenses
2Other Underwriting
Expenses
3InvestmentExpenses
4
Total
1. Claim adjustment services:
1.1 Direct 11,874,704 11,874,704
1.2 Reinsurance assumed
1.3 Reinsurance ceded 11,874,704 11,874,704
1.4 Net claim adjustment services (1.1 + 1.2 - 1.3)
2. Commission and brokerage:
2.1 Direct, excluding contingent 38,427,552 38,427,552
2.2 Reinsurance assumed, excluding contingent
2.3 Reinsurance ceded, excluding contingent 38,427,552 38,427,552
2.4 Contingent-direct
2.5 Contingent-reinsurance assumed
2.6 Contingent-reinsurance ceded
2.7 Policy and membership fees
2.8 Net commission and brokerage (2.1 + 2.2 - 2.3 + 2.4 + 2.5 - 2.6 + 2.7)
3. Allowances to manager and agents
4. Advertising
5. Boards, bureaus and associations
6. Surveys and underwriting reports
7. Audit of assureds' records
8. Salary and related items:
8.1 Salaries
8.2 Payroll taxes
9. Employee relations and welfare
10. Insurance
11. Directors' fees
12. Travel and travel items
13. Rent and rent items
14. Equipment
15. Cost or depreciation of EDP equipment and software
16. Printing and stationery
17. Postage, telephone and telegraph, exchange and express
18. Legal and auditing 191,499 191,499
19. Totals (Lines 3 to 18) 191,499 191,499
20. Taxes, licenses and fees:
20.1 State and local insurance taxes deducting guaranty association
credits of $
20.2 Insurance department licenses and fees
20.3 Gross guaranty association assessments
20.4 All other (excluding federal and foreign income and real estate)
20.5 Total taxes, licenses and fees (20.1 + 20.2 + 20.3 + 20.4)
21. Real estate expenses
22. Real estate taxes
23. Reimbursements by uninsured plans
24. Aggregate write-ins for miscellaneous expenses
25. Total expenses incurred 191,499 (a) 191,499
26. Less unpaid expenses - current year 51,000 51,000
27. Add unpaid expenses - prior year 43,000 43,000
28. Amounts receivable relating to uninsured plans, prior year
29. Amounts receivable relating to uninsured plans, current year
30. TOTAL EXPENSES PAID (Lines 25 - 26 + 27 - 28 + 29) 183,499 183,499
DETAILS OF WRITE-INS
2401.
2402.
2403.
2498. Summary of remaining write-ins for Line 24 from overflow page
2499. Totals (Lines 2401 through 2403 plus 2498) (Line 24 above)
(a) Includes management fees of $ to affiliates and $ to non-affiliates.
11

ANNUAL STATEMENT FOR THE YEAR 2006 OF THE NIC Insurance Company
EXHIBIT OF NET INVESTMENT INCOME1
CollectedDuring Year
2Earned
During Year1. U.S. Government bonds (a) 763,089 765,395 1.1 Bonds exempt from U.S. tax (a) 7,840 3,640 1.2 Other bonds (unaffiliated) (a) 4,114,742 4,234,128 1.3 Bonds of affiliates (a)2.1 Preferred stocks (unaffiliated) (b)2.11 Preferred stocks of affiliates (b)2.2 Common stocks (unaffiliated) 2.21 Common stocks of affiliates 3. Mortgage loans (c)4. Real estate (d)5. Contract loans6. Cash, cash equivalents and short-term investments (e) 313,913 313,913 7. Derivative instruments (f)8. Other invested assets 9. Aggregate write-ins for investment income
10. Total gross investment income 5,199,584 5,317,076
11. Investment expenses (g) 191,492 12. Investment taxes, licenses and fees, excluding federal income taxes (g)13. Interest expense (h)14. Depreciation on real estate and other invested assets (i)15. Aggregate write-ins for deductions from investment income 16. Total (Lines 11 through 15) 191,492 17. Net Investment Income - (Line 10 minus Line 16) 5,125,584
DETAILS OF WRITE-INS0901.0902.0903.0998. Summary of remaining write-ins for Line 9 from overflow page 0999. Totals (Lines 0901 through 0903 plus 0998) (Line 9, above)1501.1502.1503.1598. Summary of remaining write-ins for Line 15 from overflow page 1599. Total (Lines 1501 through 1503 plus 1598) (Line 15, above)
(a) Includes $ 137,617 accrual of discount less $ 353,148 amortization of premium and less $ 69,164 paid for accrued interest on purchases.(b) Includes $ accrual of discount less $ amortization of premium and less $ paid for accrued dividends on purchases.(c) Includes $ accrual of discount less $ amortization of premium and less $ paid for accrued interest on purchases.(d) Includes $ for company’s occupancy of its own buildings; and excludes $ interest on encumbrances.(e) Includes $ 262,886 accrual of discount less $ amortization of premium and less $ paid for accrued interest on purchases.(f) Includes $ accrual of discount less $ amortization of premium.(g) Includes $ 191,492 investment expenses and $ investment taxes, licenses and fees, excluding federal income taxes, attributable to
segregated and Separate Accounts.(h) Includes $ interest on surplus notes and $ interest on capital notes.(i) Includes $ depreciation on real estate and $ depreciation on other invested assets.
EXHIBIT OF CAPITAL GAINS (LOSSES)1
RealizedGain (Loss)On Sales or
Maturity
2
OtherRealized
Adjustments
3Unrealized Increases
(Decreases)by
Adjustment
4
Total1. U.S. Government bonds (2,163) (2,163)1.1 Bonds exempt from U.S. tax 1.2 Other bonds (unaffiliated) (41,941) (41,941)1.3 Bonds of affiliates 2.1 Preferred stocks (unaffiliated) 2.11 Preferred stocks of affiliates 2.2 Common stocks (unaffiliated) 2.21 Common stocks of affiliates 3. Mortgage loans 4. Real estate 5. Contract loans 6. Cash, cash equivalents and short-term investments (670) (670)7. Derivative instruments 8. Other invested assets 9. Aggregate write-ins for capital gains (losses)
10. Total capital gains (losses) (44,774) (44,774)
DETAILS OF WRITE-INS0901.0902.0903.0998. Summary of remaining write-ins for Line 9 from overflow page 0999. Totals (Lines 0901 through 0903 plus 0998) (Line 9, above)
12

ANNUAL STATEMENT FOR THE YEAR 2006 OF THE NIC Insurance Company
EXHIBIT OF NONADMITTED ASSETS1
Current Year TotalNonadmitted Assets
2
Prior YearNonadmitted Assets
3Change in Total
Nonadmitted Assets(Col. 2 - Col. 1)
1. Bonds (Schedule D)2. Stocks (Schedule D):
2.1 Preferred stocks
2.2 Common stocks 3. Mortgage loans on real estate (Schedule B):
3.1 First liens
3.2 Other than first liens 4. Real estate (Schedule A):
4.1 Properties occupied by the company
4.2 Properties held for the production of income
4.3 Properties held for sale 5. Cash, (Schedule-E, Part 1), cash equivalents (Schedule-E, Part 2) and
short-term investments (Schedule DA)6. Contract loans 7. Other invested assets (Schedule BA) 8. Receivables for securities 9. Aggregate write-ins for invested assets
10. Subtotals, cash and invested assets (Lines 1 to 9) 11. Title plants (for Title insurers only)12. Investment income due and accrued 13. Premiums and considerations:
13.1 Uncollected premiums and agents’ balances in the course of
collection
13.2 Deferred premiums, agents’ balances and installments booked but deferred
and not yet due
13.3 Accrued retrospective premium14. Reinsurance:
14.1 Amounts recoverable from reinsurers
14.2 Funds held by or deposited with reinsured companies
14.3 Other amounts receivable under reinsurance contracts 15. Amounts receivable relating to uninsured plans 16.1Current federal and foreign income tax recoverable and interest thereon 16.2Net deferred tax asset17. Guaranty funds receivable or on deposit 18. Electronic data processing equipment and software19. Furniture and equipment, including health care delivery assets20. Net adjustment in assets and liabilities due to foreign exchange rates 21. Receivables from parent, subsidiaries and affiliates 22. Health care and other amounts receivable23. Aggregate write-ins for other than invested assets 24. Total assets excluding Separate Accounts, Segregated Accounts and
Protected Cell Accounts (Lines 10 to 23)25. From Separate Accounts, Segregated Accounts and Protected Cell Accounts26. Total (Lines 24 and 25)
DETAILS OF WRITE-INS0901.
0902.
0903.
0998. Summary of remaining write-ins for Line 9 from overflow page 0999. Totals (Lines 0901 through 0903 plus 0998)(Line 9 above)
2301.
2302.
2303.
2398. Summary of remaining write-ins for Line 23 from overflow page 2399. Totals (Lines 2301 through 2303 plus 2398)(Line 23 above)
13
NONE

ANNUAL STATEMENT FOR THE YEAR 2006 OF THE NIC Insurance Company
NOTES TO FINANCIAL STATEMENTSSummary of Significant Accounting Policies1.
Accounting PracticesA.
The financial statements of NIC Insurance Company are presented on the basis of accounting practices prescribed or permitted by the New York Insurance Department.
The New York Insurance Department recognizes only statutory accounting practices prescribed or permitted by the state of New York for determining and reporting the financial condition and results of operations of an insurance company for determining its solvency under the New York Insurance Law. The National Association of Insurance Commissioners’ (the “NAIC”) Accounting Practices and Procedures Manual (NAIC SAP) has been adopted as a component of prescribed or permitted practices by the State of New York.
B. Use of Estimates in the Preparation of the Financial Statements
The preparation of financial statements in conformity with Statutory Accounting Principles requires management to make estimates and assumptions that affect the reported amounts of assets and liabilities. It also requires disclosure of contingent assets and liabilities at the date of the financial statements and the reported amounts of revenue and expenses during the period. Actual results could differ from those estimates.
C. Accounting Policies
Premiums are earned over the terms of the related insurance policies and reinsurance contracts. Unearned premium reserves are established to cover the unexpired portion of premiums written. Such reserves are computed by pro rata methods for direct business and are based on reports received from ceding companies for reinsurance.
Expenses incurred in connection with acquiring new insurance business, including such acquisition costs as sales commissions, are charged to operations as incurred. Expenses incurred are reduced for ceding allowances received or receivable.
In addition, the company uses the following accounting policies:
Asset values are generally stated as follows: Short-term investments are valued at amortized cost. Bonds 1)not backed by other loans, asset and mortgage backed bonds and structured securities are valued at amortized cost using the effective interest method; and common stocks in which the Company has an interest of less than 20% are valued at market.
Prepayment assumptions for loan backed bonds and structured securities were obtained from broker/dealer 2)survey values or from outside investment managers. The assumptions are consistent with the current interest rate and economic environment. The retrospective adjustment method is used for these securities. Any securities that are permanently impaired are written down to realizable value using factors that recognize maintaining the original yield on the bond.
The Company has no mortgage loans or derivatives.3)
The Company anticipates investment income as a factor in the premium deficiency calculation, in 4)accordance with SSAP No. 53, Property Casualty Contracts-Premiums.
Unpaid losses and loss adjustment expenses include an amount determined from individual case estimates 5)and loss reports and an amount, based on past experience, for losses incurred but not reported. Such liabilities are necessarily based on assumptions and estimates and while management believes the amount is adequate, the ultimate liability may be excess of or less than the amount provided. The methods for making such estimates and for establishing the resulting liabilities are continually reviewed and any adjustments are reflected in the period determined.
Accounting Changes and Corrections of Errors - None2.
Business Combinations and Goodwill - None 3.
Discontinued Operations – None4.
Investments5.
Mortgage Loans – NoneA.
14

ANNUAL STATEMENT FOR THE YEAR 2006 OF THE NIC Insurance Company
NOTES TO FINANCIAL STATEMENTSDebt Restructuring - NoneB.
Reverse Mortgages – NoneC.
Loan Backed Securities – See item 1.C.2 above.D.
Repurchase Agreements – NoneE.
Real Estate – NoneF.
Low-Income Housing Tax Credits - NoneG.
Joint Ventures, Partnerships and Limited Liability Companies - None6.
Investment Income7.
A. Any due and accrued investment income over 90 days past due would be excluded from surplus.
B. At December 31, 2006, there was no due and accrued investment income excluded from surplus.
Derivative Investments - None8.
Income Taxes9.
There were no DTAs or DTLs recognized in the Company’s Assets, Liabilities, Surplus or Other FundsA.
Unrecognized Deferred Tax Liabilities - NoneB.
The total income tax incurred is current and there were no deferred tax amounts as of December 31, 2006.C.
Reconciliation of Federal Income Tax Rate to Actual Effective RateD.
The significant items causing a difference between the statutory federal income tax rate and NIC’s effective income rate are as follows:
Amount Tax EffectedIncome before taxes 5,080,810$ 1,778,283$
TIPS expense (21,670) (7,585) Tax exempt interest deduction (3,094) (1,083) Total adjustments (24,764) (8,667)
Taxable income 5,056,046$ 1,769,616$
Operating Loss and Tax Credit Carry Forwards :E.
The Company has no operating loss or tax credit carry forwards.1)
The amount of Federal income tax incurred and available for recoupment in the event of future net losses 2)is: current year $1,769,616; first preceding year $1,008,721; second preceding year $708,714.
Federal Income Tax AllocationF.
The Company’s federal income tax return is consolidated with the following entities:1)The Navigators Group, Inc.Navigators Insurance CompanyNavigators Management Company, Inc.Navigators Insurance Services of Washington, Inc.Navigators California Insurance Services, IncNavigators Insurance Services of Texas, Inc.
The method of allocation between the companies is subject to written agreement, approved by the Board of 2)Directors. Allocation is based upon separate return calculations. Intercompany tax balances are settled in the first quarter.
Information Concerning Parent, Subsidiaries and Affiliates 10.
14.1

ANNUAL STATEMENT FOR THE YEAR 2006 OF THE NIC Insurance Company
NOTES TO FINANCIAL STATEMENTSA. All outstanding shares of NIC Insurance Company are owned by Navigators Insurance Company
(“Parent”), an insurance company domiciled in the State of New York.
The company received a surplus contribution of $50,000,000 from its parent in October 2005.B.
The Company ceded $231,718,000 of premiums to Navigators Insurance Company under a reinsurance C.agreement whereby the Company cedes all its business to its Parent. The Company incurred commission expense of $18,796,357 under agency agreements with Navigators California Insurance Services, Inc. (“NCIS”) and Navigators Management Company, Inc. (“NMC”), insurance agencies owned by The Navigators Group, Inc., the Company’s ultimate parent.
The only amounts due between the Company and its affiliates are insurance related items which are settled D.monthly when due.
Guarantees of Contingencies for Related Parties - NoneE.
F. See item 10.C above and Schedule Y contained herein for material arrangements with related parties.
See items 10. A and 10. F above concerning the relationship with other companies under common control.G.
The Company does not own any shares of its Parent or affiliated companies.H.
The Company owns no investment in an SCA. I.
The Company owns no investment in an impaired SCA.J.
The Company owns no investment in a foreign insurance subsidiary.K.
Debt - None11.
Retirement Plans, Deferred Compensation, Postemployment Benefits and Compensated Absences and Other 12.Postretirement Benefit Plans
Defined Benefit Plans – NoneA.
Defined Contribution Plans – NoneB.
Multiemployer Plans – NoneC.
Consolidated/Holding Company Plans - The Company participates in a defined contribution Money Purchase D.Plan and a 401(k) Plan sponsored by its Parent. It does not have or participate in any other post retirement benefit plans.
Postemployment Benefits and Compensated Absences - The Company has no post employment benefits except E.as disclosed in item 12.D above.
Capital and Surplus, Shareholders’ Dividend Restrictions and Quasi-Reorganizations13.
1. The Company has 250 common shares authorized, issued and outstanding with a $20,000 par value.
The Company has no preferred stock outstanding.2.
3. The maximum amount of dividends which may be paid by State of New York insurance companies to shareholders without prior approval of the Insurance Commissioner is subject to restrictions relating to statutory surplus and investment income. The maximum dividend which may be paid without prior approval is 10% of the Company’s statutory surplus.
4. Subject to 13.3 above, there are no restrictions placed on the portion of profits that may be paid as ordinary dividends to the Company’s stockholders.
5. Subject to 13.3 above, there are no restrictions placed on the Company’s surplus.
6. The Company is not a mutual.
7. There is no stock held by the Company for special purposes.
8. There are no special surplus funds.
14.2

ANNUAL STATEMENT FOR THE YEAR 2006 OF THE NIC Insurance Company
NOTES TO FINANCIAL STATEMENTS9. The unassigned funds (surplus) represented has not been reduced by any cumulative unrealized gains and
losses.
10. Surplus Notes – None
11. Quasi-reorganization - None
Contingencies - None other than various lawsuits that have arisen in the normal course of the Company’s business 14.which are not considered material in relation to the financial position of the company.
Leases – None15.
Financial Instruments with Off-Balance Risk and with Concentration of Credit Risk – None16.
Sale, Transfer and Servicing of Financial Assets and Extinguishments of Liabilities – None17.
Gain or Loss from Uninsured Plans and the Uninsured Portion of Partially Insured Plans – None18.
Direct Premium Written/Produced by Managing General Agents/Third Party Administrators:19.
Type of Type of DirectExclus ive Business Authority Premium
Name and Address FEI Number Contract W ritten Granted* W ritten
Navigators Management Company Inc.One Penn Plaza U, C, CA,New York, NY 10119 13-2771091 No Liability R, B, P 58,357,494$
Navigators CA Ins . Svcs ., Inc.433 California Street, Suite 820San Francisco, CA 94104 94-3105355 No Liability U, R, B, P 167,130,146
Navigators Ins . Svcs . of TX, Inc.Sage Park One U, C, CA2121 Sage, Suite 145 75-2304692 No Liability R, B, P 1,081,843
Navigators Ins . Svcs . of W A, Inc.2101 Fourth Avenue, Suite 910Seattle, W A 98121 91-1375993 No Liability U, R, B, P 5,148,941
Total 231,718,424$
*Type of Authority Granted: U = Underwriting, C = Claims Payments , CA = Claims Adjus ting,B = Binding Authority, R = Reinsurance, P = Premium Collection
September 11 Events:20.
The Company has not incurred any losses from the September 11 Events. However, given the uncertainty surrounding this event, the estimates may change over time as additional information becomes available.
Other Items:21.
Extraordinary Items – NoneA.
Troubled Debt Restructuring – NoneB.
Other Disclosures - NoneC.
Uncollectible Premiums Receivable - Uncollectible amounts are written off as they are identified.D.
Business Interruption Insurance Recoveries - NoneE.
Events Subsequent – On January 4, 2007, the Company changed its name to Navigators Specialty Insurance 22.Company.
Reinsurance:23.
Unsecured Reinsurance RecoverablesA.
14.3

ANNUAL STATEMENT FOR THE YEAR 2006 OF THE NIC Insurance Company
NOTES TO FINANCIAL STATEMENTSThe Company has unsecured reinsurance receivables for losses, paid and unpaid including IBNR, loss adjustment expenses and unearned premium exceeding 3% of policyholders surplus of $393,554,543 with Navigators Insurance Company (NAIC Group Code 0510, Federal ID# 13-3138390. NAIC # 42307), its parent company.
Reinsurance Recoverables in Dispute – NoneB.
Reinsurance Assumed and Ceded:C.
The following table summarizes ceded and assumed unearned premiums and the related commission equity 1)at December 31, 2006.
(1) (2) (3) (4) (5) (6)
Unearned Commission Unearned Commission Unearned CommissionPremiums Equity Premiums Equity Premiums Equity
a. Affiliates -$ -$ 113,341,286$ 18,796,357$ (113,341,286)$ (18,796,357)$ b. All other - - - - - - c . Total -$ -$ 113,341,286$ 18,796,357$ (113,341,286)$ (18,796,357)$ d. Direct Unearned Premium Reserve $ 113,341,286
Assumed Ceded Net
The Company has no additional or return commission predicated on loss experience or on any other form 2)of profit sharing arrangements in this annual statement as a result of existing contractual arrangements.
D. Uncollectible Reinsurance – None
E. Commutation of Ceded Reinsurance – None
Retroactive Reinsurance – NoneF.
G. Reinsurance Accounted for as a Deposit - None
Retrospectively Rated Contracts and Contracts Subject to Redetermination - None24.
Changes in Net Incurred Losses and Loss Adjustment Expenses25.
The Company has no net incurred losses or loss adjustment expenses as the result of all of its business being ceded to its Parent.
Intercompany Pooling Arrangements26.
Pursuant to a reinsurance agreement, the Company cedes 100% of its gross written premium to its Parent.
Structured Settlements – None27.
Health Care receivables – None28.
Participating Accident and Health Policies – None29.
Premium Deficiency Reserves – None30.
High Deductibles – None31.
Discounting of Liabilities for Unpaid Losses and Loss Adjustment Expenses – None32.
Asbestos/Environmental Reserves33.
Does the Company have on the books, or has it ever written an insured for which you have identified a A.potential for the existence of, a liability due to asbestos losses? Yes (X) No ( )
All reserves are ceded to the Company's Parent.
There are no ending reserves for Bulk + IBNR included in A (Loss and LAE).B.
There are no ending reserves for loss adjustment expenses included in A (Case, Bulk + IBNR).C.
Does the company have on the books, or has it ever written an insured for which you have defined a potential D.for the existence of, a liability due to environmental losses? Yes ( ) No (X)
14.4

ANNUAL STATEMENT FOR THE YEAR 2006 OF THE NIC Insurance Company
NOTES TO FINANCIAL STATEMENTS 34. Subscriber Savings Accounts - None
35. Multiple Peril Crop Insurance - None
14.5
ANNUAL STATEMENT FOR THE YEAR 2006 OF THE NIC Insurance Company
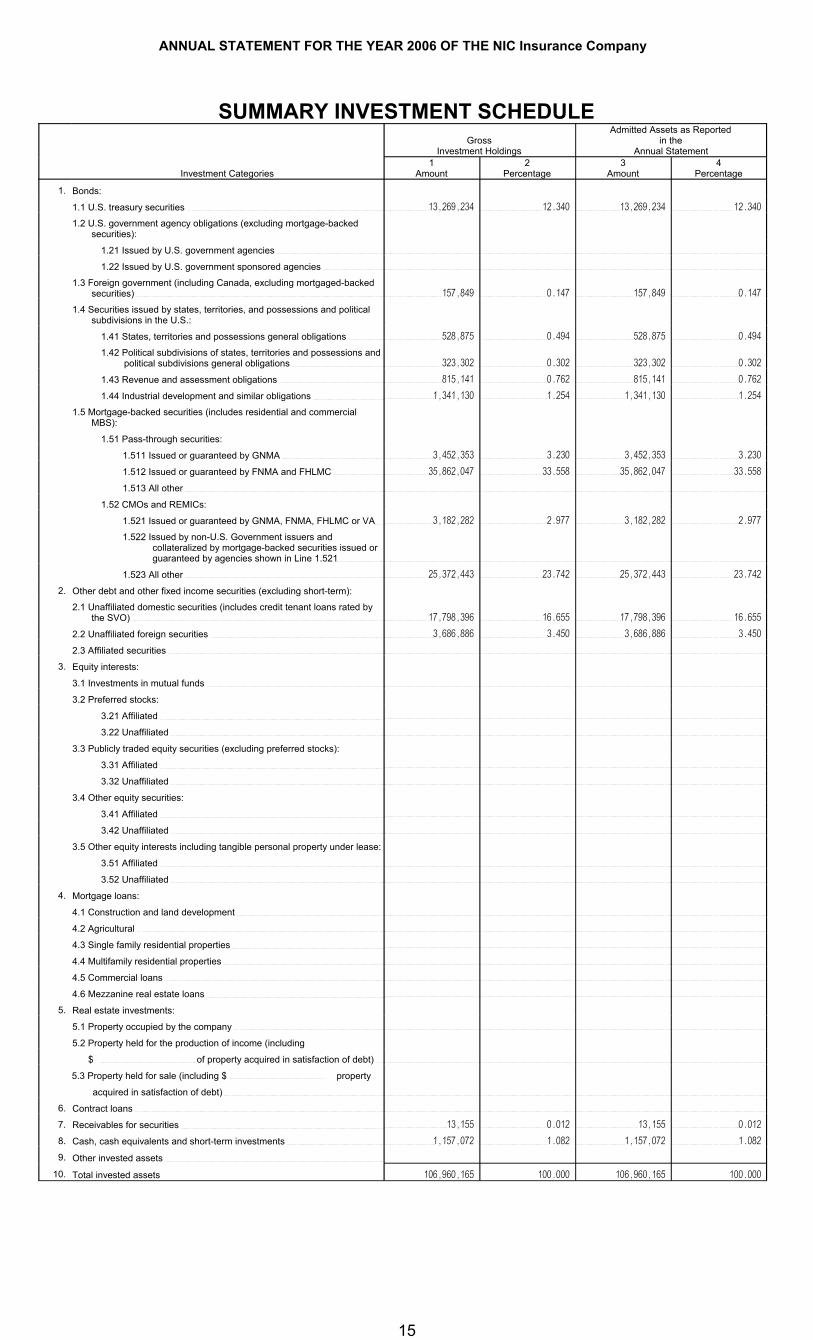
SUMMARY INVESTMENT SCHEDULEGross
Investment Holdings
Admitted Assets as Reportedin the
Annual Statement
Investment Categories1
Amount2
Percentage3
Amount4
Percentage
1. Bonds:
1.1 U.S. treasury securities 13,269,234 12.340 13,269,234 12.340
1.2 U.S. government agency obligations (excluding mortgage-backed securities):
1.21 Issued by U.S. government agencies
1.22 Issued by U.S. government sponsored agencies
1.3 Foreign government (including Canada, excluding mortgaged-backed securities) 157,849 0.147 157,849 0.147
1.4 Securities issued by states, territories, and possessions and political subdivisions in the U.S.:
1.41 States, territories and possessions general obligations 528,875 0.494 528,875 0.494
1.42 Political subdivisions of states, territories and possessions and political subdivisions general obligations 323,302 0.302 323,302 0.302
1.43 Revenue and assessment obligations 815,141 0.762 815,141 0.762
1.44 Industrial development and similar obligations 1,341,130 1.254 1,341,130 1.254
1.5 Mortgage-backed securities (includes residential and commercial MBS):
1.51 Pass-through securities:
1.511 Issued or guaranteed by GNMA 3,452,353 3.230 3,452,353 3.230
1.512 Issued or guaranteed by FNMA and FHLMC 35,862,047 33.558 35,862,047 33.558
1.513 All other
1.52 CMOs and REMICs:
1.521 Issued or guaranteed by GNMA, FNMA, FHLMC or VA 3,182,282 2.977 3,182,282 2.977
1.522 Issued by non-U.S. Government issuers and collateralized by mortgage-backed securities issued or guaranteed by agencies shown in Line 1.521
1.523 All other 25,372,443 23.742 25,372,443 23.742
2. Other debt and other fixed income securities (excluding short-term):
2.1 Unaffiliated domestic securities (includes credit tenant loans rated by the SVO) 17,798,396 16.655 17,798,396 16.655
2.2 Unaffiliated foreign securities 3,686,886 3.450 3,686,886 3.450
2.3 Affiliated securities
3. Equity interests:
3.1 Investments in mutual funds
3.2 Preferred stocks:
3.21 Affiliated
3.22 Unaffiliated
3.3 Publicly traded equity securities (excluding preferred stocks):
3.31 Affiliated
3.32 Unaffiliated
3.4 Other equity securities:
3.41 Affiliated
3.42 Unaffiliated
3.5 Other equity interests including tangible personal property under lease:
3.51 Affiliated
3.52 Unaffiliated
4. Mortgage loans:
4.1 Construction and land development
4.2 Agricultural
4.3 Single family residential properties
4.4 Multifamily residential properties
4.5 Commercial loans
4.6 Mezzanine real estate loans
5. Real estate investments:
5.1 Property occupied by the company
5.2 Property held for the production of income (including
$ of property acquired in satisfaction of debt)
5.3 Property held for sale (including $ property
acquired in satisfaction of debt)
6. Contract loans
7. Receivables for securities 13,155 0.012 13,155 0.012
8. Cash, cash equivalents and short-term investments 1,157,072 1.082 1,157,072 1.082
9. Other invested assets
10. Total invested assets 106,960,165 100.000 106,960,165 100.000
15

ANNUAL STATEMENT FOR THE YEAR 2006 OF THE NIC Insurance Company
GENERAL INTERROGATORIESPART 1 - COMMON INTERROGATORIES
GENERAL1.1 Is the reporting entity a member of an Insurance Holding Company System consisting of two or more affiliated persons, one or more of
which is an insurer? Yes [ X ] No [ ]
1.2 If yes, did the reporting entity register and file with its domiciliary State Insurance Commissioner, Director or Superintendent, or with such regulatory official of the state of domicile of the principal insurer in the Holding Company System, a registration statement providing disclosure substantially similar to the standards adopted by the National Association of Insurance Commissioners (NAIC) in its Model Insurance Holding Company System Regulatory Act and model regulations pertaining thereto, or is the reporting entity subject to standards and disclosure requirements substantially similar to those required by such Act and regulations? Yes [ X ] No [ ] NA [ ]
1.3 State Regulating? New York
2.1 Has any change been made during the year of this statement in the charter, by-laws, articles of incorporation, or deed of settlement of the reporting entity? Yes [ ] No [ X ]
2.2 If yes, date of change:
3.1 State as of what date the latest financial examination of the reporting entity was made or is being made. 12/31/2004
3.2 State the as of date that the latest financial examination report became available from either the state of domicile or the reporting entity. This date should be the date of the examined balance sheet and not the date the report was completed or released. 12/31/2004
3.3 State as of what date the latest financial examination report became available to other states or the public from either the state of domicile or the reporting entity. This is the release date or completion date of the examination report and not the date of the examination (balance sheet date). 09/22/2006
3.4 By what department or departments? New York State Insurance Department
4.1 During the period covered by this statement, did any agent, broker, sales representative, non-affiliated sales/service organization or any combination thereof under common control (other than salaried employees of the reporting entity), receive credit or commissions for or control a substantial part (more than 20 percent of any major line of business measured on direct premiums) of:
4.11 sales of new business? Yes [ X ] No [ ]
4.12 renewals? Yes [ X ] No [ ]
4.2 During the period covered by this statement, did any sales/service organization owned in whole or in part by the reporting entity or an affiliate, receive credit or commissions for or control a substantial part (more than 20 percent of any major line of business measured on direct premiums) of:
4.21 sales of new business? Yes [ X ] No [ ]
4.22 renewals? Yes [ X ] No [ ]
5.1 Has the reporting entity been a party to a merger or consolidation during the period covered by this statement? Yes [ ] No [ X ]
5.2 If yes, provide the name of the entity, NAIC Company Code, and state of domicile (use two letter state abbreviation) for any entity that has ceased to exist as a result of the merger or consolidation.
1Name of Entity
2NAIC Company Code
3State of Domicile
6.1 Has the reporting entity had any Certificates of Authority, licenses or registrations (including corporate registration, if applicable) suspended or revoked by any governmental entity during the reporting period? Yes [ ] No [ X ]
6.2 If yes, give full information
7.1 Does any foreign (non-United States) person or entity directly or indirectly control 10% or more of the reporting entity? Yes [ ] No [ X ]
7.2 If yes,
7.21 State the percentage of foreign control;
7.22 State the nationality(s) of the foreign person(s) or entity(s) or if the entity is a mutual or reciprocal, the nationality of its manager or attorney in fact; and identify the type of entity(s) (e.g., individual, corporation or government, manager or attorney in fact).
1Nationality
2Type of Entity
16

ANNUAL STATEMENT FOR THE YEAR 2006 OF THE NIC Insurance Company
GENERAL INTERROGATORIES8.1 Is the company a subsidiary of a bank holding company regulated by the Federal Reserve Board? Yes [ ] No [ X ]8.2 If response to 8.1 is yes, please identify the name of the bank holding company.
8.3 Is the company affiliated with one or more banks, thrifts or securities firms? Yes [ ] No [ X ]8.4 If response to 8.3 is yes, please provide the names and location (city and state of the main office) of any affiliates regulated by a federal
financial regulatory services agency [i.e. the Federal Reserve Board (FRB), the Office of the Comptroller of the Currency (OCC), the Office of Thrift Supervision (OTS), the Federal Deposit Insurance Corporation (FDIC) and the Securities Exchange Commission (SEC) and identify the affiliate’s primary federal regulator.]
1
Affiliate Name
2Location
(City, State)
3
FRB
4
OCC
5
OTS
6
FDIC
7
SEC
9. What is the name and address of the independent certified public accountant or accounting firm retained to conduct the annual audit?KPMG, 345 Park Avenue, New York, NY 10154
10. What is the name, address and affiliation (officer/employee of the reporting entity or actuary/consultant associated with an actuarial consulting firm) of the individual providing the statement of actuarial opinion/certification?
Claus S. Metzner, F.S.A., F.C.A.S., M.A.A.A., Aktuar-SAV, Actuary Milliman USA, 698 Coldbrook Road, South Glastonbury, CT 06073
11.1 Does the reporting entity own any securities of a real estate holding company or otherwise hold real estate indirectly? Yes [ ] No [ X ]
11.11 Name of real estate holding company 11.12 Number of parcels involved
11.13 Total book/adjusted carrying value $11.2 If yes, provide explanation
12. FOR UNITED STATES BRANCHES OF ALIEN REPORTING ENTITIES ONLY:12.1 What changes have been made during the year in the United States Manager or the United States Trustees of the reporting entity?
12.2 Does this statement contain all business transacted for the reporting entity through its United States Branch on risks wherever located? Yes [ ] No [ ]12.3 Have there been any changes made to any of the trust indentures during the year? Yes [ ] No [ ]12.4 If answer to (12.3) is yes, has the domiciliary or entry state approved the changes? Yes [ ] No [ ] NA [ ]
BOARD OF DIRECTORS
13. Is the purchase or sale of all investments of the reporting entity passed upon either by the board of directors or a subordinate committee thereof? Yes [ X ] No [ ]
14. Does the reporting entity keep a complete permanent record of the proceedings of its board of directors and all subordinate committees thereof? Yes [ X ] No [ ]
15. Has the reporting entity an established procedure for disclosure to its board of directors or trustees of any material interest or affiliation on the part of any of its officers, directors, trustees or responsible employees that is in conflict or likely to conflict with the official duties of such person? Yes [ X ] No [ ]
FINANCIAL
16.1 Total amount loaned during the year (inclusive of Separate Accounts, exclusive of policy loans): 16.11 To directors or other officers $16.12 To stockholders not officers $16.13 Trustees, supreme or grand
(Fraternal only) $16.2 Total amount of loans outstanding at end of year (inclusive of Separate Accounts, exclusive of
policy loans): 16.21 To directors or other officers $16.22 To stockholders not officers $16.23 Trustees, supreme or grand
(Fraternal only) $17.1 Were any of the assets reported in this statement subject to a contractual obligation to transfer to another party without the liability for such
obligation being reported in this statement? Yes [ ] No [ X ]17.2 If yes, state the amount thereof at December 31 of the current year: 17.21 Rented from others $
17.22 Borrowed from others $ 17.23 Leased from others $
17.24 Other $18.1 Does this statement include payments for assessments as described in the Annual Statement Instructions other than guaranty fund or
guaranty association assessments? Yes [ ] No [ X ]18.2 If answer is yes, 18.21 Amount paid as losses or risk adjustment $
18.22 Amount paid as expenses $18.23 Other amounts paid $
19.1 Does the reporting entity report any amounts due from the parent, subsidiaries or affiliates on Page 2 of this statement? Yes [ ] No [ X ]19.2 If yes, indicated any amounts receivable from parent included in the Page 2 amount: $
16.1

ANNUAL STATEMENT FOR THE YEAR 2006 OF THE NIC Insurance Company
GENERAL INTERROGATORIESINVESTMENT
20.1 Were all the stocks, bonds and other securities owned December 31 of current year, over which the reporting entity has exclusive control, in the actual possession of the reporting entity on said date, except as shown by Schedule E - Part 3 - Special Deposits? Yes [ ] No [ X ]
20.2 If no, give full and complete information relating thereto:
Securities are held in the company's custody account at Brown Brothers Harriman & Co.
21.1 Were any of the stocks, bonds or other assets of the reporting entity owned at December 31 of the current year not exclusively under the control of the reporting entity, except as shown on the Schedule E - Part 3 - Special Deposits, or has the reporting entity sold or transferred any assets subject to a put option contract that is currently in force? (Exclude securities subject to Interrogatory 17.1) Yes [ ] No [ X ]
21.2 If yes, state the amount thereof at December 31 of the current year: 21.21 Loaned to others $
21.22 Subject to repurchase agreements $
21.23 Subject to reverse repurchase agreements $
21.24 Subject to dollar repurchase agreements $
21.25 Subject to reverse dollar repurchase agreements $
21.26 Pledged as collateral $
21.27 Placed under option agreements $
21.28 Letter stock or other securities restricted as to sale $
21.29 Other $
21.3 For category (21.28) provide the following:
1Nature of Restriction
2Description
3Amount
22.1 Does the reporting entity have any hedging transactions reported on Schedule DB? Yes [ ] No [ X ]
22.2 If yes, has a comprehensive description of the hedging program been made available to the domiciliary state? Yes [ ] No [ ] NA [ X ]If no, attach a description with this statement.
23.1 Were any preferred stocks or bonds owned as of December 31 of the current year mandatorily convertible into equity, or, at the option of the issuer, convertible into equity? Yes [ ] No [ X ]
23.2 If yes, state the amount thereof at December 31 of the current year. $
16.2

ANNUAL STATEMENT FOR THE YEAR 2006 OF THE NIC Insurance Company
GENERAL INTERROGATORIES 24. Excluding items in Schedule E, real estate, mortgage loans and investments held physically in the reporting entity’s offices, vaults or
safety deposit boxes, were all stocks, bonds and other securities, owned throughout the current year held pursuant to a custodial agreement with a qualified bank or trust company in accordance with Part 1 – General, Section IV.H-Custodial or Safekeeping Agreements of the NAIC Financial Condition Examiners Handbook? Yes [ X ] No [ ]
24.01 For agreements that comply with the requirements of the NAIC Financial Condition Examiners Handbook, complete the following:
1Name of Custodian(s)
2Custodian’s Address
Brown Brothers Harriman & Company 140 Broadway, New York, NY 10005-1101
24.02 For all agreements that do not comply with the requirements of the NAIC Financial Condition Examiners Handbook, provide the name, location and a complete explanation:
1Name(s)
2Location(s)
2Complete Explanation(s)
24.03 Have there been any changes, including name changes, in the custodian(s) identified in 24.01 during the current year? Yes [ ] No [ X ]24.04 If yes, give full and complete information relating thereto:
1
Old Custodian
2
New Custodian
3Date of Change
4
Reason
24.05 Identify all investment advisors, brokers/dealers or individuals acting on behalf of broker/dealers that have access to the investment accounts, handle securities and have authority to make investments on behalf of the reporting entity:
1Central Registration Depository Number(s)
2Name
2Address
106595 Wellington Management Company, LLP 75 State Street, Boston, MA 02109
25.1 Does the reporting entity have any diversified mutual funds reported in Schedule D, Part 2 (diversified according to the Securities and Exchange Commission (SEC) in the Investment Company Act of 1940 [Section 5 (b) (1)])? Yes [ ] No [ X ]
25.2 If yes, complete the following schedule:
1CUSIP #
2Name of Mutual Fund
3Book/Adjusted Carrying Value
25.2999 TOTAL
25.3 For each mutual fund listed in the table above, complete the following schedule:
1
Name of Mutual Fund(from above table)
2
Name of Significant HoldingOf the Mutual Fund
3Amount of Mutual Fund’s
Book/Adjusted Carrying ValueAttributable to the Holding
4
Date of Valuation
16.3
ANNUAL STATEMENT FOR THE YEAR 2006 OF THE NIC Insurance Company
GENERAL INTERROGATORIES
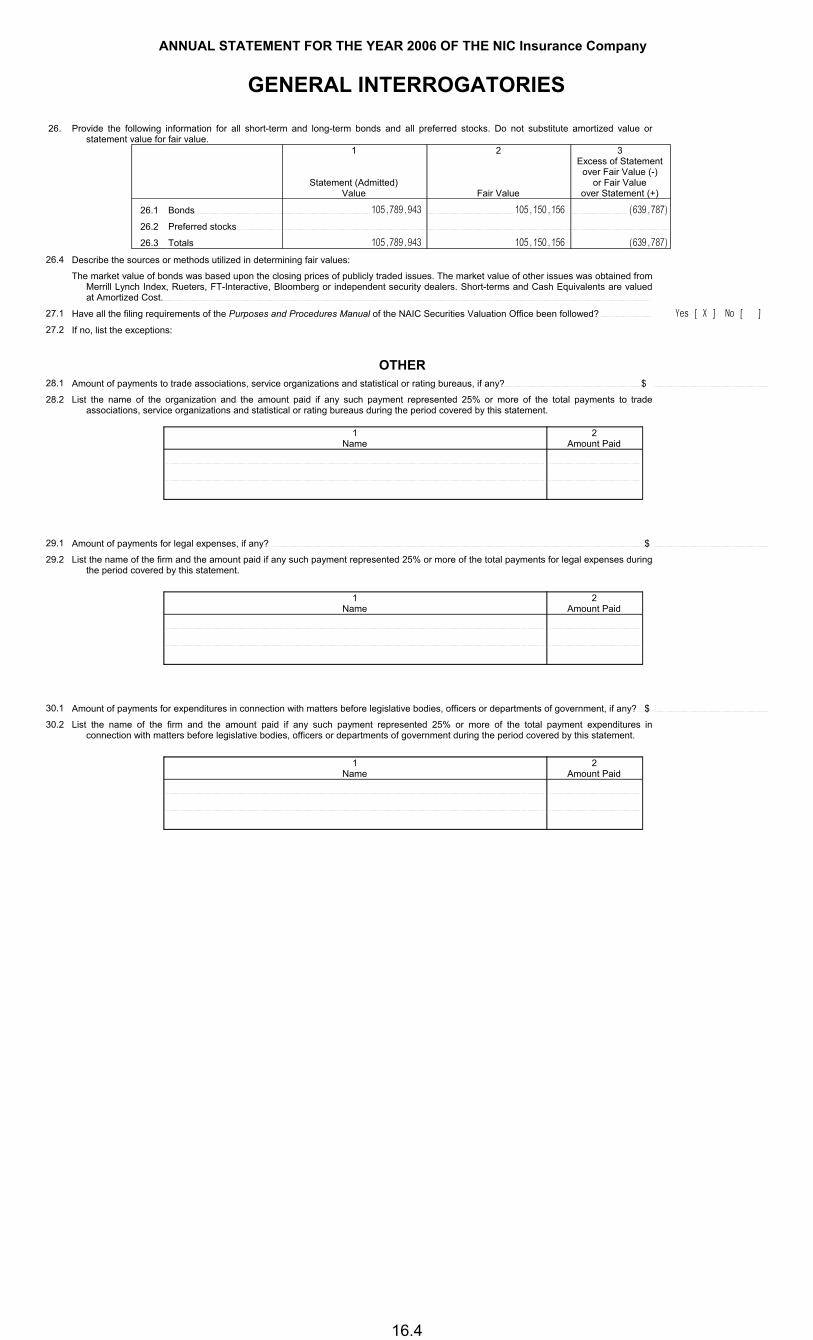
26. Provide the following information for all short-term and long-term bonds and all preferred stocks. Do not substitute amortized value or statement value for fair value.
1
Statement (Admitted)Value
2
Fair Value
3Excess of Statement
over Fair Value (-)or Fair Value
over Statement (+)
26.1 Bonds 105,789,943 105,150,156 (639,787)
26.2 Preferred stocks
26.3 Totals 105,789,943 105,150,156 (639,787)
26.4 Describe the sources or methods utilized in determining fair values:
The market value of bonds was based upon the closing prices of publicly traded issues. The market value of other issues was obtained from Merrill Lynch Index, Rueters, FT-Interactive, Bloomberg or independent security dealers. Short-terms and Cash Equivalents are valued at Amortized Cost.
27.1 Have all the filing requirements of the Purposes and Procedures Manual of the NAIC Securities Valuation Office been followed? Yes [ X ] No [ ]
27.2 If no, list the exceptions:
OTHER28.1 Amount of payments to trade associations, service organizations and statistical or rating bureaus, if any? $
28.2 List the name of the organization and the amount paid if any such payment represented 25% or more of the total payments to trade associations, service organizations and statistical or rating bureaus during the period covered by this statement.
1Name
2Amount Paid
29.1 Amount of payments for legal expenses, if any? $
29.2 List the name of the firm and the amount paid if any such payment represented 25% or more of the total payments for legal expenses during the period covered by this statement.
1Name
2Amount Paid
30.1 Amount of payments for expenditures in connection with matters before legislative bodies, officers or departments of government, if any? $
30.2 List the name of the firm and the amount paid if any such payment represented 25% or more of the total payment expenditures in connection with matters before legislative bodies, officers or departments of government during the period covered by this statement.
1Name
2Amount Paid
16.4

ANNUAL STATEMENT FOR THE YEAR 2006 OF THE NIC Insurance Company
GENERAL INTERROGATORIES(continued)
PART 2 - PROPERTY & CASUALTY INTERROGATORIES1.1 Does the reporting entity have any direct Medicare Supplement Insurance in force? Yes [ ] No [ X ]
1.2 If yes, indicate premium earned on U.S. business only. $
1.3 What portion of Item (1.2) is not reported on the Medicare Supplement Insurance Experience Exhibit? $
1.31 Reason for excluding
1.4 Indicate amount of earned premium attributable to Canadian and/or Other Alien not included in Item (1.2) above. $
1.5 Indicate total incurred claims on all Medicare Supplement insurance. $
1.6 Individual policies:
Most current three years:
1.61 Total premium earned $
1.62 Total incurred claims $
1.63 Number of covered lives
All years prior to most current three years:
1.64 Total premium earned $
1.65 Total incurred claims $
1.66 Number of covered lives
1.7 Group policies:
Most current three years:
1.71 Total premium earned $
1.72 Total incurred claims $
1.73 Number of covered lives
All years prior to most current three years:
1.74 Total premium earned $
1.75 Total incurred claims $
1.76 Number of covered lives
2. Health Test:
1Current Year
2Prior Year
2.1 Premium Numerator $ $
2.2 Premium Denominator $ $
2.3 Premium Ratio (2.1/2.2)
2.4 Reserve Numerator $ $
2.5 Reserve Denominator $ $
2.6 Reserve Ratio (2.4/2.5)
3.1 Does the reporting entity issue both participating and non-participating policies? Yes [ ] No [ X ]3.2 If yes, state the amount of calendar year premiums written on:
3.21 Participating policies $3.22 Non-participating policies $
4. For Mutual reporting entities and Reciprocal Exchanges only:4.1 Does the reporting entity issue assessable policies? Yes [ ] No [ ]4.2 Does the reporting entity issue non-assessable policies? Yes [ ] No [ ]4.3 If assessable policies are issued, what is the extent of the contingent liability of the policyholders? %4.4 Total amount of assessments paid or ordered to be paid during the year on deposit notes or contingent premiums. $
5. For Reciprocal Exchanges Only:5.1 Does the exchange appoint local agents? Yes [ ] No [ ]5.2 If yes, is the commission paid:
5.21 Out of Attorney's-in-fact compensation Yes [ ] No [ ] NA [ ]
5.22 As a direct expense of the exchange Yes [ ] No [ ] NA [ ]5.3 What expenses of the Exchange are not paid out of the compensation of the Attorney-in-fact?
5.4 Has any Attorney-in-fact compensation, contingent on fulfillment of certain conditions, been deferred? Yes [ ] No [ ]5.5 If yes, give full information
17

ANNUAL STATEMENT FOR THE YEAR 2006 OF THE NIC Insurance Company
GENERAL INTERROGATORIESPART 2 - PROPERTY & CASUALTY INTERROGATORIES
6.1 What provision has this reporting entity made to protect itself from an excessive loss in the event of a catastrophe under a workers’ compensation contract issued without limit of loss:The Company does not write workers' compensation insurance.
6.2 Describe the method used to estimate this reporting entity’s probable maximum insurance loss, and identify the type of insured exposures comprising that probable maximum loss, the locations of concentrations of those exposures and the external resources (such as consulting firms or computer software models), if any, used in the estimation process: The Company's business is reinsured by its Parent.
6.3 What provision has this reporting entity made (such as a catastrophic reinsurance program) to protect itself from an excessive loss arising from the types and concentrations of insured exposures comprising its probable maximum property insurance loss?The Company's business is reinsured by its Parent.
6.4 Does the reporting entity carry catastrophe reinsurance protection for at least one reinstatement, in an amount sufficient to cover its estimated probable maximum loss attributable to a single loss event or occurrence? Yes [ ] No [ X ]
6.5 If no, describe any arrangements or mechanisms employed by the reporting entity to supplement its catastrophe reinsurance program or to hedge its exposure to unreinsured catastrophic loss.The Company's business is reinsured by its Parent.
7.1 Has the reporting entity reinsured any risk with any other entity under a quota share reinsurance contract that includes a provision that would limit the reinsurer's losses below the stated quota share percentage (e.g., a deductible, a loss ratio corridor, a loss cap, an aggregate limit or any similar provisions)? Yes [ ] No [ X ]
7.2 If yes, indicate the number of reinsurance contracts containing such provisions.7.3 If yes, does the amount of reinsurance credit taken reflect the reduction in quota share coverage caused by any applicable limiting
provision(s)? Yes [ ] No [ ]8.1 Has this reporting entity reinsured any risk with any other entity and agreed to release such entity from liability, in whole or in part, from
any loss that may occur on the risk, or portion thereof, reinsured? Yes [ ] No [ X ]8.2 If yes, give full information
9.1 Has the reporting entity ceded any risk under any reinsurance contract (or under multiple contracts with the same reinsurer or its affiliates) for which during the period covered by the statement: (i) it recorded a positive or negative underwriting result greater than 3% of prior year-end surplus as regards policyholders or it reported calendar year written premium ceded or year-end loss and loss expense reserves ceded greater than 3% of prior year-end surplus as regards policyholders; (ii) it accounted for that contract as reinsurance and not as a deposit; and (iii) the contract(s) contain one or more of the following features or other features that would have similar results:
(a) A contract term longer than two years and the contract is noncancellable by the reporting entity during the contract term;(b) A limited or conditional cancellation provision under which cancellation triggers an obligation by the reporting entity, or an affiliate of the reporting entity, to enter into a new reinsurance contract with the reinsurer, or an affiliate of the reinsurer;(c) Aggregate stop loss reinsurance coverage;(d) An unconditional or unilateral right by either party to commute the reinsurance contract except for such provisions which are only triggered by a decline in the credit status of the other party;(e) A provision permitting reporting of losses, or payment of losses, less frequently than on a quarterly basis (unless there is no activity during the period); or(f) Payment schedule, accumulating retentions from multiple years or any features inherently designed to delay timing of the reimbursement to the ceding entity. Yes [ ] No [ X ]
9.2 Has the reporting entity during the period covered by the statement ceded any risk under any reinsurance contract (or under multiple contracts with the same reinsurer or its affiliates), excluding cessions to approved pooling agreements or to captive insurance companies that are directly or indirectly controlling, controlled by, or under common control with (i) one or more unaffiliated policyholders of the reporting entity, or (ii) an association of which one or more unaffiliated policyholders of the reporting entity is a member, where:
(a) The written premium ceded to the reinsurer by the reporting entity or its affiliates represents fifty percent (50%) or more of the entire direct and assumed premium written by the reinsurer based on its most recently available financial statement; or(b) Twenty–five percent (25%) or more of the written premium ceded to the reinsurer has been retroceded back to the reporting entity or its affiliates. Yes [ ] No [ X ]
9.3 If yes to 9.1 or 9.2, please provide the following information in the Reinsurance Summary Supplemental Filing for General Interrogatory 9:
(a) The aggregate financial statement impact gross of all such ceded reinsurance contracts on the balance sheet and statement of income;(b) A summary of the reinsurance contract terms and indicate whether it applies to the contracts meeting the criteria in 9.1 or 9.2; and(c) A brief discussion of management's principle objectives in entering into the reinsurance contract including the economic purpose to be achieved.
9.4 Except for transactions meeting the requirements of paragraph 30 of SSAP No. 62, Property and Casualty Reinsurance, has the reporting entity ceded any risk under any reinsurance contract (or multiple contracts with the same reinsurer or its affiliates) during the period covered by the financial statement, and either:
(a) Accounted for that contract as reinsurance (either prospective or retroactive) under statutory accounting principles (“SAP”) and as a deposit under generally accepted accounting principles (“GAAP”); or(b) Accounted for that contract as reinsurance under GAAP and as a deposit under SAP? Yes [ ] No [ X ]
9.5 If yes to 9.4, explain in the Reinsurance Summary Supplemental Filing for General Interrogatory 9 (Section D) why the contract(s) is treated differently for GAAP and SAP.
10. If the reporting entity has assumed risks from another entity, there should be charged on account of such reinsurances a reserve equal to that which the original entity would have been required to charge had it retained the risks. Has this been done? Yes [ ] No [ ] N/A [X]
11.1 Has this reporting entity guaranteed policies issued by any other entity and now in force: Yes [ ] No [ X ]11.2 If yes, give full information
17.1

ANNUAL STATEMENT FOR THE YEAR 2006 OF THE NIC Insurance Company
GENERAL INTERROGATORIESPART 2 - PROPERTY & CASUALTY INTERROGATORIES
12.1 If the reporting entity recorded accrued retrospective premiums on insurance contracts on Line 13.3 of the asset schedule, Page 2, state the amount of corresponding liabilities recorded for:
12.11 Unpaid losses $12.12 Unpaid underwriting expenses (including loss adjustment expenses) $
12.2 Of the amount on Line 13.3, Page 2, state the amount that is secured by letters of credit, collateral and other funds? $12.3 If the reporting entity underwrites commercial insurance risks, such as workers’ compensation, are premium notes or promissory notes
accepted from its insureds covering unpaid premiums and/or unpaid losses? Yes [ ] No [ ] NA [X]
12.4 If yes, provide the range of interest rates charged under such notes during the period covered by this statement:12.41 From %12.42 To %
12.5 Are letters of credit or collateral and other funds received from insureds being utilized by the reporting entity to secure premium notes or promissory notes taken by the reporting entity, or to secure any of the reporting entity’s reported direct unpaid loss reserves, including unpaid losses under loss deductible features of commercial policies? Yes [ ] No [ X ]
12.6 If yes, state the amount thereof at December 31 of the current year:12.61 Letters of Credit $12.62 Collateral and other funds $
13.1 Largest net aggregate amount insured in any one risk (excluding workers’ compensation): $13.2 Does any reinsurance contract considered in the calculation of this amount include an aggregate limit of recovery without also including a
reinstatement provision? Yes [ ] No [ X ]
13.3 State the number of reinsurance contracts (excluding individual facultative risk certificates, but including facultative programs, automatic facilities or facultative obligatory contracts) considered in the calculation of the amount.
1
14.1 Is the company a cedant in a multiple cedant reinsurance contract? Yes [ ] No [ X ]14.2 If yes, please describe the method of allocating and recording reinsurance among the cedants:
14.3 If the answer to 14.1 is yes, are the methods described in item 14.2 entirely contained in the respective multiple cedant reinsurance contracts? Yes [ ] No [ ]
14.4 If the answer to 14.3 is no, are all the methods described in 14.2 entirely contained in written agreements? Yes [ ] No [ ]14.5 If answer to 14.4 is no, please explain:
15.1 Has the reporting entity guaranteed any financed premium accounts? Yes [ ] No [ X ]15.2 If yes, give full information
16.1 Does the reporting entity write any warranty business? Yes [ ] No [ X ]
If yes, disclose the following information for each of the following types of warranty coverage:
1Direct Losses
Incurred
2Direct Losses
Unpaid
3Direct Written
Premium
4Direct Premium
Unearned
5Direct Premium
Earned
16.11 Home $ $ $ $ $
16.12 Products $ $ $ $ $
16.13 Automobile $ $ $ $ $
16.14 Other* $ $ $ $ $
* Disclose type of coverage:
17.2

ANNUAL STATEMENT FOR THE YEAR 2006 OF THE NIC Insurance Company
GENERAL INTERROGATORIESPART 2 - PROPERTY & CASUALTY INTERROGATORIES
17.1 Does the reporting entity include amounts recoverable on unauthorized reinsurance in Schedule F – Part 3 that it excludes from Schedule F – Part 5.
Yes [ ] No [ X ]
Incurred but not reported losses on contracts not in force on July 1, 1984 or subsequently renewed are exempt from inclusion in Schedule F – Part 5. Provide the following information for this exemption:
17.11 Gross amount of unauthorized reinsurance in Schedule F – Part 3 excluded from Schedule F – Part 5
$
17.12 Unfunded portion of Interrogatory 17.11 $
17.13 Paid losses and loss adjustment expenses portion of Interrogatory 17.11
$
17.14 Case reserves portion of Interrogatory 17.11 $
17.15 Incurred but not reported portion of Interrogatory 17.11 $
17.16 Unearned premium portion of Interrogatory 17.11 $
17.17 Contingent commission portion of Interrogatory 17.11 $
Provide the following information for all other amounts included in Schedule F – Part 3 and excluded from Schedule F – Part 5, not included above.
17.18 Gross amount of unauthorized reinsurance in Schedule F – Part 3 excluded from Schedule F – Part 5
$
17.19 Unfunded portion of Interrogatory 17.18 $
17.20 Paid losses and loss adjustment expenses portion of Interrogatory 17.18
$
17.21 Case reserves portion of Interrogatory 17.18 $
17.22 Incurred but not reported portion of Interrogatory 17.18 $
17.23 Unearned premium portion of Interrogatory 17.18 $
17.24 Contingent commission portion of Interrogatory 17.18 $
17.3

ANNUAL STATEMENT FOR THE YEAR 2006 OF THE NIC Insurance Company
FIVE-YEAR HISTORICAL DATAShow amounts in whole dollars only, no cents; show percentages to one decimal place, i.e. 17.6.
12006
22005
32004
42003
52002
Gross Premiums Written (Page 8, Part 1B, Cols. 1, 2 & 3)
1. Liability lines (Lines 11.1, 11.2, 16, 17.1, 17.2, 18.1, 18.2, 19.1, 19.2 & 19.3, 19.4) 219,240,960 176,413,521 140,751,489 120,111,390 68,461,487
2. Property lines (Lines 1, 2, 9, 12, 21 & 26)3. Property and liability combined lines (Lines 3, 4, 5,
8, 22 & 27) 12,477,464 4. All other lines (Lines 6, 10, 13, 14, 15, 23, 24, 28, 29
& 33) 5. Nonproportional reinsurance lines (Lines 30, 31 &
32) 6. Total (Line 34) 231,718,424 176,413,521 140,751,489 120,111,390 68,461,487
Net Premiums Written (Page 8, Part 1B, Col. 6)7. Liability lines (Lines 11.1, 11.2, 16, 17.1, 17.2, 18.1,
18.2, 19.1, 19.2 & 19.3, 19.4) 8. Property lines (Lines 1, 2, 9, 12, 21 & 26) 9. Property and liability combined lines
(Lines 3, 4, 5, 8, 22 & 27) 10. All other lines
(Lines 6, 10, 13, 14, 15, 23, 24, 28, 29 & 33) 11. Nonproportional reinsurance lines
(Lines 30, 31 & 32) 12. Total (Line 34)
Statement of Income (Page 4)13. Net underwriting gain (loss) (Line 8) 14. Net investment gain (loss) (Line 11) 5,096,478 2,764,867 2,369,370 1,265,068 580,701 15. Total other income (Line 15) 44 894 16. Dividends to policyholders (Line 17) 17. Federal and foreign income taxes incurred
(Line 19) 1,785,286 977,021 708,714 418,874 192,623
18. Net income (Line 20) 3,311,192 1,787,846 1,660,700 847,088 388,078
Balance Sheet Lines (Pages 2 and 3)19. Total admitted assets excluding protected cell
business (Page 2, Line 24, Col. 3) 134,342,913 124,451,784 69,848,381 77,328,283 36,267,039 20. Premiums and considerations (Page 2, Col. 3)
20.1 In course of collection (Line 13.1) 26,505,457 18,948,725 16,876,257 17,511,607 11,380,238
20.2 Deferred and not yet due (Line 13.2) 20.3 Accrued retrospective premiums (Line 13.3)
21. Total liabilities excluding protected cellbusiness (Page 3, Line 24) 27,569,971 20,968,364 18,256,494 27,397,095 12,182,939
22. Losses (Page 3, Line 1) 23. Loss adjustment expenses (Page 3, Line 3) 24. Unearned premiums (Page 3, Line 9) 25. Capital paid up (Page 3, Lines 28 & 29) 5,000,000 5,000,000 5,000,000 5,000,000 5,000,000 26. Surplus as regards policyholders (Page 3, Line 35) 106,772,942 103,483,420 51,591,887 49,931,188 24,084,100
Risk-Based Capital Analysis27. Total adjusted capital 106,772,942 103,483,420 51,591,887 49,931,188 24,084,100 28. Authorized control level risk-based capital 423,111 265,948 166,306 147,162 65,106
Percentage Distribution of Cash, Cash Equivalents and Invested Assets (Page 2, Col. 3)(Item divided by Page 2, Line 10,
Col. 3) x 100.029. Bonds (Line 1) 98.9 84.9 83.5 68.5 89.9 30. Stocks (Lines 2.1 & 2.2) 31. Mortgage loans on real estate (Lines 3.1 and 3.2) 32. Real estate (Lines 4.1, 4.2 & 4.3) 33. Cash, cash equivalents and short-term investments
(Line 5) 1.1 15.1 16.5 31.5 10.1 34. Contract loans (Line 6) XXX35. Other invested assets (Line 7) 36. Receivables for securities (Line 8) 0.0 37. Aggregate write-ins for invested assets (Line 9) 38. Cash, cash equivalents and invested assets (Line
10) 100.0 100.0 100.0 100.0 100.0Investments in Parent, Subsidiaries and Affiliates
39. Affiliated bonds, (Sch. D, Summary, Line 25, Col. 1)
40. Affiliated preferred stocks(Sch. D, Summary, Line 39, Col. 1)
41. Affiliated common stocks(Sch. D, Summary, Line 53, Col. 2)
42. Affiliated short-term investments (subtotals included in Schedule DA, Part 2, Col. 5, Line 11)
43. Affiliated mortgage loans on real estate 44. All other affiliated 45. Total of above Lines 39 to 44 46. Percentage of investments in parent, subsidiaries
and affiliates to surplus as regards policyholders (Line 45 above divided by Page 3, Col. 1, Line 35 x 100.0)
18

ANNUAL STATEMENT FOR THE YEAR 2006 OF THE NIC Insurance Company
FIVE-YEAR HISTORICAL DATA(Continued)
12006
22005
32004
42003
52002
Capital and Surplus Accounts (Page 4)
47. Net unrealized capital gains (losses) (Line 24) (21,671) 103,686
48. Dividends to stockholders (Line 35) 49. Change in surplus as regards policyholders for the
year (Line 38) 3,289,522 51,891,533 1,660,700 25,847,088 388,078
Gross Losses Paid (Page 9, Part 2, Cols. 1 & 2)
50. Liability lines (Lines 11.1, 11.2, 16, 17.1, 17.2, 18.1, 18.2, 19.1, 19.2 & 19.3, 19.4) 18,266,247 13,886,770 5,160,187 2,241,349 1,011,026
51. Property lines (Lines 1, 2, 9, 12, 21 & 26) 52. Property and liability combined lines
(Lines 3, 4, 5, 8, 22 & 27) 63,127
53. All other lines(Lines 6, 10, 13, 14, 15, 23, 24, 28, 29 & 33)
54. Nonproportional reinsurance lines(Lines 30, 31 & 32)
55. Total (Line 34) 18,329,374 13,886,770 5,160,187 2,241,349 1,011,026
Net Losses Paid (Page 9, Part 2, Col. 4)
56. Liability lines (Lines 11.1, 11.2, 16, 17.1, 17.2, 18.1, 18.2, 19.1, 19.2 & 19.3, 19.4)
57. Property lines (Lines 1, 2, 9, 12, 21 & 26) 58. Property and liability combined lines
(Lines 3, 4, 5, 8, 22 & 27) 59. All other lines
(Lines 6, 10, 13, 14, 15, 23, 24, 28, 29 & 33) 60. Nonproportional reinsurance lines
(Lines 30, 31 & 32) 61. Total (Line 34)
Operating Percentages (Page 4) (Item divided by Page 4, Line 1) x 100.0
62. Premiums earned (Line 1) 100.0 100.0 100.0 100.0 100.063. Losses incurred (Line 2) 64. Loss expenses incurred (Line 3) 65. Other underwriting expenses incurred (Line 4) 66. Net underwriting gain (loss) (Line 8)
Other Percentages
67. Other underwriting expenses to net premiums written (Page 4, Lines 4 + 5 - 15 divided by Page 8, Part 1B, Col. 6, Line 34 x 100.0)
68. Losses and loss expenses incurred to premiums earned (Page 4, Lines 2 + 3 divided byPage 4, Line 1 x 100.0)
69. Net premiums written to policyholders' surplus(Page 8, Part 1B, Col. 6, Line 34 divided by Page 3, Line 35, Col. 1 x 100.0)
One Year Loss Development (000 omitted)
70. Development in estimated losses and lossexpenses incurred prior to current year(Schedule P, Part 2 - Summary, Line 12, Col. 11)
71. Percent of development of losses and loss expenses incurred to policyholders' surplus of prior year end (Line 70 above divided by Page 4,Line 21, Col. 1 x 100.0)
Two Year Loss Development (000 omitted)
72. Development in estimated losses and loss expenses incurred 2 years before the current year and prior year (Schedule P, Part 2 - Summary, Line 12, Col. 12)
73. Percent of development of losses and loss expenses incurred to reported policyholders' surplus of second prior year end (Line 72 above divided by Page 4, Line 21, Col. 2 x 100.0)
19

*36056200643059100*ANNUAL STATEMENT FOR THE YEAR 2006 OF THE NIC Insurance Company
EXHIBIT OF PREMIUMS AND LOSSES (Statutory Page 14)NAIC Group Code 0510 BUSINESS IN THE STATE OF Consolidated DURING THE YEAR 2006 NAIC Company Code 36056
Gross Premiums, Including Policy andMembership Fees
Less Return Premiums andPremiums on Policies not Taken
3
Dividends Paid
4
Direct
5
Direct Losses
6 7 8
Direct Defense and Cost
9
Direct Defense and Cost
10
Direct Defense and Cost
11 12
Line of Business
1Direct Premiums
Written
2Direct Premiums
Earned
or Credited to Policyholders on Direct Business
Unearned PremiumReserves
Paid(deducting salvage)
Direct Losses Incurred
Direct Losses Unpaid
Containment Expense
Paid
Containment ExpenseIncurred
Containment ExpenseUnpaid
Commissionsand Brokerage
Expenses
Taxes,Licenses and
Fees1. Fire 2.1 Allied lines 2.2 Multiple peril crop 2.3 Federal flood 3. Farmowners multiple peril 4. Homeowners multiple peril 5.1 Commercial multiple peril (non-liability portion) 5,218 2,211 3,007 1,044 5.2 Commercial multiple peril (liability portion) 12,367,129 7,747,413 4,619,716 63,127 7,195,554 7,132,427 29,072 629,618 600,546 2,459,537 6. Mortgage guaranty 8. Ocean marine 105,117 39,740 65,377 23,404 23,404 1,762 1,762 26,279 9. Inland marine
10. Financial guaranty 11. Medical malpractice 12. Earthquake 13. Group accident and health (b)14. Credit A & H (group and individual) 15.1 Collectively renewable A & H (b)15.2 Non-cancelable A & H (b)15.3 Guaranteed renewable A & H (b)15.4 Non-renewable for stated reasons only (b)15.5 Other accident only 15.6 All other A & H (b)15.7 Federal employees health benefits program premium (b)16. Workers' compensation 17. Other liability 219,240,960 192,901,308 108,653,186 18,266,247 72,068,619 256,612,695 8,532,100 22,778,267 26,515,898 35,940,689 18. Products liability 19.1 Private passenger auto no-fault (personal injury protection) 19.2 Other private passenger auto liability 19.3 Commercial auto no-fault (personal injury protection) 19.4 Other commercial auto liability 21.1 Private passenger auto physical damage 21.2 Commercial auto physical damage 22. Aircraft (all perils) 23. Fidelity 24. Surety 26. Burglary and theft 27. Boiler and machinery 28. Credit 33. Aggregate write-ins for other lines of business 34. TOTALS (a) 231,718,424 200,690,672 113,341,286 18,329,374 79,287,577 263,768,526 8,561,173 23,409,647 27,118,206 38,427,549
DETAILS OF WRITE-INS3301.3302.3303.3398. Summary of remaining write-ins for Line 33 from overflow page 3399. Totals (Lines 3301 through 3303 plus 3398) (Line 33 above) (a) Finance and service charges not included in Lines 1 to 34 $ . (b) For health business on indicated lines report: Number of persons insured under PPO managed care products and number of persons insured under indemnity only products
20.GT

ANNUAL STATEMENT FOR THE YEAR 2006 OF THE NIC Insurance Company
SCHEDULE A - VERIFICATION BETWEEN YEARSReal Estate
1. Book/adjusted carrying value, December 31, prior year2. Increase (decrease) by adjustment:
2.1 Totals, Part 1, Column 11 2.2 Totals, Part 3, Column 7
3. Cost of acquired, (Totals, Part 2, Column 6, net of encumbrances (Column 7) and net of additions and permanent improvements (Column 9) 4. Cost of additions and permanent improvements:
4.1 Totals, Part 1, Column 144.2 Totals, Part 3, Column 9
5. Total profit (loss) on sales, Part 3, Column 14 6. Increase (decrease) by foreign exchange adjustment:
6.1 Totals, Part 1, Column 126.2 Totals, Part 3, Column 8
7. Amounts received on sales, Part 3, Column 11 and Part 1, Column 13 8. Book/adjusted carrying value at end of current period 9. Total valuation allowance
10. Subtotal (Lines 8 plus 9) 11. Total nonadmitted amounts 12. Statement value, current period (Page 2, real estate lines, Net Admitted Assets column)
SCHEDULE B - VERIFICATION BETWEEN YEARSMortgage Loans
1. Book value/recorded investment excluding accrued interest of mortgages owned, December 31 of prior year 2. Amount loaned during year:
2.1 Actual cost at time of acquisitions 2.2 Additional investment made after acquisitions
3. Accrual of discount and mortgage interest points and commitment fees 4. Increase (decrease) by adjustment 5. Total profit (loss) on sale 6. Amounts paid on account or in full during the year 7. Amortization of premium 8. Increase (decrease) by foreign exchange adjustment 9. Book value/recorded investment excluding accrued interest on mortgages owned at end of current period
10. Total valuation allowance 11. Subtotal (Lines 9 plus 10) 12. Total nonadmitted amounts 13. Statement value of mortgages owned at end of current period (Page 2, mortgage lines, Net Admitted Assets column)
SCHEDULE BA - VERIFICATION BETWEEN YEARSLong-Term Invested Assets
1. Book/adjusted carrying value of long-term invested assets owned, December 31 of prior year 2. Cost of acquisitions during year:
2.1 Actual cost at time of acquisitions 2.2 Additional investment made after acquisitions
3. Accrual of discount 4. Increase (decrease) by adjustment 5. Total profit (loss) on sale 6. Amounts paid on account or in full during the year 7. Amortization of premium 8. Increase (decrease) by foreign exchange adjustment 9. Book/adjusted carrying value of long-term invested assets at end of current period
10. Total valuation allowance 11. Subtotal (Lines 9 plus 10) 12. Total nonadmitted amounts 13. Statement value of long-term invested assets at end of current period (Page 2, Line 7, Column 3)
21
NONE
NONE
NONE

ANNUAL STATEMENT FOR THE YEAR 2006 OF THE NIC Insurance Company
SCHEDULE D - SUMMARY BY COUNTRYLong-Term Bonds and Stocks OWNED December 31 of Current Year
Description
1Book/Adjusted Carrying Value
2
Fair Value
3
Actual Cost
4
Par Value of BondsBONDS 1. United States 16,721,587 16,565,180 16,806,452 15,686,909
Governments 2. Canada (Including all obligations guaranteed 3. Other Countries 157,850 162,000 157,875 150,000 by governments) 4. Totals 16,879,437 16,727,180 16,964,327 15,836,909
States, Territories and Possessions 5. United States 528,875 534,255 524,368 530,000 (Direct and guaranteed) 6. Canada
7. Other Countries 8. Totals 528,875 534,255 524,368 530,000
Political Subdivisions of States, 9. United States 323,303 337,090 319,894 325,000 Territories and Possessions 10. Canada
(Direct and guaranteed) 11. Other Countries 12. Totals 323,303 337,090 319,894 325,000
Special revenue and special assessmentobligations and all non-guaranteed 13. United States 41,200,601 40,875,038 41,248,927 41,342,471 obligations of agencies and authorities of 14. Canada governments and their political subdivisions 15. Other Countries
16. Totals 41,200,601 40,875,038 41,248,927 41,342,471
Public Utilities (unaffiliated) 17. United States 2,212,219 2,253,165 2,220,199 2,205,000 18. Canada 19. Other Countries 20. Totals 2,212,219 2,253,165 2,220,199 2,205,000
Industrial and Miscellaneous and Credit Tenant 21. United States 40,958,621 40,751,030 41,196,378 40,487,088 Loans (unaffiliated) 22. Canada 643,763 653,644 646,260 635,000
23. Other Countries 3,043,123 3,018,755 3,071,712 2,935,000
24. Totals 44,645,507 44,423,429 44,914,351 44,057,088
Parent, Subsidiaries and Affiliates 25. Totals 26. Total Bonds 105,789,943 105,150,156 106,192,065 104,296,468
PREFERRED STOCKS 27. United States Public Utilities (unaffiliated) 28. Canada
29. Other Countries 30. Totals
Banks, Trust and Insurance Companies 31. United States (unaffiliated) 32. Canada
33. Other Countries 34. Totals
Industrial and Miscellaneous (unaffiliated) 35. United States 36. Canada
37. Other Countries 38. Totals
Parent, Subsidiaries and Affiliates 39. Totals 40. Total Preferred Stocks
COMMON STOCKS 41. United States Public Utilities (unaffiliated) 42. Canada
43. Other Countries 44. Totals
Banks, Trust and Insurance Companies 45. United States (unaffiliated) 46. Canada
47. Other Countries 48. Totals
Industrial and Miscellaneous (unaffiliated) 49. United States 50. Canada 51. Other Countries 52. Totals
Parent, Subsidiaries and Affiliates 53. Totals 54. Total Common Stocks 55. Total Stocks 56. Total Bonds and Stocks 105,789,943 105,150,156 106,192,065
SCHEDULE D - VERIFICATION BETWEEN YEARSBonds and Stocks
1. Book/adjusted carrying value of bonds and stocks, prior year 88,940,625 7. Amortization of premium 353,148
2. Cost of bonds and stocks acquired, Column 7, Part 3 29,292,165 8. Foreign Exchange Adjustment:3. Accrual of discount 137,614 8.1 Column 15, Part 1 4. Increase (decrease) by adjustment: 8.2 Column 19, Part 2, Sec. 1
4.1 Columns 12 - 14, Part 1 (21,671) 8.3 Column 16, Part 2, Sec. 2 4.2 Columns 15 - 17, Part 2, Sec. 1 8.4 Column 15, Part 4 4.3 Column 15, Part 2, Sec. 2 9. Book/adjusted carrying value at end of current period 105,789,944 4.4 Columns 11 - 13, Part 4 (21,671) 10. Total valuation allowance
5. Total gain (loss), Column 19, Part 4 (44,104) 11. Subtotal (Lines 9 plus 10) 105,789,944 6. Deduct consideration for bonds and stocks disposed of 12. Total nonadmitted amounts
Column 7, Part 4 12,161,537 13. Statement value of bonds and stocks, current period 105,789,944
22

ANNUAL STATEMENT FOR THE YEAR 2006 OF THE NIC Insurance Company
SCHEDULE D - PART 1A - SECTION 1Quality and Maturity Distribution of All Bonds Owned December 31, at Book/Adjusted Carrying Values by Major Types of Issues and NAIC Designations
Quality Rating per the NAIC Designation
1
1 Year or Less
2Over 1 Year Through
5 Years
3Over 5 Years Through
10 Years
4Over 10 Years
Through 20 Years
5
Over 20 Years
6
Total Current Year
7Col. 6 as a
% of Line 10.7
8Total from Col. 6
Prior Year
9% From Col. 7
Prior Year
10Total Publicly
Traded
11Total Privately Placed
(a)1. U.S. Governments, Schedules D & DA (Group 1)
1.1 Class 1 3,624,348 3,765,507 5,918,967 430,302 2,982,464 16,721,587 15.7 32,202,109 31.2 16,721,587 1.2 Class 2 1.3 Class 3 1.4 Class 4 1.5 Class 5 1.6 Class 6 1.7 Totals 3,624,348 3,765,507 5,918,967 430,302 2,982,464 16,721,587 15.7 32,202,109 31.2 16,721,587
2. All Other Governments, Schedules D & DA (Group 2)2.1 Class 1 2.2 Class 2 157,850 157,850 0.1 157,850 2.3 Class 3 2.4 Class 4 2.5 Class 5 2.6 Class 6 2.7 Totals 157,850 157,850 0.1 157,850
3. States, Territories and Possessions etc., Guaranteed, Schedules D & DA (Group 3)3.1 Class 1 503,903 24,972 528,875 0.5 528,214 0.5 528,875 3.2 Class 2 3.3 Class 3 3.4 Class 4 3.5 Class 5 3.6 Class 6 3.7 Totals 503,903 24,972 528,875 0.5 528,214 0.5 528,875
4. Political Subdivisions of States, Territories and Possessions, Guaranteed, Schedules D & DA (Group 4)4.1 Class 1 323,303 323,303 0.3 322,750 0.3 323,303 4.2 Class 24.3 Class 3 4.4 Class 4 4.5 Class 5 4.6 Class 6 4.7 Totals 323,303 323,303 0.3 322,750 0.3 323,303
5. Special Revenue & Special Assessment Obligations etc., Non-Guaranteed, Schedules D & DA (Group 5)5.1 Class 1 6,313,572 17,658,800 11,976,757 4,660,341 591,131 41,200,601 39.0 32,445,602 31.6 41,200,601 5.2 Class 2 5.3 Class 3 5.4 Class 4 5.5 Class 5 5.6 Class 6 5.7 Totals 6,313,572 17,658,800 11,976,757 4,660,341 591,131 41,200,601 39.0 32,445,602 31.6 41,200,601
23

ANNUAL STATEMENT FOR THE YEAR 2006 OF THE NIC Insurance Company
SCHEDULE D - PART 1A - SECTION 1 (continued)Quality and Maturity Distribution of All Bonds Owned December 31, at Book/Adjusted Carrying Values by Major Types of Issues and NAIC Designations
Quality Rating per the NAIC Designation
1
1 Year or Less
2Over 1 Year Through
5 Years
3Over 5 Years Through
10 Years
4Over 10 Years
Through 20 Years
5
Over 20 Years
6
Total Current Year
7Col. 6 as a
% of Line 10.7
8Total from Col. 6
Prior Year
9% From Col. 7
Prior Year
10Total Publicly
Traded
11Total Privately Placed
(a)6. Public Utilities (Unaffiliated), Schedules D & DA (Group 6)
6.1 Class 1 124,905 1,159,834 651,998 1,936,737 1.8 1,732,025 1.8 1,833,690 103,047 6.2 Class 2 151,276 124,206 275,482 0.3 380,465 0.4 275,482 6.3 Class 3 6.4 Class 4 6.5 Class 5 6.6 Class 6 6.7 Totals 124,905 1,159,834 803,274 124,206 2,212,219 2.1 2,112,490 2.2 2,109,172 103,047
7. Industrial & Miscellaneous (Unaffiliated), Schedules D & DA (Group 7)7.1 Class 1 5,005,902 16,251,522 13,698,348 482,548 1,266,406 36,704,727 34.7 29,896,850 27.2 33,035,206 3,669,521 7.2 Class 2 126,238 2,892,614 3,574,361 394,011 953,557 7,940,780 7.5 6,244,154 7.0 7,593,667 347,113 7.3 Class 3 7.4 Class 4 7.5 Class 5 7.6 Class 6 7.7 Totals 5,132,140 19,144,136 17,272,708 876,559 2,219,963 44,645,507 42.2 36,141,004 34.2 40,628,873 4,016,635
8. Credit Tenant Loans, Schedules D & DA (Group 8)8.1 Class 1 8.2 Class 2 8.3 Class 3 8.4 Class 4 8.5 Class 5 8.6 Class 6 8.7 Totals
9. Parent, Subsidiaries and Affiliates, Schedules D & DA (Group 9)9.1 Class 1 9.2 Class 2 9.3 Class 3 9.4 Class 4 9.5 Class 59.6 Class 6 9.7 Totals
24
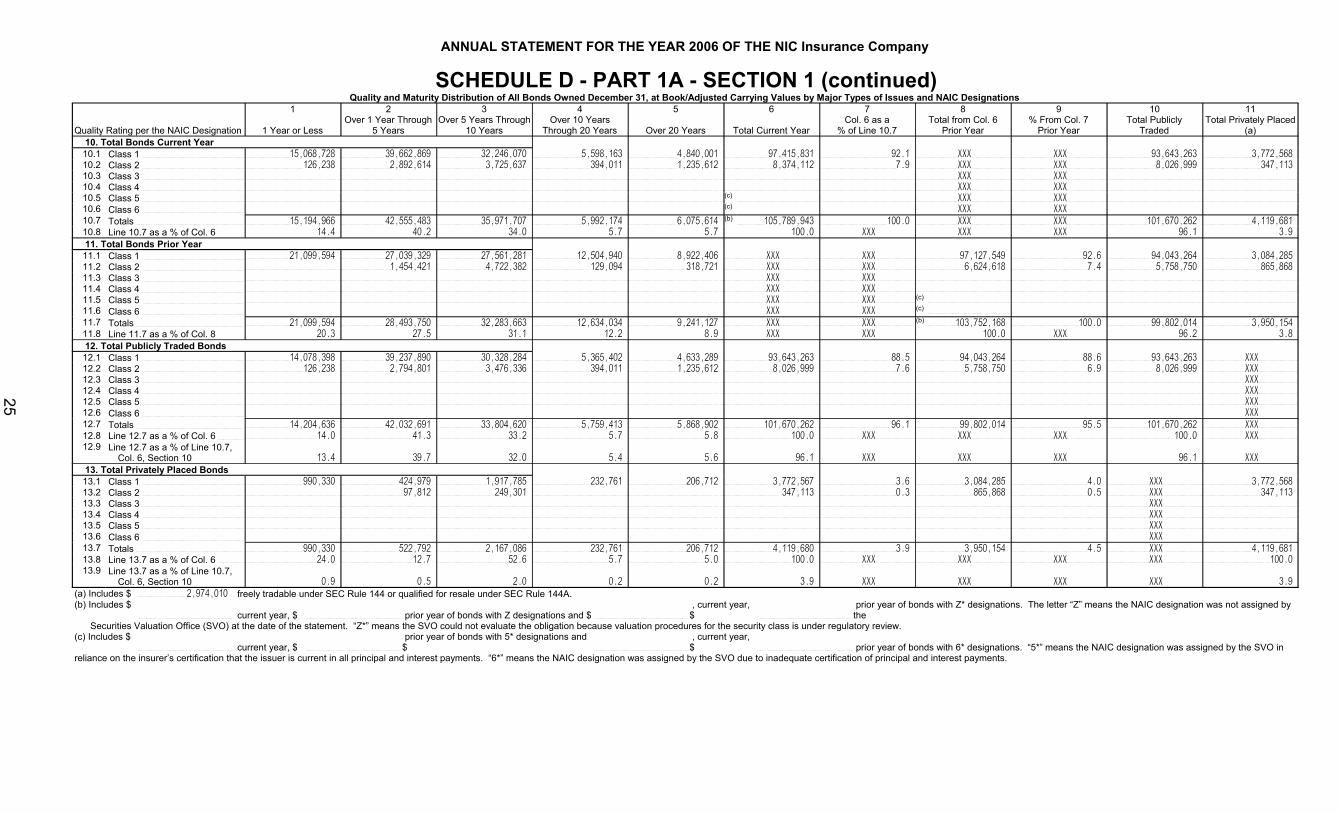
ANNUAL STATEMENT FOR THE YEAR 2006 OF THE NIC Insurance Company
SCHEDULE D - PART 1A - SECTION 1 (continued)Quality and Maturity Distribution of All Bonds Owned December 31, at Book/Adjusted Carrying Values by Major Types of Issues and NAIC Designations
Quality Rating per the NAIC Designation
1
1 Year or Less
2Over 1 Year Through
5 Years
3Over 5 Years Through
10 Years
4Over 10 Years
Through 20 Years
5
Over 20 Years
6
Total Current Year
7Col. 6 as a
% of Line 10.7
8Total from Col. 6
Prior Year
9% From Col. 7
Prior Year
10Total Publicly
Traded
11Total Privately Placed
(a) 10. Total Bonds Current Year10.1 Class 1 15,068,728 39,662,869 32,246,070 5,598,163 4,840,001 97,415,831 92.1 XXX XXX 93,643,263 3,772,568 10.2 Class 2 126,238 2,892,614 3,725,637 394,011 1,235,612 8,374,112 7.9 XXX XXX 8,026,999 347,113 10.3 Class 3 XXX XXX10.4 Class 4 XXX XXX10.5 Class 5 (c) XXX XXX10.6 Class 6 (c) XXX XXX10.7 Totals 15,194,966 42,555,483 35,971,707 5,992,174 6,075,614 (b) 105,789,943 100.0 XXX XXX 101,670,262 4,119,681 10.8 Line 10.7 as a % of Col. 6 14.4 40.2 34.0 5.7 5.7 100.0 XXX XXX XXX 96.1 3.9 11. Total Bonds Prior Year11.1 Class 1 21,099,594 27,039,329 27,561,281 12,504,940 8,922,406 XXX XXX 97,127,549 92.6 94,043,264 3,084,285 11.2 Class 2 1,454,421 4,722,382 129,094 318,721 XXX XXX 6,624,618 7.4 5,758,750 865,868 11.3 Class 3 XXX XXX11.4 Class 4 XXX XXX11.5 Class 5 XXX XXX (c)
11.6 Class 6 XXX XXX (c)
11.7 Totals 21,099,594 28,493,750 32,283,663 12,634,034 9,241,127 XXX XXX (b) 103,752,168 100.0 99,802,014 3,950,154 11.8 Line 11.7 as a % of Col. 8 20.3 27.5 31.1 12.2 8.9 XXX XXX 100.0 XXX 96.2 3.8 12. Total Publicly Traded Bonds12.1 Class 1 14,078,398 39,237,890 30,328,284 5,365,402 4,633,289 93,643,263 88.5 94,043,264 88.6 93,643,263 XXX12.2 Class 2 126,238 2,794,801 3,476,336 394,011 1,235,612 8,026,999 7.6 5,758,750 6.9 8,026,999 XXX12.3 Class 3 XXX12.4 Class 4 XXX12.5 Class 5 XXX12.6 Class 6 XXX12.7 Totals 14,204,636 42,032,691 33,804,620 5,759,413 5,868,902 101,670,262 96.1 99,802,014 95.5 101,670,262 XXX12.8 Line 12.7 as a % of Col. 6 14.0 41.3 33.2 5.7 5.8 100.0 XXX XXX XXX 100.0 XXX12.9 Line 12.7 as a % of Line 10.7,
Col. 6, Section 10 13.4 39.7 32.0 5.4 5.6 96.1 XXX XXX XXX 96.1 XXX 13. Total Privately Placed Bonds13.1 Class 1 990,330 424,979 1,917,785 232,761 206,712 3,772,567 3.6 3,084,285 4.0 XXX 3,772,568 13.2 Class 2 97,812 249,301 347,113 0.3 865,868 0.5 XXX 347,113 13.3 Class 3 XXX13.4 Class 4 XXX13.5 Class 5 XXX13.6 Class 6 XXX13.7 Totals 990,330 522,792 2,167,086 232,761 206,712 4,119,680 3.9 3,950,154 4.5 XXX 4,119,681 13.8 Line 13.7 as a % of Col. 6 24.0 12.7 52.6 5.7 5.0 100.0 XXX XXX XXX XXX 100.0 13.9 Line 13.7 as a % of Line 10.7,
Col. 6, Section 10 0.9 0.5 2.0 0.2 0.2 3.9 XXX XXX XXX XXX 3.9 (a) Includes $ 2,974,010 freely tradable under SEC Rule 144 or qualified for resale under SEC Rule 144A. (b) Includes $
current year, $ prior year of bonds with Z designations and $ , current year, $
prior year of bonds with Z* designations. The letter “Z” means the NAIC designation was not assigned by the
Securities Valuation Office (SVO) at the date of the statement. “Z*” means the SVO could not evaluate the obligation because valuation procedures for the security class is under regulatory review. (c) Includes $
current year, $ prior year of bonds with 5* designations and $
, current year, $ prior year of bonds with 6* designations. “5*” means the NAIC designation was assigned by the SVO in
reliance on the insurer’s certification that the issuer is current in all principal and interest payments. “6*” means the NAIC designation was assigned by the SVO due to inadequate certification of principal and interest payments.
25
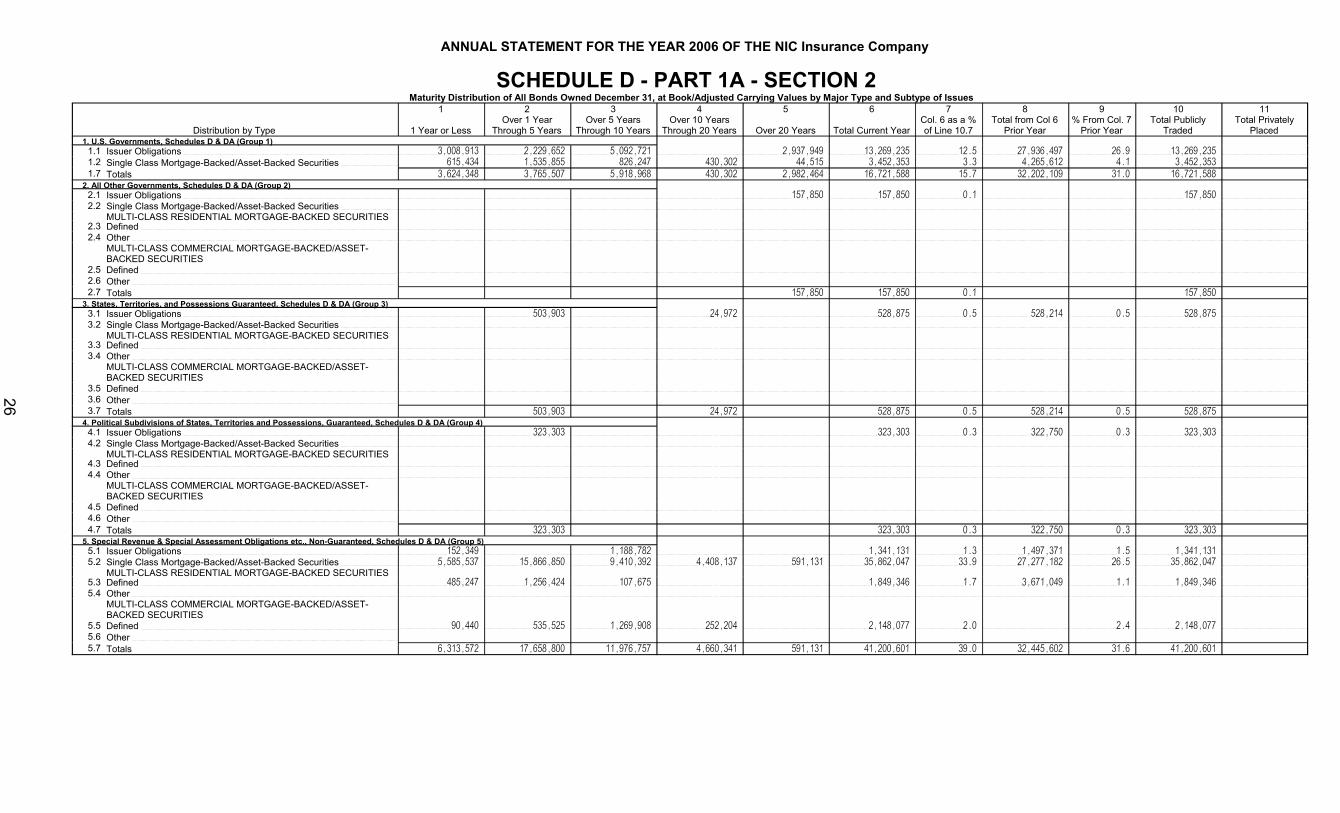
ANNUAL STATEMENT FOR THE YEAR 2006 OF THE NIC Insurance Company
SCHEDULE D - PART 1A - SECTION 2Maturity Distribution of All Bonds Owned December 31, at Book/Adjusted Carrying Values by Major Type and Subtype of Issues
Distribution by Type
1
1 Year or Less
2Over 1 Year
Through 5 Years
3Over 5 Years
Through 10 Years
4Over 10 Years
Through 20 Years
5
Over 20 Years
6
Total Current Year
7Col. 6 as a %of Line 10.7
8Total from Col 6
Prior Year
9% From Col. 7
Prior Year
10Total Publicly
Traded
11Total Privately
Placed1. U.S. Governments, Schedules D & DA (Group 1)
1.1 Issuer Obligations 3,008,913 2,229,652 5,092,721 2,937,949 13,269,235 12.5 27,936,497 26.9 13,269,235 1.2 Single Class Mortgage-Backed/Asset-Backed Securities 615,434 1,535,855 826,247 430,302 44,515 3,452,353 3.3 4,265,612 4.1 3,452,353 1.7 Totals 3,624,348 3,765,507 5,918,968 430,302 2,982,464 16,721,588 15.7 32,202,109 31.0 16,721,588
2. All Other Governments, Schedules D & DA (Group 2)2.1 Issuer Obligations 157,850 157,850 0.1 157,850 2.2 Single Class Mortgage-Backed/Asset-Backed Securities
MULTI-CLASS RESIDENTIAL MORTGAGE-BACKED SECURITIES2.3 Defined 2.4 Other
MULTI-CLASS COMMERCIAL MORTGAGE-BACKED/ASSET-BACKED SECURITIES
2.5 Defined 2.6 Other 2.7 Totals 157,850 157,850 0.1 157,850
3. States, Territories, and Possessions Guaranteed, Schedules D & DA (Group 3)3.1 Issuer Obligations 503,903 24,972 528,875 0.5 528,214 0.5 528,875 3.2 Single Class Mortgage-Backed/Asset-Backed Securities
MULTI-CLASS RESIDENTIAL MORTGAGE-BACKED SECURITIES3.3 Defined 3.4 Other
MULTI-CLASS COMMERCIAL MORTGAGE-BACKED/ASSET-BACKED SECURITIES
3.5 Defined 3.6 Other 3.7 Totals 503,903 24,972 528,875 0.5 528,214 0.5 528,875
4. Political Subdivisions of States, Territories and Possessions, Guaranteed, Schedules D & DA (Group 4)4.1 Issuer Obligations 323,303 323,303 0.3 322,750 0.3 323,303 4.2 Single Class Mortgage-Backed/Asset-Backed Securities
MULTI-CLASS RESIDENTIAL MORTGAGE-BACKED SECURITIES4.3 Defined 4.4 Other
MULTI-CLASS COMMERCIAL MORTGAGE-BACKED/ASSET-BACKED SECURITIES
4.5 Defined 4.6 Other 4.7 Totals 323,303 323,303 0.3 322,750 0.3 323,303
5. Special Revenue & Special Assessment Obligations etc., Non-Guaranteed, Schedules D & DA (Group 5)5.1 Issuer Obligations 152,349 1,188,782 1,341,131 1.3 1,497,371 1.5 1,341,131 5.2 Single Class Mortgage-Backed/Asset-Backed Securities 5,585,537 15,866,850 9,410,392 4,408,137 591,131 35,862,047 33.9 27,277,182 26.5 35,862,047
MULTI-CLASS RESIDENTIAL MORTGAGE-BACKED SECURITIES5.3 Defined 485,247 1,256,424 107,675 1,849,346 1.7 3,671,049 1.1 1,849,346 5.4 Other
MULTI-CLASS COMMERCIAL MORTGAGE-BACKED/ASSET-BACKED SECURITIES
5.5 Defined 90,440 535,525 1,269,908 252,204 2,148,077 2.0 2.4 2,148,077 5.6 Other 5.7 Totals 6,313,572 17,658,800 11,976,757 4,660,341 591,131 41,200,601 39.0 32,445,602 31.6 41,200,601
26
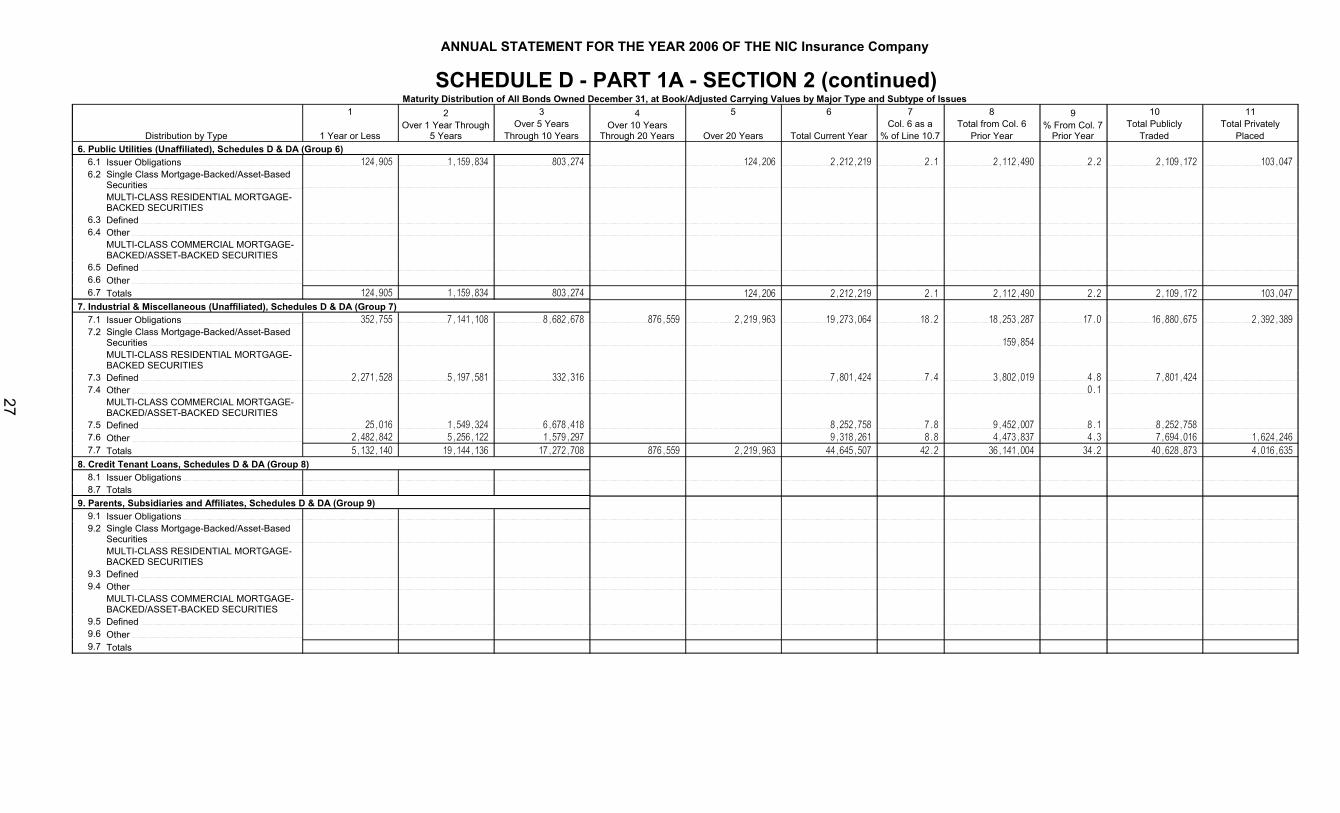
ANNUAL STATEMENT FOR THE YEAR 2006 OF THE NIC Insurance Company
SCHEDULE D - PART 1A - SECTION 2 (continued)Maturity Distribution of All Bonds Owned December 31, at Book/Adjusted Carrying Values by Major Type and Subtype of Issues
Distribution by Type
1
1 Year or Less
2Over 1 Year Through
5 Years
3Over 5 Years
Through 10 Years
4Over 10 Years
Through 20 Years
5
Over 20 Years
6
Total Current Year
7Col. 6 as a
% of Line 10.7
8Total from Col. 6
Prior Year
9% From Col. 7
Prior Year
10Total Publicly
Traded
11Total Privately
Placed6. Public Utilities (Unaffiliated), Schedules D & DA (Group 6)
6.1 Issuer Obligations 124,905 1,159,834 803,274 124,206 2,212,219 2.1 2,112,490 2.2 2,109,172 103,047 6.2 Single Class Mortgage-Backed/Asset-Based
Securities MULTI-CLASS RESIDENTIAL MORTGAGE-BACKED SECURITIES
6.3 Defined 6.4 Other
MULTI-CLASS COMMERCIAL MORTGAGE-BACKED/ASSET-BACKED SECURITIES
6.5 Defined 6.6 Other 6.7 Totals 124,905 1,159,834 803,274 124,206 2,212,219 2.1 2,112,490 2.2 2,109,172 103,047
7. Industrial & Miscellaneous (Unaffiliated), Schedules D & DA (Group 7)7.1 Issuer Obligations 352,755 7,141,108 8,682,678 876,559 2,219,963 19,273,064 18.2 18,253,287 17.0 16,880,675 2,392,389 7.2 Single Class Mortgage-Backed/Asset-Based
Securities 159,854 MULTI-CLASS RESIDENTIAL MORTGAGE-BACKED SECURITIES
7.3 Defined 2,271,528 5,197,581 332,316 7,801,424 7.4 3,802,019 4.8 7,801,424 7.4 Other 0.1
MULTI-CLASS COMMERCIAL MORTGAGE-BACKED/ASSET-BACKED SECURITIES
7.5 Defined 25,016 1,549,324 6,678,418 8,252,758 7.8 9,452,007 8.1 8,252,758 7.6 Other 2,482,842 5,256,122 1,579,297 9,318,261 8.8 4,473,837 4.3 7,694,016 1,624,246 7.7 Totals 5,132,140 19,144,136 17,272,708 876,559 2,219,963 44,645,507 42.2 36,141,004 34.2 40,628,873 4,016,635
8. Credit Tenant Loans, Schedules D & DA (Group 8)8.1 Issuer Obligations 8.7 Totals
9. Parents, Subsidiaries and Affiliates, Schedules D & DA (Group 9) 9.1 Issuer Obligations 9.2 Single Class Mortgage-Backed/Asset-Based
Securities MULTI-CLASS RESIDENTIAL MORTGAGE-BACKED SECURITIES
9.3 Defined 9.4 Other
MULTI-CLASS COMMERCIAL MORTGAGE-BACKED/ASSET-BACKED SECURITIES
9.5 Defined 9.6 Other 9.7 Totals
27

ANNUAL STATEMENT FOR THE YEAR 2006 OF THE NIC Insurance Company
SCHEDULE D - PART 1A - SECTION 2 (continued)Maturity Distribution of All Bonds Owned December 31, at Book/Adjusted Carrying Values by Major Type and Subtype of Issues
Distribution by Type
1
1 Year or Less
2Over 1 Year
Through 5 Years
3Over 5 Years
Through 10 Years
4Over 10 Years
Through 20 Years
5
Over 20 Years
6Total
Current Year
7Col. 6 as a %of Line 10.7
8Total From Col. 6
Prior Year
9% From Col. 7
Prior Year
10Total Publicly
Traded
11Total Privately
Placed10. Total Bonds Current Year10.1 Issuer Obligations 3,638,923 11,357,800 15,767,455 901,531 5,439,968 37,105,677 35.0 XXX XXX 34,610,241 2,495,436 10.2 Single Class Mortgage-Backed/Asset-Backed Securities 6,200,971 17,402,705 10,236,639 4,838,439 635,646 39,314,400 37.2 XXX XXX 39,314,400
MULTI-CLASS RESIDENTIAL MORTGAGE-BACKED SECURITIES10.3 Defined 2,756,775 6,454,005 439,991 9,650,771 9.1 XXX XXX 9,650,771 10.4 Other XXX XXX
MULTI-CLASS COMMERCIAL MORTGAGE-BACKED/ASSET-BACKED SECURITIES10.5 Defined 115,456 2,084,850 7,948,325 252,204 10,400,835 9.8 XXX XXX 10,400,835 10.6 Other 2,482,842 5,256,122 1,579,297 9,318,261 8.8 XXX XXX 7,694,016 1,624,246 10.7 Totals 15,194,966 42,555,482 35,971,707 5,992,174 6,075,614 105,789,944 100.0 XXX XXX 101,670,263 4,119,682 10.8 Line 10.7 as a % of Col. 6 14.4 40.2 34.0 5.7 5.7 100.0 XXX XXX XXX 96.1 3.9
11. Total Bonds Prior Year11.1 Issuer Obligations 15,289,650 10,830,401 16,649,655 4,218,443 3,662,458 XXX XXX 50,650,607 48.5 47,680,301 2,970,308 11.2 Single Class Mortgage-Backed/Asset-Backed Securities 3,409,726 9,912,793 7,030,621 6,770,417 4,579,090 XXX XXX 31,702,648 30.7 31,702,648
MULTI-CLASS RESIDENTIAL MORTGAGE-BACKED SECURITIES11.3 Defined 1,221,421 2,597,450 1,009,448 1,645,171 999,579 XXX XXX 7,473,068 6.0 7,473,068 11.4 Other XXX XXX 0.1
MULTI-CLASS COMMERCIAL MORTGAGE-BACKED/ASSET-BACKED SECURITIES11.5 Defined 546,172 1,625,964 7,279,870 2 XXX XXX 9,452,007 10.5 9,452,007 11.6 Other 632,623 3,527,143 314,070 XXX XXX 4,473,837 4.3 3,493,991 979,846 11.7 Totals 21,099,592 28,493,750 32,283,663 12,634,034 9,241,127 XXX XXX 103,752,167 100.0 99,802,015 3,950,154 11.8 Line 11.7 as a % of Col. 8 20.3 27.5 31.1 12.2 8.9 XXX XXX 100.0 XXX 96.2 3.8
12. Total Publicly Traded Bonds12.1 Issuer Obligations 3,638,923 10,848,660 14,220,632 668,770 5,233,256 34,610,241 32.7 47,680,301 45.9 34,610,241 XXX12.2 Single Class Mortgage-Backed/Asset-Backed Securities 6,200,971 17,402,705 10,236,639 4,838,439 635,646 39,314,400 37.2 31,702,648 30.7 39,314,400 XXX
MULTI-CLASS RESIDENTIAL MORTGAGE-BACKED SECURITIES12.3 Defined 2,756,775 6,454,005 439,991 9,650,771 9.1 7,473,068 6.0 9,650,771 XXX12.4 Other 0.1 XXX
MULTI-CLASS COMMERCIAL MORTGAGE-BACKED/ASSET-BACKED SECURITIES12.5 Defined 115,456 2,084,850 7,948,325 252,204 10,400,835 9.8 9,452,007 10.5 10,400,835 XXX12.6 Other 1,492,512 5,242,471 959,033 7,694,016 7.3 3,493,991 2.3 7,694,016 XXX12.7 Totals 14,204,636 42,032,691 33,804,620 5,759,413 5,868,902 101,670,263 96.1 99,802,015 95.5 101,670,263 XXX12.8 Line 12.7 as a % of Col. 6 14.0 41.3 33.2 5.7 5.8 100.0 XXX XXX XXX 100.0 XXX12.9 Line 12.7 as a % of Line 10.7, Col. 6, Section 10 13.4 39.7 32.0 5.4 5.6 96.1 XXX XXX XXX 96.1 XXX
13. Total Privately Placed Bonds13.1 Issuer Obligations 509,140 1,546,822 232,761 206,712 2,495,435 2.4 2,970,308 2.5 XXX 2,495,435 13.2 Single Class Mortgage-Backed/Asset-Backed Securities XXX
MULTI-CLASS RESIDENTIAL MORTGAGE-BACKED SECURITIES13.3 Defined XXX13.4 Other XXX
MULTI-CLASS COMMERCIAL MORTGAGE-BACKED/ASSET-BACKED SECURITIES13.5 Defined XXX13.6 Other 990,330 13,651 620,264 1,624,246 1.5 979,846 2.0 XXX 1,624,246 13.7 Totals 990,330 522,792 2,167,086 232,761 206,712 4,119,681 3.9 3,950,154 4.5 XXX 4,119,681 13.8 Line 13.7 as a % of Col. 6 24.0 12.7 52.6 5.7 5.0 100.0 XXX XXX XXX XXX 100.0 13.9 Line 13.7 as a % of Line 10.7, Col. 6, Section 10 0.9 0.5 2.0 0.2 0.2 3.9 XXX XXX XXX XXX 3.9
28

ANNUAL STATEMENT FOR THE YEAR 2006 OF THE NIC Insurance Company
SCHEDULE DA - PART 2 - VERIFICATION BETWEEN YEARSShort-Term Investments
1
Total
2
Bonds
3
Mortgage Loans
4
Other Short-term Investment Assets(a)
5
Investments in Parent, Subsidiaries and Affiliates
1. Book/adjusted carrying value, prior year 13,952,065 13,952,065
2. Cost of short-term investments acquired 4,937,981 4,937,981
3. Increase (decrease) by adjustment 76,878 76,878
4. Increase (decrease) by foreign exchange adjustment
5. Total profit (loss) on disposal of short-term investments (150) (150)
6. Consideration received on disposal of short-term investments 18,966,775 18,966,775
7. Book/adjusted carrying value, current year
8. Total valuation allowance
9. Subtotal (Lines 7 plus 8)
10. Total nonadmitted amounts
11. Statement value (Lines 9 minus 10)
12. Income collected during year 76,878 76,878
13. Income earned during year 76,878 76,878
(a) Indicate the category of such assets, for example, joint ventures, transportation equipment:
29
ANNUAL STATEMENT FOR THE YEAR 2006 OF THE NIC Insurance Company
Schedule DB - Part A - VBY
NONESchedule DB - Part B - VBY
NONESchedule DB - Part C - VBY
NONESchedule DB - Part D - VBY
NONESchedule DB - Part E - VBY
NONESchedule DB - Part F - Section 1
NONESchedule DB - Part F - Section 2
NONESchedule F - Part 1
NONESchedule F - Part 2
NONE
30, 31, 32, 33, 34, 35

ANNUAL STATEMENT FOR THE YEAR 2006 OF THE NIC Insurance Company
SCHEDULE F - PART 3Ceded Reinsurance as of December 31, Current Year (000 Omitted)
1 2 3 4 5 6 Reinsurance Recoverable On Reinsurance Payable 18 19
FederalID
Number
NAICCompany
Code Name of ReinsurerDomiciliaryJurisdiction
ReinsuranceContracts
Ceding 75%or More of
Direct Premiums
Written
ReinsurancePremiums
Ceded
7
PaidLosses
8
PaidLAE
9
Known CaseLoss
Reserves
10
Known Case LAE
Reserves
11
IBNR Loss Reserves
12
IBNR LAE Reserves
13
Unearned Premiums
14
Contingent Commis-
sions
15
Cols.7 thru 14
Totals
16
Ceded Balances Payable
17
Other AmountsDue to
Reinsurers
Net Amount Recoverable
From Reinsurers Cols. 15 - [16 + 17]
Funds Held By Company
Under Reinsurance
Treaties13-3138390 42307 Navigators Insurance Company NY 2 231,718 30,033 14,911 233,909 27,867 113,341 420,060 26,505 393,555 0299999 - Authorized - Affiliates - U.S. Non-Pool 231,718 30,033 14,911 233,909 27,867 113,341 420,060 26,505 393,555 0499999 - Total - Authorized - Affiliates 231,718 30,033 14,911 233,909 27,867 113,341 420,060 26,505 393,555 0599998 - Other U.S. Unaffil Insurers (Under $100,000)0899998 - Authorized - Other Non-U.S. Insurers (Under $100,000)0999999 - Total - Authorized 231,718 30,033 14,911 233,909 27,867 113,341 420,060 26,505 393,555 1399999 - Total - Unauthorized - Affiliates1499998 - Unauthorized - Other U.S. Unaffiliated Insurers (Under $100,000)1799998 - Unauthorized - Other Non-U.S. Insurers (Under $100,000)1899999 - Total - Unauthorized1999999 - Total - Authorized and Unauthorized 231,718 30,033 14,911 233,909 27,867 113,341 420,060 26,505 393,555 2099999 - Total - Protected Cells
9999999 Totals 231,718 30,033 14,911 233,909 27,867 113,341 420,060 26,505 393,555
NOTE:A.
Report the five largest provisional commission rates included in the cedant’s reinsurance treaties. The commission rate to be reported is by contract with ceded premium in excess of $50,000:
1Name of Reinsurer
2Commission Rate
3Ceded Premium
1.2.3.4.5.
B.Report the five largest reinsurance recoverables reported in Column 15, due from any one reinsurer (based on the total recoverables, Line 9999999, Column 15), the amount of ceded premium, and indicate whether the recoverables are due from an affiliated insurer.
1Name of Reinsurer
2Total Recoverables
3Ceded Premiums
4Affiliated
1. Navigators Insurance Company 420,060,000.000 231,718,000 Yes [ X ] No [ ]2. Yes [ ] No [ ]3. Yes [ ] No [ ]4. Yes [ ] No [ ]5. Yes [ ] No [ ]
36

ANNUAL STATEMENT FOR THE YEAR 2006 OF THE NIC Insurance Company
Schedule F - Part 4
NONESchedule F - Part 5
NONESchedule F - Part 6
NONESchedule F - Part 7
NONE
37, 38, 39, 40
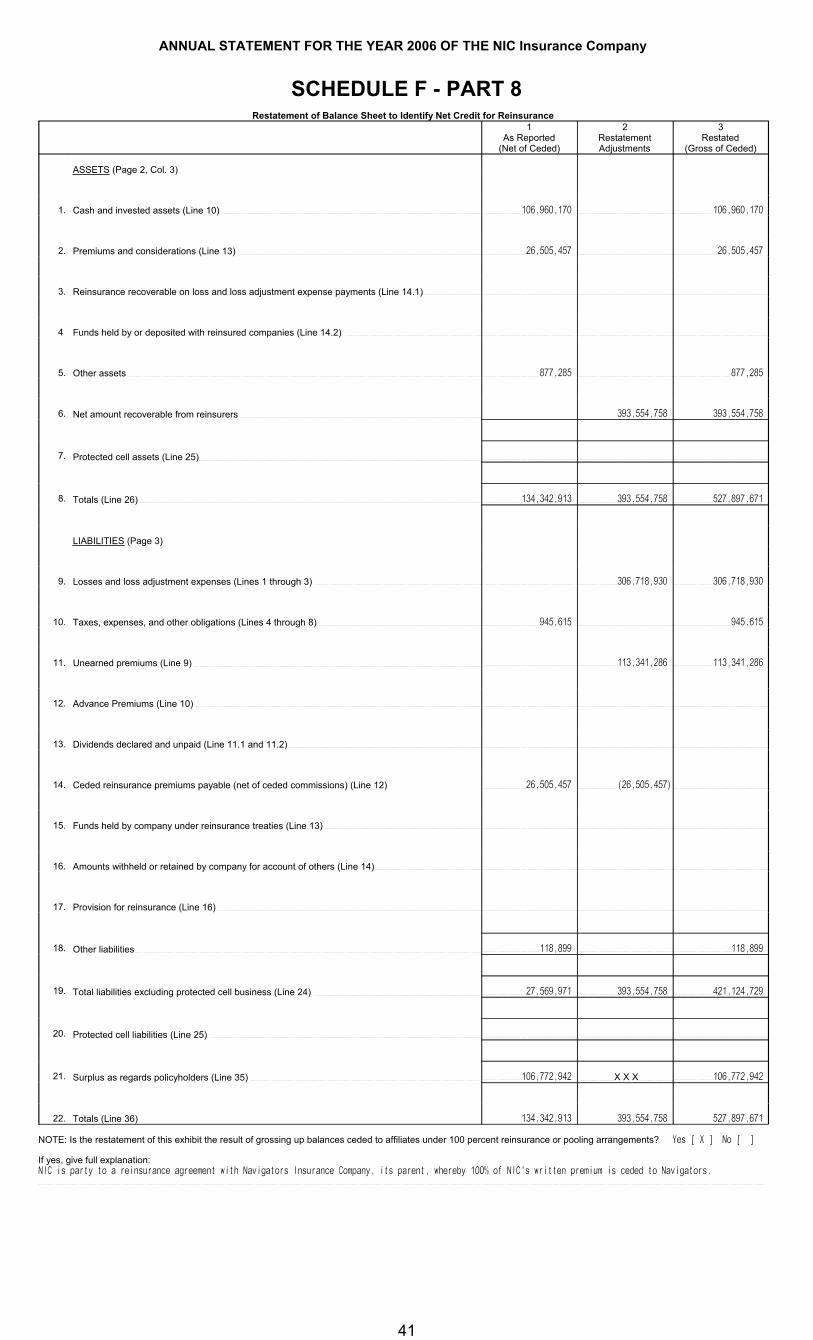
ANNUAL STATEMENT FOR THE YEAR 2006 OF THE NIC Insurance Company
SCHEDULE F - PART 8Restatement of Balance Sheet to Identify Net Credit for Reinsurance
1As Reported
(Net of Ceded)
2RestatementAdjustments
3Restated
(Gross of Ceded)
ASSETS (Page 2, Col. 3)
1. Cash and invested assets (Line 10) 106,960,170 106,960,170
2. Premiums and considerations (Line 13) 26,505,457 26,505,457
3. Reinsurance recoverable on loss and loss adjustment expense payments (Line 14.1)
4 Funds held by or deposited with reinsured companies (Line 14.2)
5. Other assets 877,285 877,285
6. Net amount recoverable from reinsurers 393,554,758 393,554,758
7. Protected cell assets (Line 25)
8. Totals (Line 26) 134,342,913 393,554,758 527,897,671
LIABILITIES (Page 3)
9. Losses and loss adjustment expenses (Lines 1 through 3) 306,718,930 306,718,930
10. Taxes, expenses, and other obligations (Lines 4 through 8) 945,615 945,615
11. Unearned premiums (Line 9) 113,341,286 113,341,286
12. Advance Premiums (Line 10)
13. Dividends declared and unpaid (Line 11.1 and 11.2)
14. Ceded reinsurance premiums payable (net of ceded commissions) (Line 12) 26,505,457 (26,505,457)
15. Funds held by company under reinsurance treaties (Line 13)
16. Amounts withheld or retained by company for account of others (Line 14)
17. Provision for reinsurance (Line 16)
18. Other liabilities 118,899 118,899
19. Total liabilities excluding protected cell business (Line 24) 27,569,971 393,554,758 421,124,729
20. Protected cell liabilities (Line 25)
21. Surplus as regards policyholders (Line 35) 106,772,942 X X X 106,772,942
22. Totals (Line 36) 134,342,913 393,554,758 527,897,671
NOTE: Is the restatement of this exhibit the result of grossing up balances ceded to affiliates under 100 percent reinsurance or pooling arrangements? Yes [ X ] No [ ]
If yes, give full explanation:NIC is party to a reinsurance agreement with Navigators Insurance Company, its parent, whereby 100% of NIC's written premium is ceded to Navigators.
41

ANNUAL STATEMENT FOR THE YEAR 2006 OF THE NIC Insurance Company
Schedule H - Part 1
NONESchedule H - Part 2
NONESchedule H - Part 3
NONESchedule H - Part 4
NONESchedule H - Part 5
NONE
42, 43, 44

ANNUAL STATEMENT FOR THE YEAR 2006 OF THE NIC Insurance Company
SCHEDULE P - ANALYSIS OF LOSSES AND LOSS EXPENSESSCHEDULE P - PART 1 - SUMMARY
($000 Omitted)Premiums Earned Loss and Loss Expense Payments 12
Years inWhich
1 2 3Loss Payments
Defense and Cost Containment Payments
Adjusting and Other Payments
10 11Number of
PremiumsWere Earned and Losses
Were IncurredDirect and Assumed Ceded
Net(Cols. 1 - 2)
4
Direct and Assumed
5
Ceded
6
Direct and Assumed
7
Ceded
8
Direct and Assumed
9
Ceded
Salvageand
Subrogation Received
Total Net Paid (Cols.4 - 5 + 6 -7 + 8 - 9)
Claims Reported - Direct and Assumed
1. Prior XXX XXX XXX 775 775 330 330 XXX
2. 1997 14,086 6,746 7,340 10,087 5,821 1,119 742 70 10 4,703 XXX
3. 1998 12,053 6,950 5,103 13,024 9,878 1,322 1,119 93 47 3,395 XXX
4. 1999 2,680 2,680 771 771 912 912 36 36 XXX
5. 2000 3,224 3,224 3,124 3,124 1,719 1,719 92 92 XXX
6. 2001 8,685 8,685 4,446 4,446 3,013 3,013 333 333 XXX
7. 2002 42,993 42,993 7,271 7,271 6,103 6,103 539 539 XXX
8. 2003 95,621 95,621 7,003 7,003 3,778 3,778 899 899 XXX
9. 2004 135,582 135,582 12,945 12,945 5,979 5,979 1,317 1,317 XXX
10. 2005 158,328 158,328 4,399 4,399 901 901 613 613 XXX
11. 2006 200,691 200,691 550 550 242 242 243 243 XXX
12. Totals XXX XXX XXX 63,620 56,208 25,863 25,283 4,565 4,459 8,098 XXX
Losses Unpaid Defense and Cost Containment UnpaidAdjusting and Other
Unpaid23 24 25
Case Basis Bulk + IBNR Case Basis Bulk + IBNR 21 22 Total Number of13
Direct and Assumed
14
Ceded
15
Direct and Assumed
16
Ceded
17
Direct and Assumed
18
Ceded
19
Direct and Assumed
20
CededDirect and Assumed Ceded
Salvageand
Subrog-ation
Anticipated
NetLosses
and Expenses
Unpaid
Claims Outstand-
ing -Direct andAssumed
1. 250 250 1 1 7 7 XXX
2. 50 50 19 19 XXX
3. 75 75 5 5 11 11 XXX
4. 294 294 9 9 18 18 17 17 XXX
5. 275 275 418 418 252 252 25 25 132 132 XXX
6. 715 715 2,296 2,296 293 293 138 138 581 581 XXX
7. 3,835 3,835 16,911 16,911 1,246 1,246 1,001 1,001 1,600 1,600 XXX
8. 3,441 3,441 28,315 28,315 1,296 1,296 1,654 1,654 2,246 2,246 XXX
9. 6,450 6,450 35,233 35,233 2,896 2,896 2,026 2,026 3,548 3,548 XXX
10. 8,251 8,251 58,124 58,124 1,608 1,608 3,273 3,273 4,505 4,505 XXX
11. 6,593 6,593 92,241 92,241 1,911 1,911 5,182 5,182 7,448 7,448 XXX
12. Totals 29,860 29,860 233,907 233,907 9,512 9,512 13,322 13,322 20,114 20,114 XXX
TotalLosses and Loss Expenses Incurred
Loss and Loss Expense Percentage (Incurred/Premiums Earned) Nontabular Discount
34Inter-
Net Balance Sheet Reserves After Discount
26
Direct and Assumed
27
Ceded
28
Net
29
Direct and Assumed
30
Ceded
31
Net
32
Loss
33
LossExpense
Company Pooling
Participation Percentage
35
Losses Unpaid
36Loss
Expenses Unpaid
1. XXX XXX XXX XXX XXX XXX XXX
2. 11,345 6,642 4,703 80.5 98.5 64.1
3. 14,530 11,135 3,395 120.6 160.2 66.5
4. 2,057 2,057 76.8 76.8
5. 6,037 6,037 187.3 187.3
6. 11,815 11,815 136.0 136.0
7. 38,506 38,506 89.6 89.6
8. 48,632 48,632 50.9 50.9
9. 70,394 70,394 51.9 51.9
10. 81,674 81,674 51.6 51.6
11. 114,410 114,410 57.0 57.0
12. Totals XXX XXX XXX XXX XXX XXX XXX
Note: Parts 2 and 4 are gross of all discounting, including tabular discounting. Part 1 is gross of only nontabular discounting, which is reported in Columns 32 and 33 of Part 1. The tabular discount, if any, is reported in the Notes to Financial Statements which will reconcile Part 1 with Parts 2 and 4.
45

ANNUAL STATEMENT FOR THE YEAR 2006 OF THE NIC Insurance Company
SCHEDULE P - PART 2 - SUMMARYINCURRED NET LOSSES AND DEFENSE AND COST CONTAINMENT EXPENSES REPORTED AT YEAR END
($000 OMITTED) DEVELOPMENTYears in Which Losses Were
Incurred
1
1997
2
1998
3
1999
4
2000
5
2001
6
2002
7
2003
8
2004
9
2005
10
2006
11
One Year
12
Two Year
1. Prior 9,218 8,900 8,903 8,903 8,903 8,903 8,903 8,903 8,903 8,903
2. 1997 4,618 4,642 4,643 4,643 4,643 4,643 4,643 4,643 4,643 4,643
3. 1998 XXX 3,332 3,349 3,349 3,349 3,349 3,349 3,349 3,349 3,349
4. 1999 XXX XXX
5. 2000 XXX XXX XXX
6. 2001 XXX XXX XXX XXX
7. 2002 XXX XXX XXX XXX XXX
8. 2003 XXX XXX XXX XXX XXX XXX
9. 2004 XXX XXX XXX XXX XXX XXX XXX
10. 2005 XXX XXX XXX XXX XXX XXX XXX XXX XXX
11. 2006 XXX XXX XXX XXX XXX XXX XXX XXX XXX XXX XXX
12. Totals
SCHEDULE P - PART 3 - SUMMARYCUMULATIVE PAID NET LOSSES AND DEFENSE AND COST CONTAINMENT EXPENSES REPORTED AT YEAR END ($000
OMITTED)11 12
Number of
Years in Which Losses Were
Incurred
1
1997
2
1998
3
1999
4
2000
5
2001
6
2002
7
2003
8
2004
9
2005
10
2006
Number of Claims
Closed With Loss
Payment
Claims Closed Without
Loss Payment
1. Prior 000 2,564 8,903 8,903 8,903 8,903 8,903 8,903 8,903 8,903 XXX XXX
2. 1997 1,118 2,334 4,643 4,643 4,643 4,643 4,643 4,643 4,643 4,643 XXX XXX
3. 1998 XXX 601 3,349 3,349 3,349 3,349 3,349 3,349 3,349 3,349 XXX XXX
4. 1999 XXX XXX XXX XXX
5. 2000 XXX XXX XXX XXX XXX
6. 2001 XXX XXX XXX XXX XXX XXX
7. 2002 XXX XXX XXX XXX XXX XXX XXX
8. 2003 XXX XXX XXX XXX XXX XXX XXX XXX
9. 2004 XXX XXX XXX XXX XXX XXX XXX XXX XXX
10. 2005 XXX XXX XXX XXX XXX XXX XXX XXX XXX XXX
11. 2006 XXX XXX XXX XXX XXX XXX XXX XXX XXX XXX XXX
SCHEDULE P - PART 4 - SUMMARYYears in Which BULK AND IBNR RESERVES ON NET LOSSES AND DEFENSE AND COST CONTAINMENT EXPENSES REPORTED AT YEAR END ($000 OMITTED)Losses Were
Incurred1
19972
19983
19994
20005
20016
20027
20038
20049
200510
2006
1. Prior 4,507 3,225
2. 1997 2,490 1,234
3. 1998 XXX 1,934
4. 1999 XXX XXX
5. 2000 XXX XXX XXX
6. 2001 XXX XXX XXX XXX
7. 2002 XXX XXX XXX XXX XXX
8. 2003 XXX XXX XXX XXX XXX XXX
9. 2004 XXX XXX XXX XXX XXX XXX XXX
10. 2005 XXX XXX XXX XXX XXX XXX XXX XXX
11. 2006 XXX XXX XXX XXX XXX XXX XXX XXX XXX
46

ANNUAL STATEMENT FOR THE YEAR 2006 OF THE NIC Insurance Company
SCHEDULE P - PART 1A - HOMEOWNERS/FARMOWNERS($000 Omitted)
Years in Premiums Earned Loss and Loss Expense Payments 12Which
Premiums1 2 3
Loss PaymentsDefense and Cost
Containment PaymentsAdjusting and Other
Payments10 11
WereEarned
and LossesWere
IncurredDirect and Assumed Ceded
Net(Cols. 1 - 2)
4
Direct and Assumed
5
Ceded
6
Direct and Assumed
7
Ceded
8
Direct and Assumed
9
Ceded
Salvageand
SubrogationReceived
TotalNet Paid
(Cols. 4 - 5+ 6 - 7+ 8 - 9)
Number ofClaims
Reported - Direct and Assumed
1. Prior XXX XXX XXX XXX
2. 1997 21 1 20 9 1 10
3. 1998 27 27 14 1 15
4. 1999
5. 2000
6. 2001
7. 2002
8. 2003
9. 2004
10. 2005
11. 2006
12. Totals XXX XXX XXX 23 2 25 XXX
Losses Unpaid Defense and Cost Containment UnpaidAdjusting and Other
Unpaid23 24 25
Case Basis Bulk + IBNR Case Basis Bulk + IBNR 21 22 Number of13
Direct and Assumed
14
Ceded
15
Direct and Assumed
16
Ceded
17
Direct and Assumed
18
Ceded
19
Direct and Assumed
20
CededDirect and Assumed Ceded
Salvageand
Subrogation Anticipated
TotalNet Losses
and Expenses
Unpaid
Claims Outstand-ing - Direct
andAssumed
1.
2.
3.
4.
5.
6.
7.
8.
9.
10.
11.
12.
TotalLosses and Loss Expenses Incurred
Loss and Loss Expense Percentage (Incurred/Premiums Earned) Nontabular Discount
34Inter-
Net Balance SheetReserves After Discount
26
Direct and Assumed
27
Ceded
28
Net
29
Direct and Assumed
30
Ceded
31
Net
32
Loss
33
LossExpense
Company Pooling
Participation Percentage
35
LossesUnpaid
36Loss
Expenses Unpaid
1. XXX XXX XXX XXX XXX XXX XXX
2. 10 10 47.6 50.0
3. 15 15 55.6 55.6
4.
5.
6.
7.
8.
9.
10.
11.
12. XXX XXX XXX XXX XXX XXX XXX
47

ANNUAL STATEMENT FOR THE YEAR 2006 OF THE NIC Insurance Company
SCHEDULE P - PART 1B - PRIVATE PASSENGER AUTO LIABILITY/MEDICAL
($000 Omitted)Years in Premiums Earned Loss and Loss Expense Payments 12Which
Premiums1 2 3
Loss PaymentsDefense and Cost
Containment PaymentsAdjusting and Other
Payments10 11
WereEarned
and LossesWere
IncurredDirect and Assumed Ceded
Net(Cols. 1 - 2)
4
Direct and Assumed
5
Ceded
6
Direct and Assumed
7
Ceded
8
Direct and Assumed
9
Ceded
Salvageand
SubrogationReceived
TotalNet Paid
(Cols. 4 - 5+ 6 - 7+ 8 - 9)
Number ofClaims
Reported - Direct and Assumed
1. Prior XXX XXX XXX XXX
2. 1997 2 2 1 1
3. 1998 1 1 1 1
4. 1999
5. 2000
6. 2001
7. 2002
8. 2003
9. 2004
10. 2005
11. 2006
12. Totals XXX XXX XXX 2 2 XXX
Losses Unpaid Defense and Cost Containment UnpaidAdjusting and Other
Unpaid23 24 25
Case Basis Bulk + IBNR Case Basis Bulk + IBNR 21 22 Number of13
Direct and Assumed
14
Ceded
15
Direct and Assumed
16
Ceded
17
Direct and Assumed
18
Ceded
19
Direct and Assumed
20
CededDirect and Assumed Ceded
Salvageand
Subrogation Anticipated
TotalNet Losses
and Expenses
Unpaid
Claims Outstand-ing - Direct
andAssumed
1.
2.
3.
4.
5.
6.
7.
8.
9.
10.
11.
12.
TotalLosses and Loss Expenses Incurred
Loss and Loss Expense Percentage (Incurred/Premiums Earned) Nontabular Discount
34Inter-
Net Balance SheetReserves After Discount
26
Direct and Assumed
27
Ceded
28
Net
29
Direct and Assumed
30
Ceded
31
Net
32
Loss
33
LossExpense
Company Pooling
Participation Percentage
35
LossesUnpaid
36Loss
Expenses Unpaid
1. XXX XXX XXX XXX XXX XXX XXX
2. 1 1 50.0 50.0
3. 1 1 100.0 100.0
4.
5.
6.
7.
8.
9.
10.
11.
12. XXX XXX XXX XXX XXX XXX XXX
48
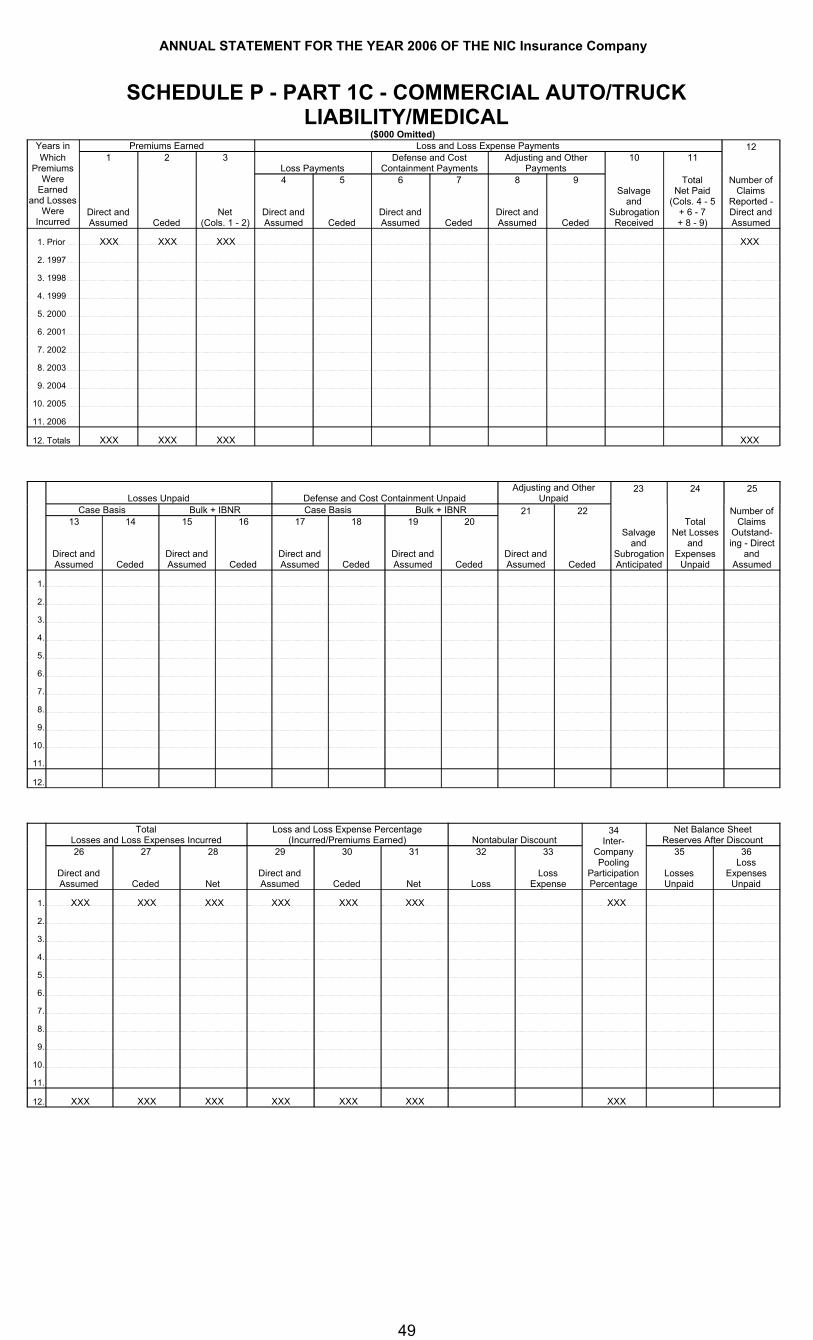
ANNUAL STATEMENT FOR THE YEAR 2006 OF THE NIC Insurance Company
SCHEDULE P - PART 1C - COMMERCIAL AUTO/TRUCK LIABILITY/MEDICAL
($000 Omitted)Years in Premiums Earned Loss and Loss Expense Payments 12Which
Premiums1 2 3
Loss PaymentsDefense and Cost
Containment PaymentsAdjusting and Other
Payments10 11
WereEarned
and LossesWere
IncurredDirect and Assumed Ceded
Net(Cols. 1 - 2)
4
Direct and Assumed
5
Ceded
6
Direct and Assumed
7
Ceded
8
Direct and Assumed
9
Ceded
Salvageand
SubrogationReceived
TotalNet Paid
(Cols. 4 - 5+ 6 - 7+ 8 - 9)
Number ofClaims
Reported - Direct and Assumed
1. Prior XXX XXX XXX XXX
2. 1997
3. 1998
4. 1999
5. 2000
6. 2001
7. 2002
8. 2003
9. 2004
10. 2005
11. 2006
12. Totals XXX XXX XXX XXX
Losses Unpaid Defense and Cost Containment UnpaidAdjusting and Other
Unpaid23 24 25
Case Basis Bulk + IBNR Case Basis Bulk + IBNR 21 22 Number of13
Direct and Assumed
14
Ceded
15
Direct and Assumed
16
Ceded
17
Direct and Assumed
18
Ceded
19
Direct and Assumed
20
CededDirect and Assumed Ceded
Salvageand
Subrogation Anticipated
TotalNet Losses
and Expenses
Unpaid
Claims Outstand-ing - Direct
andAssumed
1.
2.
3.
4.
5.
6.
7.
8.
9.
10.
11.
12.
TotalLosses and Loss Expenses Incurred
Loss and Loss Expense Percentage (Incurred/Premiums Earned) Nontabular Discount
34Inter-
Net Balance SheetReserves After Discount
26
Direct and Assumed
27
Ceded
28
Net
29
Direct and Assumed
30
Ceded
31
Net
32
Loss
33
LossExpense
Company Pooling
Participation Percentage
35
LossesUnpaid
36Loss
Expenses Unpaid
1. XXX XXX XXX XXX XXX XXX XXX
2.
3.
4.
5.
6.
7.
8.
9.
10.
11.
12. XXX XXX XXX XXX XXX XXX XXX
49

ANNUAL STATEMENT FOR THE YEAR 2006 OF THE NIC Insurance Company
SCHEDULE P - PART 1D - WORKERS' COMPENSATION($000 Omitted)
Years in Premiums Earned Loss and Loss Expense Payments 12Which
Premiums1 2 3
Loss PaymentsDefense and Cost
Containment PaymentsAdjusting and Other
Payments10 11
WereEarned
and LossesWere
IncurredDirect and Assumed Ceded
Net(Cols. 1 - 2)
4
Direct and Assumed
5
Ceded
6
Direct and Assumed
7
Ceded
8
Direct and Assumed
9
Ceded
Salvageand
SubrogationReceived
TotalNet Paid
(Cols. 4 - 5+ 6 - 7+ 8 - 9)
Number ofClaims
Reported - Direct and Assumed
1. Prior XXX XXX XXX XXX
2. 1997
3. 1998
4. 1999
5. 2000
6. 2001
7. 2002
8. 2003
9. 2004
10. 2005
11. 2006
12. Totals XXX XXX XXX XXX
Losses Unpaid Defense and Cost Containment UnpaidAdjusting and Other
Unpaid23 24 25
Case Basis Bulk + IBNR Case Basis Bulk + IBNR 21 22 Number of13
Direct and Assumed
14
Ceded
15
Direct and Assumed
16
Ceded
17
Direct and Assumed
18
Ceded
19
Direct and Assumed
20
CededDirect and Assumed Ceded
Salvageand
Subrogation Anticipated
TotalNet Losses
and Expenses
Unpaid
Claims Outstand-ing - Direct
andAssumed
1.
2.
3.
4.
5.
6.
7.
8.
9.
10.
11.
12.
TotalLosses and Loss Expenses Incurred
Loss and Loss Expense Percentage (Incurred/Premiums Earned) Nontabular Discount
34Inter-
Net Balance SheetReserves After Discount
26
Direct and Assumed
27
Ceded
28
Net
29
Direct and Assumed
30
Ceded
31
Net
32
Loss
33
LossExpense
Company Pooling
Participation Percentage
35
LossesUnpaid
36Loss
Expenses Unpaid
1. XXX XXX XXX XXX XXX XXX XXX
2.
3.
4.
5.
6.
7.
8.
9.
10.
11.
12. XXX XXX XXX XXX XXX XXX XXX
50
NONE
NONE
NONE

ANNUAL STATEMENT FOR THE YEAR 2006 OF THE NIC Insurance Company
SCHEDULE P - PART 1E - COMMERCIAL MULTIPLE PERIL($000 Omitted)
Years in Premiums Earned Loss and Loss Expense Payments 12Which
Premiums1 2 3
Loss PaymentsDefense and Cost
Containment PaymentsAdjusting and Other
Payments10 11
WereEarned
and LossesWere
IncurredDirect and Assumed Ceded
Net(Cols. 1 - 2)
4
Direct and Assumed
5
Ceded
6
Direct and Assumed
7
Ceded
8
Direct and Assumed
9
Ceded
Salvageand
SubrogationReceived
TotalNet Paid
(Cols. 4 - 5+ 6 - 7+ 8 - 9)
Number ofClaims
Reported - Direct and Assumed
1. Prior XXX XXX XXX XXX
2. 1997 471 445 26 139 120 13 11 21
3. 1998 711 631 80 382 315 27 23 71
4. 1999
5. 2000
6. 2001
7. 2002
8. 2003
9. 2004
10. 2005 25 25 3 3 10
11. 2006 7,749 7,749 63 63 4 4 19 19 84
12. Totals XXX XXX XXX 584 498 69 63 22 22 92 XXX
Losses Unpaid Defense and Cost Containment UnpaidAdjusting and Other
Unpaid23 24 25
Case Basis Bulk + IBNR Case Basis Bulk + IBNR 21 22 Number of13
Direct and Assumed
14
Ceded
15
Direct and Assumed
16
Ceded
17
Direct and Assumed
18
Ceded
19
Direct and Assumed
20
CededDirect and Assumed Ceded
Salvageand
Subrogation Anticipated
TotalNet Losses
and Expenses
Unpaid
Claims Outstand-ing - Direct
andAssumed
1.
2.
3.
4.
5.
6.
7.
8.
9.
10. 355 355 971 971 70 70 37 37 127 127 9
11. 1,097 1,097 4,709 4,709 103 103 177 177 594 594 78
12. 1,452 1,452 5,680 5,680 173 173 214 214 721 721 87
TotalLosses and Loss Expenses Incurred
Loss and Loss Expense Percentage (Incurred/Premiums Earned) Nontabular Discount
34Inter-
Net Balance SheetReserves After Discount
26
Direct and Assumed
27
Ceded
28
Net
29
Direct and Assumed
30
Ceded
31
Net
32
Loss
33
LossExpense
Company Pooling
Participation Percentage
35
LossesUnpaid
36Loss
Expenses Unpaid
1. XXX XXX XXX XXX XXX XXX XXX
2. 152 131 21 32.3 29.4 80.8
3. 409 338 71 57.5 53.6 88.8
4.
5.
6.
7.
8.
9.
10. 1,588 1,588
11. 6,766 6,766 87.3 87.3
12. XXX XXX XXX XXX XXX XXX XXX
51

ANNUAL STATEMENT FOR THE YEAR 2006 OF THE NIC Insurance Company
Schedule P - Part 1F - Medical Mal Occur
NONESchedule P - Part 1F - Medical Mal Claim
NONE
52, 53

ANNUAL STATEMENT FOR THE YEAR 2006 OF THE NIC Insurance Company
SCHEDULE P - PART 1G - SPECIAL LIABILITY (OCEAN MARINE, AIRCRAFT (ALL PERILS), BOILER AND MACHINERY)
($000 Omitted)Years in Premiums Earned Loss and Loss Expense Payments 12Which
Premiums1 2 3
Loss PaymentsDefense and Cost
Containment PaymentsAdjusting and Other
Payments10 11
WereEarned
and LossesWere
IncurredDirect and Assumed Ceded
Net(Cols. 1 - 2)
4
Direct and Assumed
5
Ceded
6
Direct and Assumed
7
Ceded
8
Direct and Assumed
9
Ceded
Salvageand
SubrogationReceived
TotalNet Paid
(Cols. 4 - 5+ 6 - 7+ 8 - 9)
Number ofClaims
Reported - Direct and Assumed
1. Prior XXX XXX XXX XXX
2. 1997 9,177 5,017 4,160 6,289 3,617 345 191 36 2,862 XXX
3. 1998 8,340 5,249 3,091 8,999 6,951 478 359 41 2,208 XXX
4. 1999 XXX
5. 2000 XXX
6. 2001 XXX
7. 2002 XXX
8. 2003 XXX
9. 2004 XXX
10. 2005 XXX
11. 2006 40 40 XXX
12. Totals XXX XXX XXX 15,288 10,568 823 550 77 5,070 XXX
Losses Unpaid Defense and Cost Containment UnpaidAdjusting and Other
Unpaid23 24 25
Case Basis Bulk + IBNR Case Basis Bulk + IBNR 21 22 Number of13
Direct and Assumed
14
Ceded
15
Direct and Assumed
16
Ceded
17
Direct and Assumed
18
Ceded
19
Direct and Assumed
20
CededDirect and Assumed Ceded
Salvageand
Subrogation Anticipated
TotalNet Losses
and Expenses
Unpaid
Claims Outstand-ing - Direct
andAssumed
1.
2.
3.
4.
5.
6.
7.
8.
9.
10.
11. 23 23 1 1 1 1
12. 23 23 1 1 1 1
TotalLosses and Loss Expenses Incurred
Loss and Loss Expense Percentage (Incurred/Premiums Earned) Nontabular Discount
34Inter-
Net Balance SheetReserves After Discount
26
Direct and Assumed
27
Ceded
28
Net
29
Direct and Assumed
30
Ceded
31
Net
32
Loss
33
LossExpense
Company Pooling
Participation Percentage
35
LossesUnpaid
36Loss
Expenses Unpaid
1. XXX XXX XXX XXX XXX XXX XXX
2. 6,670 3,808 2,862 72.7 75.9 68.8
3. 9,518 7,310 2,208 114.1 139.3 71.4
4.
5.
6.
7.
8.
9.
10.
11. 25 25 62.5 62.5
12. XXX XXX XXX XXX XXX XXX XXX
54
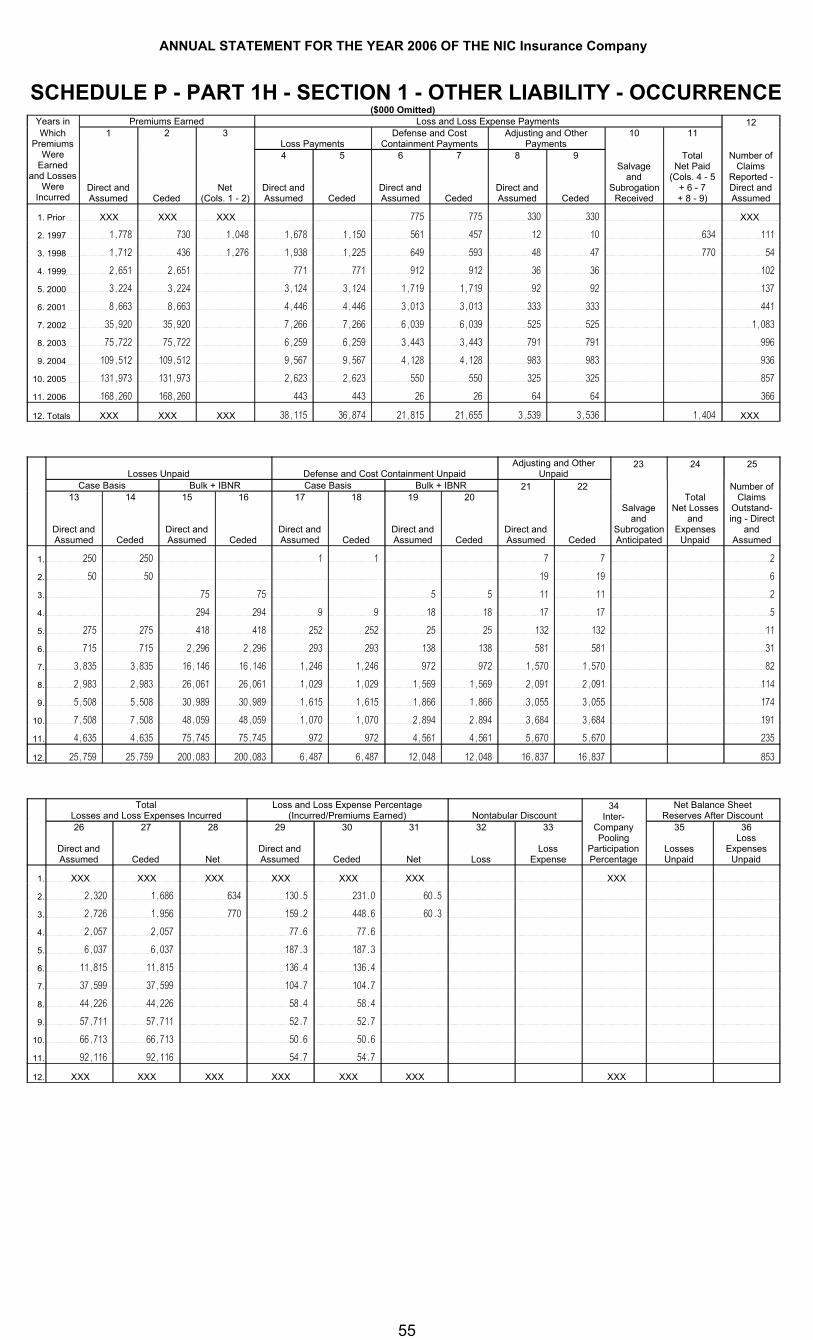
ANNUAL STATEMENT FOR THE YEAR 2006 OF THE NIC Insurance Company
SCHEDULE P - PART 1H - SECTION 1 - OTHER LIABILITY - OCCURRENCE($000 Omitted)
Years in Premiums Earned Loss and Loss Expense Payments 12Which
Premiums1 2 3
Loss PaymentsDefense and Cost
Containment PaymentsAdjusting and Other
Payments10 11
WereEarned
and LossesWere
IncurredDirect and Assumed Ceded
Net(Cols. 1 - 2)
4
Direct and Assumed
5
Ceded
6
Direct and Assumed
7
Ceded
8
Direct and Assumed
9
Ceded
Salvageand
SubrogationReceived
TotalNet Paid
(Cols. 4 - 5+ 6 - 7+ 8 - 9)
Number ofClaims
Reported - Direct and Assumed
1. Prior XXX XXX XXX 775 775 330 330 XXX
2. 1997 1,778 730 1,048 1,678 1,150 561 457 12 10 634 111
3. 1998 1,712 436 1,276 1,938 1,225 649 593 48 47 770 54
4. 1999 2,651 2,651 771 771 912 912 36 36 102
5. 2000 3,224 3,224 3,124 3,124 1,719 1,719 92 92 137
6. 2001 8,663 8,663 4,446 4,446 3,013 3,013 333 333 441
7. 2002 35,920 35,920 7,266 7,266 6,039 6,039 525 525 1,083
8. 2003 75,722 75,722 6,259 6,259 3,443 3,443 791 791 996
9. 2004 109,512 109,512 9,567 9,567 4,128 4,128 983 983 936
10. 2005 131,973 131,973 2,623 2,623 550 550 325 325 857
11. 2006 168,260 168,260 443 443 26 26 64 64 366
12. Totals XXX XXX XXX 38,115 36,874 21,815 21,655 3,539 3,536 1,404 XXX
Losses Unpaid Defense and Cost Containment UnpaidAdjusting and Other
Unpaid23 24 25
Case Basis Bulk + IBNR Case Basis Bulk + IBNR 21 22 Number of13
Direct and Assumed
14
Ceded
15
Direct and Assumed
16
Ceded
17
Direct and Assumed
18
Ceded
19
Direct and Assumed
20
CededDirect and Assumed Ceded
Salvageand
Subrogation Anticipated
TotalNet Losses
and Expenses
Unpaid
Claims Outstand-ing - Direct
andAssumed
1. 250 250 1 1 7 7 2
2. 50 50 19 19 6
3. 75 75 5 5 11 11 2
4. 294 294 9 9 18 18 17 17 5
5. 275 275 418 418 252 252 25 25 132 132 11
6. 715 715 2,296 2,296 293 293 138 138 581 581 31
7. 3,835 3,835 16,146 16,146 1,246 1,246 972 972 1,570 1,570 82
8. 2,983 2,983 26,061 26,061 1,029 1,029 1,569 1,569 2,091 2,091 114
9. 5,508 5,508 30,989 30,989 1,615 1,615 1,866 1,866 3,055 3,055 174
10. 7,508 7,508 48,059 48,059 1,070 1,070 2,894 2,894 3,684 3,684 191
11. 4,635 4,635 75,745 75,745 972 972 4,561 4,561 5,670 5,670 235
12. 25,759 25,759 200,083 200,083 6,487 6,487 12,048 12,048 16,837 16,837 853
TotalLosses and Loss Expenses Incurred
Loss and Loss Expense Percentage (Incurred/Premiums Earned) Nontabular Discount
34Inter-
Net Balance SheetReserves After Discount
26
Direct and Assumed
27
Ceded
28
Net
29
Direct and Assumed
30
Ceded
31
Net
32
Loss
33
LossExpense
Company Pooling
Participation Percentage
35
LossesUnpaid
36Loss
Expenses Unpaid
1. XXX XXX XXX XXX XXX XXX XXX
2. 2,320 1,686 634 130.5 231.0 60.5
3. 2,726 1,956 770 159.2 448.6 60.3
4. 2,057 2,057 77.6 77.6
5. 6,037 6,037 187.3 187.3
6. 11,815 11,815 136.4 136.4
7. 37,599 37,599 104.7 104.7
8. 44,226 44,226 58.4 58.4
9. 57,711 57,711 52.7 52.7
10. 66,713 66,713 50.6 50.6
11. 92,116 92,116 54.7 54.7
12. XXX XXX XXX XXX XXX XXX XXX
55

ANNUAL STATEMENT FOR THE YEAR 2006 OF THE NIC Insurance Company
SCHEDULE P - PART 1H - SECTION 2 - OTHER LIABILITY - CLAIMS-MADE($000 Omitted)
Years in Premiums Earned Loss and Loss Expense Payments 12Which
Premiums1 2 3
Loss PaymentsDefense and Cost
Containment PaymentsAdjusting and Other
Payments10 11
WereEarned
and LossesWere
IncurredDirect and Assumed Ceded
Net(Cols. 1 - 2)
4
Direct and Assumed
5
Ceded
6
Direct and Assumed
7
Ceded
8
Direct and Assumed
9
Ceded
Salvageand
SubrogationReceived
TotalNet Paid
(Cols. 4 - 5+ 6 - 7+ 8 - 9)
Number ofClaims
Reported - Direct and Assumed
1. Prior XXX XXX XXX XXX
2. 1997
3. 1998
4. 1999
5. 2000
6. 2001 22 22
7. 2002 7,073 7,073 5 5 64 64 14 14 19
8. 2003 19,899 19,899 744 744 335 335 108 108 67
9. 2004 26,070 26,070 3,378 3,378 1,851 1,851 334 334 93
10. 2005 26,355 26,355 1,776 1,776 326 326 285 285 182
11. 2006 24,642 24,642 44 44 212 212 160 160 193
12. Totals XXX XXX XXX 5,947 5,947 2,788 2,788 901 901 XXX
Losses Unpaid Defense and Cost Containment UnpaidAdjusting and Other
Unpaid23 24 25
Case Basis Bulk + IBNR Case Basis Bulk + IBNR 21 22 Number of13
Direct and Assumed
14
Ceded
15
Direct and Assumed
16
Ceded
17
Direct and Assumed
18
Ceded
19
Direct and Assumed
20
CededDirect and Assumed Ceded
Salvageand
Subrogation Anticipated
TotalNet Losses
and Expenses
Unpaid
Claims Outstand-ing - Direct
andAssumed
1.
2.
3.
4.
5.
6.
7. 765 765 29 29 30 30
8. 458 458 2,254 2,254 267 267 85 85 155 155 18
9. 942 942 4,244 4,244 1,281 1,281 160 160 493 493 44
10. 388 388 9,094 9,094 468 468 342 342 694 694 71
11. 861 861 11,764 11,764 836 836 443 443 1,183 1,183 162
12. 2,649 2,649 28,121 28,121 2,852 2,852 1,059 1,059 2,555 2,555 295
TotalLosses and Loss Expenses Incurred
Loss and Loss Expense Percentage (Incurred/Premiums Earned) Nontabular Discount
34Inter-
Net Balance SheetReserves After Discount
26
Direct and Assumed
27
Ceded
28
Net
29
Direct and Assumed
30
Ceded
31
Net
32
Loss
33
LossExpense
Company Pooling
Participation Percentage
35
LossesUnpaid
36Loss
Expenses Unpaid
1. XXX XXX XXX XXX XXX XXX XXX
2.
3.
4.
5.
6.
7. 907 907 12.8 12.8
8. 4,406 4,406 22.1 22.1
9. 12,683 12,683 48.6 48.6
10. 13,373 13,373 50.7 50.7
11. 15,503 15,503 62.9 62.9
12. XXX XXX XXX XXX XXX XXX XXX
56

ANNUAL STATEMENT FOR THE YEAR 2006 OF THE NIC Insurance Company
SCHEDULE P - PART 1I - SPECIAL PROPERTY (FIRE, ALLIED LINES, INLAND MARINE, EARTHQUAKE, BURGLARY AND THEFT)
($000 Omitted)Years in Premiums Earned Loss and Loss Expense Payments 12Which
Premiums1 2 3
Loss PaymentsDefense and Cost
Containment PaymentsAdjusting and Other
Payments10 11
WereEarned
and LossesWere
IncurredDirect and Assumed Ceded
Net(Cols. 1 - 2)
4
Direct and Assumed
5
Ceded
6
Direct and Assumed
7
Ceded
8
Direct and Assumed
9
Ceded
Salvageand
SubrogationReceived
TotalNet Paid
(Cols. 4 - 5+ 6 - 7+ 8 - 9)
Number ofClaims
Reported - Direct and Assumed
1. Prior XXX XXX XXX XXX
2. 2005 XXX
3. 2006 XXX
4. Totals XXX XXX XXX XXX
Losses Unpaid Defense and Cost Containment UnpaidAdjusting and Other
Unpaid23 24 25
Case Basis Bulk + IBNR Case Basis Bulk + IBNR 21 22 Number of13
Direct and Assumed
14
Ceded
15
Direct and Assumed
16
Ceded
17
Direct and Assumed
18
Ceded
19
Direct and Assumed
20
CededDirect and Assumed Ceded
Salvageand
Subrogation Anticipated
TotalNet Losses
and Expenses
Unpaid
Claims Outstand-ing - Direct
andAssumed
1.
2.
3.
4.
TotalLosses and Loss Expenses Incurred
Loss and Loss Expense Percentage (Incurred/Premiums Earned) Nontabular Discount
34Inter-
Net Balance SheetReserves After Discount
26
Direct and Assumed
27
Ceded
28
Net
29
Direct and Assumed
30
Ceded
31
Net
32
Loss
33
LossExpense
Company Pooling
Participation Percentage
35
LossesUnpaid
36Loss
Expenses Unpaid
1. XXX XXX XXX XXX XXX XXX XXX
2.
3.
4. XXX XXX XXX XXX XXX XXX XXX
57

ANNUAL STATEMENT FOR THE YEAR 2006 OF THE NIC Insurance Company
SCHEDULE P - PART 1J - AUTO PHYSICAL DAMAGE
($000 Omitted)Years in Premiums Earned Loss and Loss Expense Payments 12Which
Premiums1 2 3
Loss PaymentsDefense and Cost
Containment PaymentsAdjusting and Other
Payments10 11
WereEarned
and LossesWere
IncurredDirect and Assumed Ceded
Net(Cols. 1 - 2)
4
Direct and Assumed
5
Ceded
6
Direct and Assumed
7
Ceded
8
Direct and Assumed
9
Ceded
Salvageand
SubrogationReceived
TotalNet Paid
(Cols. 4 - 5+ 6 - 7+ 8 - 9)
Number ofClaims
Reported - Direct and Assumed
1. Prior XXX XXX XXX XXX
2. 2005
3. 2006
4. Totals XXX XXX XXX XXX
Losses Unpaid Defense and Cost Containment UnpaidAdjusting and Other
Unpaid23 24 25
Case Basis Bulk + IBNR Case Basis Bulk + IBNR 21 22 Number of13
Direct and Assumed
14
Ceded
15
Direct and Assumed
16
Ceded
17
Direct and Assumed
18
Ceded
19
Direct and Assumed
20
CededDirect and Assumed Ceded
Salvageand
Subrogation Anticipated
TotalNet Losses
and Expenses
Unpaid
Claims Outstand-ing - Direct
andAssumed
1.
2.
3.
4.
TotalLosses and Loss Expenses Incurred
Loss and Loss Expense Percentage (Incurred/Premiums Earned) Nontabular Discount
34Inter-
Net Balance SheetReserves After Discount
26
Direct and Assumed
27
Ceded
28
Net
29
Direct and Assumed
30
Ceded
31
Net
32
Loss
33
LossExpense
Company Pooling
Participation Percentage
35
LossesUnpaid
36Loss
Expenses Unpaid
1. XXX XXX XXX XXX XXX XXX XXX
2.
3.
4. XXX XXX XXX XXX XXX XXX XXX
58

ANNUAL STATEMENT FOR THE YEAR 2006 OF THE NIC Insurance Company
SCHEDULE P - PART 1K - FIDELITY/SURETY
($000 Omitted)Years in Premiums Earned Loss and Loss Expense Payments 12Which
Premiums1 2 3
Loss PaymentsDefense and Cost
Containment PaymentsAdjusting and Other
Payments10 11
WereEarned
and LossesWere
IncurredDirect and Assumed Ceded
Net(Cols. 1 - 2)
4
Direct and Assumed
5
Ceded
6
Direct and Assumed
7
Ceded
8
Direct and Assumed
9
Ceded
Salvageand
SubrogationReceived
TotalNet Paid
(Cols. 4 - 5+ 6 - 7+ 8 - 9)
Number ofClaims
Reported - Direct and Assumed
1. Prior XXX XXX XXX XXX
2. 2005 XXX
3. 2006 XXX
4. Totals XXX XXX XXX XXX
Losses Unpaid Defense and Cost Containment UnpaidAdjusting and Other
Unpaid23 24 25
Case Basis Bulk + IBNR Case Basis Bulk + IBNR 21 22 Number of13
Direct and Assumed
14
Ceded
15
Direct and Assumed
16
Ceded
17
Direct and Assumed
18
Ceded
19
Direct and Assumed
20
CededDirect and Assumed Ceded
Salvageand
Subrogation Anticipated
TotalNet Losses
and Expenses
Unpaid
Claims Outstand-ing - Direct
andAssumed
1.
2.
3.
4.
TotalLosses and Loss Expenses Incurred
Loss and Loss Expense Percentage (Incurred/Premiums Earned) Nontabular Discount
34Inter-
Net Balance SheetReserves After Discount
26
Direct and Assumed
27
Ceded
28
Net
29
Direct and Assumed
30
Ceded
31
Net
32
Loss
33
LossExpense
Company Pooling
Participation Percentage
35
LossesUnpaid
36Loss
Expenses Unpaid
1. XXX XXX XXX XXX XXX XXX XXX
2.
3.
4. XXX XXX XXX XXX XXX XXX XXX
59

ANNUAL STATEMENT FOR THE YEAR 2006 OF THE NIC Insurance Company
Schedule P - Part 1L - Other
NONESchedule P - Part 1M - International
NONE
60, 61

ANNUAL STATEMENT FOR THE YEAR 2006 OF THE NIC Insurance Company
SCHEDULE P - PART 1N - REINSURANCE - NONPROPORTIONAL ASSUMED PROPERTY
($000 Omitted)Years in Premiums Earned Loss and Loss Expense Payments 12Which
Premiums1 2 3
Loss PaymentsDefense and Cost
Containment PaymentsAdjusting and Other
Payments10 11
WereEarned
and LossesWere
IncurredDirect and Assumed Ceded
Net(Cols. 1 - 2)
4
Direct and Assumed
5
Ceded
6
Direct and Assumed
7
Ceded
8
Direct and Assumed
9
Ceded
Salvageand
SubrogationReceived
TotalNet Paid
(Cols. 4 - 5+ 6 - 7+ 8 - 9)
Number ofClaims
Reported - Direct and Assumed
1. Prior XXX XXX XXX XXX
2. 1997 237 14 223 91 2 2 95 XXX
3. 1998 26 3 23 XXX
4. 1999 XXX
5. 2000 XXX
6. 2001 XXX
7. 2002 XXX
8. 2003 XXX
9. 2004 XXX
10. 2005 XXX
11. 2006 XXX
12. Totals XXX XXX XXX 91 2 2 95 XXX
Losses Unpaid Defense and Cost Containment UnpaidAdjusting and Other
Unpaid23 24 25
Case Basis Bulk + IBNR Case Basis Bulk + IBNR 21 22 Number of13
Direct and Assumed
14
Ceded
15
Direct and Assumed
16
Ceded
17
Direct and Assumed
18
Ceded
19
Direct and Assumed
20
CededDirect and Assumed Ceded
Salvageand
Subrogation Anticipated
TotalNet Losses
and Expenses
Unpaid
Claims Outstand-ing - Direct
andAssumed
1. XXX
2. XXX
3. XXX
4. XXX
5. XXX
6. XXX
7. XXX
8. XXX
9. XXX
10. XXX
11. XXX
12. XXX
TotalLosses and Loss Expenses Incurred
Loss and Loss Expense Percentage (Incurred/Premiums Earned) Nontabular Discount
34Inter-
Net Balance SheetReserves After Discount
26
Direct and Assumed
27
Ceded
28
Net
29
Direct and Assumed
30
Ceded
31
Net
32
Loss
33
LossExpense
Company Pooling
Participation Percentage
35
LossesUnpaid
36Loss
Expenses Unpaid
1. XXX XXX XXX XXX XXX XXX XXX
2. 95 95 40.1 42.6
3.
4.
5.
6.
7.
8.
9.
10.
11.
12. XXX XXX XXX XXX XXX XXX XXX
62

ANNUAL STATEMENT FOR THE YEAR 2006 OF THE NIC Insurance Company
SCHEDULE P - PART 1O - REINSURANCE - NONPROPORTIONAL ASSUMED LIABILITY
($000 Omitted)Years in Premiums Earned Loss and Loss Expense Payments 12Which
Premiums1 2 3
Loss PaymentsDefense and Cost
Containment PaymentsAdjusting and Other
Payments10 11
WereEarned
and LossesWere
IncurredDirect and Assumed Ceded
Net(Cols. 1 - 2)
4
Direct and Assumed
5
Ceded
6
Direct and Assumed
7
Ceded
8
Direct and Assumed
9
Ceded
Salvageand
SubrogationReceived
TotalNet Paid
(Cols. 4 - 5+ 6 - 7+ 8 - 9)
Number ofClaims
Reported - Direct and Assumed
1. Prior XXX XXX XXX XXX
2. 1997 105 5 100 28 2 1 31 XXX
3. 1998 XXX
4. 1999 XXX
5. 2000 XXX
6. 2001 XXX
7. 2002 XXX
8. 2003 XXX
9. 2004 XXX
10. 2005 XXX
11. 2006 XXX
12. Totals XXX XXX XXX 28 2 1 31 XXX
Losses Unpaid Defense and Cost Containment UnpaidAdjusting and Other
Unpaid23 24 25
Case Basis Bulk + IBNR Case Basis Bulk + IBNR 21 22 Number of13
Direct and Assumed
14
Ceded
15
Direct and Assumed
16
Ceded
17
Direct and Assumed
18
Ceded
19
Direct and Assumed
20
CededDirect and Assumed Ceded
Salvageand
Subrogation Anticipated
TotalNet Losses
and Expenses
Unpaid
Claims Outstand-ing - Direct
andAssumed
1. XXX
2. XXX
3. XXX
4. XXX
5. XXX
6. XXX
7. XXX
8. XXX
9. XXX
10. XXX
11. XXX
12. XXX
TotalLosses and Loss Expenses Incurred
Loss and Loss Expense Percentage (Incurred/Premiums Earned) Nontabular Discount
34Inter-
Net Balance SheetReserves After Discount
26
Direct and Assumed
27
Ceded
28
Net
29
Direct and Assumed
30
Ceded
31
Net
32
Loss
33
LossExpense
Company Pooling
Participation Percentage
35
LossesUnpaid
36Loss
Expenses Unpaid
1. XXX XXX XXX XXX XXX XXX XXX
2. 31 31 29.5 31.0
3.
4.
5.
6.
7.
8.
9.
10.
11.
12. XXX XXX XXX XXX XXX XXX XXX
63

ANNUAL STATEMENT FOR THE YEAR 2006 OF THE NIC Insurance Company
SCHEDULE P - PART 1P - REINSURANCE - NONPROPORTIONAL ASSUMED FINANCIAL LINES
($000 Omitted)Years in Premiums Earned Loss and Loss Expense Payments 12Which
Premiums1 2 3
Loss PaymentsDefense and Cost
Containment PaymentsAdjusting and Other
Payments10 11
WereEarned
and LossesWere
IncurredDirect and Assumed Ceded
Net(Cols. 1 - 2)
4
Direct and Assumed
5
Ceded
6
Direct and Assumed
7
Ceded
8
Direct and Assumed
9
Ceded
Salvageand
SubrogationReceived
TotalNet Paid
(Cols. 4 - 5+ 6 - 7+ 8 - 9)
Number ofClaims
Reported - Direct and Assumed
1. Prior XXX XXX XXX XXX
2. 1997 12 1 11 5 5 XXX
3. 1998 7 7 XXX
4. 1999 XXX
5. 2000 XXX
6. 2001 XXX
7. 2002 XXX
8. 2003 XXX
9. 2004 XXX
10. 2005 XXX
11. 2006 XXX
12. Totals XXX XXX XXX 5 5 XXX
Losses Unpaid Defense and Cost Containment UnpaidAdjusting and Other
Unpaid23 24 25
Case Basis Bulk + IBNR Case Basis Bulk + IBNR 21 22 Number of13
Direct and Assumed
14
Ceded
15
Direct and Assumed
16
Ceded
17
Direct and Assumed
18
Ceded
19
Direct and Assumed
20
CededDirect and Assumed Ceded
Salvageand
Subrogation Anticipated
TotalNet Losses
and Expenses
Unpaid
Claims Outstand-ing - Direct
andAssumed
1. XXX
2. XXX
3. XXX
4. XXX
5. XXX
6. XXX
7. XXX
8. XXX
9. XXX
10. XXX
11. XXX
12. XXX
TotalLosses and Loss Expenses Incurred
Loss and Loss Expense Percentage (Incurred/Premiums Earned) Nontabular Discount
34Inter-
Net Balance SheetReserves After Discount
26
Direct and Assumed
27
Ceded
28
Net
29
Direct and Assumed
30
Ceded
31
Net
32
Loss
33
LossExpense
Company Pooling
Participation Percentage
35
LossesUnpaid
36Loss
Expenses Unpaid
1. XXX XXX XXX XXX XXX XXX XXX
2. 5 5 41.7 45.5
3.
4.
5.
6.
7.
8.
9.
10.
11.
12. XXX XXX XXX XXX XXX XXX XXX
64
ANNUAL STATEMENT FOR THE YEAR 2006 OF THE NIC Insurance Company
Schedule P - Part 1R - Prod Liab Occur
NONESchedule P - Part 1R - Prod Liab Claims
NONESchedule P - Part 1S-Fin./Mtg. Guaranty
NONE
65, 66, 67

ANNUAL STATEMENT FOR THE YEAR 2006 OF THE NIC Insurance Company
SCHEDULE P - PART 2A - HOMEOWNERS/FARMOWNERSINCURRED NET LOSSES AND DEFENSE AND COST CONTAINMENT EXPENSES REPORTED AT YEAR END ($000 OMITTED) DEVELOPMENT
Years in Which Losses Were
Incurred
1
1997
2
1998
3
1999
4
2000
5
2001
6
2002
7
2003
8
2004
9
2005
10
2006
11
One Year
12
Two Year1. Prior 89 67 65 65 65 65 65 65 65 65 2. 1997 18 10 10 10 10 10 10 10 10 10 3. 1998 XXX 15 15 15 15 15 15 15 15 15 4. 1999 XXX XXX5. 2000 XXX XXX XXX6. 2001 XXX XXX XXX XXX7. 2002 XXX XXX XXX XXX XXX8. 2003 XXX XXX XXX XXX XXX XXX9. 2004 XXX XXX XXX XXX XXX XXX XXX
10. 2005 XXX XXX XXX XXX XXX XXX XXX XXX XXX11. 2006 XXX XXX XXX XXX XXX XXX XXX XXX XXX XXX XXX
12. Totals
SCHEDULE P - PART 2B - PRIVATE PASSENGER AUTO LIABILITY/MEDICAL1. Prior 12 10 11 11 11 11 11 11 11 11 2. 1997 1 1 1 1 1 1 1 1 3. 1998 XXX 1 1 1 1 1 1 1 1 4. 1999 XXX XXX5. 2000 XXX XXX XXX6. 2001 XXX XXX XXX XXX7. 2002 XXX XXX XXX XXX XXX8. 2003 XXX XXX XXX XXX XXX XXX9. 2004 XXX XXX XXX XXX XXX XXX XXX
10. 2005 XXX XXX XXX XXX XXX XXX XXX XXX XXX11. 2006 XXX XXX XXX XXX XXX XXX XXX XXX XXX XXX XXX
12. Totals
SCHEDULE P - PART 2C - COMMERCIAL AUTO/TRUCK LIABILITY/MEDICAL1. Prior 9 2 2 2 2 2 2 2 2 2 2. 1997 3. 1998 XXX4. 1999 XXX XXX5. 2000 XXX XXX XXX6. 2001 XXX XXX XXX XXX7. 2002 XXX XXX XXX XXX XXX8. 2003 XXX XXX XXX XXX XXX XXX9. 2004 XXX XXX XXX XXX XXX XXX XXX
10. 2005 XXX XXX XXX XXX XXX XXX XXX XXX XXX11. 2006 XXX XXX XXX XXX XXX XXX XXX XXX XXX XXX XXX
12. Totals
SCHEDULE P - PART 2D- WORKERS’ COMPENSATION1. Prior 2. 1997 3. 1998 XXX4. 1999 XXX XXX5. 2000 XXX XXX XXX6. 2001 XXX XXX XXX XXX7. 2002 XXX XXX XXX XXX XXX8. 2003 XXX XXX XXX XXX XXX XXX9. 2004 XXX XXX XXX XXX XXX XXX XXX
10. 2005 XXX XXX XXX XXX XXX XXX XXX XXX XXX11. 2006 XXX XXX XXX XXX XXX XXX XXX XXX XXX XXX XXX
12. Totals
SCHEDULE P - PART 2E- COMMERCIAL MULTIPLE PERIL1. Prior 819 782 781 781 781 781 781 781 781 781 2. 1997 21 22 21 21 21 21 21 21 21 21 3. 1998 XXX 72 71 71 71 71 71 71 71 71 4. 1999 XXX XXX5. 2000 XXX XXX XXX6. 2001 XXX XXX XXX XXX7. 2002 XXX XXX XXX XXX XXX8. 2003 XXX XXX XXX XXX XXX XXX9. 2004 XXX XXX XXX XXX XXX XXX XXX
10. 2005 XXX XXX XXX XXX XXX XXX XXX XXX XXX11. 2006 XXX XXX XXX XXX XXX XXX XXX XXX XXX XXX XXX
12. Totals
68
NONE

ANNUAL STATEMENT FOR THE YEAR 2006 OF THE NIC Insurance Company
SCHEDULE P - PART 2F - SECTION 1 - MEDICAL MALPRACTICE - OCCURRENCEINCURRED NET LOSSES AND DEFENSE AND COST CONTAINMENT EXPENSES REPORTED AT YEAR END ($000 OMITTED) DEVELOPMENT
Years in Which Losses Were
Incurred
1
1997
2
1998
3
1999
4
2000
5
2001
6
2002
7
2003
8
2004
9
2005
10
2006
11
One Year
12
Two Year1. Prior 2. 1997 3. 1998 XXX4. 1999 XXX XXX5. 2000 XXX XXX XXX6. 2001 XXX XXX XXX XXX7. 2002 XXX XXX XXX XXX XXX8. 2003 XXX XXX XXX XXX XXX XXX9. 2004 XXX XXX XXX XXX XXX XXX XXX
10. 2005 XXX XXX XXX XXX XXX XXX XXX XXX XXX11. 2006 XXX XXX XXX XXX XXX XXX XXX XXX XXX XXX XXX
12. Totals
SCHEDULE P - PART 2F - SECTION 2 - MEDICAL MALPRACTICE - CLAIMS-MADE1. Prior 2. 1997 3. 1998 XXX4. 1999 XXX XXX5. 2000 XXX XXX XXX6. 2001 XXX XXX XXX XXX7. 2002 XXX XXX XXX XXX XXX8. 2003 XXX XXX XXX XXX XXX XXX9. 2004 XXX XXX XXX XXX XXX XXX XXX
10. 2005 XXX XXX XXX XXX XXX XXX XXX XXX XXX11. 2006 XXX XXX XXX XXX XXX XXX XXX XXX XXX XXX XXX
12. Totals
SCHEDULE P - PART 2G - SPECIAL LIABILITY(OCEAN MARINE, AIRCRAFT (ALL PERILS), BOILER AND MACHINERY)
1. Prior 6,406 6,214 6,215 6,215 6,215 6,215 6,215 6,215 6,215 6,215 2. 1997 2,853 2,826 2,826 2,826 2,826 2,826 2,826 2,826 2,826 2,826 3. 1998 XXX 2,148 2,167 2,167 2,167 2,167 2,167 2,167 2,167 2,167 4. 1999 XXX XXX5. 2000 XXX XXX XXX6. 2001 XXX XXX XXX XXX7. 2002 XXX XXX XXX XXX XXX8. 2003 XXX XXX XXX XXX XXX XXX9. 2004 XXX XXX XXX XXX XXX XXX XXX
10. 2005 XXX XXX XXX XXX XXX XXX XXX XXX XXX11. 2006 XXX XXX XXX XXX XXX XXX XXX XXX XXX XXX XXX
12. Totals
SCHEDULE P - PART 2H - SECTION 1 - OTHER LIABILITY - OCCURRENCE1. Prior 553 552 551 551 551 551 551 551 551 551 2. 1997 643 632 632 632 632 632 632 632 632 632 3. 1998 XXX 770 769 769 769 769 769 769 769 769 4. 1999 XXX XXX5. 2000 XXX XXX XXX6. 2001 XXX XXX XXX XXX7. 2002 XXX XXX XXX XXX XXX8. 2003 XXX XXX XXX XXX XXX XXX9. 2004 XXX XXX XXX XXX XXX XXX XXX
10. 2005 XXX XXX XXX XXX XXX XXX XXX XXX XXX11. 2006 XXX XXX XXX XXX XXX XXX XXX XXX XXX XXX XXX
12. Totals
SCHEDULE P - PART 2H - SECTION 2 - OTHER LIABILITY - CLAIMS-MADE1. Prior 2. 1997 3. 1998 XXX4. 1999 XXX XXX5. 2000 XXX XXX XXX6. 2001 XXX XXX XXX XXX7. 2002 XXX XXX XXX XXX XXX8. 2003 XXX XXX XXX XXX XXX XXX9. 2004 XXX XXX XXX XXX XXX XXX XXX
10. 2005 XXX XXX XXX XXX XXX XXX XXX XXX XXX11. 2006 XXX XXX XXX XXX XXX XXX XXX XXX XXX XXX XXX
12. Totals
69
NONE
NONE

ANNUAL STATEMENT FOR THE YEAR 2006 OF THE NIC Insurance Company
SCHEDULE P - PART 2I - SPECIAL PROPERTY (FIRE, ALLIED LINES, INLAND MARINE, EARTHQUAKE, BURGLARY, AND THEFT)
INCURRED NET LOSSES AND DEFENSE AND COST CONTAINMENT EXPENSES REPORTED AT YEAR END ($000 OMITTED) DEVELOPMENTYears in Which Losses Were
Incurred
1
1997
2
1998
3
1999
4
2000
5
2001
6
2002
7
2003
8
2004
9
2005
10
2006
11
One Year
12
Two Year
1. Prior XXX XXX XXX XXX XXX XXX XXX
2. 2005 XXX XXX XXX XXX XXX XXX XXX XXX XXX
3. 2006 XXX XXX XXX XXX XXX XXX XXX XXX XXX XXX XXX
4. Totals
SCHEDULE P - PART 2J - AUTO PHYSICAL DAMAGE1. Prior XXX XXX XXX XXX XXX XXX XXX
2. 2005 XXX XXX XXX XXX XXX XXX XXX XXX XXX
3. 2006 XXX XXX XXX XXX XXX XXX XXX XXX XXX XXX XXX
4. Totals
SCHEDULE P - PART 2K - FIDELITY, SURETY1. Prior XXX XXX XXX XXX XXX XXX XXX
2. 2005 XXX XXX XXX XXX XXX XXX XXX XXX XXX
3. 2006 XXX XXX XXX XXX XXX XXX XXX XXX XXX XXX XXX
4. Totals
SCHEDULE P - PART 2L - OTHER(INCLUDING CREDIT, ACCIDENT AND HEALTH)
1. Prior XXX XXX XXX XXX XXX XXX XXX
2. 2005 XXX XXX XXX XXX XXX XXX XXX XXX XXX
3. 2006 XXX XXX XXX XXX XXX XXX XXX XXX XXX XXX XXX
4. Totals
SCHEDULE P - PART 2M - INTERNATIONAL1. Prior
2. 1997
3. 1998 XXX
4. 1999 XXX XXX
5. 2000 XXX XXX XXX
6. 2001 XXX XXX XXX XXX
7. 2002 XXX XXX XXX XXX XXX
8. 2003 XXX XXX XXX XXX XXX XXX
9. 2004 XXX XXX XXX XXX XXX XXX XXX
10. 2005 XXX XXX XXX XXX XXX XXX XXX XXX XXX
11. 2006 XXX XXX XXX XXX XXX XXX XXX XXX XXX XXX XXX
12. Totals
70
NONE
NONE

ANNUAL STATEMENT FOR THE YEAR 2006 OF THE NIC Insurance Company
SCHEDULE P - PART 2N - REINSURANCENonproportional Assumed Property
INCURRED NET LOSSES AND DEFENSE AND COST CONTAINMENT EXPENSES REPORTED AT YEAR END ($000 OMITTED) DEVELOPMENTYears in Which Losses Were
Incurred
1
1997
2
1998
3
1999
4
2000
5
2001
6
2002
7
2003
8
2004
9
2005
10
2006
11
One Year
12
Two Year
1. Prior 411 444 446 446 446 446 446 446 446 446
2. 1997 148 94 93 93 93 93 93 93 93 93
3. 1998 XXX
4. 1999 XXX XXX
5. 2000 XXX XXX XXX
6. 2001 XXX XXX XXX XXX
7. 2002 XXX XXX XXX XXX XXX
8. 2003 XXX XXX XXX XXX XXX XXX
9. 2004 XXX XXX XXX XXX XXX XXX XXX
10. 2005 XXX XXX XXX XXX XXX XXX XXX XXX XXX
11. 2006 XXX XXX XXX XXX XXX XXX XXX XXX XXX XXX XXX
12. Totals
SCHEDULE P - PART 2O - REINSURANCENonproportional Assumed Liability
1. Prior 322 352 353 353 353 353 353 353 353 353
2. 1997 53 30 30 30 30 30 30 30 30 30
3. 1998 XXX
4. 1999 XXX XXX
5. 2000 XXX XXX XXX
6. 2001 XXX XXX XXX XXX
7. 2002 XXX XXX XXX XXX XXX
8. 2003 XXX XXX XXX XXX XXX XXX
9. 2004 XXX XXX XXX XXX XXX XXX XXX
10. 2005 XXX XXX XXX XXX XXX XXX XXX XXX XXX
11. 2006 XXX XXX XXX XXX XXX XXX XXX XXX XXX XXX XXX
12. Totals
SCHEDULE P - PART 2P - REINSURANCENonproportional Assumed Financial Lines
1. Prior 50 77 77 77 77 77 77 77 77 77
2. 1997 7 5 5 5 5 5 5 5 5 5
3. 1998 XXX
4. 1999 XXX XXX
5. 2000 XXX XXX XXX
6. 2001 XXX XXX XXX XXX
7. 2002 XXX XXX XXX XXX XXX
8. 2003 XXX XXX XXX XXX XXX XXX
9. 2004 XXX XXX XXX XXX XXX XXX XXX
10. 2005 XXX XXX XXX XXX XXX XXX XXX XXX XXX
11. 2006 XXX XXX XXX XXX XXX XXX XXX XXX XXX XXX XXX
12. Totals
71

ANNUAL STATEMENT FOR THE YEAR 2006 OF THE NIC Insurance Company
SCHEDULE P - PART 2R - SECTION 1 - PRODUCTS LIABILITY - OCCURRENCEINCURRED NET LOSSES AND DEFENSE AND COST CONTAINMENT EXPENSES REPORTED AT YEAR END ($000 OMITTED) DEVELOPMENT
Years in Which Losses Were
Incurred
1
1997
2
1998
3
1999
4
2000
5
2001
6
2002
7
2003
8
2004
9
2005
10
2006
11
One Year
12
Two Year
1. Prior
2. 1997
3. 1998 XXX
4. 1999 XXX XXX
5. 2000 XXX XXX XXX
6. 2001 XXX XXX XXX XXX
7. 2002 XXX XXX XXX XXX XXX
8. 2003 XXX XXX XXX XXX XXX XXX
9. 2004 XXX XXX XXX XXX XXX XXX XXX
10. 2005 XXX XXX XXX XXX XXX XXX XXX XXX XXX
11. 2006 XXX XXX XXX XXX XXX XXX XXX XXX XXX XXX XXX
12. Totals
SCHEDULE P - PART 2R - SECTION 2 - PRODUCTS LIABILITY - CLAIMS-MADE1. Prior
2. 1997
3. 1998 XXX
4. 1999 XXX XXX
5. 2000 XXX XXX XXX
6. 2001 XXX XXX XXX XXX
7. 2002 XXX XXX XXX XXX XXX
8. 2003 XXX XXX XXX XXX XXX XXX
9. 2004 XXX XXX XXX XXX XXX XXX XXX
10. 2005 XXX XXX XXX XXX XXX XXX XXX XXX XXX
11. 2006 XXX XXX XXX XXX XXX XXX XXX XXX XXX XXX XXX
12. Totals
SCHEDULE P - PART 2S - FINANCIAL GUARANTY/MORTGAGE GUARANTY1. Prior XXX XXX XXX XXX XXX XXX XXX
2. 2005 XXX XXX XXX XXX XXX XXX XXX XXX XXX
3. 2006 XXX XXX XXX XXX XXX XXX XXX XXX XXX XXX XXX
4. Totals
72
NONE
NONE
NONE
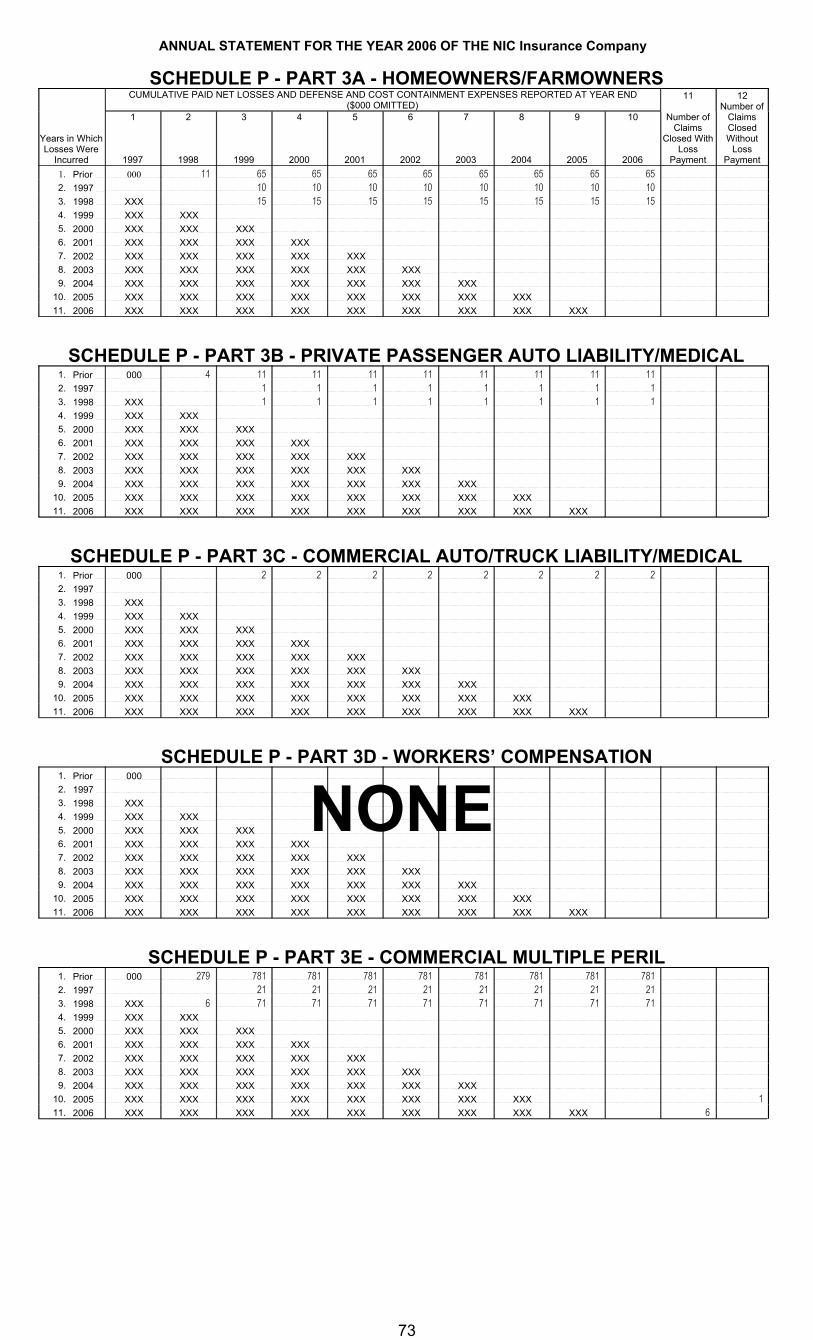
ANNUAL STATEMENT FOR THE YEAR 2006 OF THE NIC Insurance Company
SCHEDULE P - PART 3A - HOMEOWNERS/FARMOWNERSCUMULATIVE PAID NET LOSSES AND DEFENSE AND COST CONTAINMENT EXPENSES REPORTED AT YEAR END
($000 OMITTED)11 12
Number of
Years in Which Losses Were
Incurred
1
1997
2
1998
3
1999
4
2000
5
2001
6
2002
7
2003
8
2004
9
2005
10
2006
Number of Claims
Closed With Loss
Payment
Claims Closed Without
Loss Payment
1. Prior 000 11 65 65 65 65 65 65 65 65 2. 1997 10 10 10 10 10 10 10 10 3. 1998 XXX 15 15 15 15 15 15 15 15 4. 1999 XXX XXX5. 2000 XXX XXX XXX6. 2001 XXX XXX XXX XXX7. 2002 XXX XXX XXX XXX XXX8. 2003 XXX XXX XXX XXX XXX XXX9. 2004 XXX XXX XXX XXX XXX XXX XXX
10. 2005 XXX XXX XXX XXX XXX XXX XXX XXX11. 2006 XXX XXX XXX XXX XXX XXX XXX XXX XXX
SCHEDULE P - PART 3B - PRIVATE PASSENGER AUTO LIABILITY/MEDICAL1. Prior 000 4 11 11 11 11 11 11 11 11 2. 1997 1 1 1 1 1 1 1 1 3. 1998 XXX 1 1 1 1 1 1 1 1 4. 1999 XXX XXX5. 2000 XXX XXX XXX6. 2001 XXX XXX XXX XXX7. 2002 XXX XXX XXX XXX XXX8. 2003 XXX XXX XXX XXX XXX XXX9. 2004 XXX XXX XXX XXX XXX XXX XXX
10. 2005 XXX XXX XXX XXX XXX XXX XXX XXX11. 2006 XXX XXX XXX XXX XXX XXX XXX XXX XXX
SCHEDULE P - PART 3C - COMMERCIAL AUTO/TRUCK LIABILITY/MEDICAL1. Prior 000 2 2 2 2 2 2 2 2 2. 1997 3. 1998 XXX4. 1999 XXX XXX5. 2000 XXX XXX XXX6. 2001 XXX XXX XXX XXX7. 2002 XXX XXX XXX XXX XXX8. 2003 XXX XXX XXX XXX XXX XXX9. 2004 XXX XXX XXX XXX XXX XXX XXX
10. 2005 XXX XXX XXX XXX XXX XXX XXX XXX11. 2006 XXX XXX XXX XXX XXX XXX XXX XXX XXX
SCHEDULE P - PART 3D - WORKERS’ COMPENSATION1. Prior 0002. 1997 3. 1998 XXX4. 1999 XXX XXX5. 2000 XXX XXX XXX6. 2001 XXX XXX XXX XXX7. 2002 XXX XXX XXX XXX XXX8. 2003 XXX XXX XXX XXX XXX XXX9. 2004 XXX XXX XXX XXX XXX XXX XXX
10. 2005 XXX XXX XXX XXX XXX XXX XXX XXX11. 2006 XXX XXX XXX XXX XXX XXX XXX XXX XXX
SCHEDULE P - PART 3E - COMMERCIAL MULTIPLE PERIL1. Prior 000 279 781 781 781 781 781 781 781 781 2. 1997 21 21 21 21 21 21 21 21 3. 1998 XXX 6 71 71 71 71 71 71 71 71 4. 1999 XXX XXX5. 2000 XXX XXX XXX6. 2001 XXX XXX XXX XXX7. 2002 XXX XXX XXX XXX XXX8. 2003 XXX XXX XXX XXX XXX XXX9. 2004 XXX XXX XXX XXX XXX XXX XXX
10. 2005 XXX XXX XXX XXX XXX XXX XXX XXX 1 11. 2006 XXX XXX XXX XXX XXX XXX XXX XXX XXX 6
73
NONE

ANNUAL STATEMENT FOR THE YEAR 2006 OF THE NIC Insurance Company
SCHEDULE P - PART 3F - SECTION 1 - MEDICAL MALPRACTICE - OCCURRENCECUMULATIVE PAID NET LOSSES AND DEFENSE AND COST CONTAINMENT EXPENSES REPORTED AT YEAR END
($000 OMITTED)11 12
Number of
Years in Which Losses Were
Incurred
1
1997
2
1998
3
1999
4
2000
5
2001
6
2002
7
2003
8
2004
9
2005
10
2006
Number of Claims
Closed With Loss
Payment
Claims Closed Without
Loss Payment
1. Prior 0002. 1997 3. 1998 XXX4. 1999 XXX XXX5. 2000 XXX XXX XXX6. 2001 XXX XXX XXX XXX7. 2002 XXX XXX XXX XXX XXX8. 2003 XXX XXX XXX XXX XXX XXX9. 2004 XXX XXX XXX XXX XXX XXX XXX
10. 2005 XXX XXX XXX XXX XXX XXX XXX XXX11. 2006 XXX XXX XXX XXX XXX XXX XXX XXX XXX
SCHEDULE P - PART 3F - SECTION 2 - MEDICAL MALPRACTICE - CLAIMS-MADE1. Prior 0002. 1997 3. 1998 XXX4. 1999 XXX XXX5. 2000 XXX XXX XXX6. 2001 XXX XXX XXX XXX7. 2002 XXX XXX XXX XXX XXX8. 2003 XXX XXX XXX XXX XXX XXX9. 2004 XXX XXX XXX XXX XXX XXX XXX
10. 2005 XXX XXX XXX XXX XXX XXX XXX XXX11. 2006 XXX XXX XXX XXX XXX XXX XXX XXX XXX
SCHEDULE P - PART 3G - SPECIAL LIABILITY(OCEAN MARINE, AIRCRAFT (ALL PERILS), BOILER AND MACHINERY)
1. Prior 000 1,491 6,215 6,215 6,215 6,215 6,215 6,215 6,215 6,215 XXX XXX2. 1997 633 1,362 2,826 2,826 2,826 2,826 2,826 2,826 2,826 2,826 XXX XXX3. 1998 XXX 526 2,167 2,167 2,167 2,167 2,167 2,167 2,167 2,167 XXX XXX4. 1999 XXX XXX XXX XXX5. 2000 XXX XXX XXX XXX XXX6. 2001 XXX XXX XXX XXX XXX XXX7. 2002 XXX XXX XXX XXX XXX XXX XXX8. 2003 XXX XXX XXX XXX XXX XXX XXX XXX9. 2004 XXX XXX XXX XXX XXX XXX XXX XXX XXX
10. 2005 XXX XXX XXX XXX XXX XXX XXX XXX XXX XXX11. 2006 XXX XXX XXX XXX XXX XXX XXX XXX XXX XXX XXX
SCHEDULE P - PART 3H - SECTION 1 - OTHER LIABILITY - OCCURRENCE1. Prior 000 187 551 551 551 551 551 551 551 551 37 22 2. 1997 34 157 632 632 632 632 632 632 632 632 59 46 3. 1998 XXX 16 769 769 769 769 769 769 769 769 32 20 4. 1999 XXX XXX 57 40 5. 2000 XXX XXX XXX 81 45 6. 2001 XXX XXX XXX XXX 272 138 7. 2002 XXX XXX XXX XXX XXX 672 329 8. 2003 XXX XXX XXX XXX XXX XXX 593 289 9. 2004 XXX XXX XXX XXX XXX XXX XXX 453 309
10. 2005 XXX XXX XXX XXX XXX XXX XXX XXX 234 432 11. 2006 XXX XXX XXX XXX XXX XXX XXX XXX XXX 41 90
SCHEDULE P - PART 3H - SECTION 2 - OTHER LIABILITY - CLAIMS-MADE1. Prior 0002. 1997 3. 1998 XXX4. 1999 XXX XXX5. 2000 XXX XXX XXX6. 2001 XXX XXX XXX XXX7. 2002 XXX XXX XXX XXX XXX 13 6 8. 2003 XXX XXX XXX XXX XXX XXX 13 36 9. 2004 XXX XXX XXX XXX XXX XXX XXX 3 46
10. 2005 XXX XXX XXX XXX XXX XXX XXX XXX 5 106 11. 2006 XXX XXX XXX XXX XXX XXX XXX XXX XXX 5 26
74
NONE
NONE

ANNUAL STATEMENT FOR THE YEAR 2006 OF THE NIC Insurance Company
SCHEDULE P - PART 3I - SPECIAL PROPERTY(FIRE, ALLIED LINES, INLAND MARINE, EARTHQUAKE, BURGLARY, AND THEFT)
CUMULATIVE PAID NET LOSSES AND DEFENSE AND COST CONTAINMENT EXPENSES REPORTED AT YEAR END($000 OMITTED)
11 12Number of
Years in Which Losses Were
Incurred
1
1997
2
1998
3
1999
4
2000
5
2001
6
2002
7
2003
8
2004
9
2005
10
2006
Number of Claims
Closed With Loss
Payment
Claims Closed Without
Loss Payment
1. Prior XXX XXX XXX XXX XXX XXX XXX 000 XXX XXX
2. 2005 XXX XXX XXX XXX XXX XXX XXX XXX XXX XXX
3. 2006 XXX XXX XXX XXX XXX XXX XXX XXX XXX XXX XXX
SCHEDULE P - PART 3J - AUTO PHYSICAL DAMAGE1. Prior XXX XXX XXX XXX XXX XXX XXX 000
2. 2005 XXX XXX XXX XXX XXX XXX XXX XXX
3. 2006 XXX XXX XXX XXX XXX XXX XXX XXX XXX
SCHEDULE P - PART 3K - FIDELITY/SURETY1. Prior XXX XXX XXX XXX XXX XXX XXX 000 XXX XXX
2. 2005 XXX XXX XXX XXX XXX XXX XXX XXX XXX XXX
3. 2006 XXX XXX XXX XXX XXX XXX XXX XXX XXX XXX XXX
SCHEDULE P - PART 3L - OTHER (INCLUDING CREDIT, ACCIDENT AND HEALTH)1. Prior XXX XXX XXX XXX XXX XXX XXX 000 XXX XXX
2. 2005 XXX XXX XXX XXX XXX XXX XXX XXX XXX XXX
3. 2006 XXX XXX XXX XXX XXX XXX XXX XXX XXX XXX XXX
SCHEDULE P - PART 3M - INTERNATIONAL1. Prior 000 XXX XXX
2. 1997 XXX XXX
3. 1998 XXX XXX XXX
4. 1999 XXX XXX XXX XXX
5. 2000 XXX XXX XXX XXX XXX
6. 2001 XXX XXX XXX XXX XXX XXX
7. 2002 XXX XXX XXX XXX XXX XXX XXX
8. 2003 XXX XXX XXX XXX XXX XXX XXX XXX
9. 2004 XXX XXX XXX XXX XXX XXX XXX XXX XXX
10. 2005 XXX XXX XXX XXX XXX XXX XXX XXX XXX XXX
11. 2006 XXX XXX XXX XXX XXX XXX XXX XXX XXX XXX XXX
75
NONE
NONE

ANNUAL STATEMENT FOR THE YEAR 2006 OF THE NIC Insurance Company
SCHEDULE P - PART 3N - REINSURANCENonproportional Assumed Property
CUMULATIVE PAID NET LOSSES AND DEFENSE AND COST CONTAINMENT EXPENSES REPORTED AT YEAR END($000 OMITTED)
11 12Number of
Years in Which Losses Were
Incurred
1
1997
2
1998
3
1999
4
2000
5
2001
6
2002
7
2003
8
2004
9
2005
10
2006
Number of Claims
Closed With Loss
Payment
Claims Closed Without
Loss Payment
1. Prior 000 226 446 446 446 446 446 446 446 446 XXX XXX
2. 1997 33 63 93 93 93 93 93 93 93 93 XXX XXX
3. 1998 XXX XXX XXX
4. 1999 XXX XXX XXX XXX
5. 2000 XXX XXX XXX XXX XXX
6. 2001 XXX XXX XXX XXX XXX XXX
7. 2002 XXX XXX XXX XXX XXX XXX XXX
8. 2003 XXX XXX XXX XXX XXX XXX XXX XXX
9. 2004 XXX XXX XXX XXX XXX XXX XXX XXX XXX
10. 2005 XXX XXX XXX XXX XXX XXX XXX XXX XXX XXX
11. 2006 XXX XXX XXX XXX XXX XXX XXX XXX XXX XXX XXX
SCHEDULE P - PART 3O - REINSURANCENonproportional Assumed Liability
1. Prior 000 129 353 353 353 353 353 353 353 353 XXX XXX
2. 1997 14 16 30 30 30 30 30 30 30 30 XXX XXX
3. 1998 XXX XXX XXX
4. 1999 XXX XXX XXX XXX
5. 2000 XXX XXX XXX XXX XXX
6. 2001 XXX XXX XXX XXX XXX XXX
7. 2002 XXX XXX XXX XXX XXX XXX XXX
8. 2003 XXX XXX XXX XXX XXX XXX XXX XXX
9. 2004 XXX XXX XXX XXX XXX XXX XXX XXX XXX
10. 2005 XXX XXX XXX XXX XXX XXX XXX XXX XXX XXX
11. 2006 XXX XXX XXX XXX XXX XXX XXX XXX XXX XXX XXX
SCHEDULE P - PART 3P - REINSURANCENonproportional Assumed Financial Lines
1. Prior 000 19 77 77 77 77 77 77 77 77 XXX XXX
2. 1997 3 5 5 5 5 5 5 5 5 XXX XXX
3. 1998 XXX XXX XXX
4. 1999 XXX XXX XXX XXX
5. 2000 XXX XXX XXX XXX XXX
6. 2001 XXX XXX XXX XXX XXX XXX
7. 2002 XXX XXX XXX XXX XXX XXX XXX
8. 2003 XXX XXX XXX XXX XXX XXX XXX XXX
9. 2004 XXX XXX XXX XXX XXX XXX XXX XXX XXX
10. 2005 XXX XXX XXX XXX XXX XXX XXX XXX XXX XXX
11. 2006 XXX XXX XXX XXX XXX XXX XXX XXX XXX XXX XXX
76
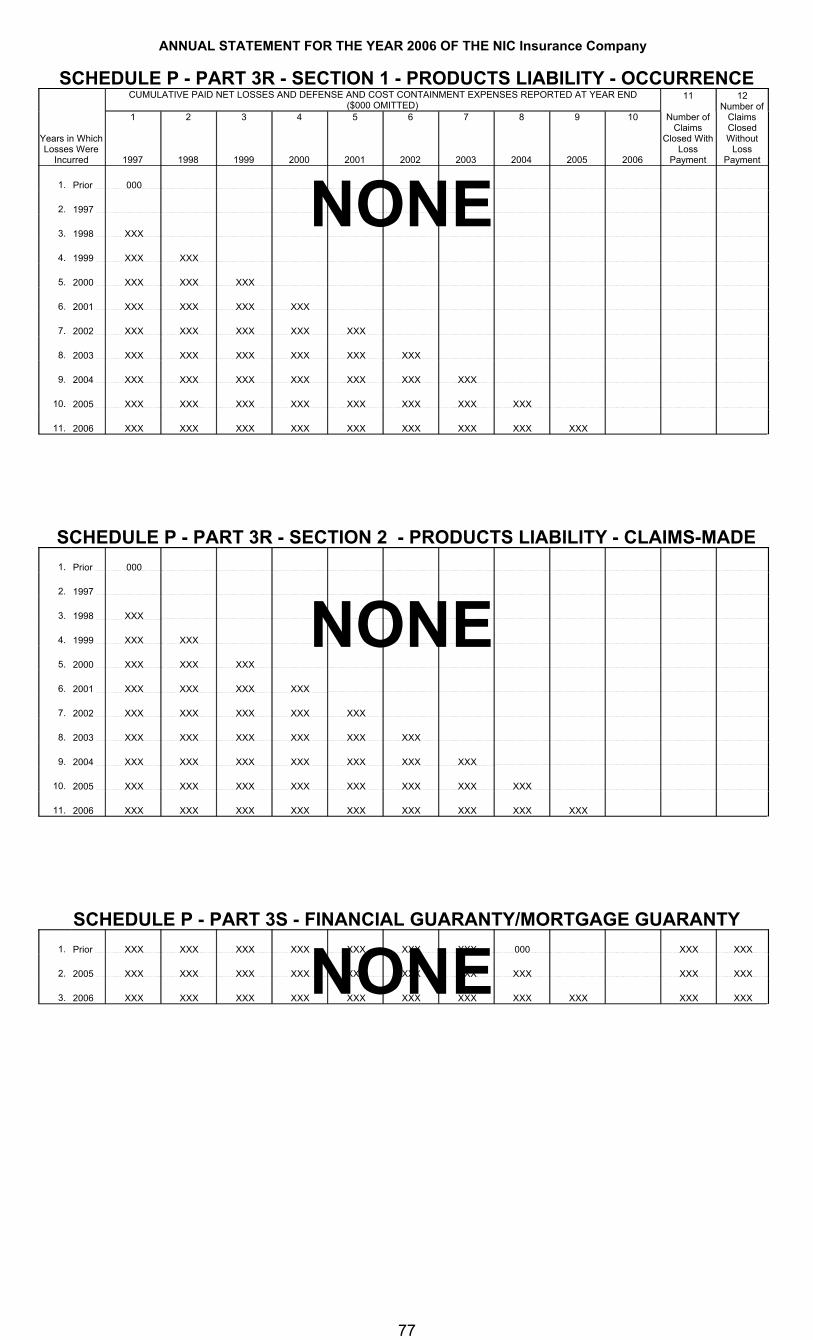
ANNUAL STATEMENT FOR THE YEAR 2006 OF THE NIC Insurance Company
SCHEDULE P - PART 3R - SECTION 1 - PRODUCTS LIABILITY - OCCURRENCECUMULATIVE PAID NET LOSSES AND DEFENSE AND COST CONTAINMENT EXPENSES REPORTED AT YEAR END
($000 OMITTED)11 12
Number of
Years in Which Losses Were
Incurred
1
1997
2
1998
3
1999
4
2000
5
2001
6
2002
7
2003
8
2004
9
2005
10
2006
Number of Claims
Closed With Loss
Payment
Claims Closed Without
Loss Payment
1. Prior 000
2. 1997
3. 1998 XXX
4. 1999 XXX XXX
5. 2000 XXX XXX XXX
6. 2001 XXX XXX XXX XXX
7. 2002 XXX XXX XXX XXX XXX
8. 2003 XXX XXX XXX XXX XXX XXX
9. 2004 XXX XXX XXX XXX XXX XXX XXX
10. 2005 XXX XXX XXX XXX XXX XXX XXX XXX
11. 2006 XXX XXX XXX XXX XXX XXX XXX XXX XXX
SCHEDULE P - PART 3R - SECTION 2 - PRODUCTS LIABILITY - CLAIMS-MADE1. Prior 000
2. 1997
3. 1998 XXX
4. 1999 XXX XXX
5. 2000 XXX XXX XXX
6. 2001 XXX XXX XXX XXX
7. 2002 XXX XXX XXX XXX XXX
8. 2003 XXX XXX XXX XXX XXX XXX
9. 2004 XXX XXX XXX XXX XXX XXX XXX
10. 2005 XXX XXX XXX XXX XXX XXX XXX XXX
11. 2006 XXX XXX XXX XXX XXX XXX XXX XXX XXX
SCHEDULE P - PART 3S - FINANCIAL GUARANTY/MORTGAGE GUARANTY1. Prior XXX XXX XXX XXX XXX XXX XXX 000 XXX XXX
2. 2005 XXX XXX XXX XXX XXX XXX XXX XXX XXX XXX
3. 2006 XXX XXX XXX XXX XXX XXX XXX XXX XXX XXX XXX
77
NONE
NONE
NONE

ANNUAL STATEMENT FOR THE YEAR 2006 OF THE NIC Insurance Company
SCHEDULE P - PART 4A - HOMEOWNERS/FARMOWNERSBULK AND IBNR RESERVES ON NET LOSSES AND DEFENSE AND COST CONTAINMENT EXPENSES REPORTED AT YEAR END ($000 OMITTED)
Years in Which Losses Were
Incurred
1
1997
2
1998
3
1999
4
2000
5
2001
6
2002
7
2003
8
2004
9
2005
10
20061. Prior 82 51 2. 1997 18 10 3. 1998 XXX 15 4. 1999 XXX XXX5. 2000 XXX XXX XXX6. 2001 XXX XXX XXX XXX7. 2002 XXX XXX XXX XXX XXX8. 2003 XXX XXX XXX XXX XXX XXX9. 2004 XXX XXX XXX XXX XXX XXX XXX
10. 2005 XXX XXX XXX XXX XXX XXX XXX XXX11. 2006 XXX XXX XXX XXX XXX XXX XXX XXX XXX
SCHEDULE P - PART 4B - PRIVATE PASSENGER AUTO LIABILITY/MEDICAL1. Prior 10 3 2. 1997 3. 1998 XXX4. 1999 XXX XXX5. 2000 XXX XXX XXX6. 2001 XXX XXX XXX XXX7. 2002 XXX XXX XXX XXX XXX8. 2003 XXX XXX XXX XXX XXX XXX9. 2004 XXX XXX XXX XXX XXX XXX XXX
10. 2005 XXX XXX XXX XXX XXX XXX XXX XXX11. 2006 XXX XXX XXX XXX XXX XXX XXX XXX XXX
SCHEDULE P - PART 4C - COMMERCIAL AUTO/TRUCK LIABILITY/MEDICAL1. Prior 7 2. 1997 3. 1998 XXX4. 1999 XXX XXX5. 2000 XXX XXX XXX6. 2001 XXX XXX XXX XXX7. 2002 XXX XXX XXX XXX XXX8. 2003 XXX XXX XXX XXX XXX XXX9. 2004 XXX XXX XXX XXX XXX XXX XXX
10. 2005 XXX XXX XXX XXX XXX XXX XXX XXX11. 2006 XXX XXX XXX XXX XXX XXX XXX XXX XXX
SCHEDULE P - PART 4D - WORKERS’ COMPENSATION1. Prior 2. 1997 3. 1998 XXX4. 1999 XXX XXX5. 2000 XXX XXX XXX6. 2001 XXX XXX XXX XXX7. 2002 XXX XXX XXX XXX XXX8. 2003 XXX XXX XXX XXX XXX XXX9. 2004 XXX XXX XXX XXX XXX XXX XXX
10. 2005 XXX XXX XXX XXX XXX XXX XXX XXX11. 2006 XXX XXX XXX XXX XXX XXX XXX XXX XXX
SCHEDULE P - PART 4E - COMMERCIAL MULTIPLE PERIL1. Prior 110 71 2. 1997 18 20 3. 1998 XXX 25 4. 1999 XXX XXX5. 2000 XXX XXX XXX6. 2001 XXX XXX XXX XXX7. 2002 XXX XXX XXX XXX XXX8. 2003 XXX XXX XXX XXX XXX XXX9. 2004 XXX XXX XXX XXX XXX XXX XXX
10. 2005 XXX XXX XXX XXX XXX XXX XXX XXX11. 2006 XXX XXX XXX XXX XXX XXX XXX XXX XXX
78
NONE

ANNUAL STATEMENT FOR THE YEAR 2006 OF THE NIC Insurance Company
SCHEDULE P - PART 4F - SECTION 1 - MEDICAL MALPRACTICE - OCCURRENCEBULK AND IBNR RESERVES ON NET LOSSES AND DEFENSE AND COST CONTAINMENT EXPENSES REPORTED AT YEAR END ($000 OMITTED)
Years in Which Losses Were
Incurred
1
1997
2
1998
3
1999
4
2000
5
2001
6
2002
7
2003
8
2004
9
2005
10
20061. Prior 2. 1997 3. 1998 XXX4. 1999 XXX XXX5. 2000 XXX XXX XXX6. 2001 XXX XXX XXX XXX7. 2002 XXX XXX XXX XXX XXX8. 2003 XXX XXX XXX XXX XXX XXX9. 2004 XXX XXX XXX XXX XXX XXX XXX
10. 2005 XXX XXX XXX XXX XXX XXX XXX XXX11. 2006 XXX XXX XXX XXX XXX XXX XXX XXX XXX
SCHEDULE P - PART 4F - SECTION 2 - MEDICAL MALPRACTICE - CLAIMS-MADE1. Prior 2. 1997 3. 1998 XXX4. 1999 XXX XXX5. 2000 XXX XXX XXX6. 2001 XXX XXX XXX XXX7. 2002 XXX XXX XXX XXX XXX8. 2003 XXX XXX XXX XXX XXX XXX9. 2004 XXX XXX XXX XXX XXX XXX XXX
10. 2005 XXX XXX XXX XXX XXX XXX XXX XXX11. 2006 XXX XXX XXX XXX XXX XXX XXX XXX XXX
SCHEDULE P - PART 4G - SPECIAL LIABILITY(OCEAN MARINE, AIRCRAFT (ALL PERILS), BOILER AND MACHINERY)
1. Prior 3,578 2,694 2. 1997 1,604 770 3. 1998 XXX 1,100 4. 1999 XXX XXX5. 2000 XXX XXX XXX6. 2001 XXX XXX XXX XXX7. 2002 XXX XXX XXX XXX XXX8. 2003 XXX XXX XXX XXX XXX XXX9. 2004 XXX XXX XXX XXX XXX XXX XXX
10. 2005 XXX XXX XXX XXX XXX XXX XXX XXX11. 2006 XXX XXX XXX XXX XXX XXX XXX XXX XXX
SCHEDULE P - PART 4H - SECTION 1 - OTHER LIABILITY - OCCURRENCE1. Prior 304 254 2. 1997 504 355 3. 1998 XXX 703 4. 1999 XXX XXX5. 2000 XXX XXX XXX6. 2001 XXX XXX XXX XXX7. 2002 XXX XXX XXX XXX XXX8. 2003 XXX XXX XXX XXX XXX XXX9. 2004 XXX XXX XXX XXX XXX XXX XXX
10. 2005 XXX XXX XXX XXX XXX XXX XXX XXX11. 2006 XXX XXX XXX XXX XXX XXX XXX XXX XXX
SCHEDULE P - PART 4H - SECTION 2 - OTHER LIABILITY - CLAIMS-MADE1. Prior 2. 1997 3. 1998 XXX4. 1999 XXX XXX5. 2000 XXX XXX XXX6. 2001 XXX XXX XXX XXX7. 2002 XXX XXX XXX XXX XXX8. 2003 XXX XXX XXX XXX XXX XXX9. 2004 XXX XXX XXX XXX XXX XXX XXX
10. 2005 XXX XXX XXX XXX XXX XXX XXX XXX11. 2006 XXX XXX XXX XXX XXX XXX XXX XXX XXX
79
NONE
NONE

ANNUAL STATEMENT FOR THE YEAR 2006 OF THE NIC Insurance Company
SCHEDULE P - PART 4I - SPECIAL PROPERTY(FIRE, ALLIED LINES, INLAND MARINE, EARTHQUAKE, BURGLARY AND THEFT)
BULK AND IBNR RESERVES ON NET LOSSES AND DEFENSE AND COST CONTAINMENT EXPENSES REPORTED AT YEAR END ($000 OMITTED)Years in Which Losses Were
Incurred
1
1997
2
1998
3
1999
4
2000
5
2001
5
2002
7
2003
8
2004
9
2005
10
2006
1. Prior XXX XXX XXX XXX XXX XXX XXX
2. 2005 XXX XXX XXX XXX XXX XXX XXX XXX
3. 2006 XXX XXX XXX XXX XXX XXX XXX XXX XXX
SCHEDULE P - PART 4J - AUTO PHYSICAL DAMAGE1. Prior XXX XXX XXX XXX XXX XXX XXX
2. 2005 XXX XXX XXX XXX XXX XXX XXX XXX
3. 2006 XXX XXX XXX XXX XXX XXX XXX XXX XXX
SCHEDULE P - PART 4K - FIDELITY/SURETY1. Prior XXX XXX XXX XXX XXX XXX XXX
2. 2005 XXX XXX XXX XXX XXX XXX XXX XXX
3. 2006 XXX XXX XXX XXX XXX XXX XXX XXX XXX
SCHEDULE P - PART 4L - OTHER (INCLUDING CREDIT, ACCIDENT AND HEALTH)1. Prior XXX XXX XXX XXX XXX XXX XXX
2. 2005 XXX XXX XXX XXX XXX XXX XXX XXX
3. 2006 XXX XXX XXX XXX XXX XXX XXX XXX XXX
SCHEDULE P - PART 4M - INTERNATIONAL1. Prior
2. 1997
3. 1998 XXX
4. 1999 XXX XXX
5. 2000 XXX XXX XXX
6. 2001 XXX XXX XXX XXX
7. 2002 XXX XXX XXX XXX XXX
8. 2003 XXX XXX XXX XXX XXX XXX
9. 2004 XXX XXX XXX XXX XXX XXX XXX
10. 2005 XXX XXX XXX XXX XXX XXX XXX XXX
11. 2006 XXX XXX XXX XXX XXX XXX XXX XXX XXX
80
NONE
NONE

ANNUAL STATEMENT FOR THE YEAR 2006 OF THE NIC Insurance Company
SCHEDULE P - PART 4N - REINSURANCENonproportional Assumed Property
BULK AND IBNR RESERVES ON NET LOSSES AND DEFENSE AND COST CONTAINMENT EXPENSES REPORTED AT YEAR END ($000 OMITTED)Years in Which Losses Were
Incurred
1
1997
2
1998
3
1999
4
2000
5
2001
6
2002
7
2003
8
2004
9
2005
10
2006
1. Prior 189 69
2. 1997 108 22
3. 1998 XXX
4. 1999 XXX XXX
5. 2000 XXX XXX XXX
6. 2001 XXX XXX XXX XXX
7. 2002 XXX XXX XXX XXX XXX
8. 2003 XXX XXX XXX XXX XXX XXX
9. 2004 XXX XXX XXX XXX XXX XXX XXX
9. 2005 XXX XXX XXX XXX XXX XXX XXX XXX
11. 2006 XXX XXX XXX XXX XXX XXX XXX XXX XXX
SCHEDULE P - PART 4O - REINSURANCENonproportional Assumed Liability
1. Prior 91 39
2. 1997 35 11
3. 1998 XXX
4. 1999 XXX XXX
5. 2000 XXX XXX XXX
6. 2001 XXX XXX XXX XXX
7. 2002 XXX XXX XXX XXX XXX
8. 2003 XXX XXX XXX XXX XXX XXX
9. 2004 XXX XXX XXX XXX XXX XXX XXX
9. 2005 XXX XXX XXX XXX XXX XXX XXX XXX
11. 2006 XXX XXX XXX XXX XXX XXX XXX XXX XXX
SCHEDULE P - PART 4P - REINSURANCENonproportional Assumed Financial Lines
1. Prior 20 8
2. 1997 6
3. 1998 XXX
4. 1999 XXX XXX
5. 2000 XXX XXX XXX
6. 2001 XXX XXX XXX XXX
7. 2002 XXX XXX XXX XXX XXX
8. 2003 XXX XXX XXX XXX XXX XXX
9. 2004 XXX XXX XXX XXX XXX XXX XXX
9. 2005 XXX XXX XXX XXX XXX XXX XXX XXX
11. 2006 XXX XXX XXX XXX XXX XXX XXX XXX XXX
81

ANNUAL STATEMENT FOR THE YEAR 2006 OF THE NIC Insurance Company
Schedule P - Part 4R - Prod Liab Occur
NONESchedule P - Part 4R - Prod Liab Claims
NONESchedule P - Part 4S
NONESchedule P - Part 5A- SN1
NONESchedule P - Part 5A- SN2
NONESchedule P - Part 5A- SN3
NONESchedule P - Part 5B- SN1
NONESchedule P - Part 5B- SN2
NONESchedule P - Part 5B- SN3
NONESchedule P - Part 5C- SN1
NONESchedule P - Part 5C- SN2
NONE
82, 83, 84, 85

ANNUAL STATEMENT FOR THE YEAR 2006 OF THE NIC Insurance Company
Schedule P - Part 5C- SN3
NONESchedule P - Part 5D- SN1
NONESchedule P - Part 5D- SN2
NONESchedule P - Part 5D- SN3
NONE
85, 86

ANNUAL STATEMENT FOR THE YEAR 2006 OF THE NIC Insurance Company
SCHEDULE P - PART 5E - COMMERCIAL MULTIPLE PERILSECTION 1
CUMULATIVE NUMBER OF CLAIMS CLOSED WITH LOSS PAYMENT DIRECT AND ASSUMED AT YEAR ENDYears inWhich
PremiumsWere Earned and Losses
Were Incurred
1
1997
2
1998
3
1999
4
2000
5
2001
6
2002
7
2003
8
2004
9
2005
10
2006
1. Prior
2. 1997
3. 1998 XXX
4. 1999 XXX XXX
5. 2000 XXX XXX XXX
6. 2001 XXX XXX XXX XXX
7. 2002 XXX XXX XXX XXX XXX
8. 2003 XXX XXX XXX XXX XXX XXX
9. 2004 XXX XXX XXX XXX XXX XXX XXX
10. 2005 XXX XXX XXX XXX XXX XXX XXX XXX
11. 2006 XXX XXX XXX XXX XXX XXX XXX XXX XXX 6
SECTION 2NUMBER OF CLAIMS OUTSTANDING DIRECT AND ASSUMED AT YEAR END
Years inWhich
PremiumsWere Earned and Losses
Were Incurred
1
1997
2
1998
3
1999
4
2000
5
2001
6
2002
7
2003
8
2004
9
2005
10
2006
1. Prior
2. 1997
3. 1998 XXX
4. 1999 XXX XXX
5. 2000 XXX XXX XXX
6. 2001 XXX XXX XXX XXX
7. 2002 XXX XXX XXX XXX XXX
8. 2003 XXX XXX XXX XXX XXX XXX
9. 2004 XXX XXX XXX XXX XXX XXX XXX
10. 2005 XXX XXX XXX XXX XXX XXX XXX XXX 9
11. 2006 XXX XXX XXX XXX XXX XXX XXX XXX XXX 78
SECTION 3CUMULATIVE NUMBER OF CLAIMS REPORTED DIRECT AND ASSUMED AT YEAR END
Years inWhich
PremiumsWere Earned and Losses
Were Incurred
1
1997
2
1998
3
1999
4
2000
5
2001
6
2002
7
2003
8
2004
9
2005
10
2006
1. Prior
2. 1997
3. 1998 XXX
4. 1999 XXX XXX
5. 2000 XXX XXX XXX
6. 2001 XXX XXX XXX XXX
7. 2002 XXX XXX XXX XXX XXX
8. 2003 XXX XXX XXX XXX XXX XXX
9. 2004 XXX XXX XXX XXX XXX XXX XXX
10. 2005 XXX XXX XXX XXX XXX XXX XXX XXX 10
11. 2006 XXX XXX XXX XXX XXX XXX XXX XXX XXX 84
87
ANNUAL STATEMENT FOR THE YEAR 2006 OF THE NIC Insurance Company
Schedule P - Part 5F- SN1A
NONESchedule P - Part 5F- SN2A
NONESchedule P - Part 5F- SN3A
NONESchedule P - Part 5F- SN1B
NONESchedule P - Part 5F- SN2B
NONESchedule P - Part 5F- SN3B
NONE
88, 89

ANNUAL STATEMENT FOR THE YEAR 2006 OF THE NIC Insurance Company
SCHEDULE P - PART 5H - OTHER LIABILITY - OCCURRENCESECTION 1A
CUMULATIVE NUMBER OF CLAIMS CLOSED WITH LOSS PAYMENT DIRECT AND ASSUMED AT YEAR ENDYears inWhich
PremiumsWere Earned and Losses
Were Incurred
1
1997
2
1998
3
1999
4
2000
5
2001
6
2002
7
2003
8
2004
9
2005
10
2006
1. Prior 15 13 5 4
2. 1997 23 44 50 57 59
3. 1998 XXX 8 19 26 31 32
4. 1999 XXX XXX 28 41 48 53 57
5. 2000 XXX XXX XXX 22 52 70 78 81
6. 2001 XXX XXX XXX XXX 49 148 212 266 272
7. 2002 XXX XXX XXX XXX XXX 40 281 478 636 672
8. 2003 XXX XXX XXX XXX XXX XXX 84 351 545 593
9. 2004 XXX XXX XXX XXX XXX XXX XXX 157 384 453
10. 2005 XXX XXX XXX XXX XXX XXX XXX XXX 143 234
11. 2006 XXX XXX XXX XXX XXX XXX XXX XXX XXX 41
SECTION 2ANUMBER OF CLAIMS OUTSTANDING DIRECT AND ASSUMED AT YEAR END
Years inWhich
PremiumsWere Earned and Losses
Were Incurred
1
1997
2
1998
3
1999
4
2000
5
2001
6
2002
7
2003
8
2004
9
2005
10
2006
1. Prior 10 8 2 2 2
2. 1997 12 16 5 5 6
3. 1998 XXX 21 8 5 6 2
4. 1999 XXX XXX 40 8 5 7 5
5. 2000 XXX XXX XXX 26 19 9 9 11
6. 2001 XXX XXX XXX XXX 61 95 41 46 31
7. 2002 XXX XXX XXX XXX XXX 85 316 129 175 82
8. 2003 XXX XXX XXX XXX XXX XXX 189 154 238 114
9. 2004 XXX XXX XXX XXX XXX XXX XXX 213 319 174
10. 2005 XXX XXX XXX XXX XXX XXX XXX XXX 189 191
11. 2006 XXX XXX XXX XXX XXX XXX XXX XXX XXX 235
SECTION 3ACUMULATIVE NUMBER OF CLAIMS REPORTED DIRECT AND ASSUMED AT YEAR END
Years inWhich
PremiumsWere Earned and Losses
Were Incurred
1
1997
2
1998
3
1999
4
2000
5
2001
6
2002
7
2003
8
2004
9
2005
10
2006
1. Prior 33 18 (1) 9 2
2. 1997 59 99 94 105 111
3. 1998 XXX 38 40 44 52 54
4. 1999 XXX XXX 83 74 78 89 102
5. 2000 XXX XXX XXX 62 101 109 123 137
6. 2001 XXX XXX XXX XXX 140 317 327 418 441
7. 2002 XXX XXX XXX XXX XXX 142 737 747 1,036 1,083
8. 2003 XXX XXX XXX XXX XXX XXX 301 533 921 996
9. 2004 XXX XXX XXX XXX XXX XXX XXX 370 856 936
10. 2005 XXX XXX XXX XXX XXX XXX XXX XXX 533 857
11. 2006 XXX XXX XXX XXX XXX XXX XXX XXX XXX 366
90

ANNUAL STATEMENT FOR THE YEAR 2006 OF THE NIC Insurance Company
SCHEDULE P - PART 5H - OTHER LIABILITY - CLAIMS-MADESECTION 1B
CUMULATIVE NUMBER OF CLAIMS CLOSED WITH LOSS PAYMENT DIRECT AND ASSUMED AT YEAR ENDYears inWhich
PremiumsWere Earned and Losses
Were Incurred
1
1997
2
1998
3
1999
4
2000
5
2001
6
2002
7
2003
8
2004
9
2005
10
2006
1. Prior
2. 1997
3. 1998 XXX
4. 1999 XXX XXX
5. 2000 XXX XXX XXX
6. 2001 XXX XXX XXX XXX
7. 2002 XXX XXX XXX XXX XXX 13 13 13 13
8. 2003 XXX XXX XXX XXX XXX XXX 3 11 11 13
9. 2004 XXX XXX XXX XXX XXX XXX XXX 1 1 3
10. 2005 XXX XXX XXX XXX XXX XXX XXX XXX 5
11. 2006 XXX XXX XXX XXX XXX XXX XXX XXX XXX 5
SECTION 2BNUMBER OF CLAIMS OUTSTANDING DIRECT AND ASSUMED AT YEAR END
Years inWhich
PremiumsWere Earned and Losses
Were Incurred
1
1997
2
1998
3
1999
4
2000
5
2001
6
2002
7
2003
8
2004
9
2005
10
2006
1. Prior
2. 1997
3. 1998 XXX
4. 1999 XXX XXX
5. 2000 XXX XXX XXX
6. 2001 XXX XXX XXX XXX
7. 2002 XXX XXX XXX XXX XXX 2 1
8. 2003 XXX XXX XXX XXX XXX XXX 55 40 28 18
9. 2004 XXX XXX XXX XXX XXX XXX XXX 71 88 44
10. 2005 XXX XXX XXX XXX XXX XXX XXX XXX 118 71
11. 2006 XXX XXX XXX XXX XXX XXX XXX XXX XXX 162
SECTION 3BCUMULATIVE NUMBER OF CLAIMS REPORTED DIRECT AND ASSUMED AT YEAR END
Years inWhich
PremiumsWere Earned and Losses
Were Incurred
1
1997
2
1998
3
1999
4
2000
5
2001
6
2002
7
2003
8
2004
9
2005
10
2006
1. Prior
2. 1997
3. 1998 XXX
4. 1999 XXX XXX
5. 2000 XXX XXX XXX
6. 2001 XXX XXX XXX XXX
7. 2002 XXX XXX XXX XXX XXX 3 15 16 18 19
8. 2003 XXX XXX XXX XXX XXX XXX 72 70 59 67
9. 2004 XXX XXX XXX XXX XXX XXX XXX 76 105 93
10. 2005 XXX XXX XXX XXX XXX XXX XXX XXX 158 182
11. 2006 XXX XXX XXX XXX XXX XXX XXX XXX XXX 193
91
ANNUAL STATEMENT FOR THE YEAR 2006 OF THE NIC Insurance Company
Schedule P - Part 5R- SN1A
NONESchedule P - Part 5R- SN2A
NONESchedule P - Part 5R- SN3A
NONESchedule P - Part 5R- SN1B
NONESchedule P - Part 5R- SN2B
NONESchedule P - Part 5R- SN3B
NONE
92, 93

ANNUAL STATEMENT FOR THE YEAR 2006 OF THE NIC Insurance Company
SCHEDULE P - PART 6C - COMMERCIAL AUTO/TRUCK LIABILITY/MEDICALSECTION 1
CUMULATIVE PREMIUMS EARNED DIRECT AND ASSUMED AT YEAR END ($000 OMITTED) 11Years in Which Premiums Were
Earned and LossesWere Incurred
1
1997
2
1998
3
1999
4
2000
5
2001
6
2002
7
2003
8
2004
9
2005
10
2006
CurrentYear
PremiumsEarned
1. Prior 2. 1997 3. 1998 XXX4. 1999 XXX XXX5. 2000 XXX XXX XXX6. 2001 XXX XXX XXX XXX7. 2002 XXX XXX XXX XXX XXX8. 2003 XXX XXX XXX XXX XXX XXX9. 2004 XXX XXX XXX XXX XXX XXX XXX
10. 2005 XXX XXX XXX XXX XXX XXX XXX XXX11. 2006 XXX XXX XXX XXX XXX XXX XXX XXX XXX12. Total XXX XXX XXX XXX XXX XXX XXX XXX XXX XXX13. Earned
Premiums(Sch P, Part 1) XXX
SECTION 2CUMULATIVE PREMIUMS EARNED CEDED AT YEAR END ($000 OMITTED) 11
Years in Which Premiums Were
Earned and LossesWere Incurred
1
1997
2
1998
3
1999
4
2000
5
2001
6
2002
7
2003
8
2004
9
2005
10
2006
CurrentYear
PremiumsEarned
1. Prior 2. 1997 3. 1998 XXX4. 1999 XXX XXX5. 2000 XXX XXX XXX6. 2001 XXX XXX XXX XXX7. 2002 XXX XXX XXX XXX XXX8. 2003 XXX XXX XXX XXX XXX XXX9. 2004 XXX XXX XXX XXX XXX XXX XXX
10. 2005 XXX XXX XXX XXX XXX XXX XXX XXX11. 2006 XXX XXX XXX XXX XXX XXX XXX XXX XXX12. Total XXX XXX XXX XXX XXX XXX XXX XXX XXX XXX13. Earned
Premiums(Sch P, Part 1) XXX
SCHEDULE P - PART 6D - WORKERS' COMPENSATIONSECTION 1
CUMULATIVE PREMIUMS EARNED DIRECT AND ASSUMED AT YEAR END ($000 OMITTED) 11Years in Which Premiums Were
Earned and LossesWere Incurred
1
1997
2
1998
3
1999
4
2000
5
2001
6
2002
7
2003
8
2004
9
2005
10
2006
CurrentYear
PremiumsEarned
1. Prior 2. 1997 3. 1998 XXX4. 1999 XXX XXX5. 2000 XXX XXX XXX6. 2001 XXX XXX XXX XXX7. 2002 XXX XXX XXX XXX XXX8. 2003 XXX XXX XXX XXX XXX XXX9. 2004 XXX XXX XXX XXX XXX XXX XXX
10. 2005 XXX XXX XXX XXX XXX XXX XXX XXX11. 2006 XXX XXX XXX XXX XXX XXX XXX XXX XXX12. Total XXX XXX XXX XXX XXX XXX XXX XXX XXX XXX13. Earned
Premiums(Sch P, Part 1) XXX
SECTION 2CUMULATIVE PREMIUMS EARNED CEDED AT YEAR END ($000 OMITTED) 11
Years in Which Premiums Were
Earned and LossesWere Incurred
1
1997
2
1998
3
1999
4
2000
5
2001
6
2002
7
2003
8
2004
9
2005
10
2006
CurrentYear
PremiumsEarned
1. Prior 2. 1997 3. 1998 XXX4. 1999 XXX XXX5. 2000 XXX XXX XXX6. 2001 XXX XXX XXX XXX7. 2002 XXX XXX XXX XXX XXX8. 2003 XXX XXX XXX XXX XXX XXX9. 2004 XXX XXX XXX XXX XXX XXX XXX
10. 2005 XXX XXX XXX XXX XXX XXX XXX XXX11. 2006 XXX XXX XXX XXX XXX XXX XXX XXX XXX12. Total XXX XXX XXX XXX XXX XXX XXX XXX XXX XXX13. Earned
Premiums(Sch P, Part 1) XXX
94
NONE
NONE

ANNUAL STATEMENT FOR THE YEAR 2006 OF THE NIC Insurance Company
SCHEDULE P - PART 6E - COMMERCIAL MULTIPLE PERILSECTION 1
CUMULATIVE PREMIUMS EARNED DIRECT AND ASSUMED AT YEAR END ($000 OMITTED) 11Years in Which Premiums Were
Earned and LossesWere Incurred
1
1997
2
1998
3
1999
4
2000
5
2001
6
2002
7
2003
8
2004
9
2005
10
2006
CurrentYear
PremiumsEarned
1. Prior 118 2. 1997 353 354 354 354 354 354 354 354 354 354 3. 1998 XXX 710 710 710 710 710 710 710 710 710 4. 1999 XXX XXX5. 2000 XXX XXX XXX6. 2001 XXX XXX XXX XXX7. 2002 XXX XXX XXX XXX XXX8. 2003 XXX XXX XXX XXX XXX XXX9. 2004 XXX XXX XXX XXX XXX XXX XXX
10. 2005 XXX XXX XXX XXX XXX XXX XXX XXX11. 2006 XXX XXX XXX XXX XXX XXX XXX XXX XXX 7,749 7,749 12. Total XXX XXX XXX XXX XXX XXX XXX XXX XXX XXX 7,749 13. Earned
Premiums(Sch P, Part 1) 471 711 7,749 XXX
SECTION 2CUMULATIVE PREMIUMS EARNED CEDED AT YEAR END ($000 OMITTED) 11
Years in Which Premiums Were
Earned and LossesWere Incurred
1
1997
2
1998
3
1999
4
2000
5
2001
6
2002
7
2003
8
2004
9
2005
10
2006
CurrentYear
PremiumsEarned
1. Prior 2. 1997 445 445 445 445 445 445 445 445 445 445 3. 1998 XXX 631 631 631 631 631 631 631 631 631 4. 1999 XXX XXX5. 2000 XXX XXX XXX6. 2001 XXX XXX XXX XXX7. 2002 XXX XXX XXX XXX XXX8. 2003 XXX XXX XXX XXX XXX XXX9. 2004 XXX XXX XXX XXX XXX XXX XXX
10. 2005 XXX XXX XXX XXX XXX XXX XXX XXX11. 2006 XXX XXX XXX XXX XXX XXX XXX XXX XXX 7,749 7,749 12. Total XXX XXX XXX XXX XXX XXX XXX XXX XXX XXX 7,749 13. Earned
Premiums(Sch P, Part 1) 445 631 7,749 XXX
SCHEDULE P - PART 6H - OTHER LIABILITY - OCCURRENCESECTION 1A
CUMULATIVE PREMIUMS EARNED DIRECT AND ASSUMED AT YEAR END ($000 OMITTED) 11Years in Which Premiums Were
Earned and LossesWere Incurred
1
1997
2
1998
3
1999
4
2000
5
2001
6
2002
7
2003
8
2004
9
2005
10
2006
CurrentYear
PremiumsEarned
1. Prior 444 2. 1997 1,334 1,334 1,334 1,334 1,334 1,334 1,334 1,334 1,334 1,334 3. 1998 XXX 1,712 1,712 1,712 1,712 1,712 1,712 1,712 1,712 1,712 4. 1999 XXX XXX 2,651 2,651 2,689 2,680 2,680 2,680 2,680 2,680 5. 2000 XXX XXX XXX 3,224 3,356 3,361 3,362 3,369 3,359 3,359 6. 2001 XXX XXX XXX XXX 8,493 8,963 9,101 9,081 9,070 9,070 7. 2002 XXX XXX XXX XXX XXX 35,454 36,336 36,760 36,735 36,739 4 8. 2003 XXX XXX XXX XXX XXX XXX 74,701 76,038 76,878 76,927 49 9. 2004 XXX XXX XXX XXX XXX XXX XXX 107,764 110,569 112,659 2,090
10. 2005 XXX XXX XXX XXX XXX XXX XXX XXX 128,374 129,814 1,440 11. 2006 XXX XXX XXX XXX XXX XXX XXX XXX XXX 164,677 164,677 12. Total XXX XXX XXX XXX XXX XXX XXX XXX XXX XXX 168,260 13. Earned
Premiums(Sch P, Part 1) 1,778 1,712 2,651 3,224 8,663 35,920 75,722 109,512 131,973 168,260 XXX
SECTION 2ACUMULATIVE PREMIUMS EARNED CEDED AT YEAR END ($000 OMITTED) 11
Years in Which Premiums Were
Earned and LossesWere Incurred
1
1997
2
1998
3
1999
4
2000
5
2001
6
2002
7
2003
8
2004
9
2005
10
2006
CurrentYear
PremiumsEarned
1. Prior 2. 1997 730 730 730 730 730 730 730 730 730 730 3. 1998 XXX 436 436 436 436 436 436 436 436 436 4. 1999 XXX XXX 2,651 2,651 2,689 2,680 2,680 2,680 2,680 2,680 5. 2000 XXX XXX XXX 3,224 3,356 3,361 3,362 3,369 3,359 3,359 6. 2001 XXX XXX XXX XXX 8,493 8,963 9,101 9,081 9,070 9,070 7. 2002 XXX XXX XXX XXX XXX 35,454 36,336 36,760 36,735 36,739 4 8. 2003 XXX XXX XXX XXX XXX XXX 74,701 76,038 76,878 76,927 49 9. 2004 XXX XXX XXX XXX XXX XXX XXX 107,764 110,569 112,659 2,090
10. 2005 XXX XXX XXX XXX XXX XXX XXX XXX 128,374 129,814 1,440 11. 2006 XXX XXX XXX XXX XXX XXX XXX XXX XXX 164,677 164,677 12. Total XXX XXX XXX XXX XXX XXX XXX XXX XXX XXX 168,260 13. Earned
Premiums(Sch P, Part 1) 730 436 2,651 3,224 8,663 35,920 75,722 109,512 131,973 168,260 XXX
95

ANNUAL STATEMENT FOR THE YEAR 2006 OF THE NIC Insurance Company
SCHEDULE P - PART 6H - OTHER LIABILITY - CLAIMS-MADESECTION 1B
CUMULATIVE PREMIUMS EARNED DIRECT AND ASSUMED AT YEAR END ($000 OMITTED) 11Years in Which Premiums Were
Earned and LossesWere Incurred
1
1997
2
1998
3
1999
4
2000
5
2001
6
2002
7
2003
8
2004
9
2005
10
2006
CurrentYear
PremiumsEarned
1. Prior 2. 1997 3. 1998 XXX4. 1999 XXX XXX5. 2000 XXX XXX XXX6. 2001 XXX XXX XXX XXX 22 22 22 23 23 23 7. 2002 XXX XXX XXX XXX XXX 7,073 7,681 7,707 7,707 7,707 8. 2003 XXX XXX XXX XXX XXX XXX 19,291 19,237 19,257 19,257 9. 2004 XXX XXX XXX XXX XXX XXX XXX 26,097 26,084 26,105 21
10. 2005 XXX XXX XXX XXX XXX XXX XXX XXX 26,348 26,403 55 11. 2006 XXX XXX XXX XXX XXX XXX XXX XXX XXX 24,566 24,566 12. Total XXX XXX XXX XXX XXX XXX XXX XXX XXX XXX 24,642 13. Earned
Premiums(Sch P, Part 1) 22 7,073 19,899 26,070 26,355 24,642 XXX
SECTION 2BCUMULATIVE PREMIUMS EARNED CEDED AT YEAR END ($000 OMITTED) 11
Years in Which Premiums Were
Earned and LossesWere Incurred
1
1997
2
1998
3
1999
4
2000
5
2001
6
2002
7
2003
8
2004
9
2005
10
2006
CurrentYear
PremiumsEarned
1. Prior 2. 1997 3. 1998 XXX4. 1999 XXX XXX5. 2000 XXX XXX XXX6. 2001 XXX XXX XXX XXX 22 22 22 23 23 23 7. 2002 XXX XXX XXX XXX XXX 7,073 7,681 7,707 7,707 7,707 8. 2003 XXX XXX XXX XXX XXX XXX 19,291 19,237 19,257 19,257 9. 2004 XXX XXX XXX XXX XXX XXX XXX 26,097 26,084 26,105 21
10. 2005 XXX XXX XXX XXX XXX XXX XXX XXX 26,348 26,403 55 11. 2006 XXX XXX XXX XXX XXX XXX XXX XXX XXX 24,566 24,566 12. Total XXX XXX XXX XXX XXX XXX XXX XXX XXX XXX 24,642 13. Earned
Premiums(Sch P, Part 1) 22 7,073 19,899 26,070 26,355 24,642 XXX
SCHEDULE P - PART 6M - INTERNATIONALSECTION 1
CUMULATIVE PREMIUMS EARNED DIRECT AND ASSUMED AT YEAR END ($000 OMITTED) 11Years in Which Premiums Were
Earned and LossesWere Incurred
1
1997
2
1998
3
1999
4
2000
5
2001
6
2002
7
2003
8
2004
9
2005
10
2006
CurrentYear
PremiumsEarned
1. Prior 2. 1997 3. 1998 XXX4. 1999 XXX XXX5. 2000 XXX XXX XXX6. 2001 XXX XXX XXX XXX7. 2002 XXX XXX XXX XXX XXX8. 2003 XXX XXX XXX XXX XXX XXX9. 2004 XXX XXX XXX XXX XXX XXX XXX
10. 2005 XXX XXX XXX XXX XXX XXX XXX XXX11. 2006 XXX XXX XXX XXX XXX XXX XXX XXX XXX12. Total XXX XXX XXX XXX XXX XXX XXX XXX XXX XXX13. Earned
Premiums(Sch P, Part 1) XXX
SECTION 2CUMULATIVE PREMIUMS EARNED CEDED AT YEAR END ($000 OMITTED) 11
Years in Which Premiums Were
Earned and LossesWere Incurred
1
1997
2
1998
3
1999
4
2000
5
2001
6
2002
7
2003
8
2004
9
2005
10
2006
CurrentYear
PremiumsEarned
1. Prior 2. 1997 3. 1998 XXX4. 1999 XXX XXX5. 2000 XXX XXX XXX6. 2001 XXX XXX XXX XXX7. 2002 XXX XXX XXX XXX XXX8. 2003 XXX XXX XXX XXX XXX XXX9. 2004 XXX XXX XXX XXX XXX XXX XXX
10. 2005 XXX XXX XXX XXX XXX XXX XXX XXX11. 2006 XXX XXX XXX XXX XXX XXX XXX XXX XXX12. Total XXX XXX XXX XXX XXX XXX XXX XXX XXX XXX13. Earned
Premiums(Sch P, Part 1) XXX
96
NONE
NONE
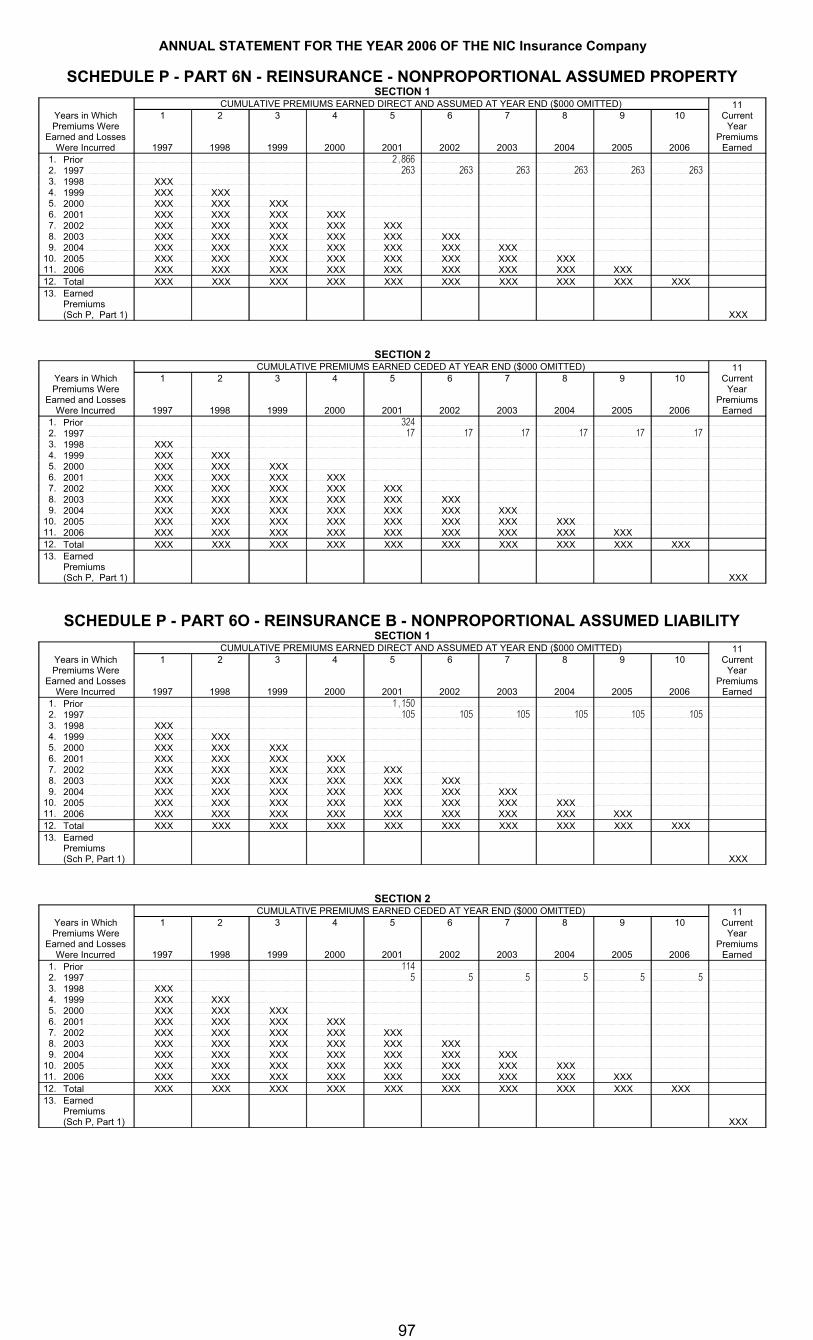
ANNUAL STATEMENT FOR THE YEAR 2006 OF THE NIC Insurance Company
SCHEDULE P - PART 6N - REINSURANCE - NONPROPORTIONAL ASSUMED PROPERTYSECTION 1
CUMULATIVE PREMIUMS EARNED DIRECT AND ASSUMED AT YEAR END ($000 OMITTED) 11Years in Which Premiums Were
Earned and LossesWere Incurred
1
1997
2
1998
3
1999
4
2000
5
2001
6
2002
7
2003
8
2004
9
2005
10
2006
CurrentYear
PremiumsEarned
1. Prior 2,866 2. 1997 263 263 263 263 263 263 3. 1998 XXX4. 1999 XXX XXX5. 2000 XXX XXX XXX6. 2001 XXX XXX XXX XXX7. 2002 XXX XXX XXX XXX XXX8. 2003 XXX XXX XXX XXX XXX XXX9. 2004 XXX XXX XXX XXX XXX XXX XXX
10. 2005 XXX XXX XXX XXX XXX XXX XXX XXX11. 2006 XXX XXX XXX XXX XXX XXX XXX XXX XXX12. Total XXX XXX XXX XXX XXX XXX XXX XXX XXX XXX13. Earned
Premiums(Sch P, Part 1) XXX
SECTION 2CUMULATIVE PREMIUMS EARNED CEDED AT YEAR END ($000 OMITTED) 11
Years in Which Premiums Were
Earned and LossesWere Incurred
1
1997
2
1998
3
1999
4
2000
5
2001
6
2002
7
2003
8
2004
9
2005
10
2006
CurrentYear
PremiumsEarned
1. Prior 324 2. 1997 17 17 17 17 17 17 3. 1998 XXX4. 1999 XXX XXX5. 2000 XXX XXX XXX6. 2001 XXX XXX XXX XXX7. 2002 XXX XXX XXX XXX XXX8. 2003 XXX XXX XXX XXX XXX XXX9. 2004 XXX XXX XXX XXX XXX XXX XXX
10. 2005 XXX XXX XXX XXX XXX XXX XXX XXX11. 2006 XXX XXX XXX XXX XXX XXX XXX XXX XXX12. Total XXX XXX XXX XXX XXX XXX XXX XXX XXX XXX13. Earned
Premiums(Sch P, Part 1) XXX
SCHEDULE P - PART 6O - REINSURANCE B - NONPROPORTIONAL ASSUMED LIABILITYSECTION 1
CUMULATIVE PREMIUMS EARNED DIRECT AND ASSUMED AT YEAR END ($000 OMITTED) 11Years in Which Premiums Were
Earned and LossesWere Incurred
1
1997
2
1998
3
1999
4
2000
5
2001
6
2002
7
2003
8
2004
9
2005
10
2006
CurrentYear
PremiumsEarned
1. Prior 1,150 2. 1997 105 105 105 105 105 105 3. 1998 XXX4. 1999 XXX XXX5. 2000 XXX XXX XXX6. 2001 XXX XXX XXX XXX7. 2002 XXX XXX XXX XXX XXX8. 2003 XXX XXX XXX XXX XXX XXX9. 2004 XXX XXX XXX XXX XXX XXX XXX
10. 2005 XXX XXX XXX XXX XXX XXX XXX XXX11. 2006 XXX XXX XXX XXX XXX XXX XXX XXX XXX12. Total XXX XXX XXX XXX XXX XXX XXX XXX XXX XXX13. Earned
Premiums(Sch P, Part 1) XXX
SECTION 2CUMULATIVE PREMIUMS EARNED CEDED AT YEAR END ($000 OMITTED) 11
Years in Which Premiums Were
Earned and LossesWere Incurred
1
1997
2
1998
3
1999
4
2000
5
2001
6
2002
7
2003
8
2004
9
2005
10
2006
CurrentYear
PremiumsEarned
1. Prior 114 2. 1997 5 5 5 5 5 5 3. 1998 XXX4. 1999 XXX XXX5. 2000 XXX XXX XXX6. 2001 XXX XXX XXX XXX7. 2002 XXX XXX XXX XXX XXX8. 2003 XXX XXX XXX XXX XXX XXX9. 2004 XXX XXX XXX XXX XXX XXX XXX
10. 2005 XXX XXX XXX XXX XXX XXX XXX XXX11. 2006 XXX XXX XXX XXX XXX XXX XXX XXX XXX12. Total XXX XXX XXX XXX XXX XXX XXX XXX XXX XXX13. Earned
Premiums(Sch P, Part 1) XXX
97

ANNUAL STATEMENT FOR THE YEAR 2006 OF THE NIC Insurance Company
Schedule P - Part 6R - SN1A
NONESchedule P - Part 6R - SN2A
NONESchedule P - Part 6R - SN1B
NONESchedule P - Part 6R - SN2B
NONESchedule P - Part 7A - Section 1
NONESchedule P - Part 7A - Section 2
NONESchedule P - Part 7A - Section 3
NONESchedule P - Part 7A - Section 4
NONESchedule P - Part 7A - Section 5
NONESchedule P - Part 7B - Section 1
NONESchedule P - Part 7B - Section 2
NONE
98, 99, 100, 101
ANNUAL STATEMENT FOR THE YEAR 2006 OF THE NIC Insurance Company
Schedule P - Part 7B - Section 3
NONESchedule P - Part 7B - Section 4
NONESchedule P - Part 7B - Section 5
NONESchedule P - Part 7B - Section 6
NONESchedule P - Part 7B - Section 7
NONE
101, 102

ANNUAL STATEMENT FOR THE YEAR 2006 OF THE NIC Insurance Company
SCHEDULE P INTERROGATORIES1. What is the extended loss and expense reserve - direct and assumed - for the following classes? An example of an extended loss and expense reserve is the actuarial
reserve for the free-tail coverage arising upon death, disability or retirement in most medical malpractice policies. Such a liability is to be reported here even if it was not reported elsewhere in Schedule P, but otherwise reported as a liability item on Page 3. Show the full reserve amount, not just the change during the current year.
Years in which premiums were earnedand losses were incurred
1Medical Malpractice
2Other Liability
3Products Liability
1.01 Prior 1.02 19971.03 19981.04 19991.05 20001.06 20011.07 20021.08 2003 1.09 20041.10 2005 1.11 20061.12 Totals
2. The definition of allocated loss adjustment expenses (ALAE) and, therefore, unallocated loss adjustment expenses (ULAE) was changed effective January 1, 1998. This change in definition applies to both paid and unpaid expenses. Are these expenses (now reported as “Defense and Cost Containment” and “Adjusting and Other”) reported in compliance with these definitions in this statement? Yes [ X ] No [ ]
3. The Adjusting and Other expense payments and reserves should be allocated to the years in which the losses were incurred based on the number of claims reported, closed and outstanding in those years. When allocating Adjusting and Other expense between companies in a group or a pool, the Adjusting and Other expense should be allocated in the same percentage used for the loss amounts and the claim counts. For reinsurers, Adjusting and Other expense assumed should be reported according to the reinsurance contract. For Adjusting and Other expense incurred by reinsurers, or in those situations where suitable claim count information is not available, Adjusting and Other expense should be allocated by a reasonable method determined by the company and described in Interrogatory 7, below. Are they so reported in this Statement? Answer: Yes [ X ] No [ ]
4. Do any lines in Schedule P include reserves that are reported gross of any discount to present value of future payments, and that are reported net of such discounts on Page 10? Yes [ ] No [ X ]
If Yes, proper disclosure must be made in the Notes to Financial Statements, as specified in the Instructions. Also, the discounts must be reported in Schedule P - Part 1, Columns 32 and 33.
Schedule P must be completed gross of non-tabular discounting. Work papers relating to discount calculations must be available for examination upon request.
Discounting is allowed only if expressly permitted by the state insurance department to which this Annual Statement is being filed.
5. What were the net premiums in force at the end of the year for:(in thousands of dollars)
5.1Fidelity
5.2Surety
6. Claim count information is reported per claim or per claimant (Indicate which) CLAIMIf not the same in all years, explain in Interrogatory 7.
7.1 The information provided in Schedule P will be used by many persons to estimate the adequacy of the current loss and expense reserves, among other things. Are there any especially significant events, coverage, retention or accounting changes that have occurred that must be considered when making such analyses? Yes [ X ] No [ ]
7.2 An extended statement may be attached.In 1999 the Company entered into a reinsurance agreement with Navigators Insurance Company, whereby all business written by the Company is ceded to Navigators Insurance Company.
103

ANNUAL STATEMENT FOR THE YEAR 2006 OF THE NIC Insurance Company
SCHEDULE T - EXHIBIT OF PREMIUMS WRITTENAllocated by States and Territories
1 Gross Premiums, IncludingPolicy and Membership FeesLess Return Premiums andPremiums on Policies Not
Taken
4
DividendsPaid
5 6 7 8
Finance and
9Direct
Premium Written for
Federal
States, etc.
IsInsurer
Licensed?(Yes or No)
2Direct
PremiumsWritten
3Direct
PremiumsEarned
or Credited to Policyholders
on Direct Business
Direct Losses Paid
(Deducting Salvage)
Direct Losses Incurred
Direct Losses Unpaid
Service Charges Not Included in Premiums
Purchasing Groups
(Included inCol. 2)
1. Alabama AL No 648,881 643,737 228,458 404,005 2. Alaska AK No 44,727 7,768 (21,213) 3,257 3. Arizona AZ No 7,632,332 5,166,879 499,963 2,557,399 3,653,356 4. Arkansas AR No 12,454 5,174 2,939 3,290 5. California CA No 154,630,936 144,371,442 16,162,490 52,477,884 216,401,757 6. Colorado CO No 2,563,868 1,194,173 132,500 517,914 667,440 7. Connecticut CT No 833,086 722,445 503,087 643,702 8. Delaware DE No 54,717 84,396 (45,669) 128,332 9. District of Columbia DC No 370,335 181,574 116,250 140,890 113,550
10. Florida FL No 6,366,168 6,118,634 767,379 4,037,637 4,445,423 11. Georgia GA No 1,416,559 1,741,267 11,500 948,769 1,635,503 12. Hawaii HI No 781,557 560,117 367,819 522,960 13. Idaho ID No 31,185 147,318 434,289 574,213 14. Illinois IL No 3,631,789 1,748,031 655,456 1,091,187 15. Indiana IN No 653,216 513,689 261,457 376,175 16. Iowa IA No 148,840 167,905 57,793 (65,358) 428,098 17. Kansas KS No 104,949 75,069 1,718 33,459 18. Kentucky KY No 371,710 301,348 1,510 130,432 263,524 19. Louisiana LA No 5,979,088 5,133,092 109,043 1,774,212 7,412,442 20. Maine ME No 67,736 52,954 33,661 45,870 21. Maryland MD No 1,033,154 494,969 97,400 380,202 22. Massachusetts MA No 1,263,474 880,868 200,000 423,120 929,490 23. Michigan MI No 705,494 1,542,279 23,510 483,776 1,490,397 24. Minnesota MN No 198,647 42,549 23,867 23,867 25. Mississippi MS No 48,813 15,633 9,491 11,384 26. Missouri MO No 732,947 309,238 187,876 245,175 27. Montana MT No 894,147 570,291 296,830 409,199 28. Nebraska NE No 126,951 78,551 46,372 75,673 29. Nevada NV No 9,459,464 5,860,785 123,778 1,803,942 3,271,853 30. New Hampshire NH No 218,007 160,777 121,637 183,327 31. New Jersey NJ No 3,858,823 2,746,996 (2,019) 1,654,084 2,551,939 32. New Mexico NM No33. New York NY Yes34. North Carolina NC No 910,485 914,751 3,289 411,108 939,295 35. North Dakota ND No 114,680 93,968 62,615 95,979 36. Ohio OH No 1,146,738 902,821 305,796 759,640 37. Oklahoma OK No 24,604 2,090 2,385 2,385 38. Oregon OR No 1,526,587 897,279 351,216 451,520 39. Pennsylvania PA No 2,346,467 1,928,111 18,587 1,683,904 2,057,064 40. Rhode Island RI No 183,364 180,408 123,343 147,178 41. South Carolina SC No 245,761 158,437 79,417 122,593 42. South Dakota SD No 159,844 128,472 41,535 107,756 43. Tennessee TN No 716,887 679,528 721 529,144 661,990 44. Texas TX No 9,560,098 5,868,706 78,370 3,045,327 4,342,008 45. Utah UT No 958,185 361,004 145,464 215,034 46. Vermont VT No 13,360 3,481 2,548 2,548 47. Virginia VA No 1,448,664 1,528,659 22,000 993,066 1,565,641 48. Washington WA No 6,367,338 4,856,123 2,710 1,837,164 2,939,397 49. West Virginia WV No 176,669 125,516 106,239 110,654 50. Wisconsin WI No 802,648 340,155 159,521 289,624 51. Wyoming WY No 98,083 73,518 81,473 160,810 52. American Samoa AS No53. Guam GU No54. Puerto Rico PR No55. U.S. Virgin Islands VI No56. Northern Mariana
Islands MP57. Canada CN No58. Aggregate other alien OT XXX 33,911 7,697 (763,862) 377,363 59. Totals (a) 1 231,718,424 200,690,672 18,329,374 79,287,577 263,768,526
DETAILS OF WRITE-INS5801. Alien(01) XXX 33,911 7,697 (763,862) 377,363 5802. XXX5803. XXX5898. Summary of remaining
write-ins for Line 58 from overflow page XXX
5899. Totals (Lines 5801 through 5803 + 5898) (Line 58 above) XXX 33,911 7,697 (763,862) 377,363
(a) Insert the number of yes responses except for Canada and Other Alien.
Explanation of basis of allocation of premiums by states, etc.
104

ANNUAL STATEMENT FOR THE YEAR 2006 OF THE NIC Insurance Company
SCHEDULE T – PART 2INTERSTATE COMPACT – EXHIBIT OF PREMIUMS WRITTEN
Allocated by States and TerritoriesDirect Business Only
States, Etc.
1
Life(Group andIndividual)
2
Annuities (Group and Individual)
3DisabilityIncome
(Group and Individual)
4
Long-Term Care(Group and Individual)
5
Deposit-TypeContracts
6
Totals1. Alabama AL 2. Alaska AK 3. Arizona AZ 4. Arkansas AR 5. California CA 6. Colorado CO 7. Connecticut CT 8. Delaware DE 9. District of Columbia DC
10. Florida FL 11. Georgia GA 12. Hawaii HI 13. Idaho ID 14. Illinois IL 15. Indiana IN 16. Iowa IA 17. Kansas KS 18. Kentucky KY 19. Louisiana LA 20. Maine ME 21. Maryland MD 22. Massachusetts MA 23. Michigan MI 24. Minnesota MN 25. Mississippi MS 26. Missouri MO 27. Montana MT 28. Nebraska NE 29. Nevada NV 30. New Hampshire NH 31. New Jersey NJ 32. New Mexico NM 33. New York NY 34. North Carolina NC 35. North Dakota ND 36. Ohio OH 37. Oklahoma OK 38. Oregon OR 39. Pennsylvania PA 40. Rhode Island RI 41. South Carolina SC 42. South Dakota SD 43. Tennessee TN 44. Texas TX 45. Utah UT 46. Vermont VT 47. Virginia VA 48. Washington WA 49. West Virginia WV 50. Wisconsin WI 51. Wyoming WY 52. American Samoa AS 53. Guam GU 54. Puerto Rico PR 55. U.S. Virgin Islands VI 56. Northern Mariana Islands MP 57. Canada CN 58. Aggregate Other Alien OT 59. Totals
105
NONE

ANNUAL STATEMENT FOR THE YEAR 2006 OF THE NIC Insurance Company
SCHEDULE Y - INFORMATION CONCERNING ACTIVITIES OF INSURER MEMBERS OF A HOLDING COMPANY GROUPPART 1 - ORGANIZATIONAL CHART
20%80%
13-3138397
4230713-3138390 13-2771091
75-230469236056
13-3536448 (Effective January 4, 2007, name changed to: 76-0657371 Navigators Specialty Insurance Company
94-3105355
91-1375993
Note: All direct and indirect subsidiaries of The Navigators Group, Inc. are 100% owned.
Navigators Insurance Services of Washington, Inc.
(California Corporation)
(United Kingdom Corporation)
Navigators Underwriting Ltd.Millennium Underwriting Ltd.
Navigators Corporate Underwriters Ltd.(United Kingdom Corporation)
(United Kingdom Corporation)(United Kingdom Corporation)Navigators California Insurance Services, Inc.
Navigators Management Company, Inc.(New York Corporation)
(Texas Corporation)Navigators Special Risk, Inc.
NIC Insurance Company
Navigators Holdings (UK) Ltd.(United Kingdom Corporation)
Navigators Underwriting Agency Ltd.(United Kingdom Corporation)
(New York Corporation)
Navigators Insurance Services of Texas, Inc.(Texas Corporation)
Public Stockholders
Navigators Insurance Company
Navigators Insurance Company
(New York Corporation)
United Kingdom Branch
Terence N. Deeksand Family The Navigators Group, Inc.
(Delaware Corporation)
(Washington Corporation)
Navigators Management (UK) Ltd.
Navigators N.V.(Belgian Corporation)
106

ANNUAL STATEMENT FOR THE YEAR 2006 OF THE NIC Insurance Company
SCHEDULE Y PART 2 - SUMMARY OF INSURER’S TRANSACTIONS WITH ANY AFFILIATES
1
NAIC Company
Code
2
Federal ID Number
3
Names of Insurers and Parent, Subsidiaries or Affiliates
4
ShareholderDividends
5
CapitalContributions
6
Purchases, Sales orExchanges of
Loans, Securities,Real
Estate, MortgageLoans or Other
Investments
7Income/
(Disbursements)Incurred in
Connection withGuarantees or
Undertakings for the
Benefit of anyAffiliate(s)
8
Management Agreements and Service Contracts
9
Income/ (Disbursements) Incurred Under Reinsurance Agreements
10
*
11
Any Other Material Activity Not in the
Ordinary Course ofthe Insurer’s
Business
12
Totals
13
Reinsurance Recoverable/(Payable) on
Losses and/or ReserveCredit
Taken/(Liability)42307 13-3138390 Navigators Insurance Company 100,000,000 (55,949,180) 44,050,820 (393,554,543)36056 13-3536448 NIC Insurance Company 393,554,543 00510 13-3138397 The Navigators Group, Inc. (100,000,000) (100,000,000)
13-2771091 Navigators Management Company, Inc. 19,113,963 19,113,963 75-2304692 Navigators Insurance Services of Texas, Inc. 2,617,946 2,617,946 91-1375993 Navigators Insurance Services of Washington, Inc. 2,209,121 2,209,121 94-3105355 Navigators California Insurance Services, Inc. 21,309,787 21,309,787
Navigators Management (U.K.) Limited 10,698,363 10,698,363
9999999 Control Totals XXX
107

ANNUAL STATEMENT FOR THE YEAR 2006 OF THE NIC Insurance Company
SUPPLEMENTAL EXHIBITS AND SCHEDULES INTERROGATORIES
The following supplemental reports are required to be filed as part of your statement filing unless specifically waived by the domiciliary state. However, in the event that your domiciliary state waives the filing requirement, your response of WAIVED to the specific interrogatory will be accepted in lieu of filing a "NONE" report and a bar code will be printed below. If the supplement is required of your company but is not being filed for whatever reason enter SEE EXPLANATION and provide an explanation following the interrogatory questions.
MARCH FILING RESPONSES1. Will an actuarial opinion be filed by March 1? YES
2. Will the Supplemental Compensation Exhibit be filed with the state of domicile by March 1? YES
3. Will the Risk-based Capital Report be filed with the NAIC by March 1? YES
4. Will the Risk-based Capital Report be filed with the state of domicile, if required, by March 1? YES
5. Will the Reinsurance Attestation Supplement be filed with the state of domicile and the NAIC by March 1? YES
APRIL FILING6. Will the Insurance Expense Exhibit be filed with the state of domicile and the NAIC by April 1? YES
7. Will Management’s Discussion and Analysis be filed by April 1? YES
8. Will the Supplemental Investment Risk Interrogatories be filed by April 1? YES
MAY FILING9. Will this company be included in a combined annual statement which is filed with the NAIC by May 1? YES
JUNE FILING10. Will an audited financial report be filed by June 1? YES
The following supplemental reports are required to be filed as part of your statement filing. However, in the event that your company does not transact the type of business for which the special report must be filed, your response of NO to the specific interrogatory will be accepted in lieu of filing a "NONE" report and a bar code will be printed below. If the supplement is required of your company but is not being filed for whatever reason enter SEE EXPLANATION and provide an explanation following the interrogatory questions.
MARCH FILING11. Will Schedule SIS (Stockholder Information Supplement) be filed with the state of domicile by March 1? NO
12. Will the Financial Guaranty Insurance Exhibit be filed March 1? NO
13. Will the Medicare Supplement Insurance Experience Exhibit be filed with the state of domicile and the NAIC by March 1? NO
14. Will Supplement A to Schedule T (Medical Malpractice Supplement) be filed by March 1? NO
15. Will the Trusteed Surplus Statement be filed with the state of domicile and the NAIC by March 1? NO
16. Will the Premiums Attributed to Protected Cells Exhibit be filed by March 1? NO
17. Will the Reinsurance Summary Supplemental Filing for General Interrogatory 9 be filed with the state of domicile and the NAIC by March 1? NO
18. Will the Medicare Part D Coverage Supplement be filed with the state of domicile and the NAIC by March 1? NO
19. Will the Actuarial Opinion Summary be filed with the state of domicile, if required by March 15 (or the date otherwise specified)? YES
APRIL FILING20. Will the Credit Insurance Experience Exhibit be filed with the state of domicile and the NAIC by April 1? NO
21. Will the Long-term Care Experience Reporting Forms be filed with the state of domicile and the NAIC by April 1? NO
22. Will the Accident and Health Policy Experience Exhibit be filed by April 1? NO
Explanation:
11.
12.
13.
14.
108

ANNUAL STATEMENT FOR THE YEAR 2006 OF THE NIC Insurance Company
SUPPLEMENTAL EXHIBITS AND SCHEDULES INTERROGATORIES
15.
16.
17.
18.
20.
21.
22.
Bar Code:
11.*36056200642000000*
12.*36056200624000000*
13.*36056200636059000*
14.*36056200645000000*
15.*36056200649000000*
16.*36056200638500000*
17.*36056200640100000*
18.*36056200636559000*
20.*36056200623059000*
21.*36056200633059000*
22.*36056200621000000*
108.1

ANNUAL STATEMENT FOR THE YEAR 2006 OF THE NIC Insurance Company
Schedule A - Part 1
NONESchedule A - Part 2
NONESchedule A - Part 3
NONESchedule B - Part 1
NONESchedule B - Part 2
NONESchedule BA - Part 1
NONESchedule BA - Part 2
NONE
E01, E02, E03, E04, E05, E06, E07
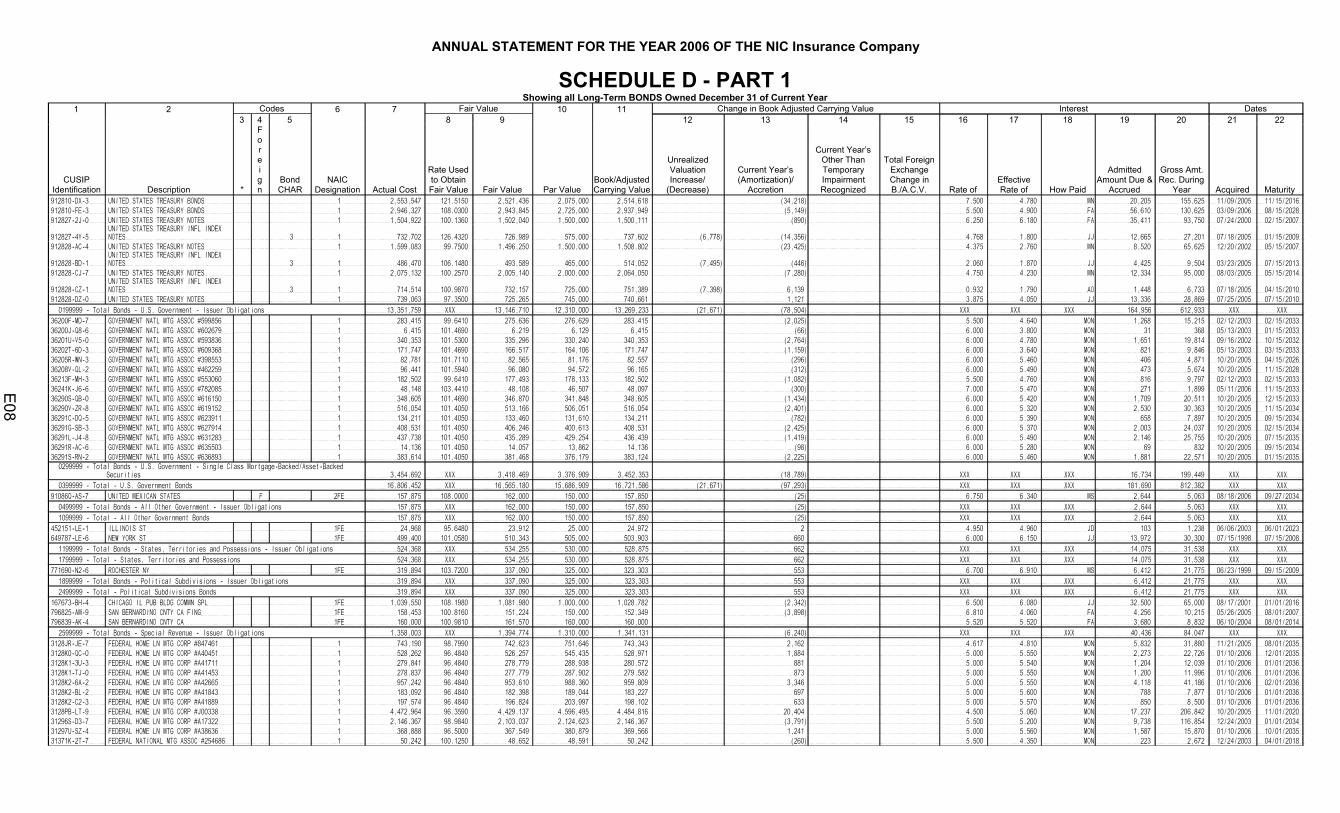
ANNUAL STATEMENT FOR THE YEAR 2006 OF THE NIC Insurance Company
SCHEDULE D - PART 1Showing all Long-Term BONDS Owned December 31 of Current Year
1 2 Codes 6 7 Fair Value 10 11 Change in Book Adjusted Carrying Value Interest Dates3 4 5 8 9 12 13 14 15 16 17 18 19 20 21 22
CUSIPIdentification Description *
Foreign
BondCHAR
NAIC Designation Actual Cost
Rate Used to Obtain Fair Value Fair Value Par Value
Book/Adjusted Carrying Value
Unrealized Valuation Increase/
(Decrease)
Current Year’s (Amortization)/
Accretion
Current Year’s Other Than Temporary Impairment Recognized
Total Foreign Exchange Change in B./A.C.V. Rate of
Effective Rate of How Paid
Admitted Amount Due &
Accrued
Gross Amt. Rec. During
Year Acquired Maturity912810-DX-3 UNITED STATES TREASURY BONDS 1 2,553,547 121.5150 2,521,436 2,075,000 2,514,618 (34,218) 7.500 4.780 MN 20,205 155,625 11/09/2005 11/15/2016912810-FE-3 UNITED STATES TREASURY BONDS 1 2,946,327 108.0300 2,943,845 2,725,000 2,937,949 (5,149) 5.500 4.900 FA 56,610 130,625 03/09/2006 08/15/2028912827-2J-0 UNITED STATES TREASURY NOTES 1 1,504,922 100.1360 1,502,040 1,500,000 1,500,111 (890) 6.250 6.180 FA 35,411 93,750 07/24/2000 02/15/2007
912827-4Y-5UNITED STATES TREASURY INFL INDEX NOTES 3 1 732,702 126.4320 726,989 575,000 737,602 (6,778) (14,356) 4.768 1.800 JJ 12,665 27,201 07/18/2005 01/15/2009
912828-AC-4 UNITED STATES TREASURY NOTES 1 1,599,083 99.7500 1,496,250 1,500,000 1,508,802 (23,425) 4.375 2.760 MN 8,520 65,625 12/20/2002 05/15/2007
912828-BD-1UNITED STATES TREASURY INFL INDEX NOTES 3 1 486,470 106.1480 493,589 465,000 514,052 (7,495) (446) 2.060 1.870 JJ 4,425 9,504 03/23/2005 07/15/2013
912828-CJ-7 UNITED STATES TREASURY NOTES 1 2,075,132 100.2570 2,005,140 2,000,000 2,064,050 (7,280) 4.750 4.230 MN 12,334 95,000 08/03/2005 05/15/2014
912828-CZ-1UNITED STATES TREASURY INFL INDEX NOTES 3 1 714,514 100.9870 732,157 725,000 751,389 (7,398) 6,139 0.932 1.790 AO 1,448 6,733 07/18/2005 04/15/2010
912828-DZ-0 UNITED STATES TREASURY NOTES 1 739,063 97.3500 725,265 745,000 740,661 1,121 3.875 4.050 JJ 13,336 28,869 07/25/2005 07/15/2010
0199999 - Total Bonds - U.S. Government - Issuer Obligations 13,351,759 XXX 13,146,710 12,310,000 13,269,233 (21,671) (78,504) XXX XXX XXX 164,956 612,933 XXX XXX
36200F-MD-7 GOVERNMENT NATL MTG ASSOC #599856 1 283,415 99.6410 275,636 276,629 283,415 (2,025) 5.500 4.640 MON 1,268 15,215 02/12/2003 02/15/203336200J-Q8-6 GOVERNMENT NATL MTG ASSOC #602679 1 6,415 101.4690 6,219 6,129 6,415 (66) 6.000 3.800 MON 31 368 05/13/2003 01/15/203336201U-V5-0 GOVERNMENT NATL MTG ASSOC #593836 1 340,353 101.5300 335,296 330,240 340,353 (2,764) 6.000 4.780 MON 1,651 19,814 09/16/2002 10/15/203236202T-6D-3 GOVERNMENT NATL MTG ASSOC #609368 1 171,747 101.4690 166,517 164,106 171,747 (1,159) 6.000 3.640 MON 821 9,846 05/13/2003 03/15/203336205R-WN-3 GOVERNMENT NATL MTG ASSOC #398553 1 82,781 101.7110 82,565 81,176 82,557 (296) 6.000 5.460 MON 406 4,871 10/20/2005 04/15/202636208V-QL-2 GOVERNMENT NATL MTG ASSOC #462259 1 96,441 101.5940 96,080 94,572 96,165 (312) 6.000 5.490 MON 473 5,674 10/20/2005 11/15/202836213F-MH-3 GOVERNMENT NATL MTG ASSOC #553060 1 182,502 99.6410 177,493 178,133 182,502 (1,082) 5.500 4.760 MON 816 9,797 02/12/2003 02/15/203336241K-J6-6 GOVERNMENT NATL MTG ASSOC #782085 1 48,148 103.4410 48,108 46,507 48,097 (300) 7.000 5.470 MON 271 1,899 05/11/2006 11/15/203336290S-QB-0 GOVERNMENT NATL MTG ASSOC #616150 1 348,605 101.4690 346,870 341,848 348,605 (1,434) 6.000 5.420 MON 1,709 20,511 10/20/2005 12/15/203336290V-ZR-8 GOVERNMENT NATL MTG ASSOC #619152 1 516,054 101.4050 513,166 506,051 516,054 (2,401) 6.000 5.320 MON 2,530 30,363 10/20/2005 11/15/203436291C-DQ-5 GOVERNMENT NATL MTG ASSOC #623911 1 134,211 101.4050 133,460 131,610 134,211 (782) 6.000 5.390 MON 658 7,897 10/20/2005 09/15/203436291G-SB-3 GOVERNMENT NATL MTG ASSOC #627914 1 408,531 101.4050 406,246 400,613 408,531 (2,425) 6.000 5.370 MON 2,003 24,037 10/20/2005 02/15/203436291L-J4-8 GOVERNMENT NATL MTG ASSOC #631283 1 437,738 101.4050 435,289 429,254 436,439 (1,419) 6.000 5.490 MON 2,146 25,755 10/20/2005 07/15/203536291R-AC-6 GOVERNMENT NATL MTG ASSOC #635503 1 14,136 101.4050 14,057 13,862 14,136 (98) 6.000 5.280 MON 69 832 10/20/2005 09/15/203436291S-RN-2 GOVERNMENT NATL MTG ASSOC #636893 1 383,614 101.4050 381,468 376,179 383,124 (2,225) 6.000 5.460 MON 1,881 22,571 10/20/2005 01/15/2035
0299999 - Total Bonds - U.S. Government - Single Class Mortgage-Backed/Asset-Backed Securities 3,454,692 XXX 3,418,469 3,376,909 3,452,353 (18,789) XXX XXX XXX 16,734 199,449 XXX XXX
0399999 - Total - U.S. Government Bonds 16,806,452 XXX 16,565,180 15,686,909 16,721,586 (21,671) (97,293) XXX XXX XXX 181,690 812,382 XXX XXX
91086Q-AS-7 UNITED MEXICAN STATES F 2FE 157,875 108.0000 162,000 150,000 157,850 (25) 6.750 6.340 MS 2,644 5,063 08/18/2006 09/27/2034
0499999 - Total Bonds - All Other Government - Issuer Obligations 157,875 XXX 162,000 150,000 157,850 (25) XXX XXX XXX 2,644 5,063 XXX XXX
1099999 - Total - All Other Government Bonds 157,875 XXX 162,000 150,000 157,850 (25) XXX XXX XXX 2,644 5,063 XXX XXX
452151-LE-1 ILLINOIS ST 1FE 24,968 95.6480 23,912 25,000 24,972 2 4.950 4.960 JD 103 1,238 06/06/2003 06/01/2023649787-LE-6 NEW YORK ST 1FE 499,400 101.0580 510,343 505,000 503,903 660 6.000 6.150 JJ 13,972 30,300 07/15/1998 07/15/2008
1199999 - Total Bonds - States, Territories and Possessions - Issuer Obligations 524,368 XXX 534,255 530,000 528,875 662 XXX XXX XXX 14,075 31,538 XXX XXX
1799999 - Total - States, Territories and Possessions 524,368 XXX 534,255 530,000 528,875 662 XXX XXX XXX 14,075 31,538 XXX XXX
771690-N2-6 ROCHESTER NY 1FE 319,894 103.7200 337,090 325,000 323,303 553 6.700 6.910 MS 6,412 21,775 06/23/1999 09/15/2009
1899999 - Total Bonds - Political Subdivisions - Issuer Obligations 319,894 XXX 337,090 325,000 323,303 553 XXX XXX XXX 6,412 21,775 XXX XXX
2499999 - Total - Political Subdivisions Bonds 319,894 XXX 337,090 325,000 323,303 553 XXX XXX XXX 6,412 21,775 XXX XXX
167673-BH-4 CHICAGO IL PUB BLDG COMMN SPL 1FE 1,039,550 108.1980 1,081,980 1,000,000 1,028,782 (2,342) 6.500 6.080 JJ 32,500 65,000 08/17/2001 01/01/2016796825-AM-9 SAN BERNARDINO CNTY CA FING 1FE 158,453 100.8160 151,224 150,000 152,349 (3,898) 6.810 4.060 FA 4,256 10,215 05/26/2005 08/01/2007796839-AK-4 SAN BERNARDINO CNTY CA 1FE 160,000 100.9810 161,570 160,000 160,000 5.520 5.520 FA 3,680 8,832 06/10/2004 08/01/2014
2599999 - Total Bonds - Special Revenue - Issuer Obligations 1,358,003 XXX 1,394,774 1,310,000 1,341,131 (6,240) XXX XXX XXX 40,436 84,047 XXX XXX
3128JR-JE-7 FEDERAL HOME LN MTG CORP #847461 1 743,190 98.7990 742,623 751,646 743,343 2,162 4.617 4.810 MON 5,832 31,880 11/21/2005 08/01/20353128K0-QC-0 FEDERAL HOME LN MTG CORP #A40451 1 528,262 96.4840 526,257 545,435 528,971 1,884 5.000 5.550 MON 2,273 22,726 01/10/2006 12/01/20353128K1-3U-3 FEDERAL HOME LN MTG CORP #A41711 1 279,841 96.4840 278,779 288,938 280,572 881 5.000 5.540 MON 1,204 12,039 01/10/2006 01/01/20363128K1-TJ-0 FEDERAL HOME LN MTG CORP #A41453 1 278,837 96.4840 277,779 287,902 279,582 873 5.000 5.550 MON 1,200 11,996 01/10/2006 01/01/20363128K2-6A-2 FEDERAL HOME LN MTG CORP #A42665 1 957,242 96.4840 953,610 988,360 959,809 3,346 5.000 5.550 MON 4,118 41,186 01/10/2006 02/01/20363128K2-BL-2 FEDERAL HOME LN MTG CORP #A41843 1 183,092 96.4840 182,398 189,044 183,227 697 5.000 5.600 MON 788 7,877 01/10/2006 01/01/20363128K2-C2-3 FEDERAL HOME LN MTG CORP #A41889 1 197,574 96.4840 196,824 203,997 198,102 633 5.000 5.570 MON 850 8,500 01/10/2006 01/01/20363128PB-LT-9 FEDERAL HOME LN MTG CORP #J00338 1 4,472,964 96.3590 4,429,137 4,596,495 4,484,816 20,404 4.500 5.060 MON 17,237 206,842 10/20/2005 11/01/202031296S-D3-7 FEDERAL HOME LN MTG CORP #A17322 1 2,146,367 98.9840 2,103,037 2,124,623 2,146,367 (3,791) 5.500 5.200 MON 9,738 116,854 12/24/2003 01/01/203431297U-SZ-4 FEDERAL HOME LN MTG CORP #A38636 1 368,888 96.5000 367,549 380,879 369,566 1,241 5.000 5.560 MON 1,587 15,870 01/10/2006 10/01/203531371K-2T-7 FEDERAL NATIONAL MTG ASSOC #254686 1 50,242 100.1250 48,652 48,591 50,242 (260) 5.500 4.350 MON 223 2,672 12/24/2003 04/01/2018
E08

ANNUAL STATEMENT FOR THE YEAR 2006 OF THE NIC Insurance Company
SCHEDULE D - PART 1Showing all Long-Term BONDS Owned December 31 of Current Year
1 2 Codes 6 7 Fair Value 10 11 Change in Book Adjusted Carrying Value Interest Dates3 4 5 8 9 12 13 14 15 16 17 18 19 20 21 22
CUSIPIdentification Description *
Foreign
BondCHAR
NAIC Designation Actual Cost
Rate Used to Obtain Fair Value Fair Value Par Value
Book/Adjusted Carrying Value
Unrealized Valuation Increase/
(Decrease)
Current Year’s (Amortization)/
Accretion
Current Year’s Other Than Temporary Impairment Recognized
Total Foreign Exchange Change in B./A.C.V. Rate of
Effective Rate of How Paid
Admitted Amount Due &
Accrued
Gross Amt. Rec. During
Year Acquired Maturity31371K-4F-5 FEDERAL NATIONAL MTG ASSOC #254722 1 51,795 100.1250 50,155 50,092 51,795 (248) 5.500 4.370 MON 230 2,755 12/24/2003 05/01/201831371L-SD-2 FEDERAL NATIONAL MTG ASSOC #255316 1 432,533 98.3910 429,229 436,248 432,644 674 5.000 5.130 MON 1,818 21,812 10/20/2005 07/01/201931371L-TP-4 FEDERAL NATIONAL MTG ASSOC #255358 1 450,881 98.3910 447,437 454,754 450,997 671 5.000 5.130 MON 1,895 22,738 10/20/2005 09/01/201931371L-WN-5 FEDERAL NATIONAL MTG ASSOC #255453 1 306,080 98.3910 303,742 308,709 306,134 506 5.000 5.130 MON 1,286 15,435 10/20/2005 11/01/201931376K-UH-7 FEDERAL NATIONAL MTG ASSOC #357984 1 347,361 98.2960 344,378 350,345 347,466 541 5.000 5.120 MON 1,460 17,517 10/20/2005 08/01/202031377R-UR-9 FEDERAL NATIONAL MTG ASSOC #384992 1 264,856 102.7050 258,376 251,570 260,562 (4,179) 5.950 3.920 MON 1,289 15,176 10/20/2005 04/01/201231377S-PR-3 FEDERAL NATIONAL MTG ASSOC #385732 1 487,486 98.5630 464,621 471,392 475,917 (6,150) 4.670 3.580 MON 1,896 22,318 12/29/2003 01/01/201031377S-S5-8 FEDERAL NATIONAL MTG ASSOC #385840 1 194,723 98.5770 186,880 189,576 191,471 (1,753) 4.880 4.220 MON 797 9,379 02/12/2003 01/01/201331377T-FV-3 FEDERAL NATIONAL MTG ASSOC #386380 1 259,435 95.2460 258,314 271,204 261,469 2,039 4.210 5.190 MON 983 11,576 10/20/2005 07/01/201331385H-4D-1 FEDERAL NATIONAL MTG ASSOC #545420 1 192,609 101.4540 180,284 177,699 185,317 (3,114) 5.626 3.910 MON 861 10,135 02/12/2003 12/01/201131385J-BQ-0 FEDERAL NATIONAL MTG ASSOC #545547 1 308,662 103.3320 279,876 270,849 291,790 (26,224) 6.047 1.930 MON 1,410 25,996 03/18/2004 03/01/201231385W-WH-8 FEDERAL NATIONAL MTG ASSOC #555148 1 1,025,738 98.9100 1,012,037 1,023,180 1,025,232 (806) 4.964 4.800 MON 4,374 51,528 10/20/2005 01/01/201331385W-YS-2 FEDERAL NATIONAL MTG ASSOC #555221 1 177,148 103.8550 162,701 156,660 165,231 (5,841) 6.350 3.100 MON 857 10,086 02/12/2003 04/01/201131385X-N3-7 FEDERAL NATIONAL MTG ASSOC #555810 1 46,334 100.1880 44,895 44,811 46,334 (236) 5.500 4.330 MON 205 2,465 12/24/2003 04/01/201831385X-Q9-1 FEDERAL NATIONAL MTG ASSOC #555880 1 534,588 99.0780 522,556 527,419 534,588 (1,074) 5.500 5.080 MON 2,417 29,008 12/12/2003 11/01/203331389B-KN-0 FEDERAL NATIONAL MTG ASSOC #620501 1 133,756 100.1880 129,603 129,360 132,762 (892) 5.500 4.540 MON 593 7,115 12/24/2003 03/01/201731390V-LA-0 FEDERAL NATIONAL MTG ASSOC #657421 1 83,769 100.1880 81,168 81,016 83,769 (362) 5.500 4.240 MON 371 4,456 12/24/2003 09/01/201731391D-NX-7 FEDERAL NATIONAL MTG ASSOC #663806 1 49,989 100.1880 48,437 48,346 49,912 (250) 5.500 4.420 MON 222 2,659 12/24/2003 10/01/201731391W-GQ-8 FEDERAL NATIONAL MTG ASSOC #678907 1 4,952,061 99.0780 4,907,554 4,953,222 4,952,170 109 5.500 5.420 MON 22,702 12/04/2006 01/01/203331400D-EU-2 FEDERAL NATIONAL MTG ASSOC #684247 1 67,230 100.1880 65,142 65,020 67,230 (477) 5.500 4.310 MON 298 3,576 12/24/2003 01/01/201831400D-ZH-8 FEDERAL NATIONAL MTG ASSOC #684844 1 64,619 100.1250 62,574 62,495 64,619 (221) 5.500 4.200 MON 286 3,437 12/24/2003 02/01/201831400E-GL-8 FEDERAL NATIONAL MTG ASSOC #685203 1 1,509,785 100.1250 1,461,987 1,460,162 1,508,283 (7,101) 5.500 4.420 MON 6,692 80,309 12/24/2003 04/01/201831400H-KM-4 FEDERAL NATIONAL MTG ASSOC #688000 1 410,525 100.1250 397,528 397,032 410,525 (2,172) 5.500 4.400 MON 1,820 21,837 12/24/2003 03/01/201831400S-BV-0 FEDERAL NATIONAL MTG ASSOC #695852 1 175,417 98.4840 168,853 171,452 175,417 (278) 5.000 4.260 MON 714 8,573 12/12/2003 05/01/201831401J-C2-2 FEDERAL NATIONAL MTG ASSOC #709389 1 49,246 100.1250 47,687 47,628 49,246 (527) 5.500 4.160 MON 218 2,620 12/24/2003 07/01/201831401W-JR-1 FEDERAL NATIONAL MTG ASSOC #720372 1 191,613 98.4840 184,443 187,282 191,194 (777) 5.000 4.320 MON 780 9,364 12/12/2003 06/01/201831402D-D9-8 FEDERAL NATIONAL MTG ASSOC #725628 1 472,362 97.1880 464,617 478,058 475,330 1,776 3.887 4.210 MON 1,600 18,837 07/09/2004 06/01/200931402D-EV-8 FEDERAL NATIONAL MTG ASSOC #725648 1 151,811 98.3910 150,652 153,115 151,840 247 5.000 5.130 MON 638 7,656 10/20/2005 07/01/201931402K-VX-9 FEDERAL NATIONAL MTG ASSOC #731530 1 69,323 100.1250 67,128 67,044 69,323 (358) 5.500 4.420 MON 307 3,687 12/24/2003 07/01/201831402R-TJ-8 FEDERAL NATIONAL MTG ASSOC #735953 1 543,238 98.6930 534,679 541,756 543,238 (651) 5.034 4.850 MON 2,348 37,502 10/20/2005 08/01/201531403L-KG-5 FEDERAL NATIONAL MTG ASSOC #751895 1 22,406 98.4840 22,255 22,598 22,406 44 5.000 5.150 MON 94 1,130 10/20/2005 12/01/201831403N-TY-3 FEDERAL NATIONAL MTG ASSOC #753967 1 168,794 98.4840 162,478 164,979 168,794 (667) 5.000 4.270 MON 687 8,249 12/12/2003 12/01/201831404D-YR-3 FEDERAL NATIONAL MTG ASSOC #765820 1 666,629 98.3910 661,536 672,355 666,629 1,018 5.000 5.140 MON 2,801 33,618 10/20/2005 02/01/201931404K-PE-6 FEDERAL NATIONAL MTG ASSOC #770921 1 361,585 98.3910 358,822 364,690 361,670 583 5.000 5.130 MON 1,520 18,234 10/20/2005 04/01/201931406W-ZW-7 FEDERAL NATIONAL MTG ASSOC #822557 1 207,477 98.2960 205,695 209,259 207,565 258 5.000 5.120 MON 872 10,463 10/20/2005 11/01/202031407F-J9-2 FEDERAL NATIONAL MTG ASSOC #829288 1 4,880,565 98.8590 4,875,152 4,931,420 4,880,785 567 5.500 5.630 MON 22,602 22,602 11/02/2006 09/01/203531407J-7J-5 FEDERAL NATIONAL MTG ASSOC #832597 1 2,370,306 100.6710 2,357,138 2,341,404 2,370,306 (6,534) 6.000 5.520 MON 11,707 140,484 10/20/2005 09/01/203531407V-NA-9 FEDERAL NATIONAL MTG ASSOC #841985 1 418,687 98.2960 415,091 422,283 418,878 538 5.000 5.120 MON 1,760 21,114 10/20/2005 10/01/202031407X-QW-4 FEDERAL NATIONAL MTG ASSOC #843869 1 517,798 98.2960 513,351 522,245 518,049 691 5.000 5.120 MON 2,176 26,112 10/20/2005 11/01/202031408A-AJ-9 FEDERAL NATIONAL MTG ASSOC #845209 1 1,869,844 96.5610 1,862,300 1,928,606 1,874,820 6,738 5.000 5.480 MON 8,036 96,430 10/20/2005 11/01/203531408E-VQ-2 FEDERAL NATIONAL MTG ASSOC #849423 1 195,645 98.2960 193,965 197,326 195,745 276 5.000 5.120 MON 822 9,866 10/20/2005 11/01/2020
2699999 - Total Bonds - Special Revenue - Single Class Mortgage-Backed/Asset-Backed Securities 35,891,212 XXX 35,451,966 36,010,575 35,862,047 (25,549) XXX XXX XXX 159,494 1,346,298 XXX XXX
31340Y-CS-6 FEDERAL HOME LOAN MTG CORP 10 E 1 1 65,959 100.0000 58,307 58,307 58,307 (3,130) 10.000 6.720 MON 757 5,831 02/19/1993 07/15/201931392B-NQ-5 FEDERAL NATIONAL MTG ASSOC 01 81 PE 1 267,586 100.0010 271,922 271,919 270,046 (1,541) 6.000 6.380 MON 1,360 16,315 02/08/2002 05/25/203031393R-ZN-3 FEDERAL HOME LOAN MTG CORP 2627 BG 1 1 180,076 93.9980 176,437 187,702 181,127 1,835 3.250 4.480 MON 508 6,100 04/21/2005 06/15/201731393V-A6-8 FEDERAL HOME LOAN MTG CORP 2634 TA 1 1 341,256 95.3820 338,897 355,301 343,109 3,444 3.500 4.720 MON 1,036 12,436 04/12/2005 07/15/201731395N-GR-2 FEDERAL NATIONAL MTG ASSOC 06 53 PA 1 996,758 99.5400 995,404 1,000,000 996,758 5.500 5.480 MON 4,583 32,083 05/05/2006 12/25/2026
2799999 - Total Bonds - Special Revenue - Defined Multi-Class Residential Mortgage-Backed Securities 1,851,635 XXX 1,840,967 1,873,229 1,849,346 608 XXX XXX XXX 8,245 72,765 XXX XXX
38373M-AN-0 GOVERNMENT NATL MTG ASSOC 01 34 B 1 1 815,141 101.6320 828,444 815,141 815,141 6.403 6.340 MON 4,350 53,337 06/27/2001 10/16/202038373M-AW-0 GOVERNMENT NATL MTG ASSOC 01 44 C 1 1 1,000,000 102.1170 1,021,170 1,000,000 1,000,000 6.380 6.350 MON 5,317 63,800 09/05/2001 01/16/202538373M-BY-5 GOVERNMENT NATL MTG ASSOC 02 35 C 1 1 332,936 101.2570 337,718 333,526 332,936 (5,550) 5.886 5.910 MON 1,639 20,766 04/15/2002 10/16/2023
2999999 - Total Bonds - Special Revenue - Defined Multi-Class Commercial Mortgage-Backed Securities 2,148,077 XXX 2,187,332 2,148,667 2,148,077 (5,550) XXX XXX XXX 11,305 137,902 XXX XXX
3199999 - Total - Special Revenue Bonds 41,248,927 XXX 40,875,038 41,342,471 41,200,601 (36,731) XXX XXX XXX 219,480 1,641,012 XXX XXX
E08.1

ANNUAL STATEMENT FOR THE YEAR 2006 OF THE NIC Insurance Company
SCHEDULE D - PART 1Showing all Long-Term BONDS Owned December 31 of Current Year
1 2 Codes 6 7 Fair Value 10 11 Change in Book Adjusted Carrying Value Interest Dates3 4 5 8 9 12 13 14 15 16 17 18 19 20 21 22
CUSIPIdentification Description *
Foreign
BondCHAR
NAIC Designation Actual Cost
Rate Used to Obtain Fair Value Fair Value Par Value
Book/Adjusted Carrying Value
Unrealized Valuation Increase/
(Decrease)
Current Year’s (Amortization)/
Accretion
Current Year’s Other Than Temporary Impairment Recognized
Total Foreign Exchange Change in B./A.C.V. Rate of
Effective Rate of How Paid
Admitted Amount Due &
Accrued
Gross Amt. Rec. During
Year Acquired Maturity202795-GU-8 COMMONWEALTH EDISON COMPANY 1FE 60,937 102.9340 56,614 55,000 57,861 (1,989) 8.000 4.060 MN 562 4,400 06/03/2005 05/15/2008373334-GA-3 GEORGIA POWER COMPANY 1 1FE 299,346 98.8870 296,661 300,000 299,405 57 5.250 5.270 JD 700 16,144 11/30/2005 12/15/201569351U-AA-1 PPL ELECTRIC UTILITIES 1 1FE 124,221 100.2470 125,309 125,000 124,905 144 5.875 6.000 FA 2,774 7,344 08/16/2001 08/15/2007797440-BG-8 SAN DIEGO GAS & ELECTRIC 1 1FE 249,503 99.3080 248,272 250,000 249,545 38 5.300 5.320 MN 1,693 13,176 11/14/2005 11/15/2015806860-AA-0 SCHLUMBERGER TECH CORP 1 1FE 104,980 105.1060 105,106 100,000 103,047 (479) 6.500 5.820 AO 1,372 6,500 07/09/2002 04/15/2012837004-BQ-2 SOUTH CAROLINA ELECTRIC & GAS 1 1FE 997,530 104.6500 1,046,508 1,000,000 998,783 227 6.700 6.730 FA 27,917 67,000 01/19/2001 02/01/2011842400-ES-8 SOUTHERN CALIFORNIA EDISON 1 2FE 124,174 101.9530 127,441 125,000 124,206 11 6.000 6.040 JJ 3,458 7,500 01/07/2004 01/15/2034927804-EW-0 VIRGINIA ELECTRIC & POWER COMPANY 1 2FE 151,586 97.8320 146,749 150,000 151,276 (112) 5.250 5.130 JD 350 7,875 12/29/2003 12/15/2015976826-BB-2 WISCONSIN POWER & LIGHT COMPANY 1FE 107,923 100.5030 100,504 100,000 103,189 (1,692) 5.700 3.830 AO 1,203 5,700 02/03/2004 10/15/2008
3299999 - Total Bonds - Public Utilities - Issuer Obligations 2,220,199 XXX 2,253,165 2,205,000 2,212,219 (3,796) XXX XXX XXX 40,030 135,639 XXX XXX
3899999 - Total - Public Utilities Bonds 2,220,199 XXX 2,253,165 2,205,000 2,212,219 (3,796) XXX XXX XXX 40,030 135,639 XXX XXX
00163X-AL-4 AMB PROPERTY LP 1 2FE 159,851 100.1530 160,245 160,000 159,883 29 5.450 5.470 JD 727 8,962 11/14/2005 12/01/201000184A-AE-5 AOL TIME WARNER INC 1 2FE 136,836 100.1850 125,232 125,000 126,238 (3,648) 6.150 3.130 MN 1,281 7,688 12/29/2003 05/01/200700209A-AF-3 AT&T WIRELESS SERVICES INC 1 2FE 197,913 129.9550 194,934 150,000 196,966 (812) 8.750 6.220 MS 4,375 13,125 10/20/2005 03/01/2031007634-AA-6 AEGON FUNDING CORP 1 1FE 249,775 101.0720 252,682 250,000 249,787 11 5.750 5.750 JD 639 14,495 12/05/2005 12/15/2020013817-AD-3 ALCOA INC 1 1FE 505,535 104.3770 521,885 500,000 502,894 (552) 6.500 6.340 JD 2,708 32,500 06/14/2001 06/01/2011020012-AE-0 ALLSTATE FINL GLOBAL FND 1FE 85,178 104.7460 78,560 75,000 81,542 (1,306) 6.500 4.320 JD 230 4,875 02/03/2004 06/14/201102209S-AA-1 ALTRIA GROUP INC 2FE 188,494 108.6510 190,139 175,000 186,913 (1,383) 7.000 5.780 MN 1,940 12,250 11/03/2005 11/04/2013026351-BC-9 AMERICAN GENERAL FINANCE CORP 1FE 92,540 107.2990 85,839 80,000 86,326 (1,559) 7.500 5.070 FA 2,333 6,000 08/29/2002 08/11/2010054937-AC-1 BB&T CORPORATION 1FE 109,397 104.8460 104,846 100,000 105,357 (1,011) 6.500 5.170 FA 2,708 6,500 08/21/2002 08/01/2011060505-AG-9 BANK OF AMERICA CORPORATION 1FE 450,165 107.7090 430,836 400,000 434,031 (7,439) 7.400 5.040 JJ 13,649 29,600 10/20/2005 01/15/201106406H-AY-5 BANK OF NEW YORK CO INC 1FE 299,328 99.0160 297,051 300,000 299,468 140 4.950 4.990 JJ 6,889 8,704 12/08/2005 01/14/2011079860-AJ-1 BELLSOUTH CORPORATION 1 1FE 109,732 96.5020 106,152 110,000 109,793 30 4.750 4.780 MN 668 5,225 11/08/2004 11/15/2012084423-AM-4 BERKLEY (WR) CORP 1 2FE 84,935 98.2900 83,547 85,000 84,944 5 5.600 5.610 MN 608 4,760 05/04/2005 05/15/2015097014-AD-6 BOEING CAPITAL CORP 1FE 108,108 103.3100 103,311 100,000 105,063 (1,075) 6.100 4.740 MS 2,033 6,100 01/07/2004 03/01/2011125581-AA-6 CIT GROUP INC 1FE 106,787 100.4710 100,472 100,000 100,419 (1,613) 7.375 5.660 AO 1,823 7,375 08/29/2002 04/02/2007126650-AV-2 CVS CORP 1 2FE 39,662 95.5860 38,234 40,000 39,724 29 4.875 4.980 MS 574 1,950 11/22/2004 09/15/2014141781-AR-5 CARGILL INC 1 1FE 259,083 94.2530 259,198 275,000 260,956 1,799 4.375 5.320 JD 1,003 12,031 12/13/2005 06/01/2013149123-BN-0 CATERPILLAR INC 1 1FE 189,345 102.9330 195,573 190,000 189,350 6 6.050 6.070 FA 4,566 08/03/2006 08/15/2036152312-AG-9 CENTEX CORPORATION 1 2FE 108,921 107.8030 107,803 100,000 104,869 (1,011) 7.875 6.490 FA 3,281 7,875 07/09/2002 02/01/2011172062-AF-8 CINCINNATI FINANCIAL CORP 1FE 169,154 110.6810 166,022 150,000 168,466 (423) 6.920 5.890 MN 1,326 10,380 04/29/2005 05/15/2028172967-CQ-2 CITIGROUP INC 1FE 422,181 97.6390 425,706 436,000 424,303 1,187 5.000 5.420 MS 6,419 21,800 10/20/2005 09/15/201420029P-AL-3 COMCAST CABLE COMMUNICATIONS 1 2FE 323,908 104.7780 314,334 300,000 316,952 (3,642) 6.750 5.180 JJ 8,494 20,250 10/20/2005 01/30/201122237L-NR-9 COUNTRYWIDE HOME LOANS INC 1FE 147,686 97.2160 145,824 150,000 149,229 532 3.250 3.630 MN 542 4,875 12/29/2003 05/21/2008224044-BD-8 COX COMMUNICATIONS INC 1 2FE 112,919 104.5410 104,541 100,000 108,075 (1,703) 6.750 4.610 MS 1,988 6,750 01/06/2004 03/15/2011224044-BE-6 COX COMMUNICATIONS INC 1 2FE 134,878 106.6060 133,258 125,000 133,457 (1,207) 7.125 5.720 AO 2,227 8,906 10/20/2005 10/01/2012233835-AW-7 DAIMLERCHRYSLER NA HOLDINGS 2FE 313,782 102.6690 308,010 300,000 312,142 (1,403) 6.500 5.770 MN 2,492 19,500 10/20/2005 11/15/2013244217-BK-0 DEERE (JOHN) CAPITAL CORPORATION 1FE 128,108 98.2520 122,815 125,000 127,221 (311) 5.100 4.750 JJ 2,940 6,375 12/29/2003 01/15/201324422E-PX-1 DEERE (JOHN) CAPITAL CORPORATION 1FE 139,642 98.2540 137,557 140,000 139,718 65 4.875 4.930 AO 1,441 6,635 10/20/2005 10/15/201025179S-AC-4 DEVON FINANCING CORP ULC 1 2FE 111,630 105.7400 105,741 100,000 107,283 (1,327) 6.875 5.120 MS 1,738 6,875 12/29/2003 09/30/2011268766-BU-5 EOP OPERATING LP 1 2FE 105,253 108.2170 108,217 100,000 103,007 (557) 7.000 6.220 JJ 3,228 7,000 07/09/2002 07/15/201126882P-AT-9 ERAC USA FINANCE COMPANY 1 2FE 249,235 101.0400 252,600 250,000 249,301 58 5.900 5.940 MN 1,885 14,750 11/07/2005 11/15/201526884A-AU-7 ERP OPERATING LP 1 2FE 273,661 98.9540 272,124 275,000 273,661 5.375 5.430 FA 6,159 7,883 01/11/2006 08/01/201629452P-AB-2 EQUITABLE LIFE ASSURANCE SOCIETY 1FE 242,034 113.7350 227,471 200,000 233,989 (2,917) 7.700 5.280 JD 1,283 15,400 02/03/2004 12/01/201533738M-AE-1 FIRST UNION NATIONAL BANK NC 1FE 234,357 107.5650 215,130 200,000 218,913 (4,669) 7.800 4.910 FA 5,763 15,600 12/29/2003 08/18/2010343254-AJ-7 FLORIDA WINDSTORM UNDER 1 1FE 237,960 114.6340 229,268 200,000 232,761 (1,883) 7.125 5.280 FA 4,988 14,250 02/03/2004 02/25/2019368710-AG-4 GENENTECH INC 1 1FE 124,921 95.7330 119,666 125,000 124,935 8 4.750 4.750 JJ 2,738 5,888 11/21/2005 07/15/201536962G-ZY-3 GENERAL ELECTRIC CAPITAL CORPORATION 1FE 235,431 100.9560 227,151 225,000 232,457 (1,041) 5.450 4.810 JJ 5,654 12,263 12/29/2003 01/15/201337247X-AD-4 GENWORTH GLOBAL FUNDING 1FE 249,723 102.0860 255,215 250,000 249,761 38 5.750 5.760 JD 639 8,306 05/11/2006 05/15/201338141G-BU-7 GOLDMAN SACHS GROUP INC 1 1FE 187,058 105.7140 185,001 175,000 182,877 (1,340) 6.600 5.540 JJ 5,326 11,550 12/29/2003 01/15/2012382388-AM-8 GOODRICH CORP 1 2FE 182,499 101.8420 178,225 175,000 180,206 (2,011) 6.600 5.240 MN 1,476 11,550 11/04/2005 05/15/2009406216-AH-4 HALLIBURTON COMPANY 2FE 265,144 125.2610 250,523 200,000 265,144 8.750 5.530 FA 6,611 17,500 01/20/2006 02/15/2021416515-AR-5 HARTFORD FINANCIAL SERVICES GROUP 1 1FE 84,842 99.9320 84,942 85,000 84,846 4 5.500 5.520 AO 1,143 09/28/2006 10/15/2016444859-AU-6 HUMANA INC 2FE 129,344 100.7280 125,911 125,000 128,867 (227) 6.300 5.920 FA 3,281 7,875 10/01/2004 08/01/201846625H-AJ-9 JP MORGAN CHASE & COMPANY 1FE 215,666 105.1300 210,262 200,000 212,509 (2,691) 6.750 5.030 FA 5,625 13,500 10/20/2005 02/01/201146625H-AP-5 JP MORGAN CHASE & COMPANY 1FE 133,601 99.9910 124,989 125,000 126,097 (2,598) 5.250 3.090 MN 565 6,563 01/06/2004 05/30/2007
E08.2

ANNUAL STATEMENT FOR THE YEAR 2006 OF THE NIC Insurance Company
SCHEDULE D - PART 1Showing all Long-Term BONDS Owned December 31 of Current Year
1 2 Codes 6 7 Fair Value 10 11 Change in Book Adjusted Carrying Value Interest Dates3 4 5 8 9 12 13 14 15 16 17 18 19 20 21 22
CUSIPIdentification Description *
Foreign
BondCHAR
NAIC Designation Actual Cost
Rate Used to Obtain Fair Value Fair Value Par Value
Book/Adjusted Carrying Value
Unrealized Valuation Increase/
(Decrease)
Current Year’s (Amortization)/
Accretion
Current Year’s Other Than Temporary Impairment Recognized
Total Foreign Exchange Change in B./A.C.V. Rate of
Effective Rate of How Paid
Admitted Amount Due &
Accrued
Gross Amt. Rec. During
Year Acquired Maturity494368-AR-4 KIMBERLY CLARK CORPORATION 1 1FE 495,730 101.6680 508,340 500,000 497,514 397 5.625 5.730 FA 10,625 28,125 02/05/2002 02/15/201249446Q-BD-2 KIMCO REALTY CORP 1 2FE 145,066 100.1460 145,212 145,000 145,058 (6) 5.584 5.570 AO 2,024 7,335 11/16/2005 11/23/201550075N-AH-7 KRAFT FOODS INC 2FE 109,395 103.8790 103,880 100,000 106,496 (1,025) 6.250 4.870 JD 521 6,250 01/07/2004 06/01/2012501044-CC-3 KROGER CO 1 2FE 110,344 104.9310 104,931 100,000 106,836 (1,096) 6.750 5.250 AO 1,425 6,750 12/29/2003 04/15/2012577778-BN-2 MAY DEPARTMENT STORES COMPANY (THE) 1 2FE 196,971 109.7340 192,035 175,000 193,782 (2,806) 8.000 5.710 JJ 6,456 14,000 11/03/2005 07/15/2012590188-JP-4 MERRILL LYNCH & COMPANY INC 1FE 186,806 101.6270 177,849 175,000 179,869 (2,142) 6.000 4.600 FA 3,908 10,500 12/29/2003 02/17/200959156R-AN-8 METLIFE INC 1 1FE 149,955 96.9870 145,481 150,000 149,959 4 5.000 5.000 JD 333 7,500 06/21/2005 06/15/2015
617446-GM-5MORGAN STANLEY DEAN WITTER CORPORATION 1 1FE 322,630 105.6970 317,091 300,000 316,545 (3,358) 6.750 5.290 AO 4,275 20,250 10/20/2005 04/15/2011
61980A-AA-1 MOTIVA ENTERPRISES LLC 1 1FE 69,780 98.7460 69,122 70,000 69,860 21 5.200 5.240 MS 1,072 3,640 09/18/2002 09/15/201263538W-AA-6 NATIONAL CITY BANK OF PENNSYLVANIA 1FE 176,871 108.5740 162,862 150,000 167,816 (3,256) 7.250 4.470 AO 2,115 10,875 02/03/2004 10/21/2011637432-DC-6 NATIONAL RURAL UTILITIES COOPERATIVE 1 1FE 199,934 96.4750 192,952 200,000 199,951 6 4.750 4.750 MS 3,167 9,500 02/18/2004 03/01/201464952W-AB-9 NEW YORK LIFE GLOBAL FUNDING 1FE 149,933 97.3100 145,966 150,000 149,971 13 3.875 3.880 JJ 2,680 5,813 01/05/2004 01/15/2009652482-BD-1 NEWS AMERICA INC 2FE 128,053 98.3340 122,918 125,000 126,699 (468) 4.750 4.290 MS 1,748 5,938 01/06/2004 03/15/2010652482-BL-3 NEWS AMERICA INC 1 2FE 149,745 99.3430 149,015 150,000 149,745 6.400 6.410 JD 427 9,387 12/20/2005 12/15/2035655844-AP-3 NORFOLK SOUTHERN CORPORATION 1 2FE 215,988 105.1660 210,332 200,000 212,790 (2,723) 6.750 5.010 FA 5,100 13,500 10/20/2005 02/15/2011681919-AS-5 OMNICOM GROUP INC 1 2FE 199,020 101.0560 202,112 200,000 199,083 63 5.900 5.960 AO 2,491 6,424 03/24/2006 04/15/201669347U-AC-4 PNC FUNDING CORP 1FE 299,883 99.4150 298,245 300,000 299,905 21 5.125 5.130 JD 726 15,375 12/07/2005 12/14/20106944P0-AA-3 PACIFIC LIFE GLOBAL FUNDING 1FE 179,570 97.2800 175,106 180,000 179,815 86 3.750 3.800 JJ 3,113 6,750 01/08/2004 01/15/2009706451-AA-9 PEMEX PROJECT FUNDING MASTER TR 2FE 115,250 103.0000 103,000 100,000 104,428 (3,771) 8.500 4.400 FA 3,211 8,500 12/29/2003 02/15/2008724477-AF-1 PITNEY BOWES CREDIT CORP 1FE 231,642 103.5510 207,103 200,000 206,716 (5,657) 8.625 5.490 FA 6,517 17,250 02/11/2002 02/15/200874251V-AA-0 PRINCIPAL FINANCIAL GROU 1 1FE 64,573 102.3650 66,538 65,000 64,574 1 6.050 6.090 AO 819 10/11/2006 10/15/203674432Q-AB-1 PRUDENTIAL FINANCIAL INC 1FE 141,221 95.2900 142,935 150,000 143,225 846 4.500 5.320 JJ 3,113 6,750 07/12/2004 07/15/201374834L-AK-6 QUEST DIAGNOSTIC INC 1 2FE 199,624 98.4760 196,954 200,000 199,704 69 5.125 5.160 MN 1,708 10,278 10/25/2005 11/01/201075884R-AP-8 REGENCY CENTERS LP 1 2FE 64,910 96.9520 63,019 65,000 64,925 9 5.250 5.260 FA 1,422 3,536 11/01/2005 08/01/2015758940-AG-5 REGIONS FINANCIAL CORPORATION 1FE 110,535 104.5250 104,525 100,000 107,772 (1,244) 6.375 4.720 MN 815 6,375 09/10/2004 05/15/201278387G-AP-8 SBC COMMUNICATIONS INC 1 1FE 124,864 97.0940 121,368 125,000 124,882 12 5.100 5.110 MS 1,877 6,375 10/27/2004 09/15/2014828807-BM-8 SIMON PROPERTY GROUP LP 1 2FE 194,396 97.2570 194,514 200,000 194,952 459 5.100 5.470 JD 453 10,200 10/20/2005 06/15/2015844741-AY-4 SOUTHWEST AIRLINES CO 1 2FE 149,301 97.9940 146,992 150,000 149,304 3 5.750 5.810 JD 407 12/11/2006 12/15/2016852060-AJ-1 SPRINT CAPITAL CORPORATION 1 2FE 221,566 107.0700 214,140 200,000 217,234 (3,691) 7.625 5.250 JJ 6,397 15,250 10/20/2005 01/30/201187612E-AF-3 TARGET CORPORATION 1 1FE 114,655 115.6640 115,664 100,000 113,955 (248) 7.000 5.910 JJ 3,228 7,000 12/29/2003 07/15/2031902984-AD-5 USA INTERACTIVE 1 2FE 110,926 103.5590 103,560 100,000 107,874 (1,074) 7.000 5.450 JJ 3,228 7,000 12/29/2003 01/15/201390520G-AA-4 UNION BANK OF CALIFORNIA 1FE 298,818 102.4860 307,458 300,000 298,875 57 5.950 6.000 MN 2,479 8,925 05/08/2006 05/11/201691324P-AH-5 UNITEDHEALTH GROUP INC 1 1FE 123,834 95.9680 119,960 125,000 124,116 102 4.750 4.860 FA 2,326 5,938 02/05/2004 02/10/201491913Y-AD-2 VALERO ENERGY CORP 1 2FE 239,002 105.7310 237,895 225,000 236,189 (1,783) 6.875 5.760 AO 3,266 15,469 10/22/2005 04/15/2012925524-AQ-3 VIACOM INC 1 2FE 104,982 103.2860 103,286 100,000 104,047 (797) 6.625 5.560 MN 847 6,625 10/20/2005 05/15/2011925524-BB-5 VIACOM INC 1 2FE 275,784 99.3070 275,080 277,000 275,862 78 6.250 6.300 AO 2,934 9,522 04/05/2006 04/30/201694973V-AJ-6 WELLPOINT INC 1 2FE 204,658 98.7790 202,497 205,000 204,658 5.000 5.030 JJ 4,726 5,267 01/05/2006 01/15/2011949746-EX-5 WELLS FARGO & COMPANY 1FE 125,554 97.9290 122,411 125,000 125,174 (133) 3.500 3.380 AO 1,057 4,375 01/06/2004 04/04/2008960402-AQ-8 WESTINGHOUSE ELECTRIC 2FE 112,500 111.9230 106,327 95,000 108,987 (2,086) 8.625 5.520 FA 3,414 8,194 04/06/2005 08/01/2012962166-BA-1 WEYERHAEUSER COMPANY 1 2FE 57,207 100.7990 53,423 53,000 54,704 (878) 5.950 4.110 MN 526 3,154 01/07/2004 11/01/2008983024-AA-8 WYETH 16 1FE 128,093 100.6470 125,809 125,000 127,252 (301) 5.500 5.150 MS 2,024 6,875 01/07/2004 03/15/201398385X-AA-4 XTO ENERGY INC 1 2FE 166,995 108.6440 162,967 150,000 164,379 (2,289) 7.500 5.390 AO 2,375 11,250 11/03/2005 04/15/2012013716-AP-0 ALCAN INC F 1 2FE 105,753 103.5070 103,507 100,000 103,137 (645) 6.450 5.600 MS 1,899 6,450 07/09/2002 03/15/2011136375-BE-1 CANADIAN NATIONAL RAILWAY COMPANY F 1FE 267,445 112.4300 281,075 250,000 267,352 (93) 6.712 6.190 JJ 7,737 07/07/2006 07/15/2036136385-AE-1 CANADIAN NATL RESOURCES F 1 2FE 44,767 100.0600 45,027 45,000 44,774 (8) 6.450 6.490 JD 1,459 1,451 09/09/2002 06/30/203360871N-AC-3 MOLSON COORS CAPITAL FIN F 1 2FE 14,999 97.9970 14,700 15,000 15,000 4.850 4.840 MS 200 728 12/05/2005 09/22/2010611688-AA-0 MONSANTO CO CANADA F 1 2FE 213,296 93.0370 209,335 225,000 213,501 156 5.500 5.860 JJ 5,191 12,891 11/03/2005 07/30/203500873N-AA-1 AIFUL CORPORATION F 1 2FE 97,064 95.9130 95,913 100,000 97,812 632 4.450 5.210 FA 1,669 3,034 10/20/2005 02/16/2010111021-AD-3 BRITISH TELECOMMUNICATIONS PLC F 16 2FE 121,717 111.6000 111,601 100,000 113,235 (2,981) 8.375 4.670 JD 372 8,375 01/06/2004 12/15/201021987B-AJ-7 CODELCO INC F 1FE 123,103 95.0660 118,833 125,000 123,440 161 4.750 4.940 AO 1,253 5,938 10/21/2004 10/15/201425156P-AC-7 DEUTSCHE TELEKOM INTL FINANCE F 6 1FE 125,968 122.9330 122,934 100,000 125,357 (472) 8.250 6.180 JD 367 8,250 10/20/2005 06/15/203025156P-AE-3 DEUTSCHE TELEKOM INTL FINANCE F 1 1FE 125,740 97.8720 122,340 125,000 125,269 (165) 3.875 3.730 JJ 2,139 4,844 01/12/2004 07/22/200825244S-AC-5 DIAGEO FINANCE BV F 1FE 199,570 97.9720 195,944 200,000 199,610 34 5.300 5.320 AO 1,855 10,600 10/25/2005 10/28/201535177P-AL-1 FRANCE TELECOM F 16 1FE 133,290 131.2720 131,272 100,000 130,640 (1,656) 8.500 6.060 MS 2,833 8,500 01/06/2004 03/01/20314041A2-AF-1 HBOS PLC F 1FE 206,832 102.2120 204,426 200,000 206,712 (103) 6.000 5.750 MN 2,000 12,000 10/26/2005 11/01/2033404280-AA-7 HSBC HOLDINGS PLC F 1FE 175,355 105.3870 158,081 150,000 162,366 (4,536) 7.500 4.050 JJ 5,188 11,250 01/06/2004 07/15/2009
E08.3

ANNUAL STATEMENT FOR THE YEAR 2006 OF THE NIC Insurance Company
SCHEDULE D - PART 1Showing all Long-Term BONDS Owned December 31 of Current Year
1 2 Codes 6 7 Fair Value 10 11 Change in Book Adjusted Carrying Value Interest Dates3 4 5 8 9 12 13 14 15 16 17 18 19 20 21 22
CUSIPIdentification Description *
Foreign
BondCHAR
NAIC Designation Actual Cost
Rate Used to Obtain Fair Value Fair Value Par Value
Book/Adjusted Carrying Value
Unrealized Valuation Increase/
(Decrease)
Current Year’s (Amortization)/
Accretion
Current Year’s Other Than Temporary Impairment Recognized
Total Foreign Exchange Change in B./A.C.V. Rate of
Effective Rate of How Paid
Admitted Amount Due &
Accrued
Gross Amt. Rec. During
Year Acquired Maturity606866-AA-9 MIZUHO FINANCIAL GROUP CAYMAN F 1FE 257,700 100.5860 251,465 250,000 256,823 (745) 5.790 5.330 AO 3,056 14,475 10/20/2005 04/15/2014826200-AC-1 SIEMENS FINANCIERINGSMAT F 1 1FE 249,365 101.3490 253,372 250,000 249,407 42 5.750 5.780 AO 5,391 08/09/2006 10/17/201687927V-AL-2 TELECOM ITALIA CAPITAL F 1 2FE 239,353 92.6430 231,610 250,000 240,493 965 4.950 5.560 MS 3,128 12,375 10/20/2005 09/30/201487938W-AC-7 TELEFONICA EMISIONES SAU F 1 2FE 150,000 106.2160 159,324 150,000 150,000 7.045 7.040 JD 323 5,284 06/09/2006 06/20/2036902118-AY-4 TYCO INTERNATIONAL GROUP SA F 1 2FE 260,843 105.4400 263,600 250,000 258,892 (1,845) 6.750 5.760 FA 6,375 16,875 12/05/2005 02/15/2011902671-AA-4 UFJ FINANCE ARUBA AEC F 1FE 272,668 106.7160 266,790 250,000 269,782 (2,468) 6.750 5.300 JJ 7,781 16,875 10/20/2005 07/15/201392857W-AF-7 VODAFONE GROUP PLC F 1 1FE 134,579 96.6490 130,476 135,000 134,714 34 5.000 5.030 JD 281 6,750 12/29/2003 12/16/2013947075-AB-3 WEATHERFORD INTL INC F 1 2FE 198,568 100.3870 200,774 200,000 198,572 4 6.500 6.550 FA 5,200 08/02/2006 08/01/2036
3999999 - Total Bonds - Industrial, Misc. - Issuer Obligations 19,520,732 XXX 19,160,316 18,626,000 19,273,064 (99,695) XXX XXX XXX 315,074 1,011,199 XXX XXX
12668B-EG-4 COUNTRYWIDE ALT LN TR 05 85CB 2A2 1 1FE 1,734,238 100.1230 1,736,726 1,734,577 1,734,238 43 5.500 5.390 MON 7,950 79,501 02/07/2006 02/25/2036126694-VM-7 COUNTRYWIDE HOME LOANS 05 HY10 3A1A 1 1FE 813,472 99.4540 809,032 813,472 813,472 5.402 5.280 MON 3,662 44,110 12/08/2005 02/20/203612669G-HY-0 COUNTRYWIDE HOME LOANS 04 29 1A1 1 1FE 22,912 100.0520 22,924 22,912 22,912 5.620 5.610 MON 21 1,256 12/17/2004 02/25/203512669G-NL-1 COUNTRYWIDE HOME LOANS 05 7 1A1 1 1FE 47,484 100.1250 47,543 47,484 47,484 5.620 5.580 MON 52 2,552 01/13/2005 03/25/203536185M-BJ-0 GMAC MTG CORP LN TR 05 AR6 2A1 1 1FE 844,860 99.5030 842,243 846,447 844,860 196 5.221 5.180 MON 3,683 44,301 11/28/2005 11/19/203545254N-ML-8 IMPAC CMB TR 05 1 1A1 1 1FE 83,698 100.2510 83,908 83,698 83,698 5.610 5.600 MON 78 4,497 01/25/2005 04/25/203559020U-2H-7 MERRILL LYNCH MTG INV INC 05 A9 2A1E 1 1FE 803,960 99.0000 800,803 808,889 804,354 914 5.161 5.260 MON 3,479 41,860 12/14/2005 12/25/203559020U-NZ-4 MLCC MTG INVEST INC 04 G A1 1 1FE 42,468 99.9310 42,439 42,468 42,468 5.630 5.620 MON 40 2,248 12/09/2004 01/25/203059020U-QC-2 MERRILL LYNCH MTG INV INC 05 A1 1A 1 1FE 250,827 99.3620 251,628 253,241 251,413 1,195 4.296 4.710 MON 907 10,834 11/18/2005 12/25/203459020U-TB-1 MLCC MTG INVEST INC 05 A A1 1 1FE 104,165 100.0610 104,230 104,165 104,165 5.580 5.570 MON 97 5,478 02/15/2005 03/25/203061913P-AP-7 MORTGAGEIT TRUST 05 1 1A1 1 1FE 62,987 100.2100 63,061 62,928 62,985 4 5.670 5.610 MON 59 3,366 04/20/2005 02/25/203561913P-AR-3 MORTGAGEIT TRUST 05 1 2A 1 1FE 193,865 97.4950 191,645 196,568 193,960 246 4.250 4.840 MON 696 8,354 09/21/2005 02/25/203581744F-FJ-1 SEQUOIA MORTGAGE TRUST 04 11 A1 1 1FE 30,072 100.0520 30,088 30,072 30,072 5.650 5.640 MON 52 1,597 11/17/2004 12/20/203481744F-FY-8 SEQUOIA MORTGAGE TRUST 04 12 A1 1 1FE 34,840 100.0670 34,864 34,840 34,840 5.620 5.610 MON 60 1,839 12/10/2004 01/20/203581744F-GM-3 SEQUOIA MORTGAGE TRUST 05 1 A1 1 1FE 76,160 99.8650 76,057 76,160 76,160 5.580 5.570 MON 130 3,992 01/20/2005 02/20/2035939336-Z4-8 WASHINGTON MUTUAL 05 AR3 A2 1 1FE 1,322,775 98.6010 1,329,202 1,348,051 1,325,974 5,624 4.640 5.320 MON 5,214 46,961 03/22/2006 03/25/2035
94981N-AH-8WELLS FARGO MTG BKD SECS TR 05 AR4 2A2 1 1FE 1,324,120 98.1660 1,330,075 1,354,924 1,328,369 7,023 4.523 5.370 MON 5,107 46,019 03/23/2006 04/25/2035
4199999 - Total Bonds - Industrial, Misc. - Defined Multi-Class Residential Mortgage-Backed Securities 7,792,903 XXX 7,796,465 7,860,895 7,801,424 15,246 XXX XXX XXX 31,288 348,765 XXX XXX
045424-FG-8 ASSET SECURITIZATION CORP 97 D5 A1D 1 1FE 853,031 104.2400 833,928 800,000 839,680 (13,055) 6.850 4.860 MON 3,044 57,107 12/15/2005 02/14/204307383F-5K-0 BEAR STEARNS COMM MTG SECS 05 T18 A4 1 1FE 295,781 97.4560 292,368 300,000 296,166 327 4.933 5.100 MON 1,233 14,799 10/24/2005 02/13/2042
07383F-X5-2BEAR STEARNS COMM MTG SECS 04 PWR6 A6 1 1FE 499,863 96.7910 483,955 500,000 499,863 44 4.825 4.810 MON 2,010 24,125 01/07/2005 11/11/2041
07383F-XN-3 BEAR STEARNS COMM MTG SECS 03 T12 A4 1 1FE 497,539 96.8490 484,250 500,000 498,003 154 4.680 4.720 MON 1,950 23,400 12/29/2003 08/13/2039
12513E-AG-9CITIGROUP/DEUTSCHE BK COMM MTG 05 CD1 A4 1 1FE 907,559 99.7710 897,939 900,000 906,188 (1,349) 5.225 5.080 MON 3,919 47,683 12/16/2005 07/15/2044
126171-AF-4 COMMERCIAL MTG PT CERT 05 C6 A5A 1 1FE 801,500 98.5930 788,744 800,000 801,258 (205) 5.116 5.070 MON 3,411 40,928 10/21/2005 06/10/2044201730-AC-2 COMMERCIAL MTG ASSET TR 99 C1 A3 1 1FE 564,297 102.4680 512,340 500,000 526,545 (12,323) 6.640 3.510 MON 1,844 33,200 12/29/2003 01/17/203236158Y-EQ-8 GE CAPITAL COMM MTG SVCS 02 1A A3 1 1FE 503,594 104.4770 522,390 500,000 501,792 (422) 6.269 6.120 MON 2,612 31,345 04/18/2002 12/10/2035396789-ES-4 GREENWICH CAP COMM FDG CORP 03 C2 A4 1 1FE 503,887 97.9910 489,960 500,000 502,781 (374) 4.915 4.790 MON 2,048 24,575 12/29/2003 01/05/203652108H-6W-9 LB-UBS COMM MTG TR 05 C5 A4 1 1FE 789,469 97.5300 780,248 800,000 790,474 851 4.954 5.120 MON 2,202 39,632 10/24/2005 09/15/203059022H-JL-7 MERRILL LYNCH MTG TR 05 CIP1 A4 1 1FE 796,094 98.0710 784,568 800,000 796,359 226 5.047 5.090 MON 3,365 40,376 10/21/2005 07/12/203874432G-AB-3 PRUDENTIAL COMM MTG 03 PWR1 A2 1 1FE 490,918 96.0630 480,315 500,000 493,349 793 4.493 4.740 MON 1,872 22,465 12/30/2003 02/11/2036929766-4Q-3 WACHOVIA BK COMM MTG TR 05 C20 A7 1 1FE 800,500 98.3900 787,120 800,000 800,302 (167) 5.118 5.080 MON 3,412 40,944 10/21/2005 07/15/2042
4399999 - Total Bonds - Industrial, Misc. - Defined Multi-Class Commercial Mortgage-Backed Securities 8,304,031 XXX 8,138,125 8,200,000 8,252,758 (25,499) XXX XXX XXX 32,923 440,579 XXX XXX
03061N-HX-0 AMERICREDIT AUTO RECV TR 05 AX A4 1 1FE 836,384 98.4720 841,936 855,000 843,407 5,801 3.930 4.750 MON 2,333 33,602 10/26/2005 10/06/201107387B-FS-7 BEAR STEARNS COMM MTG SECS 06 T22 A4 1 1FE 896,900 101.8210 916,389 900,000 896,900 5.466 5.490 MON 4,100 33,301 04/07/2006 04/12/2038126694-WE-4 COUNTRYWIDE HOME LOANS 06 HYB1 1A1 1 1FE 1,244,490 99.4150 1,244,608 1,251,923 1,245,002 1,596 5.384 5.540 MON 5,618 45,063 04/05/2006 03/20/2036
126802-AC-1CABELAS MASTER CREDIT CARD TR 05 1A A1 1 1FE 499,908 100.0040 500,024 500,000 499,918 8 4.970 4.970 MON 1,104 24,850 10/31/2005 10/15/2013
14041N-AW-1CAPITAL ONE MULTI-ASSET EXEC TR 03 A4 A4 1 1FE 114,789 97.5950 112,234 115,000 114,923 43 3.650 3.690 MON 187 4,197 09/19/2003 07/15/2011
17307G-6K-9 CITIGROUP MTG LN TR INC 06 AR2 1A1 1 1FE 1,356,293 99.7940 1,355,942 1,358,734 1,356,293 231 5.632 5.550 MON 6,377 51,048 04/05/2006 03/25/203636159G-BB-2 GE BUSINESS LN TR 05 1A A2 1 1FE 133,997 98.8720 132,488 134,000 133,997 1 4.378 4.370 MON 261 5,867 06/22/2005 06/15/203344328F-AM-1 HOUSEHOLD AUTOMOTIVE TR 05 3 A4 1 1FE 959,909 99.6220 956,371 960,000 959,933 18 4.940 4.940 MON 1,844 47,424 10/27/2005 11/19/2012590219-AE-1 MLCC MTG INVEST INC 06 2 2A 1 1FE 931,147 99.5810 934,180 938,109 931,645 901 5.501 5.650 MON 4,301 30,130 05/03/2006 05/25/2036
E08.4

ANNUAL STATEMENT FOR THE YEAR 2006 OF THE NIC Insurance Company
SCHEDULE D - PART 1Showing all Long-Term BONDS Owned December 31 of Current Year
1 2 Codes 6 7 Fair Value 10 11 Change in Book Adjusted Carrying Value Interest Dates3 4 5 8 9 12 13 14 15 16 17 18 19 20 21 22
CUSIPIdentification Description *
Foreign
BondCHAR
NAIC Designation Actual Cost
Rate Used to Obtain Fair Value Fair Value Par Value
Book/Adjusted Carrying Value
Unrealized Valuation Increase/
(Decrease)
Current Year’s (Amortization)/
Accretion
Current Year’s Other Than Temporary Impairment Recognized
Total Foreign Exchange Change in B./A.C.V. Rate of
Effective Rate of How Paid
Admitted Amount Due &
Accrued
Gross Amt. Rec. During
Year Acquired Maturity74408A-AS-9 PROVIDIAN GATEWAY MASTR TR 04 FA A 1 1FE 978,008 98.6890 986,897 1,000,000 990,330 10,485 3.650 4.840 MON 1,622 36,500 10/26/2005 11/15/2011
94983V-AF-2WELLS FARGO MTG BKD SECS TR 06 AR8 2A1 1 1FE 1,342,896 99.2640 1,345,528 1,355,498 1,343,985 2,368 5.240 5.490 MON 5,920 47,341 04/03/2006 04/25/2036
96683M-AD-5 WHOLE AUTO LOAN TRUST 02 1 A4 1 1FE 1,965 99.9110 1,926 1,928 1,929 (7) 3.040 2.360 MON 3 59 02/20/2003 04/15/20094499999 - Total Bonds - Industrial, Misc. - Other Multi-Class Commercial Mortgage-
Backed/Asset-Backed Securities 9,296,685 XXX 9,328,523 9,370,193 9,318,261 21,444 XXX XXX XXX 33,670 359,381 XXX XXX
4599999 - Total - Industrial and Miscellaneous Bonds 44,914,351 XXX 44,423,429 44,057,088 44,645,507 (88,504) XXX XXX XXX 412,955 2,159,925 XXX XXX
5499999 - Total - Issuer Obligations 37,452,830 XXX 36,988,310 35,456,000 37,105,675 (21,671) (187,045) XXX XXX XXX 583,627 1,902,194 XXX XXX
5599999 - Total - Single Class Mortgage-Backed/Asset-Backed Securities 39,345,904 XXX 38,870,435 39,387,484 39,314,400 (44,338) XXX XXX XXX 176,228 1,545,747 XXX XXX
5699999 - Total - Defined Multi-Class Residential Mortgage-Backed Securities 9,644,538 XXX 9,637,432 9,734,124 9,650,771 15,854 XXX XXX XXX 39,532 421,530 XXX XXX
5799999 - Total - Other Multi-Class Residential Mortgage-Backed Securities XXX XXX XXX XXX XXX XXX
5899999 - Total - Defined Multi-Class Commercial Mortgage-Backed Securities 10,452,108 XXX 10,325,457 10,348,667 10,400,835 (31,049) XXX XXX XXX 44,228 578,482 XXX XXX
5999999 - Total - Other Multi-Class Commercial Mortgage-Backed Securities 9,296,685 XXX 9,328,523 9,370,193 9,318,261 21,444 XXX XXX XXX 33,670 359,381 XXX XXX
6099999 Totals 106,192,065 XXX 105,150,156 104,296,468 105,789,943 (21,671) (225,135) XXX XXX XXX 877,285 4,807,333 XXX XXX
E08.5
ANNUAL STATEMENT FOR THE YEAR 2006 OF THE NIC Insurance Company
SCHEDULE D - PART 2 - SECTION 1Showing ALL PREFERRED STOCKS Owned December 31 of Current Year
1 2 Codes 5 6 7 8 Fair Value 11 Dividends Change in Book/ Adjusted Carrying Value 20 21
CUSIP Identification Description
3
Code
4
Foreign
NumberOf
Shares
ParValue
PerShare
RatePer
Share
Book/AdjustedCarrying
Value
9Rate Per
ShareUsed toObtain
FairValue
10
FairValue
ActualCost
12
DeclaredBut
Unpaid
13
AmountReceived
DuringYear
14
NonadmittedDeclared
ButUnpaid
15
UnrealizedValuationIncrease/
(Decrease)
16
CurrentYear’s
(Amortization)Accretion
17
Current Year’sOther ThanTemporaryImpairmentRecognized
18
TotalChange
InB./A.C.V.
(15 + 16 - 17)
19Total
ForeignExchangeChange
InB./A.C.V.
NAICDesig-nation
DateAcquired
6599999 Total - Preferred Stocks XXX XXX XXX
E09

ANNUAL STATEMENT FOR THE YEAR 2006 OF THE NIC Insurance Company
SCHEDULE D - PART 2 - SECTION 2Showing all COMMON STOCKS Owned December 31 of Current Year
1 2 Codes 5 6 Fair Value 9 Dividends Change in Book / Adjusted Carrying Value 17 18
CUSIP Identification Description
3
Code
4
ForeignNumber of
Shares
Book / AdjustedCarrying
Value
7Rate per
Share UsedTo Obtain
FairValue
8
FairValue
ActualCost
10
DeclaredBut Unpaid
11
AmountReceived
During Year
12
NonadmittedDeclared
But Unpaid
13
UnrealizedValuationIncrease /
(Decrease)
14Current Year’s
Other ThanTemporaryImpairmentRecognized
15
TotalChange inB./A.C.V.(13 - 14)
16
Total ForeignExchangeChange inB. /A.C.V.
NAICMarket
Indicator(a)
DateAcquired
7299999 Total - Common Stocks XXX XXX XXX
7399999 Total - Preferred and Common Stocks XXX XXX XXX(a) For all common stocks bearing the NAIC market indicator “U” provide: the number of such issues , the total $ value (included in Column 8) of all such issues $
E10

ANNUAL STATEMENT FOR THE YEAR 2006 OF THE NIC Insurance Company
SCHEDULE D - PART 3Showing All Long-Term Bonds and Stocks ACQUIRED During Current Year
1 2 3 4 5 6 7 8 9
CUSIPIdentification Description Foreign Date Acquired Name of Vendor
Number of Shares of Stock
ActualCost Par Value
Paid for AccruedInterest and Dividends
36241K-J6-6 GOVERNMENT NATL MTG ASSOC #782085 05/11/2006 GOLDMAN SACHS 55,997 54,089 179 912810-FE-3 UNITED STATES TREASURY BONDS 03/09/2006 BEAR STEARNS 758,516 700,000 2,446 0399999 - Total - Bonds - U.S. Government 814,513 754,089 2,625 91086Q-AS-7 UNITED MEXICAN STATES F 08/18/2006 UBS WARBURG 157,875 150,000 4,106 1099999 - Total - Bonds - All Other Government 157,875 150,000 4,106 3128K0-QC-0 FEDERAL HOME LN MTG CORP #A40451 01/10/2006 GREENWICH CAPITAL 566,457 584,872 975 3128K1-3U-3 FEDERAL HOME LN MTG CORP #A41711 01/10/2006 GREENWICH CAPITAL 284,672 293,926 490 3128K1-TJ-0 FEDERAL HOME LN MTG CORP #A41453 01/10/2006 GREENWICH CAPITAL 282,968 292,167 487 3128K2-6A-2 FEDERAL HOME LN MTG CORP #A42665 01/10/2006 GREENWICH CAPITAL 982,504 1,014,443 1,691 3128K2-BL-2 FEDERAL HOME LN MTG CORP #A41843 01/10/2006 GREENWICH CAPITAL 201,214 207,755 346 3128K2-C2-3 FEDERAL HOME LN MTG CORP #A41889 01/10/2006 GREENWICH CAPITAL 200,941 207,473 346 31297U-SZ-4 FEDERAL HOME LN MTG CORP #A38636 01/10/2006 GREENWICH CAPITAL 387,080 399,664 666 31391W-GQ-8 FEDERAL NATIONAL MTG ASSOC #678907 12/04/2006 GOLDMAN SACHS 4,952,061 4,953,222 8,324 31395N-GR-2 FEDERAL NATIONAL MTG ASSOC 06 53 PA 05/05/2006 BANK OF AMERICA 996,758 1,000,000 4,431 31407F-J9-2 FEDERAL NATIONAL MTG ASSOC #829288 11/02/2006 BARCLAYS CAPITAL 4,913,922 4,965,125 9,103 3199999 - Total - Bonds - Special Revenue 13,768,578 13,918,646 26,858 07387B-FS-7 BEAR STEARNS COMM MTG SECS 06 T22 A4 04/07/2006 BEAR STEARNS 896,900 900,000 2,597 12668B-EG-4 COUNTRYWIDE ALT LN TR 05 85CB 2A2 02/07/2006 CITIGROUP GLOBAL MARKETS 1,967,892 1,968,276 2,706 126694-WE-4 COUNTRYWIDE HOME LOANS 06 HYB1 1A1 04/05/2006 GOLDMAN SACHS 1,442,032 1,450,645 1,966 149123-BN-0 CATERPILLAR INC 08/03/2006 CITIGROUP GLOBAL MARKETS 189,345 190,000 17307G-6K-9 CITIGROUP MTG LN TR INC 06 AR2 1A1 04/05/2006 CITIGROUP GLOBAL MARKETS 1,491,497 1,494,182 2,106 26884A-AU-7 ERP OPERATING LP 01/11/2006 JP MORGAN SECURITIES INC. 273,661 275,000 37247X-AD-4 GENWORTH GLOBAL FUNDING 05/11/2006 CREDIT SUISSE FIRST BOSTON 249,723 250,000 406216-AH-4 HALLIBURTON COMPANY 01/20/2006 GOLDMAN SACHS 265,144 200,000 7,778 416515-AR-5 HARTFORD FINANCIAL SERVICES GROUP 09/28/2006 WACHOVIA CAPITAL MARKETS 84,842 85,000 590219-AE-1 MLCC MTG INVEST INC 06 2 2A 05/03/2006 MERRILL LYNCH 987,008 994,388 1,065 681919-AS-5 OMNICOM GROUP INC 03/24/2006 CITIGROUP GLOBAL MARKETS 199,020 200,000 74251V-AA-0 PRINCIPAL FINANCIAL GROU 10/11/2006 GOLDMAN SACHS 64,573 65,000 844741-AY-4 SOUTHWEST AIRLINES CO 12/11/2006 CITIGROUP GLOBAL MARKETS 149,301 150,000 90520G-AA-4 UNION BANK OF CALIFORNIA 05/08/2006 MERRILL LYNCH 298,818 300,000 925524-BB-5 VIACOM INC 04/05/2006 BANK OF AMERICA 275,784 277,000 939336-Z4-8 WASHINGTON MUTUAL 05 AR3 A2 03/22/2006 MERRILL LYNCH 1,457,009 1,484,850 5,753 94973V-AJ-6 WELLPOINT INC 01/05/2006 BANK OF AMERICA 204,658 205,000 94981N-AH-8 WELLS FARGO MTG BKD SECS TR 05 AR4 2A2 03/23/2006 BEAR STEARNS 1,453,462 1,487,274 5,615 94983V-AF-2 WELLS FARGO MTG BKD SECS TR 06 AR8 2A1 04/03/2006 CREDIT SUISSE FIRST BOSTON 1,486,055 1,500,000 5,895 136375-BE-1 CANADIAN NATIONAL RAILWAY COMPANY F 07/07/2006 GOLDMAN SACHS 267,445 250,000 93 826200-AC-1 SIEMENS FINANCIERINGSMAT F 08/09/2006 DEUTSCHE BANK 249,365 250,000 87938W-AC-7 TELEFONICA EMISIONES SAU F 06/09/2006 CITIGROUP GLOBAL MARKETS 150,000 150,000 947075-AB-3 WEATHERFORD INTL INC F 08/02/2006 MORGAN STANLEY & CO 198,568 200,000 4599999 - Total - Bonds - Industrial, Misc. 14,302,100 14,326,615 35,575 6099997 - Total - Bonds - Part 3 29,043,065 29,149,350 69,164 6099998 - Total - Bonds - Part 5 249,100 250,000 6099999 - Total - Bonds 29,292,165 29,399,350 69,164 6599998 - Total - Preferred Stocks - Part 5 XXX6599999 - Total - Preferred Stocks XXX7299998 - Total - Common Stocks - Part 5 XXX7299999 - Total - Common Stocks XXX7399999 - Total - Preferred and Common Stocks XXX
7499999 Totals 29,292,165 XXX 69,164
E11

ANNUAL STATEMENT FOR THE YEAR 2006 OF THE NIC Insurance Company
SCHEDULE D - PART 4Showing all Long-Term Bonds and Stocks SOLD, REDEEMED or Otherwise DISPOSED OF During Current Year
1 2 3 4 5 6 7 8 9 10 Change in Book/Adjusted Carrying Value 16 17 18 19 20 21
CUSIPIdenti-fication Description
Foreign
DisposalDate Name of Purchaser
Number ofShares of
Stock Consideration Par Value Actual Cost
Prior Year Book/Adjusted
Carrying Value
11
Unrealized Valuation Increase/
(Decrease)
12
Current Year (Amortization)/
Accretion
13
Current Year’s Other Than Temporary Impairment Recognized
14
Total Change inB/A. C.V.
(11 + 12 - 13)
15
Total Foreign Exchange Change inB/A. C.V.
Book/Adjusted
Carrying Value at
Disposal Date
Foreign Exchange Gain
(Loss) on Disposal
Realized Gain (Loss) on Disposal
Total Gain (Loss) on Disposal
Bond Interest/Stock
Dividends Received
During YearMaturity
Date36200F-MD-7 GOVERNMENT NATL MTG ASSOC #599856 12/01/2006 PAYDOWN 89,545 89,545 91,742 89,836 (290) (290) 89,545 2,432 06/01/203236200J-Q8-6 GOVERNMENT NATL MTG ASSOC #602679 12/01/2006 PAYDOWN 1,501 1,501 1,571 1,502 (1) (1) 1,501 10 12/01/203236201U-V5-0 GOVERNMENT NATL MTG ASSOC #593836 12/01/2006 PAYDOWN 95,073 95,073 97,985 95,389 (316) (316) 95,073 2,242 06/01/203236202T-6D-3 GOVERNMENT NATL MTG ASSOC #609368 12/01/2006 PAYDOWN 20,909 20,909 21,882 20,946 (38) (38) 20,909 726 02/01/203336205R-WN-3 GOVERNMENT NATL MTG ASSOC #398553 12/01/2006 PAYDOWN 4,112 4,112 4,193 4,116 (4) (4) 4,112 118 05/01/202336208L-RS-8 GOVERNMENT NATL MTG ASSOC #454197 05/11/2006 VARIOUS 14,073 13,601 14,168 14,164 (1) (1) 14,163 (91) (91) 435 04/01/202636208V-QL-2 GOVERNMENT NATL MTG ASSOC #462259 12/01/2006 PAYDOWN 2,116 2,116 2,157 2,117 (2) (2) 2,116 70 05/01/202836209M-T5-3 GOVERNMENT NATL MTG ASSOC #475872 05/11/2006 VARIOUS 58,965 57,072 55,806 55,785 87 87 55,872 3,093 3,093 1,759 07/01/202736210N-N4-7 GOVERNMENT NATL MTG ASSOC #497311 03/22/2006 VARIOUS 8,447 8,099 8,437 8,451 (17) (17) 8,434 14 14 177 05/01/202136213F-MH-3 GOVERNMENT NATL MTG ASSOC #553060 12/01/2006 PAYDOWN 47,574 47,574 48,741 47,702 (128) (128) 47,574 1,290 05/01/203236241K-J6-6 GOVERNMENT NATL MTG ASSOC #782085 12/01/2006 PAYDOWN 7,582 7,582 7,849 7,600 (18) (18) 7,582 168 07/01/202836290S-QB-0 GOVERNMENT NATL MTG ASSOC #616150 12/01/2006 PAYDOWN 80,587 80,587 82,180 80,732 (145) (145) 80,587 2,115 04/01/203336290V-ZR-8 GOVERNMENT NATL MTG ASSOC #619152 12/01/2006 PAYDOWN 123,723 123,723 126,169 123,747 (24) (24) 123,723 2,556 05/01/203436291C-DQ-5 GOVERNMENT NATL MTG ASSOC #623911 12/01/2006 PAYDOWN 46,512 46,512 47,431 46,643 (131) (131) 46,512 1,391 06/01/203436291G-SB-3 GOVERNMENT NATL MTG ASSOC #627914 12/01/2006 PAYDOWN 139,336 139,336 142,090 139,647 (311) (311) 139,336 2,372 11/01/203336291L-J4-8 GOVERNMENT NATL MTG ASSOC #631283 12/01/2006 PAYDOWN 7,353 7,353 7,499 7,365 (11) (11) 7,353 236 12/01/203436291R-AC-6 GOVERNMENT NATL MTG ASSOC #635503 12/01/2006 PAYDOWN 5,779 5,779 5,893 5,794 (15) (15) 5,779 165 01/01/203436291S-RN-2 GOVERNMENT NATL MTG ASSOC #636893 12/01/2006 PAYDOWN 98,730 98,730 100,682 98,931 (201) (201) 98,730 3,791 08/01/2034
912828-BD-1UNITED STATES TREASURY INFL INDEX NOTES 03/31/2006 VARIOUS 970,126 925,000 975,662 973,558 (279) (279) 973,279 (3,154) (3,154) 13,288 07/15/2013
912828-DS-6 UNITED STATES TREASURY NOTES 12/12/2006 GOLDMAN SACHS 397,969 400,000 399,969 399,980 14 14 399,994 (2,025) (2,025) 16,182 04/30/20070399999 - Bonds - U.S. Governments 2,220,011 2,174,204 2,242,106 2,224,004 (1,831) (1,831) 2,222,174 (2,163) (2,163) 51,524 XXX
3128JR-JE-7 FEDERAL HOME LN MTG CORP #847461 12/15/2006 VARIOUS 202,238 202,238 199,963 201,999 239 239 202,238 4,556 12/01/20343128K0-QC-0 FEDERAL HOME LN MTG CORP #A40451 12/01/2006 PAYDOWN 39,437 39,437 38,196 39,371 66 66 39,437 889 08/01/20353128K1-3U-3 FEDERAL HOME LN MTG CORP #A41711 12/01/2006 PAYDOWN 4,988 4,988 4,831 4,981 7 7 4,988 131 10/01/20353128K1-TJ-0 FEDERAL HOME LN MTG CORP #A41453 12/01/2006 PAYDOWN 4,265 4,265 4,131 4,260 5 5 4,265 97 04/01/20333128K2-6A-2 FEDERAL HOME LN MTG CORP #A42665 12/01/2006 PAYDOWN 26,083 26,083 25,261 26,041 42 42 26,083 783 11/01/20353128K2-BL-2 FEDERAL HOME LN MTG CORP #A41843 12/01/2006 PAYDOWN 18,710 18,710 18,121 18,683 27 27 18,710 532 11/01/20353128K2-C2-3 FEDERAL HOME LN MTG CORP #A41889 12/01/2006 PAYDOWN 3,477 3,477 3,367 3,472 4 4 3,477 81 08/01/20353128PB-LT-9 FEDERAL HOME LN MTG CORP #J00338 12/01/2006 PAYDOWN 378,113 378,113 367,951 377,163 950 950 378,113 9,895 08/01/202031296S-D3-7 FEDERAL HOME LN MTG CORP #A17322 12/01/2006 PAYDOWN 394,934 394,934 398,976 395,249 (316) (316) 394,934 11,656 04/01/203331297U-SZ-4 FEDERAL HOME LN MTG CORP #A38636 12/01/2006 PAYDOWN 18,784 18,784 18,193 18,756 29 29 18,784 450 07/01/203531340Y-CS-6 FEDERAL HOME LOAN MTG CORP 10 E 12/15/2006 VARIOUS 15,594 15,594 17,641 16,337 (743) (743) 15,594 803 01/15/200731371K-2T-7 FEDERAL NATIONAL MTG ASSOC #254686 12/01/2006 PAYDOWN 10,686 10,686 11,049 10,704 (18) (18) 10,686 313 09/01/201731371K-4F-5 FEDERAL NATIONAL MTG ASSOC #254722 12/01/2006 PAYDOWN 10,424 10,424 10,778 10,439 (15) (15) 10,424 313 10/01/201731371L-SD-2 FEDERAL NATIONAL MTG ASSOC #255316 12/01/2006 PAYDOWN 76,209 76,209 75,560 76,119 91 91 76,209 2,012 02/01/201931371L-TP-4 FEDERAL NATIONAL MTG ASSOC #255358 12/01/2006 PAYDOWN 78,171 78,171 77,505 78,080 90 90 78,171 2,083 04/01/201931371L-WN-5 FEDERAL NATIONAL MTG ASSOC #255453 12/01/2006 PAYDOWN 64,897 64,897 64,345 64,810 87 87 64,897 1,743 06/01/201931376K-UH-7 FEDERAL NATIONAL MTG ASSOC #357984 12/01/2006 PAYDOWN 62,328 62,328 61,797 62,248 80 80 62,328 1,727 04/01/202031377R-UR-9 FEDERAL NATIONAL MTG ASSOC #384992 12/01/2006 PAYDOWN 3,269 3,269 3,441 3,284 (15) (15) 3,269 107 04/01/201231377S-PR-3 FEDERAL NATIONAL MTG ASSOC #385732 12/01/2006 PAYDOWN 7,879 7,879 8,148 7,901 (22) (22) 7,879 203 01/01/201031377S-S5-8 FEDERAL NATIONAL MTG ASSOC #385840 12/01/2006 PAYDOWN 2,891 2,891 2,970 2,895 (4) (4) 2,891 78 01/01/201331377T-FV-3 FEDERAL NATIONAL MTG ASSOC #386380 12/01/2006 PAYDOWN 4,324 4,324 4,137 4,310 15 15 4,324 100 07/01/201331377U-QZ-9 FEDERAL NATIONAL MTG ASSOC #387572 10/01/2006 PAYDOWN 348,794 348,794 338,766 338,873 9,921 9,921 348,794 13,476 10/01/200631385H-4D-1 FEDERAL NATIONAL MTG ASSOC #545420 12/01/2006 PAYDOWN 2,714 2,714 2,942 2,745 (31) (31) 2,714 84 12/01/201131385J-BQ-0 FEDERAL NATIONAL MTG ASSOC #545547 12/01/2006 PAYDOWN 190,395 190,395 216,976 193,372 (2,976) (2,976) 190,395 8,057 02/01/201231385W-WH-8 FEDERAL NATIONAL MTG ASSOC #555148 12/01/2006 PAYDOWN 151,155 151,155 151,532 151,185 (30) (30) 151,155 4,935 01/01/201331385W-YS-2 FEDERAL NATIONAL MTG ASSOC #555221 12/01/2006 PAYDOWN 2,161 2,161 2,443 2,164 (3) (3) 2,161 76 04/01/201131385X-N3-7 FEDERAL NATIONAL MTG ASSOC #555810 12/01/2006 PAYDOWN 9,858 9,858 10,193 9,874 (16) (16) 9,858 287 01/01/201731385X-Q9-1 FEDERAL NATIONAL MTG ASSOC #555880 12/01/2006 PAYDOWN 83,436 83,436 84,570 83,513 (77) (77) 83,436 2,376 09/01/203231389B-KN-0 FEDERAL NATIONAL MTG ASSOC #620501 12/01/2006 PAYDOWN 9,770 9,770 10,102 9,802 (32) (32) 9,770 294 11/01/201631390V-LA-0 FEDERAL NATIONAL MTG ASSOC #657421 12/01/2006 PAYDOWN 15,865 15,865 16,404 15,885 (20) (20) 15,865 443 02/01/201731391D-NX-7 FEDERAL NATIONAL MTG ASSOC #663806 12/01/2006 PAYDOWN 9,816 9,816 10,150 9,825 (9) (9) 9,816 240 06/01/201731392B-NQ-5 FEDERAL NATIONAL MTG ASSOC 01 81 PE 12/01/2006 PAYDOWN 195,444 195,444 192,329 192,173 3,271 3,271 195,444 5,949 10/01/200831393R-ZN-3 FEDERAL HOME LOAN MTG CORP 2627 BG 12/01/2006 PAYDOWN 36,278 36,278 34,804 36,049 229 229 36,278 629 03/01/201431393V-A6-8 FEDERAL HOME LOAN MTG CORP 2634 TA 12/01/2006 PAYDOWN 76,018 76,018 73,013 75,584 434 434 76,018 1,415 03/01/201431400D-EU-2 FEDERAL NATIONAL MTG ASSOC #684247 12/01/2006 PAYDOWN 19,862 19,862 20,537 19,907 (45) (45) 19,862 542 06/01/201731400D-ZH-8 FEDERAL NATIONAL MTG ASSOC #684844 12/01/2006 PAYDOWN 8,828 8,828 9,128 8,836 (8) (8) 8,828 259 10/01/201731400E-GL-8 FEDERAL NATIONAL MTG ASSOC #685203 12/01/2006 PAYDOWN 266,448 266,448 275,503 266,696 (248) (248) 266,448 8,219 09/01/201731400H-KM-4 FEDERAL NATIONAL MTG ASSOC #688000 12/01/2006 PAYDOWN 83,736 83,736 86,582 83,886 (151) (151) 83,736 2,593 10/01/201731400S-BV-0 FEDERAL NATIONAL MTG ASSOC #695852 12/01/2006 PAYDOWN 24,699 24,699 25,270 24,699 24,699 688 12/01/201731401J-C2-2 FEDERAL NATIONAL MTG ASSOC #709389 12/01/2006 PAYDOWN 17,554 17,554 18,150 17,625 (72) (72) 17,554 462 12/01/201731401W-JR-1 FEDERAL NATIONAL MTG ASSOC #720372 12/01/2006 PAYDOWN 33,642 33,642 34,420 33,685 (44) (44) 33,642 908 12/01/201731402D-D9-8 FEDERAL NATIONAL MTG ASSOC #725628 12/01/2006 PAYDOWN 8,869 8,869 8,763 8,819 49 49 8,869 190 06/01/200931402D-EV-8 FEDERAL NATIONAL MTG ASSOC #725648 12/01/2006 PAYDOWN 31,344 31,344 31,077 31,303 41 41 31,344 821 01/01/201931402K-VX-9 FEDERAL NATIONAL MTG ASSOC #731530 12/01/2006 PAYDOWN 14,094 14,094 14,573 14,118 (23) (23) 14,094 427 01/01/201831402R-TJ-8 FEDERAL NATIONAL MTG ASSOC #735953 12/01/2006 PAYDOWN 255,521 255,521 256,220 255,519 3 3 255,521 2,455 08/01/2015
E12

ANNUAL STATEMENT FOR THE YEAR 2006 OF THE NIC Insurance Company
SCHEDULE D - PART 4Showing all Long-Term Bonds and Stocks SOLD, REDEEMED or Otherwise DISPOSED OF During Current Year
1 2 3 4 5 6 7 8 9 10 Change in Book/Adjusted Carrying Value 16 17 18 19 20 21
CUSIPIdenti-fication Description
Foreign
DisposalDate Name of Purchaser
Number ofShares of
Stock Consideration Par Value Actual Cost
Prior Year Book/Adjusted
Carrying Value
11
Unrealized Valuation Increase/
(Decrease)
12
Current Year (Amortization)/
Accretion
13
Current Year’s Other Than Temporary Impairment Recognized
14
Total Change inB/A. C.V.
(11 + 12 - 13)
15
Total Foreign Exchange Change inB/A. C.V.
Book/Adjusted
Carrying Value at
Disposal Date
Foreign Exchange Gain
(Loss) on Disposal
Realized Gain (Loss) on Disposal
Total Gain (Loss) on Disposal
Bond Interest/Stock
Dividends Received
During YearMaturity
Date31403L-KG-5 FEDERAL NATIONAL MTG ASSOC #751895 12/01/2006 PAYDOWN 6,660 6,660 6,603 6,648 11 11 6,660 115 08/01/201831403N-TY-3 FEDERAL NATIONAL MTG ASSOC #753967 12/01/2006 PAYDOWN 38,202 38,202 39,085 38,249 (48) (48) 38,202 1,027 06/01/201831404D-YR-3 FEDERAL NATIONAL MTG ASSOC #765820 12/01/2006 PAYDOWN 135,703 135,703 134,548 135,597 106 106 135,703 4,317 08/01/201831404K-PE-6 FEDERAL NATIONAL MTG ASSOC #770921 12/01/2006 PAYDOWN 67,389 67,389 66,815 67,329 60 60 67,389 1,794 02/01/201931406W-ZW-7 FEDERAL NATIONAL MTG ASSOC #822557 12/01/2006 PAYDOWN 23,230 23,230 23,032 23,210 20 20 23,230 570 09/01/202031407F-J9-2 FEDERAL NATIONAL MTG ASSOC #829288 12/01/2006 PAYDOWN 33,705 33,705 33,358 33,705 33,705 154 06/01/203531407J-7J-5 FEDERAL NATIONAL MTG ASSOC #832597 12/01/2006 PAYDOWN 655,890 655,890 663,986 657,366 (1,476) (1,476) 655,890 26,629 07/01/203531407V-NA-9 FEDERAL NATIONAL MTG ASSOC #841985 12/01/2006 PAYDOWN 54,220 54,220 53,758 54,122 98 98 54,220 1,551 07/01/202031407X-QW-4 FEDERAL NATIONAL MTG ASSOC #843869 12/01/2006 PAYDOWN 60,604 60,604 60,088 60,549 55 55 60,604 1,912 08/01/202031408A-AJ-9 FEDERAL NATIONAL MTG ASSOC #845209 12/01/2006 PAYDOWN 67,231 67,231 65,183 67,098 133 133 67,231 1,925 08/01/203531408E-VQ-2 FEDERAL NATIONAL MTG ASSOC #849423 12/01/2006 PAYDOWN 24,463 24,463 24,254 24,438 24 24 24,463 805 10/01/202038373M-AN-0 GOVERNMENT NATL MTG ASSOC 01 34 B 12/01/2006 PAYDOWN 184,859 184,859 184,859 184,859 184,859 7,559 10/01/201538373M-BY-5 GOVERNMENT NATL MTG ASSOC 02 35 C 12/01/2006 PAYDOWN 166,474 166,474 166,180 160,440 6,034 6,034 166,474 5,087 01/01/2018575633-GT-3 MASSACHUSETTS ED LN AUTH ED LN 07/01/2006 VARIOUS 150,000 150,000 150,000 150,000 150,000 7,840 07/01/2006
3199999 - Bonds - Special Revenues 4,992,631 4,992,631 5,012,557 4,976,848 15,783 15,783 4,992,631 155,665 XXX06423E-NM-3 BANK ONE NA ILLINOIS 12/12/2006 BNP PARIBAS 100,039 100,000 107,754 103,069 (2,343) (2,343) 100,726 (687) (687) 6,585 03/26/200712668B-EG-4 COUNTRYWIDE ALT LN TR 05 85CB 2A2 12/01/2006 PAYDOWN 233,699 233,699 233,654 233,697 3 3 233,699 5,891 03/01/2013126694-VM-7 COUNTRYWIDE HOME LOANS 05 HY10 3A1A 12/01/2006 PAYDOWN 171,528 171,528 171,528 171,528 171,528 5,245 06/01/2011126694-WE-4 COUNTRYWIDE HOME LOANS 06 HYB1 1A1 12/01/2006 PAYDOWN 198,722 198,722 197,542 198,626 95 95 198,722 4,215 03/01/201112669G-HY-0 COUNTRYWIDE HOME LOANS 04 29 1A1 12/25/2006 PAYDOWN 46,817 46,817 46,817 46,817 46,817 1,044 09/25/200712669G-NL-1 COUNTRYWIDE HOME LOANS 05 7 1A1 12/25/2006 PAYDOWN 110,340 110,340 110,340 110,340 110,340 2,502 09/25/2007139732-CS-8 CAPITAL AUTO RECV ASSET TR 02 3 A3 02/15/2006 PAYDOWN 7,973 7,973 8,237 7,986 (14) (14) 7,973 35 02/15/2006
161581-CP-6CHASE MANHATTAN AUTO OWNER TRU 02-B A4 02/15/2006 PAYDOWN 43,824 43,824 45,783 44,287 (463) (463) 43,824 296 02/15/2006
17305E-BH-7CITIBANK CREDIT CARD ISS TR 03 A2 A2 01/15/2006 PAYDOWN 100,000 100,000 100,891 100,013 (13) (13) 100,000 1,350 01/15/2006
17307G-6K-9 CITIGROUP MTG LN TR INC 06 AR2 1A1 12/01/2006 PAYDOWN 135,448 135,448 135,205 135,436 12 12 135,448 3,023 07/01/201117307G-JX-7 CITIGROUP MTG LN TR INC 04 HYB3 1A 12/12/2006 VARIOUS 527,416 527,904 520,975 521,186 2,780 2,780 523,966 3,451 3,451 18,664 01/01/2009184502-AP-7 CLEAR CHANNEL COMMUNICATIONS 10/25/2006 JP MORGAN SECURITIES INC. 187,196 200,000 194,858 194,980 491 491 195,471 (8,275) (8,275) 14,854 01/15/201322541L-AA-1 CREDIT SUISSE FB USA INC 08/01/2006 MATURITY 225,000 225,000 238,841 227,895 (2,895) (2,895) 225,000 13,219 08/01/200623383V-BW-9 DAIMLER CHRYSLER AUTO TR 02 C A4 08/08/2006 PAYDOWN 76,741 76,741 78,296 77,010 (269) (269) 76,741 1,156 08/08/200633901H-BJ-1 FLEET CREDIT CARD MASTER TR 03 A A 01/15/2006 PAYDOWN 60,000 60,000 59,985 60,000 60,000 120 01/15/200636185M-BJ-0 GMAC MTG CORP LN TR 05 AR6 2A1 12/01/2006 PAYDOWN 131,610 131,610 131,363 131,520 90 90 131,610 3,781 06/01/2011
41283A-AP-4HARLEY DAVIDSON MOTORCYCLE TR 02 1 A2 11/15/2006 PAYDOWN 47,388 47,388 49,784 48,264 (875) (875) 47,388 1,499 11/15/2006
42805R-AB-5HERTZ VEHICLE FINANCING LLC 04 1A A2 12/12/2006 BANK OF AMERICA 397,000 400,000 399,897 399,957 33 33 399,990 (2,990) (2,990) 9,176 05/25/2007
44943Q-AB-6 IDS FINANCIAL 02/15/2006 MATURITY 100,000 100,000 105,791 100,214 (214) (214) 100,000 3,313 02/15/200645254N-ML-8 IMPAC CMB TR 05 1 1A1 12/25/2006 PAYDOWN 39,867 39,867 39,867 39,867 39,867 919 12/25/2008524908-FD-7 LEHMAN BROTHERS HOLDINGS INC 12/12/2006 HSBC SECURITIES USA INC. 123,525 125,000 127,450 126,292 (584) (584) 125,709 (2,184) (2,184) 6,944 01/22/2008
542514-JW-5LONG BEACH MORTGAGE LOAN TRUST 05-1 2A1 04/25/2006 PAYDOWN 63,548 63,548 63,548 63,548 63,548 532 04/25/2006
571748-AC-6 MARSH & MCLENNAN COS INC 01/12/2006 BANK OF AMERICA 105,772 100,000 108,696 104,756 (60) (60) 104,696 1,076 1,076 653 06/15/2009
59020U-2H-7MERRILL LYNCH MTG INV INC 05 A9 2A1E 12/01/2006 PAYDOWN 91,111 91,111 90,555 91,075 35 35 91,111 2,644 07/01/2011
59020U-NZ-4 MLCC MTG INVEST INC 04 G A1 12/25/2006 PAYDOWN 54,781 54,781 54,781 54,781 54,781 1,411 01/25/200859020U-QC-2 MERRILL LYNCH MTG INV INC 05 A1 1A 12/01/2006 PAYDOWN 92,912 92,912 92,027 92,764 149 149 92,912 1,896 01/01/200959020U-TB-1 MLCC MTG INVEST INC 05 A A1 12/25/2006 PAYDOWN 129,044 129,044 129,044 129,044 129,044 3,370 02/25/2008590219-AE-1 MLCC MTG INVEST INC 06 2 2A 12/01/2006 PAYDOWN 56,279 56,279 55,861 56,264 15 15 56,279 1,083 08/01/201261913P-AP-7 MORTGAGEIT TRUST 05 1 1A1 12/25/2006 PAYDOWN 17,996 17,996 18,013 17,993 3 3 17,996 463 07/25/200961913P-AR-3 MORTGAGEIT TRUST 05 1 2A 12/01/2006 PAYDOWN 31,359 31,359 30,927 31,333 26 26 31,359 699 01/01/2010
740587-GL-8 PREMIUM ASSET 2004-04 11/17/2006KEEFE BRUYETTE AND WOOD INC. 82,500 100,000 99,933 99,956 12 12 99,967 (17,467) (17,467) 4,927 03/12/2009
81744F-FJ-1 SEQUOIA MORTGAGE TRUST 04 11 A1 12/20/2006 PAYDOWN 25,900 25,900 25,900 25,900 25,900 570 07/20/200881744F-FY-8 SEQUOIA MORTGAGE TRUST 04 12 A1 12/20/2006 PAYDOWN 33,286 33,286 33,286 33,286 33,286 770 02/20/200881744F-GM-3 SEQUOIA MORTGAGE TRUST 05 1 A1 12/20/2006 PAYDOWN 68,049 68,049 68,049 68,049 68,049 1,554 03/20/2008902494-AM-5 TYSON FOODS INC 09/26/2006 LEHMAN BROTHERS 70,052 65,000 72,805 70,397 (591) (591) 69,806 246 246 5,333 10/01/201192926E-AD-9 WFS FINANCIAL OWNER TR 02 3 A4 08/20/2006 PAYDOWN 61,649 61,649 63,055 62,000 (351) (351) 61,649 1,135 08/20/2006939336-Z4-8 WASHINGTON MUTUAL 05 AR3 A2 12/01/2006 VARIOUS 136,799 136,799 134,234 136,659 140 140 136,799 2,377 10/01/2010
94981N-AH-8WELLS FARGO MTG BKD SECS TR 05 AR4 2A2 12/01/2006 PAYDOWN 132,350 132,350 129,341 132,116 235 235 132,350 2,673 08/01/2010
94983V-AF-2WELLS FARGO MTG BKD SECS TR 06 AR8 2A1 12/01/2006 VARIOUS 144,502 144,502 143,158 144,438 64 64 144,502 2,544 01/01/2011
96683M-AD-5 WHOLE AUTO LOAN TRUST 02 1 A4 12/15/2006 PAYDOWN 12,651 12,651 12,892 12,685 (34) (34) 12,651 173 01/15/200798152D-AY-7 WORLD OMNI AUTO RECV TR 03 A A4 11/15/2006 PAYDOWN 70,000 70,000 69,995 69,999 1 1 70,000 1,307 12/15/200600873N-AA-1 AIFUL CORPORATION F 02/02/2006 GOLDMAN SACHS 168,735 175,000 169,862 170,065 111 111 170,176 (1,441) (1,441) 5,115 02/16/2010
4599999 - Bonds - Industrial and Miscellaneous 4,713,407 4,744,076 4,770,821 4,746,089 (4,410) (4,410) 4,741,679 (28,272) (28,272) 145,059 XXX
E12.1

ANNUAL STATEMENT FOR THE YEAR 2006 OF THE NIC Insurance Company
SCHEDULE D - PART 4Showing all Long-Term Bonds and Stocks SOLD, REDEEMED or Otherwise DISPOSED OF During Current Year
1 2 3 4 5 6 7 8 9 10 Change in Book/Adjusted Carrying Value 16 17 18 19 20 21
CUSIPIdenti-fication Description
Foreign
DisposalDate Name of Purchaser
Number ofShares of
Stock Consideration Par Value Actual Cost
Prior Year Book/Adjusted
Carrying Value
11
Unrealized Valuation Increase/
(Decrease)
12
Current Year (Amortization)/
Accretion
13
Current Year’s Other Than Temporary Impairment Recognized
14
Total Change inB/A. C.V.
(11 + 12 - 13)
15
Total Foreign Exchange Change inB/A. C.V.
Book/Adjusted
Carrying Value at
Disposal Date
Foreign Exchange Gain
(Loss) on Disposal
Realized Gain (Loss) on Disposal
Total Gain (Loss) on Disposal
Bond Interest/Stock
Dividends Received
During YearMaturity
Date6099997 - Bonds - Part 4 11,926,049 11,910,910 12,025,484 11,946,941 9,543 9,543 11,956,484 (30,435) (30,435) 352,248 XXX6099998 - Bonds - Part 5 235,488 250,000 249,100 249,100 57 57 249,157 (13,670) (13,670) 10,787 XXX6099999 - Total - Bonds 12,161,537 12,160,910 12,274,584 12,196,041 9,600 9,600 12,205,641 (44,104) (44,104) 363,035 XXX6599998 - Preferred Stocks - Part 5 XXX XXX6599999 - Total - Preferred Stocks XXX XXX7299998 - Common Stocks - Part 5 XXX XXX7299999 - Total - Common Stocks XXX XXX7399999 - Total - Preferred and Common Stocks XXX XXX
7499999 Totals 12,161,537 XXX 12,274,584 12,196,041 9,600 9,600 12,205,641 (44,104) (44,104) 363,035 XXX
E12.2

ANNUAL STATEMENT FOR THE YEAR 2006 OF THE NIC Insurance Company
SCHEDULE D - PART 5Showing all Long-Term Bonds and Stocks ACQUIRED During Year and Fully DISPOSED OF During Current Year
1 2 3 4 5 6 7 8 9 10 11 Change in Book/Adjusted Carrying Value 17 18 19 20 2112 13 14 15 16
CUSIPIdentification Description
Foreign
DateAcquired Name of Vendor
DisposalDate Name of Purchaser
Par Value(Bonds) orNumber of
Shares(Stocks) Actual Cost Consideration
Book/AdjustedCarryingValue at
Disposal Date
UnrealizedValuationIncrease/
(Decrease)
Current Year’s(Amortization)/
Accretion
Current Year’sOther ThanTemporaryImpairmentRecognized
Total ChangeIn
B./A. C.V.(12 + 13 - 14)
Total ForeignExchangeChange inB./A. C.V.
ForeignExchange
Gain (Loss) onDisposal
Realized Gain(Loss) onDisposal
TotalGain (Loss)on Disposal
Interest andDividendsReceived
During Year
Paid forAccruedInterest
andDividends
349631-AL-5 FORTUNE BRANDS INC 01/05/2006 BARCLAYS CAPITAL 10/27/2006 MERRILL LYNCH 250,000 249,100 235,488 249,157 57 57 (13,670) (13,670) 10,787
4599999 - Bonds - Industrial and Miscellaneous 250,000 249,100 235,488 249,157 57 57 (13,670) (13,670) 10,787
6099998 - Subtotal Bonds 250,000 249,100 235,488 249,157 57 57 (13,670) (13,670) 10,787
7399999 - Subtotal-Stocks
7499999 Totals 249,100 235,488 249,157 57 57 (13,670) (13,670) 10,787
E13

ANNUAL STATEMENT FOR THE YEAR 2006 OF THE NIC Insurance Company
SCHEDULE D - PART 6 - SECTION 1Valuation of Shares of Subsidiary, Controlled or Affiliated Companies
1
2 3 4 5 6 7 8 Stock of Such Company Owned by Insurer on Statement Date
CUSIPIdentification
DescriptionName of Subsidiary, Controlled or
Affiliated Company Foreign
NAIC Company Code or
AlienInsurer
Identification Number
NAIC Valuation Method
(See SVO Purposes
and Procedures
Manual)
Do Insurer’s Admitted Assets Include
Intangible Assets
Connected with Holding
of Such Company’s
Stock?
Total Amount of Such Intangible
AssetsBook / Adjusted Carrying Value
9
Number of Shares
10
% of Outstanding
1999999 Totals XXX XXX1. Amount of insurer's capital and surplus from the prior period’s statutory statement reduced by any admitted EDP, goodwill and net deferred tax
assets included therein: $2. Total amount of intangible assets nonadmitted $
SCHEDULE D - PART 6 - SECTION 21 2 3 4
Total Amount of Intangible Assets
Stock in Lower-Tier Company Owned Indirectly by Insurer on
Statement Date
CUSIPIdentification Name of Lower-Tier Company
Name of Company Listed in Section 1 Which Controls Lower-Tier Company
Included in Amount Shown in Column 7,
Section 1
5
Number of Shares
6% of
Outstanding
0399999 Total XXX XXX
E14
NONE
NONE

ANNUAL STATEMENT FOR THE YEAR 2006 OF THE NIC Insurance Company
SCHEDULE DA - PART 1 Showing all SHORT-TERM INVESTMENTS Owned December 31 of Current Year
1 Codes 4 5 6 7 Change In Book/Adjusted Carrying Value 12 13 Interest 20
Description
2
Code
3
ForeignDate
Acquired Name of VendorMaturity
Date
Book/AdjustedCarrying
Value
8
UnrealizedValuationIncrease/
(Decrease)
9
CurrentYear’s
(Amortization)/
Accretion
10
CurrentYear’s
Other ThanTemporaryImpairmentRecognized
11
TotalForeign
ExchangeChange inB./A.C.V. Par Value Actual Cost
14
Amount DueAnd Accrued
Dec. 31 ofCurrent YearOn Bond Not
In Default
15
Non-AdmittedDue andAccrued
16
Rate of
17
EffectiveRate of
18
How Paid
19
Gross AmountReceived
Paid forAccruedInterest
5499999 - Total - Issuer Obligations XXX XXX XXX
8299999 Totals XXX XXX XXX XXX
E15

ANNUAL STATEMENT FOR THE YEAR 2006 OF THE NIC Insurance Company
Schedule DB - Part A - Section 1
NONESchedule DB - Part A - Section 2
NONESchedule DB - Part A - Section 3
NONESchedule DB - Part B - Section 1
NONESchedule DB - Part B - Section 2
NONESchedule DB - Part B - Section 3
NONESchedule DB - Part C - Section 1
NONESchedule DB - Part C - Section 2
NONESchedule DB - Part C - Section 3
NONESchedule DB - Part D - Section 1
NONESchedule DB - Part D - Section 2
NONE
E16, E17, E18, E19, E20, E21

ANNUAL STATEMENT FOR THE YEAR 2006 OF THE NIC Insurance Company
Schedule DB - Part D - Section 3
NONESchedule DB - Part E - Section 1
NONE
E21, E22

ANNUAL STATEMENT FOR THE YEAR 2006 OF THE NIC Insurance Company
SCHEDULE E - PART 1 - CASH1
Depository
2
Code
3
Rate ofInterest
4
Amount of InterestReceived
DuringYear
5
Amount of InterestAccrued
December 31 of Current Year
6
Balance
7
*BBH Money Market Fund 51,027 1,156,795 XXX
XXXBrown Brothers Harriman 277 XXX 0199998 Deposits in depositories which do not exceed the
allowable limit in any one depository (See Instructions) - open depositories XXX XXX XXX0199999 Totals - Open Depositories XXX XXX 51,027 1,157,072 XXX
XXXXXXXXXXXXXXXXXXXXXXXXXXXXXXXXXXXXXXXXXXXXXXXXXXXXXXXXXXXXXXXXXXXXXXXXXXXXXXXXXXXXXXXXXXXXXXXXXXXXXXXXXXXXXXXXXXXXXXXXXXXXXXXXXXXXXXXXXXXXXXXXXXXXXXXXXXXXXXXXXXXXXXXXXXXXXXXXXXXXXXXXXXXXX
0399999 Total Cash on Deposit XXX XXX 51,027 1,157,072 XXX0499999 Cash in Company’s Office XXX XXX XXX XXX XXX0599999 Total Cash XXX XXX 51,027 1,157,072 XXX
TOTALS OF DEPOSITORY BALANCES ON THE LAST DAY OF EACH MONTH DURING THE CURRENT YEAR1. January (229) 4. April 236 7. July 542,182 10. October 835,802 2. February 21,685 5. May 1,231 8. August 1,367,647 11. November 1,375,645 3. March 2,937,905 6. June 330,818 9. September 1,254,208 12. December 1,157,072
E23

ANNUAL STATEMENT FOR THE YEAR 2006 OF THE NIC Insurance Company
SCHEDULE E - PART 2 CASH EQUIVALENTSShowing Investments owned December 31 of current year
1
CUSIPIdentification
2
Description
3
Code
4
Date Acquired
5
Rate of Interest
6
Maturity Date
7
Book/AdjustedCarrying Value
8
Amount of InterestDue & Accrued
9
Gross Investment Income
0199999 Total Cash Equivalents
E24

ANNUAL STATEMENT FOR THE YEAR 2006 OF THE NIC Insurance Company
SCHEDULE E PART 3 - SPECIAL DEPOSITS1 2
Deposits with the State of Domicile ForThe Benefit of All Policyholders All Other Special Deposits
States, Etc.Type ofDeposits
Purpose ofDeposits
3Book/AdjustedCarrying Value
4Fair
Value
5Book/AdjustedCarrying Value
6Fair
Value1. Alabama AL 2. Alaska AK 3. Arizona AZ 4. Arkansas AR 5. California CA 6. Colorado CO 7. Connecticut CT 8. Delaware DE 9. District of Columbia DC
10. Florida FL 11. Georgia GA 12. Hawaii HI 13. Idaho ID 14. Illinois IL 15. Indiana IN 16. Iowa IA 17. Kansas KS 18. Kentucky KY
19. Louisiana LA B
In trust for the security of the policyholders in the State of Louisiana 100,007 100,136
20. Maine ME 21. Maryland MD
22. Massachusetts MA B
In trust for the security of the policyholders in the State of Massachusetts 811,131 810,232
23. Michigan MI 24. Minnesota MN 25. Mississippi MS 26. Missouri MO 27. Montana MT 28. Nebraska NE 29. Nevada NV
30. New Hampshire NH
In trust for the security of the policyholders in the State of New Hampshire 533,551 540,155
31. New Jersey NJ 32. New Mexico NM B
33. New York NY BIn trust for the security of all policyholders 2,623,178 2,627,078
34. North Carolina NC 35. North Dakota ND 36. Ohio OH 37. Oklahoma OK 38. Oregon OR 39. Pennsylvania PA 40. Rhode Island RI 41. South Carolina SC 42. South Dakota SD 43. Tennessee TN 44. Texas TX 45. Utah UT 46. Vermont VT 47. Virginia VA 48. Washington WA 49. West Virginia WV 50. Wisconsin WI 51. Wyoming WY 52. American Samoa AS 53. Guam GU 54. Puerto Rico PR 55. US Virgin Islands VI 56. Northern Mariana Islands MP 57. Canada CN 58. Aggregate Other Alien OT XXX XXX59. Total XXX XXX 2,623,178 2,627,078 1,444,689 1,450,523
DETAILS OF WRITE-INS5801.5802.5803.5898. Summary of remaining write-ins for
Line 58 from overflow page XXX XXX5899. Totals (Lines 5801 through 5803 +
5898)(Line 58 above) XXX XXX
E25