property/elector statistics by area/pd/street · property/elector statistics by area/pd as of...
TRANSCRIPT
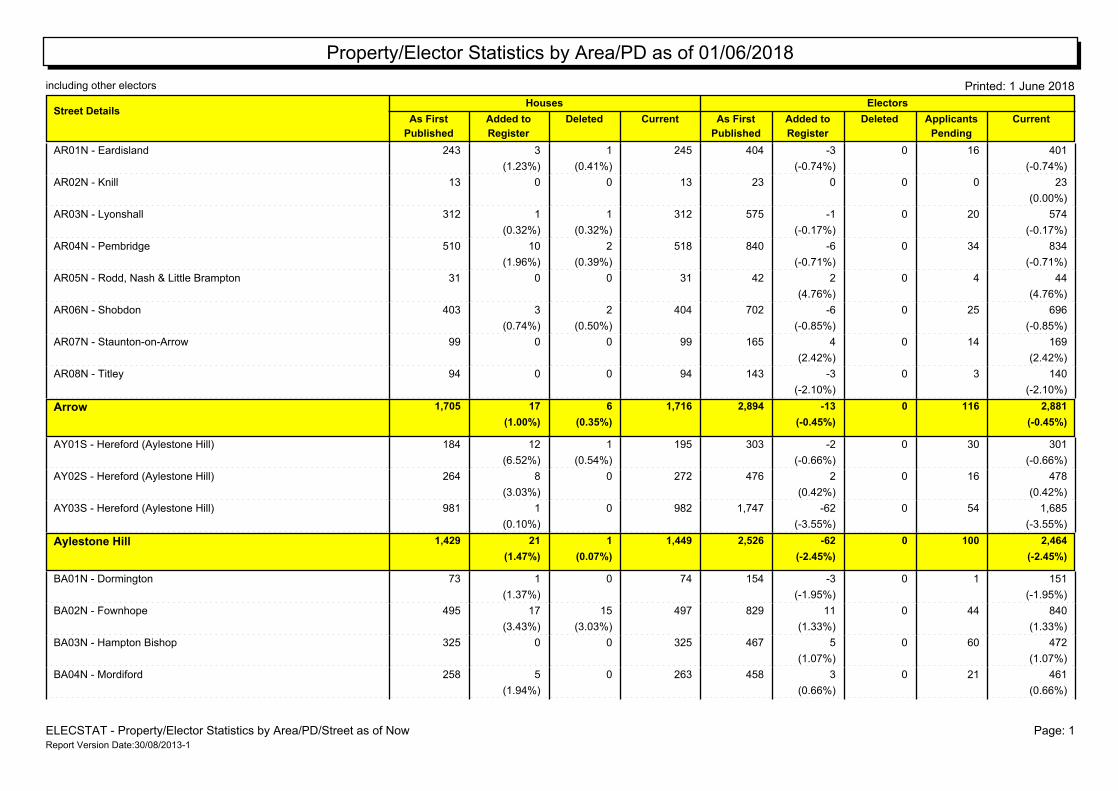
Property/Elector Statistics by Area/PD as of 01/06/2018
including other electors Printed: 1 June 2018
Houses Electors
As First
Published
Added to
Register
Deleted As First
Published
Added to
Register
Deleted Applicants
Pending
Street DetailsCurrent Current
AR01N - Eardisland 243 3 1 404 16 0-3 245 401
(1.23%) (0.41%) (-0.74%) (-0.74%)
AR02N - Knill 13 0 0 23 0 0 0 13 23
(0.00%)
AR03N - Lyonshall 312 1 1 575 20 0-1 312 574
(0.32%) (0.32%) (-0.17%) (-0.17%)
AR04N - Pembridge 510 10 2 840 34 0-6 518 834
(1.96%) (0.39%) (-0.71%) (-0.71%)
AR05N - Rodd, Nash & Little Brampton 31 0 0 42 4 0 2 31 44
(4.76%) (4.76%)
AR06N - Shobdon 403 3 2 702 25 0-6 404 696
(0.74%) (0.50%) (-0.85%) (-0.85%)
AR07N - Staunton-on-Arrow 99 0 0 165 14 0 4 99 169
(2.42%) (2.42%)
AR08N - Titley 94 0 0 143 3 0-3 94 140
(-2.10%) (-2.10%)
1,705 17 6 1,716 2,894 116 0-13 2,881Arrow
(1.00%) (0.35%) (-0.45%) (-0.45%)
AY01S - Hereford (Aylestone Hill) 184 12 1 303 30 0-2 195 301
(6.52%) (0.54%) (-0.66%) (-0.66%)
AY02S - Hereford (Aylestone Hill) 264 8 0 476 16 0 2 272 478
(3.03%) (0.42%) (0.42%)
AY03S - Hereford (Aylestone Hill) 981 1 0 1,747 54 0-62 982 1,685
(0.10%) (-3.55%) (-3.55%)
1,429 21 1 1,449 2,526 100 0-62 2,464Aylestone Hill
(1.47%) (0.07%) (-2.45%) (-2.45%)
BA01N - Dormington 73 1 0 154 1 0-3 74 151
(1.37%) (-1.95%) (-1.95%)
BA02N - Fownhope 495 17 15 829 44 0 11 497 840
(3.43%) (3.03%) (1.33%) (1.33%)
BA03N - Hampton Bishop 325 0 0 467 60 0 5 325 472
(1.07%) (1.07%)
BA04N - Mordiford 258 5 0 458 21 0 3 263 461
(1.94%) (0.66%) (0.66%)
ELECSTAT - Property/Elector Statistics by Area/PD/Street as of Now Page: 1Report Version Date:30/08/2013-1
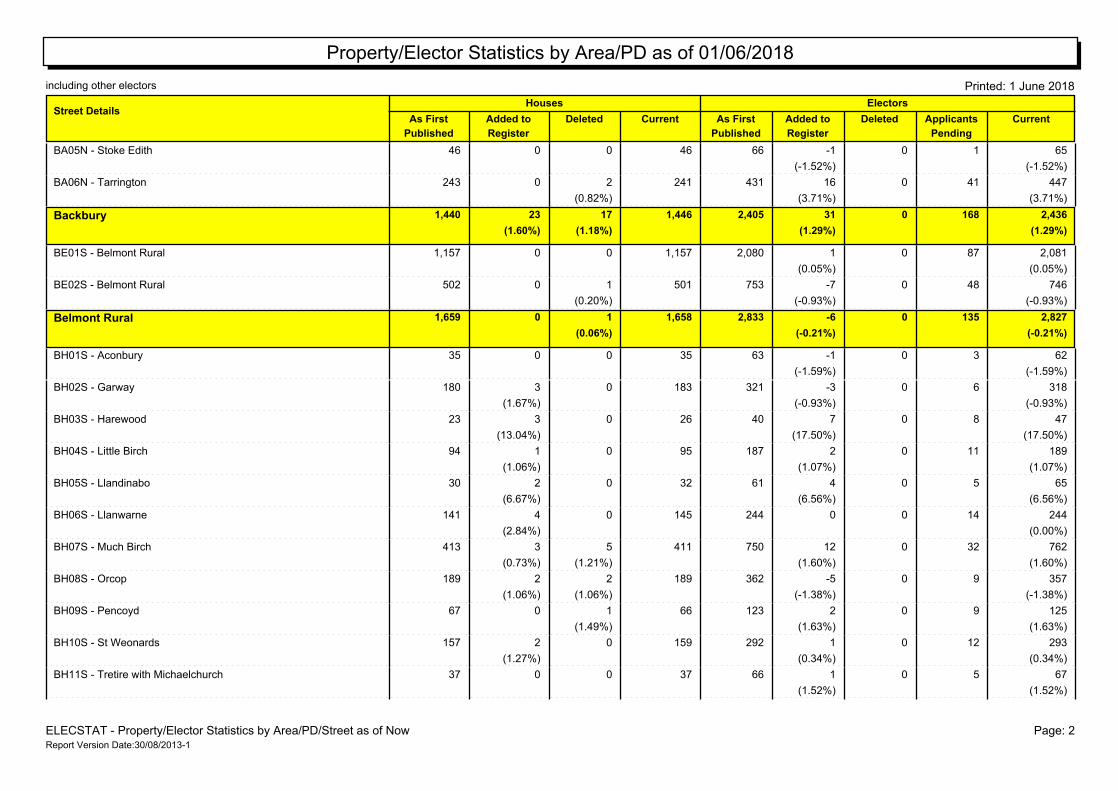
Property/Elector Statistics by Area/PD as of 01/06/2018
including other electors Printed: 1 June 2018
Houses Electors
As First
Published
Added to
Register
Deleted As First
Published
Added to
Register
Deleted Applicants
Pending
Street DetailsCurrent Current
BA05N - Stoke Edith 46 0 0 66 1 0-1 46 65
(-1.52%) (-1.52%)
BA06N - Tarrington 243 0 2 431 41 0 16 241 447
(0.82%) (3.71%) (3.71%)
1,440 23 17 1,446 2,405 168 0 31 2,436Backbury
(1.60%) (1.18%) (1.29%) (1.29%)
BE01S - Belmont Rural 1,157 0 0 2,080 87 0 1 1,157 2,081
(0.05%) (0.05%)
BE02S - Belmont Rural 502 0 1 753 48 0-7 501 746
(0.20%) (-0.93%) (-0.93%)
1,659 0 1 1,658 2,833 135 0-6 2,827Belmont Rural
(0.06%) (-0.21%) (-0.21%)
BH01S - Aconbury 35 0 0 63 3 0-1 35 62
(-1.59%) (-1.59%)
BH02S - Garway 180 3 0 321 6 0-3 183 318
(1.67%) (-0.93%) (-0.93%)
BH03S - Harewood 23 3 0 40 8 0 7 26 47
(13.04%) (17.50%) (17.50%)
BH04S - Little Birch 94 1 0 187 11 0 2 95 189
(1.06%) (1.07%) (1.07%)
BH05S - Llandinabo 30 2 0 61 5 0 4 32 65
(6.67%) (6.56%) (6.56%)
BH06S - Llanwarne 141 4 0 244 14 0 0 145 244
(2.84%) (0.00%)
BH07S - Much Birch 413 3 5 750 32 0 12 411 762
(0.73%) (1.21%) (1.60%) (1.60%)
BH08S - Orcop 189 2 2 362 9 0-5 189 357
(1.06%) (1.06%) (-1.38%) (-1.38%)
BH09S - Pencoyd 67 0 1 123 9 0 2 66 125
(1.49%) (1.63%) (1.63%)
BH10S - St Weonards 157 2 0 292 12 0 1 159 293
(1.27%) (0.34%) (0.34%)
BH11S - Tretire with Michaelchurch 37 0 0 66 5 0 1 37 67
(1.52%) (1.52%)
ELECSTAT - Property/Elector Statistics by Area/PD/Street as of Now Page: 2Report Version Date:30/08/2013-1

Property/Elector Statistics by Area/PD as of 01/06/2018
including other electors Printed: 1 June 2018
Houses Electors
As First
Published
Added to
Register
Deleted As First
Published
Added to
Register
Deleted Applicants
Pending
Street DetailsCurrent Current
1,366 20 8 1,378 2,509 114 0 20 2,529Birch
(1.46%) (0.59%) (0.80%) (0.80%)
BI01N - Croft & Yarpole 271 9 1 461 23 0 3 279 464
(3.32%) (0.37%) (0.65%) (0.65%)
BI02N - Eye, Moreton & Ashton 85 0 0 132 11 0 1 85 133
(0.76%) (0.76%)
BI03N - Eyton 50 1 0 108 3 0 0 51 108
(2.00%) (0.00%)
BI04N - Kingsland 492 31 3 846 52 0 0 520 846
(6.30%) (0.61%) (0.00%)
BI05N - Lucton 74 0 0 115 4 0-3 74 112
(-2.61%) (-2.61%)
BI06N - Luston 264 2 0 457 15 0 1 266 458
(0.76%) (0.22%) (0.22%)
BI07N - Orleton 403 1 1 735 30 0 4 403 739
(0.25%) (0.25%) (0.54%) (0.54%)
BI08N - Richards Castle 126 4 1 208 6 0-3 129 205
(3.17%) (0.79%) (-1.44%) (-1.44%)
1,765 48 6 1,807 3,062 144 0 3 3,065Bircher
(2.72%) (0.34%) (0.10%) (0.10%)
BM01N - Acton Beauchamp 76 0 0 151 4 0 4 76 155
(2.65%) (2.65%)
BM02N - Avenbury 101 0 2 185 8 0-1 99 184
(1.98%) (-0.54%) (-0.54%)
BM03N - Bishops Frome 264 2 0 519 16 0-7 266 512
(0.76%) (-1.35%) (-1.35%)
BM04N - Bishops Frome 106 1 1 181 8 0-8 106 173
(0.94%) (0.94%) (-4.42%) (-4.42%)
BM05N - Cradley 618 5 0 1,138 36 0 7 623 1,145
(0.81%) (0.62%) (0.62%)
BM06N - Cradley 147 1 2 292 5 0 3 146 295
(0.68%) (1.36%) (1.03%) (1.03%)
BM07N - Evesbatch 26 0 1 51 1 0 0 25 51
(3.85%) (0.00%)
ELECSTAT - Property/Elector Statistics by Area/PD/Street as of Now Page: 3Report Version Date:30/08/2013-1
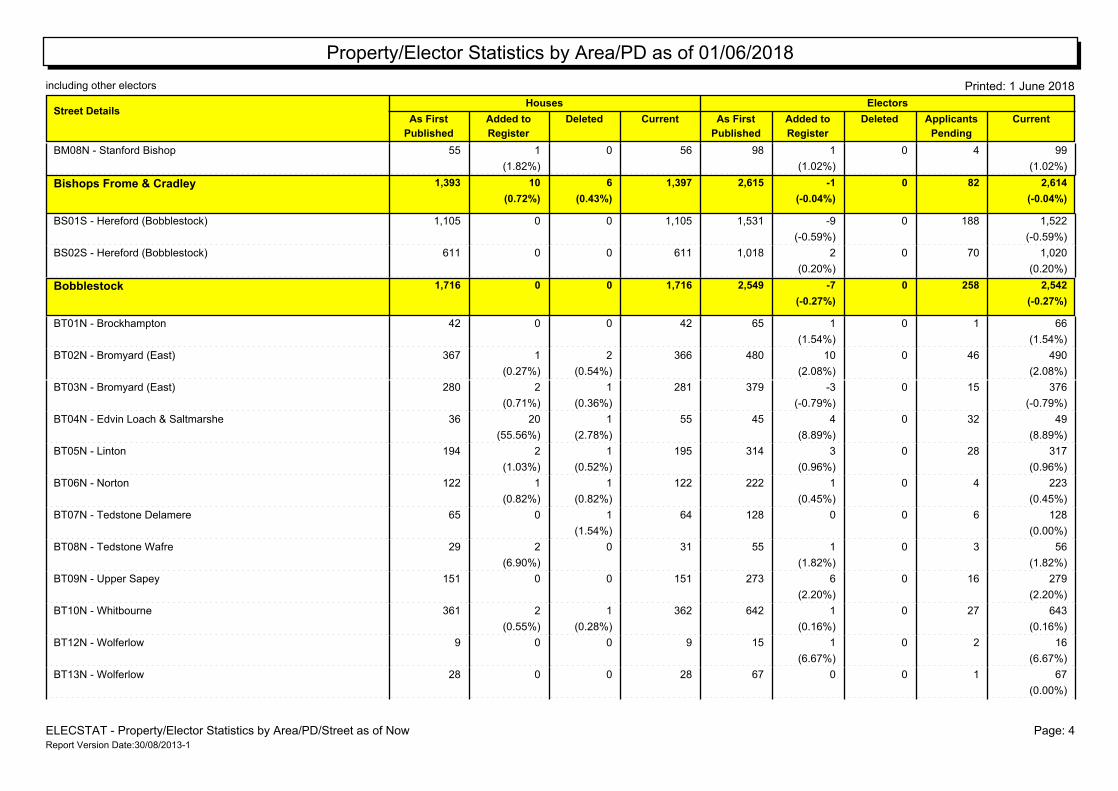
Property/Elector Statistics by Area/PD as of 01/06/2018
including other electors Printed: 1 June 2018
Houses Electors
As First
Published
Added to
Register
Deleted As First
Published
Added to
Register
Deleted Applicants
Pending
Street DetailsCurrent Current
BM08N - Stanford Bishop 55 1 0 98 4 0 1 56 99
(1.82%) (1.02%) (1.02%)
1,393 10 6 1,397 2,615 82 0-1 2,614Bishops Frome & Cradley
(0.72%) (0.43%) (-0.04%) (-0.04%)
BS01S - Hereford (Bobblestock) 1,105 0 0 1,531 188 0-9 1,105 1,522
(-0.59%) (-0.59%)
BS02S - Hereford (Bobblestock) 611 0 0 1,018 70 0 2 611 1,020
(0.20%) (0.20%)
1,716 0 0 1,716 2,549 258 0-7 2,542Bobblestock
(-0.27%) (-0.27%)
BT01N - Brockhampton 42 0 0 65 1 0 1 42 66
(1.54%) (1.54%)
BT02N - Bromyard (East) 367 1 2 480 46 0 10 366 490
(0.27%) (0.54%) (2.08%) (2.08%)
BT03N - Bromyard (East) 280 2 1 379 15 0-3 281 376
(0.71%) (0.36%) (-0.79%) (-0.79%)
BT04N - Edvin Loach & Saltmarshe 36 20 1 45 32 0 4 55 49
(55.56%) (2.78%) (8.89%) (8.89%)
BT05N - Linton 194 2 1 314 28 0 3 195 317
(1.03%) (0.52%) (0.96%) (0.96%)
BT06N - Norton 122 1 1 222 4 0 1 122 223
(0.82%) (0.82%) (0.45%) (0.45%)
BT07N - Tedstone Delamere 65 0 1 128 6 0 0 64 128
(1.54%) (0.00%)
BT08N - Tedstone Wafre 29 2 0 55 3 0 1 31 56
(6.90%) (1.82%) (1.82%)
BT09N - Upper Sapey 151 0 0 273 16 0 6 151 279
(2.20%) (2.20%)
BT10N - Whitbourne 361 2 1 642 27 0 1 362 643
(0.55%) (0.28%) (0.16%) (0.16%)
BT12N - Wolferlow 9 0 0 15 2 0 1 9 16
(6.67%) (6.67%)
BT13N - Wolferlow 28 0 0 67 1 0 0 28 67
(0.00%)
ELECSTAT - Property/Elector Statistics by Area/PD/Street as of Now Page: 4Report Version Date:30/08/2013-1
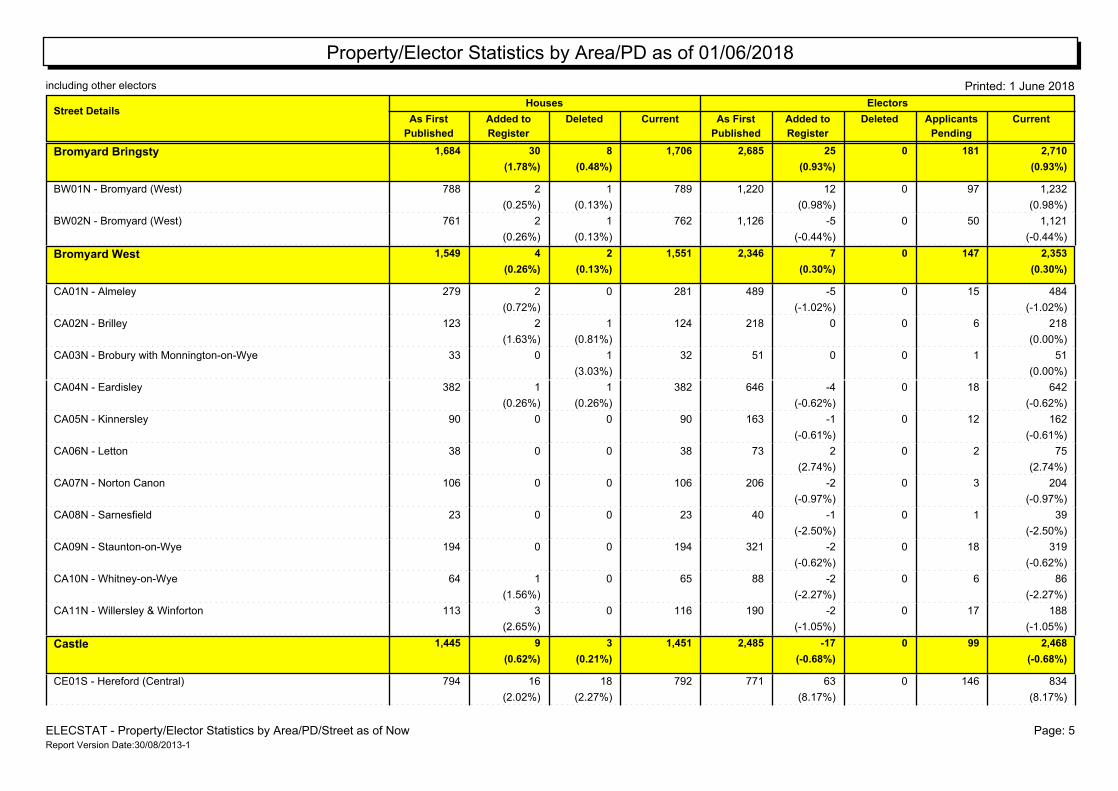
Property/Elector Statistics by Area/PD as of 01/06/2018
including other electors Printed: 1 June 2018
Houses Electors
As First
Published
Added to
Register
Deleted As First
Published
Added to
Register
Deleted Applicants
Pending
Street DetailsCurrent Current
1,684 30 8 1,706 2,685 181 0 25 2,710Bromyard Bringsty
(1.78%) (0.48%) (0.93%) (0.93%)
BW01N - Bromyard (West) 788 2 1 1,220 97 0 12 789 1,232
(0.25%) (0.13%) (0.98%) (0.98%)
BW02N - Bromyard (West) 761 2 1 1,126 50 0-5 762 1,121
(0.26%) (0.13%) (-0.44%) (-0.44%)
1,549 4 2 1,551 2,346 147 0 7 2,353Bromyard West
(0.26%) (0.13%) (0.30%) (0.30%)
CA01N - Almeley 279 2 0 489 15 0-5 281 484
(0.72%) (-1.02%) (-1.02%)
CA02N - Brilley 123 2 1 218 6 0 0 124 218
(1.63%) (0.81%) (0.00%)
CA03N - Brobury with Monnington-on-Wye 33 0 1 51 1 0 0 32 51
(3.03%) (0.00%)
CA04N - Eardisley 382 1 1 646 18 0-4 382 642
(0.26%) (0.26%) (-0.62%) (-0.62%)
CA05N - Kinnersley 90 0 0 163 12 0-1 90 162
(-0.61%) (-0.61%)
CA06N - Letton 38 0 0 73 2 0 2 38 75
(2.74%) (2.74%)
CA07N - Norton Canon 106 0 0 206 3 0-2 106 204
(-0.97%) (-0.97%)
CA08N - Sarnesfield 23 0 0 40 1 0-1 23 39
(-2.50%) (-2.50%)
CA09N - Staunton-on-Wye 194 0 0 321 18 0-2 194 319
(-0.62%) (-0.62%)
CA10N - Whitney-on-Wye 64 1 0 88 6 0-2 65 86
(1.56%) (-2.27%) (-2.27%)
CA11N - Willersley & Winforton 113 3 0 190 17 0-2 116 188
(2.65%) (-1.05%) (-1.05%)
1,445 9 3 1,451 2,485 99 0-17 2,468Castle
(0.62%) (0.21%) (-0.68%) (-0.68%)
CE01S - Hereford (Central) 794 16 18 771 146 0 63 792 834
(2.02%) (2.27%) (8.17%) (8.17%)
ELECSTAT - Property/Elector Statistics by Area/PD/Street as of Now Page: 5Report Version Date:30/08/2013-1
Property/Elector Statistics by Area/PD as of 01/06/2018
including other electors Printed: 1 June 2018
Houses Electors
As First
Published
Added to
Register
Deleted As First
Published
Added to
Register
Deleted Applicants
Pending
Street DetailsCurrent Current
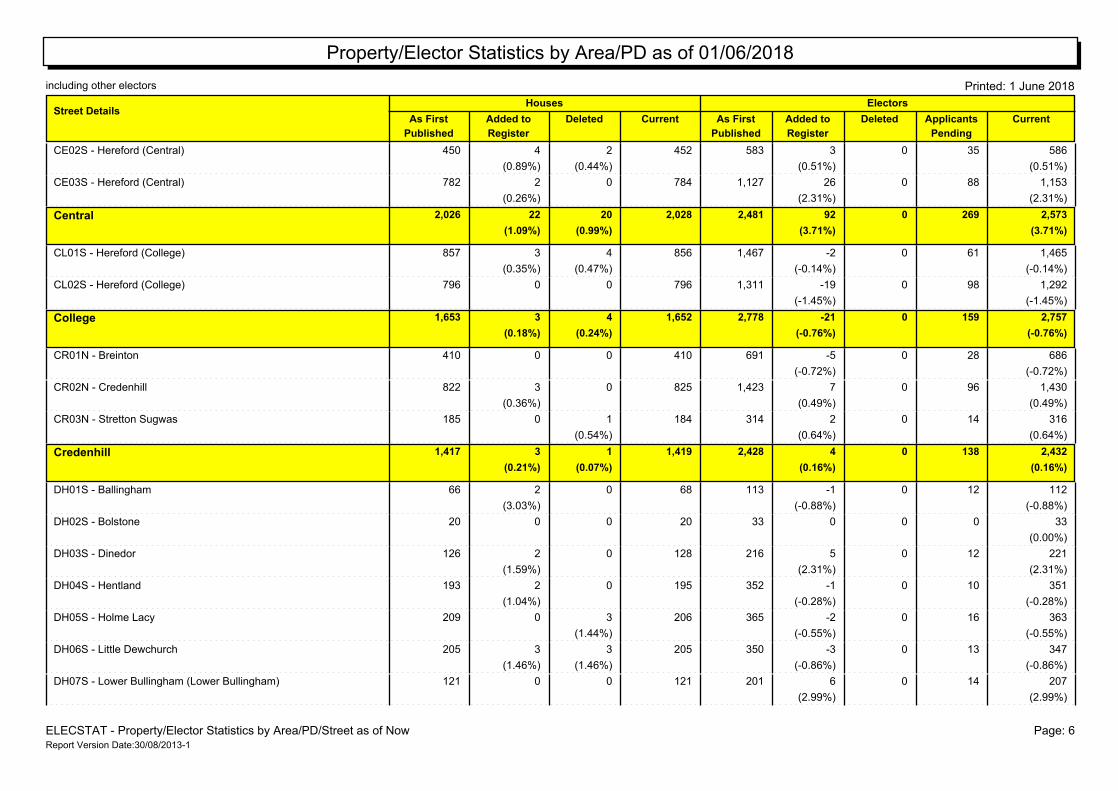
CE02S - Hereford (Central) 450 4 2 583 35 0 3 452 586
(0.89%) (0.44%) (0.51%) (0.51%)
CE03S - Hereford (Central) 782 2 0 1,127 88 0 26 784 1,153
(0.26%) (2.31%) (2.31%)
2,026 22 20 2,028 2,481 269 0 92 2,573Central
(1.09%) (0.99%) (3.71%) (3.71%)
CL01S - Hereford (College) 857 3 4 1,467 61 0-2 856 1,465
(0.35%) (0.47%) (-0.14%) (-0.14%)
CL02S - Hereford (College) 796 0 0 1,311 98 0-19 796 1,292
(-1.45%) (-1.45%)
1,653 3 4 1,652 2,778 159 0-21 2,757College
(0.18%) (0.24%) (-0.76%) (-0.76%)
CR01N - Breinton 410 0 0 691 28 0-5 410 686
(-0.72%) (-0.72%)
CR02N - Credenhill 822 3 0 1,423 96 0 7 825 1,430
(0.36%) (0.49%) (0.49%)
CR03N - Stretton Sugwas 185 0 1 314 14 0 2 184 316
(0.54%) (0.64%) (0.64%)
1,417 3 1 1,419 2,428 138 0 4 2,432Credenhill
(0.21%) (0.07%) (0.16%) (0.16%)
DH01S - Ballingham 66 2 0 113 12 0-1 68 112
(3.03%) (-0.88%) (-0.88%)
DH02S - Bolstone 20 0 0 33 0 0 0 20 33
(0.00%)
DH03S - Dinedor 126 2 0 216 12 0 5 128 221
(1.59%) (2.31%) (2.31%)
DH04S - Hentland 193 2 0 352 10 0-1 195 351
(1.04%) (-0.28%) (-0.28%)
DH05S - Holme Lacy 209 0 3 365 16 0-2 206 363
(1.44%) (-0.55%) (-0.55%)
DH06S - Little Dewchurch 205 3 3 350 13 0-3 205 347
(1.46%) (1.46%) (-0.86%) (-0.86%)
DH07S - Lower Bullingham (Lower Bullingham) 121 0 0 201 14 0 6 121 207
(2.99%) (2.99%)
ELECSTAT - Property/Elector Statistics by Area/PD/Street as of Now Page: 6Report Version Date:30/08/2013-1

Property/Elector Statistics by Area/PD as of 01/06/2018
including other electors Printed: 1 June 2018
Houses Electors
As First
Published
Added to
Register
Deleted As First
Published
Added to
Register
Deleted Applicants
Pending
Street DetailsCurrent Current
DH08S - Lower Bullingham (Withy Brook) 703 1 1 1,174 84 0 19 703 1,193
(0.14%) (0.14%) (1.62%) (1.62%)
1,643 10 7 1,646 2,804 161 0 23 2,827Dinedor Hill
(0.61%) (0.43%) (0.82%) (0.82%)
EH01S - Hereford (Eign Hill) 438 0 2 579 59 0 21 436 600
(0.46%) (3.63%) (3.63%)
EH02S - Hereford (Eign Hill) 667 3 0 1,007 69 0-17 670 990
(0.45%) (-1.69%) (-1.69%)
EH03S - Hereford (Eign Hill) 576 1 0 1,106 35 0-1 577 1,105
(0.17%) (-0.09%) (-0.09%)
1,681 4 2 1,683 2,692 163 0 3 2,695Eign Hill
(0.24%) (0.12%) (0.11%) (0.11%)
GN01S - Blakemere 37 0 0 71 6 0 5 37 76
(7.04%) (7.04%)
GN02S - Bredwardine 93 0 0 172 11 0 1 93 173
(0.58%) (0.58%)
GN03S - Clifford 246 1 0 422 18 0 2 247 424
(0.41%) (0.47%) (0.47%)
GN04S - Cusop 210 0 0 297 11 0 2 210 299
(0.67%) (0.67%)
GN05S - Dorstone 173 0 0 333 8 0-3 173 330
(-0.90%) (-0.90%)
GN06S - Moccas 57 0 0 80 3 0 3 57 83
(3.75%) (3.75%)
GN07S - Peterchurch 494 6 2 828 30 0-6 498 822
(1.21%) (0.40%) (-0.72%) (-0.72%)
GN08S - Preston-on-Wye 91 0 0 174 6 0 4 91 178
(2.30%) (2.30%)
GN09S - Tyberton 40 0 0 78 3 0 1 40 79
(1.28%) (1.28%)
1,441 7 2 1,446 2,455 96 0 9 2,464Golden Valley North
(0.49%) (0.14%) (0.37%) (0.37%)
GS01S - Abbeydore 138 2 0 237 9 0-1 140 236
(1.45%) (-0.42%) (-0.42%)
ELECSTAT - Property/Elector Statistics by Area/PD/Street as of Now Page: 7Report Version Date:30/08/2013-1

Property/Elector Statistics by Area/PD as of 01/06/2018
including other electors Printed: 1 June 2018
Houses Electors
As First
Published
Added to
Register
Deleted As First
Published
Added to
Register
Deleted Applicants
Pending
Street DetailsCurrent Current
GS02S - Bacton 34 1 0 49 0 0-3 35 46
(2.94%) (-6.12%) (-6.12%)
GS03S - Craswall 74 2 0 123 11 0 3 76 126
(2.70%) (2.44%) (2.44%)
GS04S - Dulas 28 2 0 58 6 0-5 30 53
(7.14%) (-8.62%) (-8.62%)
GS05S - Ewyas Harold 427 1 1 701 39 0-3 427 698
(0.23%) (0.23%) (-0.43%) (-0.43%)
GS06S - Kentchurch 145 1 3 205 12 0 4 143 209
(0.69%) (2.07%) (1.95%) (1.95%)
GS07S - Llancillo 17 0 0 28 0 0 0 17 28
(0.00%)
GS08S - Llanveynoe 51 4 0 88 0 0-3 55 85
(7.84%) (-3.41%) (-3.41%)
GS09S - Longtown 259 6 0 443 15 0 0 265 443
(2.32%) (0.00%)
GS10S - Michaelchurch Escley 84 1 1 152 3 0-4 84 148
(1.19%) (1.19%) (-2.63%) (-2.63%)
GS11S - Newton 62 3 2 120 4 0-1 63 119
(4.84%) (3.23%) (-0.83%) (-0.83%)
GS12S - Rowlstone 43 0 0 66 6 0 2 43 68
(3.03%) (3.03%)
GS13S - St Margarets 79 0 0 135 4 0-2 79 133
(-1.48%) (-1.48%)
GS14S - Turnastone 16 1 0 18 3 0 1 17 19
(6.25%) (5.56%) (5.56%)
GS15S - Vowchurch 81 2 2 127 5 0 3 81 130
(2.47%) (2.47%) (2.36%) (2.36%)
GS16S - Walterstone 39 3 0 82 2 0 0 42 82
(7.69%) (0.00%)
1,577 29 9 1,597 2,632 119 0-9 2,623Golden Valley South
(1.84%) (0.57%) (-0.34%) (-0.34%)
GY01S - Hereford (Greyfriars) 885 0 0 1,397 86 0 5 885 1,402
(0.36%) (0.36%)
GY02S - Hereford (Greyfriars) 1,022 0 1 1,384 134 0 24 1,021 1,408
ELECSTAT - Property/Elector Statistics by Area/PD/Street as of Now Page: 8Report Version Date:30/08/2013-1

Property/Elector Statistics by Area/PD as of 01/06/2018
including other electors Printed: 1 June 2018
Houses Electors
As First
Published
Added to
Register
Deleted As First
Published
Added to
Register
Deleted Applicants
Pending
Street DetailsCurrent Current
(0.10%) (1.73%) (1.73%)
1,907 0 1 1,906 2,781 220 0 29 2,810Greyfriars
(0.05%) (1.04%) (1.04%)
HG01N - Bartestree 212 5 1 273 32 0 17 216 290
(2.36%) (0.47%) (6.23%) (6.23%)
HG02N - Lugwardine 688 84 0 1,312 50 0 2 772 1,314
(12.21%) (0.15%) (0.15%)
HG03N - Preston Wynne 68 3 1 123 9 0-2 70 121
(4.41%) (1.47%) (-1.63%) (-1.63%)
HG04N - Westhide 31 0 0 63 2 0 0 31 63
(0.00%)
HG05N - Withington 689 3 9 1,074 64 0-5 683 1,069
(0.44%) (1.31%) (-0.47%) (-0.47%)
1,688 95 11 1,772 2,845 157 0 12 2,857Hagley
(5.63%) (0.65%) (0.42%) (0.42%)
HM01N - Bodenham 526 6 0 888 69 0 16 532 904
(1.14%) (1.80%) (1.80%)
HM02N - Bredenbury 63 2 0 105 9 0 3 65 108
(3.17%) (2.86%) (2.86%)
HM03N - Collington 34 0 0 57 2 0 1 34 58
(1.75%) (1.75%)
HM04N - Docklow & Hampton Wafre 63 0 0 112 5 0 0 63 112
(0.00%)
HM05N - Edwyn Ralph 90 0 0 173 1 0 1 90 174
(0.58%) (0.58%)
HM06N - Ford & Stoke Prior 166 2 1 257 11 0 2 167 259
(1.20%) (0.60%) (0.78%) (0.78%)
HM07N - Grendon Bishop 47 0 0 82 1 0 0 47 82
(0.00%)
HM08N - Hampton Charles 21 0 0 38 0 0-1 21 37
(-2.63%) (-2.63%)
HM09N - Hatfield & Newhampton 71 1 0 125 6 0 5 72 130
(1.41%) (4.00%) (4.00%)
HM10N - Humber 128 2 0 255 7 0-1 130 254
ELECSTAT - Property/Elector Statistics by Area/PD/Street as of Now Page: 9Report Version Date:30/08/2013-1

Property/Elector Statistics by Area/PD as of 01/06/2018
including other electors Printed: 1 June 2018
Houses Electors
As First
Published
Added to
Register
Deleted As First
Published
Added to
Register
Deleted Applicants
Pending
Street DetailsCurrent Current
(1.56%) (-0.39%) (-0.39%)
HM11N - Little Cowarne 54 0 0 100 7 0 0 54 100
(0.00%)
HM12N - Pencombe with Grendon Warren 139 0 0 239 4 0-5 139 234
(-2.09%) (-2.09%)
HM13N - Pudleston 89 0 0 152 5 0 2 89 154
(1.32%) (1.32%)
HM14N - Thornbury 56 0 0 106 1 0 1 56 107
(0.94%) (0.94%)
HM15N - Wacton 48 0 0 97 1 0 0 48 97
(0.00%)
1,595 13 1 1,607 2,786 129 0 24 2,810Hampton
(0.82%) (0.06%) (0.86%) (0.86%)
HN01S - Hereford (Hinton & Hunderton) 736 0 2 1,111 50 0-45 734 1,066
(0.27%) (-4.05%) (-4.05%)
HN02S - Hereford (Hinton & Hunderton) 434 35 0 502 64 0 6 469 508
(8.06%) (1.20%) (1.20%)
HN03S - Hereford (Hinton & Hunderton) 746 5 1 1,155 70 0-41 750 1,114
(0.67%) (0.13%) (-3.55%) (-3.55%)
1,916 40 3 1,953 2,768 184 0-80 2,688Hinton & Hunderton
(2.09%) (0.16%) (-2.89%) (-2.89%)
HO01N - Holmer & Shelwick 1,045 7 1 1,673 83 0 4 1,051 1,677
(0.67%) (0.10%) (0.24%) (0.24%)
HO02S - Hereford (Victoria Park) 545 14 0 910 59 0 7 559 917
(2.57%) (0.77%) (0.77%)
HO03S - Hereford (Racecourse) 195 0 0 310 14 0 3 195 313
(0.97%) (0.97%)
1,785 21 1 1,805 2,893 156 0 14 2,907Holmer
(1.18%) (0.06%) (0.48%) (0.48%)
HP01N - Bosbury 335 2 3 604 35 0 4 334 608
(0.60%) (0.90%) (0.66%) (0.66%)
HP02N - Coddington 43 1 1 94 4 0 0 43 94
(2.33%) (2.33%) (0.00%)
HP03N - Colwall 354 0 1 602 25 0 11 353 613
ELECSTAT - Property/Elector Statistics by Area/PD/Street as of Now Page: 10Report Version Date:30/08/2013-1

Property/Elector Statistics by Area/PD as of 01/06/2018
including other electors Printed: 1 June 2018
Houses Electors
As First
Published
Added to
Register
Deleted As First
Published
Added to
Register
Deleted Applicants
Pending
Street DetailsCurrent Current
(0.28%) (1.83%) (1.83%)
HP04N - Colwall 838 13 5 1,395 73 0 8 846 1,403
(1.55%) (0.60%) (0.57%) (0.57%)
HP05N - Mathon 139 1 1 243 4 0-1 139 242
(0.72%) (0.72%) (-0.41%) (-0.41%)
1,709 17 11 1,715 2,938 141 0 22 2,960Hope End
(0.99%) (0.64%) (0.75%) (0.75%)
KB01S - Ganarew 53 0 2 88 2 0-4 51 84
(3.77%) (-4.55%) (-4.55%)
KB02S - Goodrich 246 2 0 450 15 0-7 248 443
(0.81%) (-1.56%) (-1.56%)
KB03S - Walford 638 5 4 1,143 49 0-6 639 1,137
(0.78%) (0.63%) (-0.52%) (-0.52%)
KB04S - Welsh Bicknor 16 0 0 14 2 0 1 16 15
(7.14%) (7.14%)
KB05S - Whitchurch 480 2 5 801 38 0-5 477 796
(0.42%) (1.04%) (-0.62%) (-0.62%)
1,433 9 11 1,431 2,496 106 0-21 2,475Kerne Bridge
(0.63%) (0.77%) (-0.84%) (-0.84%)
KG01S - Hereford (Kings Acre) 802 0 0 1,395 60 0-39 802 1,356
(-2.80%) (-2.80%)
KG02S - Hereford (Kings Acre) 732 1 0 1,308 52 0-4 733 1,304
(0.14%) (-0.31%) (-0.31%)
1,534 1 0 1,535 2,703 112 0-43 2,660Kings Acre
(0.07%) (-1.59%) (-1.59%)
KT01N - Huntington 53 0 0 93 0 0-2 53 91
(-2.15%) (-2.15%)
KT02N - Kington 1,407 4 4 2,003 125 0 23 1,407 2,026
(0.28%) (0.28%) (1.15%) (1.15%)
KT03N - Kington Rural 110 1 0 192 8 0-1 111 191
(0.91%) (-0.52%) (-0.52%)
KT04N - Kington Rural 151 2 0 268 15 0 3 153 271
(1.32%) (1.12%) (1.12%)
KT05N - Lower Harpton 13 0 0 20 0 0-3 13 17
ELECSTAT - Property/Elector Statistics by Area/PD/Street as of Now Page: 11Report Version Date:30/08/2013-1
Property/Elector Statistics by Area/PD as of 01/06/2018
including other electors Printed: 1 June 2018
Houses Electors
As First
Published
Added to
Register
Deleted As First
Published
Added to
Register
Deleted Applicants
Pending
Street DetailsCurrent Current
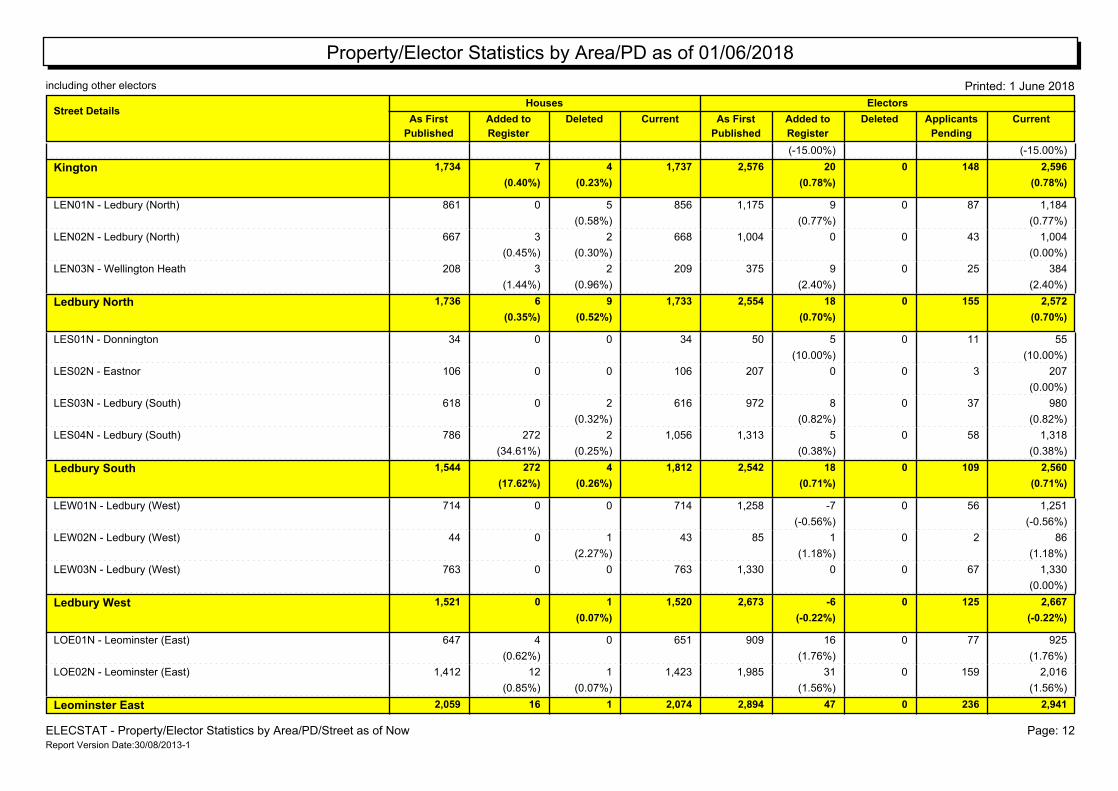
(-15.00%) (-15.00%)
1,734 7 4 1,737 2,576 148 0 20 2,596Kington
(0.40%) (0.23%) (0.78%) (0.78%)
LEN01N - Ledbury (North) 861 0 5 1,175 87 0 9 856 1,184
(0.58%) (0.77%) (0.77%)
LEN02N - Ledbury (North) 667 3 2 1,004 43 0 0 668 1,004
(0.45%) (0.30%) (0.00%)
LEN03N - Wellington Heath 208 3 2 375 25 0 9 209 384
(1.44%) (0.96%) (2.40%) (2.40%)
1,736 6 9 1,733 2,554 155 0 18 2,572Ledbury North
(0.35%) (0.52%) (0.70%) (0.70%)
LES01N - Donnington 34 0 0 50 11 0 5 34 55
(10.00%) (10.00%)
LES02N - Eastnor 106 0 0 207 3 0 0 106 207
(0.00%)
LES03N - Ledbury (South) 618 0 2 972 37 0 8 616 980
(0.32%) (0.82%) (0.82%)
LES04N - Ledbury (South) 786 272 2 1,313 58 0 5 1,056 1,318
(34.61%) (0.25%) (0.38%) (0.38%)
1,544 272 4 1,812 2,542 109 0 18 2,560Ledbury South
(17.62%) (0.26%) (0.71%) (0.71%)
LEW01N - Ledbury (West) 714 0 0 1,258 56 0-7 714 1,251
(-0.56%) (-0.56%)
LEW02N - Ledbury (West) 44 0 1 85 2 0 1 43 86
(2.27%) (1.18%) (1.18%)
LEW03N - Ledbury (West) 763 0 0 1,330 67 0 0 763 1,330
(0.00%)
1,521 0 1 1,520 2,673 125 0-6 2,667Ledbury West
(0.07%) (-0.22%) (-0.22%)
LOE01N - Leominster (East) 647 4 0 909 77 0 16 651 925
(0.62%) (1.76%) (1.76%)
LOE02N - Leominster (East) 1,412 12 1 1,985 159 0 31 1,423 2,016
(0.85%) (0.07%) (1.56%) (1.56%)
2,059 16 1 2,074 2,894 236 0 47 2,941Leominster East
ELECSTAT - Property/Elector Statistics by Area/PD/Street as of Now Page: 12Report Version Date:30/08/2013-1

Property/Elector Statistics by Area/PD as of 01/06/2018
including other electors Printed: 1 June 2018
Houses Electors
As First
Published
Added to
Register
Deleted As First
Published
Added to
Register
Deleted Applicants
Pending
Street DetailsCurrent Current
(0.78%) (0.05%) (1.62%) (1.62%)
LON01N - Brimfield 352 0 1 606 18 0-18 351 588
(0.28%) (-2.97%) (-2.97%)
LON02N - Kimbolton 223 3 3 406 14 0-1 223 405
(1.35%) (1.35%) (-0.25%) (-0.25%)
LON03N - Leominster (North) 890 0 0 1,316 70 0-4 890 1,312
(-0.30%) (-0.30%)
LON04N - Leysters 60 0 0 116 5 0-2 60 114
(-1.72%) (-1.72%)
LON05N - Little Hereford 189 1 2 327 10 0-3 188 324
(0.53%) (1.06%) (-0.92%) (-0.92%)
LON06N - Middleton-on-the-Hill 110 0 0 214 12 0-1 110 213
(-0.47%) (-0.47%)
1,824 4 6 1,822 2,985 129 0-29 2,956Leominster North & Rural
(0.22%) (0.33%) (-0.97%) (-0.97%)
LOS01N - Leominster (South) 738 0 4 1,222 47 0-18 734 1,204
(0.54%) (-1.47%) (-1.47%)
LOS02N - Leominster (South) 661 4 1 977 71 0-4 664 973
(0.61%) (0.15%) (-0.41%) (-0.41%)
LOS03N - Leominster (South) 134 0 2 229 17 0 3 132 232
(1.49%) (1.31%) (1.31%)
LOS04N - Monkland & Stretford 83 5 0 151 6 0-1 88 150
(6.02%) (-0.66%) (-0.66%)
1,616 9 7 1,618 2,579 141 0-20 2,559Leominster South
(0.56%) (0.43%) (-0.78%) (-0.78%)
LOW01N - Leominster (West) 175 0 0 293 14 0 3 175 296
(1.02%) (1.02%)
LOW02N - Leominster (West) 1,112 419 8 1,865 108 0 30 1,523 1,895
(37.68%) (0.72%) (1.61%) (1.61%)
1,287 419 8 1,698 2,158 122 0 33 2,191Leominster West
(32.56%) (0.62%) (1.53%) (1.53%)
LR01S - Bridstow 413 1 1 715 42 0 9 413 724
(0.24%) (0.24%) (1.26%) (1.26%)
LR02S - Llangarron 244 1 0 464 21 0-5 245 459
ELECSTAT - Property/Elector Statistics by Area/PD/Street as of Now Page: 13Report Version Date:30/08/2013-1

Property/Elector Statistics by Area/PD as of 01/06/2018
including other electors Printed: 1 June 2018
Houses Electors
As First
Published
Added to
Register
Deleted As First
Published
Added to
Register
Deleted Applicants
Pending
Street DetailsCurrent Current
(0.41%) (-1.08%) (-1.08%)
LR03S - Llangarron 234 3 2 415 20 0 2 235 417
(1.28%) (0.85%) (0.48%) (0.48%)
LR04S - Llanrothal 55 1 0 98 3 0 1 56 99
(1.82%) (1.02%) (1.02%)
LR05S - Marstow 172 0 0 303 29 0-1 172 302
(-0.33%) (-0.33%)
LR06S - Peterstow 208 1 2 365 19 0 6 207 371
(0.48%) (0.96%) (1.64%) (1.64%)
LR07S - Sellack 119 0 0 224 9 0 1 119 225
(0.45%) (0.45%)
LR08S - Welsh Newton 97 4 1 179 2 0-2 100 177
(4.12%) (1.03%) (-1.12%) (-1.12%)
1,542 11 6 1,547 2,763 145 0 11 2,774Llangarron
(0.71%) (0.39%) (0.40%) (0.40%)
MT01N - Adforton 67 0 0 111 0 0-3 67 108
(-2.70%) (-2.70%)
MT02N - Aymestrey 174 0 0 294 21 0 3 174 297
(1.02%) (1.02%)
MT03N - Brampton Bryan 65 0 1 103 7 0 0 64 103
(1.54%) (0.00%)
MT04N - Buckton & Coxall 38 0 0 58 0 0-1 38 57
(-1.72%) (-1.72%)
MT05N - Burrington 35 0 0 66 2 0-3 35 63
(-4.55%) (-4.55%)
MT06N - Byton 38 0 0 68 0 0-1 38 67
(-1.47%) (-1.47%)
MT07N - Combe 21 0 0 38 0 0-1 21 37
(-2.63%) (-2.63%)
MT08N - Downton 29 0 0 41 0 0-4 29 37
(-9.76%) (-9.76%)
MT09N - Elton 28 0 0 52 0 0 0 28 52
(0.00%)
MT10N - Kinsham 32 0 1 57 1 0-3 31 54
(3.13%) (-5.26%) (-5.26%)
ELECSTAT - Property/Elector Statistics by Area/PD/Street as of Now Page: 14Report Version Date:30/08/2013-1
Property/Elector Statistics by Area/PD as of 01/06/2018
including other electors Printed: 1 June 2018
Houses Electors
As First
Published
Added to
Register
Deleted As First
Published
Added to
Register
Deleted Applicants
Pending
Street DetailsCurrent Current
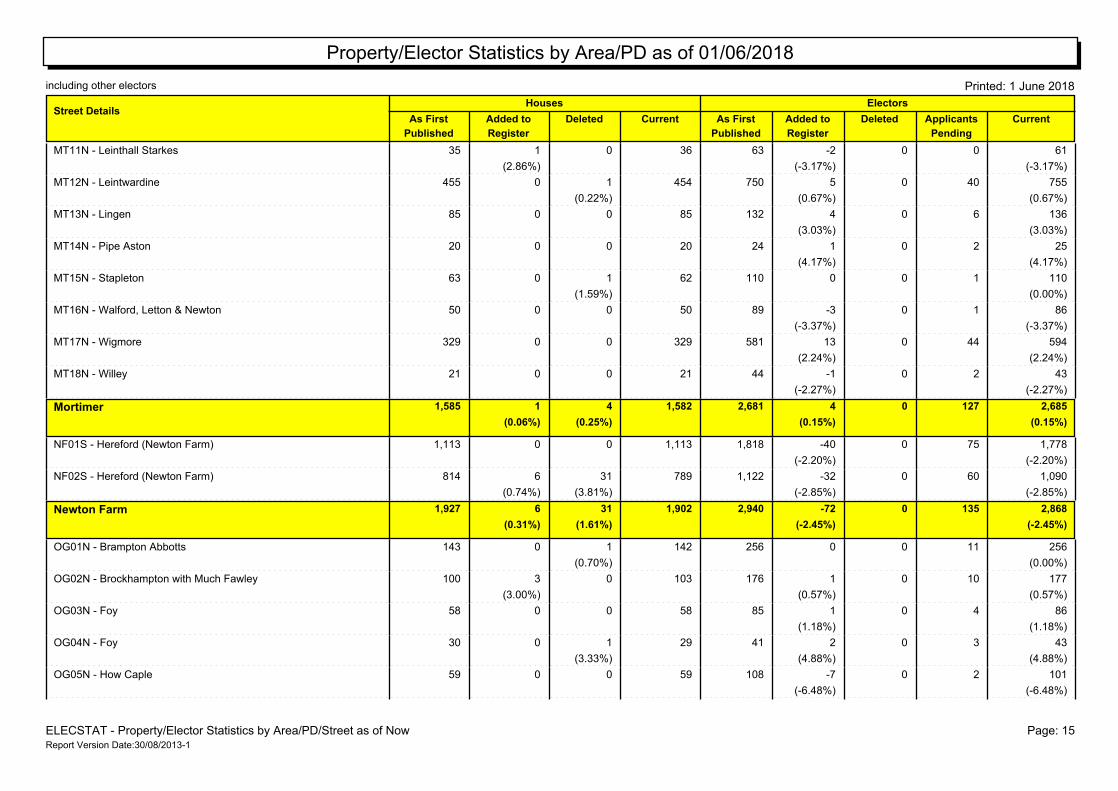
MT11N - Leinthall Starkes 35 1 0 63 0 0-2 36 61
(2.86%) (-3.17%) (-3.17%)
MT12N - Leintwardine 455 0 1 750 40 0 5 454 755
(0.22%) (0.67%) (0.67%)
MT13N - Lingen 85 0 0 132 6 0 4 85 136
(3.03%) (3.03%)
MT14N - Pipe Aston 20 0 0 24 2 0 1 20 25
(4.17%) (4.17%)
MT15N - Stapleton 63 0 1 110 1 0 0 62 110
(1.59%) (0.00%)
MT16N - Walford, Letton & Newton 50 0 0 89 1 0-3 50 86
(-3.37%) (-3.37%)
MT17N - Wigmore 329 0 0 581 44 0 13 329 594
(2.24%) (2.24%)
MT18N - Willey 21 0 0 44 2 0-1 21 43
(-2.27%) (-2.27%)
1,585 1 4 1,582 2,681 127 0 4 2,685Mortimer
(0.06%) (0.25%) (0.15%) (0.15%)
NF01S - Hereford (Newton Farm) 1,113 0 0 1,818 75 0-40 1,113 1,778
(-2.20%) (-2.20%)
NF02S - Hereford (Newton Farm) 814 6 31 1,122 60 0-32 789 1,090
(0.74%) (3.81%) (-2.85%) (-2.85%)
1,927 6 31 1,902 2,940 135 0-72 2,868Newton Farm
(0.31%) (1.61%) (-2.45%) (-2.45%)
OG01N - Brampton Abbotts 143 0 1 256 11 0 0 142 256
(0.70%) (0.00%)
OG02N - Brockhampton with Much Fawley 100 3 0 176 10 0 1 103 177
(3.00%) (0.57%) (0.57%)
OG03N - Foy 58 0 0 85 4 0 1 58 86
(1.18%) (1.18%)
OG04N - Foy 30 0 1 41 3 0 2 29 43
(3.33%) (4.88%) (4.88%)
OG05N - How Caple 59 0 0 108 2 0-7 59 101
(-6.48%) (-6.48%)
ELECSTAT - Property/Elector Statistics by Area/PD/Street as of Now Page: 15Report Version Date:30/08/2013-1
Property/Elector Statistics by Area/PD as of 01/06/2018
including other electors Printed: 1 June 2018
Houses Electors
As First
Published
Added to
Register
Deleted As First
Published
Added to
Register
Deleted Applicants
Pending
Street DetailsCurrent Current
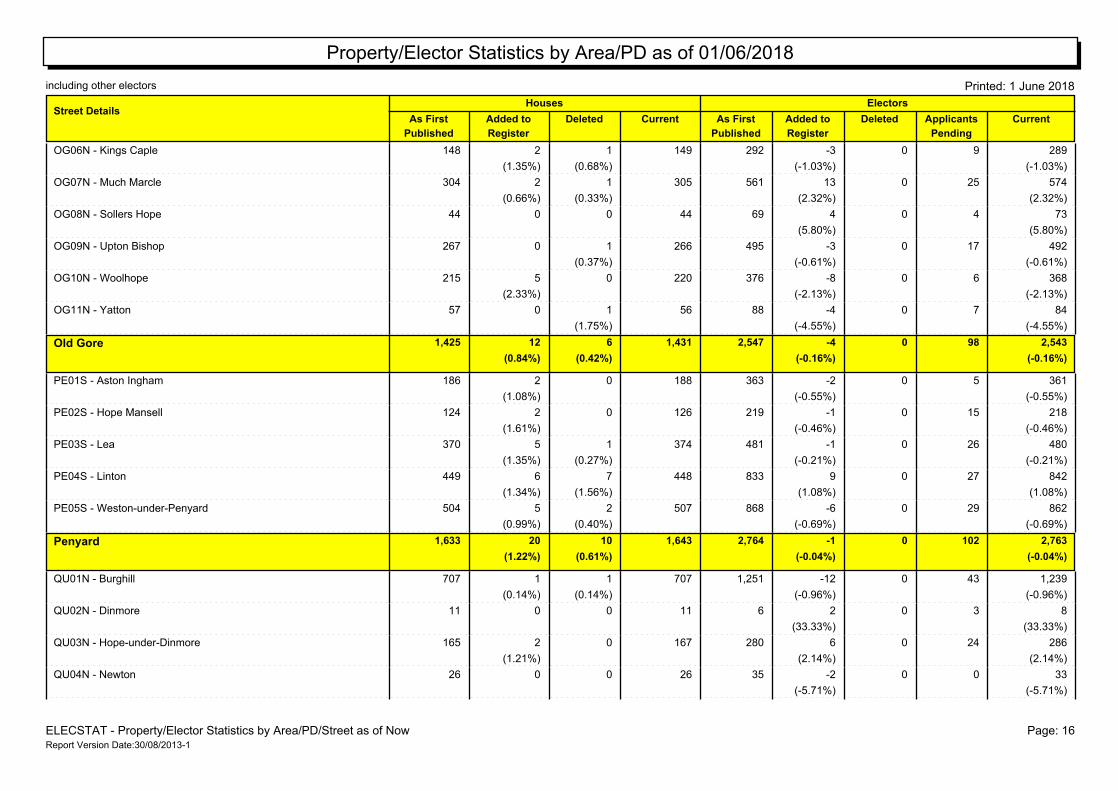
OG06N - Kings Caple 148 2 1 292 9 0-3 149 289
(1.35%) (0.68%) (-1.03%) (-1.03%)
OG07N - Much Marcle 304 2 1 561 25 0 13 305 574
(0.66%) (0.33%) (2.32%) (2.32%)
OG08N - Sollers Hope 44 0 0 69 4 0 4 44 73
(5.80%) (5.80%)
OG09N - Upton Bishop 267 0 1 495 17 0-3 266 492
(0.37%) (-0.61%) (-0.61%)
OG10N - Woolhope 215 5 0 376 6 0-8 220 368
(2.33%) (-2.13%) (-2.13%)
OG11N - Yatton 57 0 1 88 7 0-4 56 84
(1.75%) (-4.55%) (-4.55%)
1,425 12 6 1,431 2,547 98 0-4 2,543Old Gore
(0.84%) (0.42%) (-0.16%) (-0.16%)
PE01S - Aston Ingham 186 2 0 363 5 0-2 188 361
(1.08%) (-0.55%) (-0.55%)
PE02S - Hope Mansell 124 2 0 219 15 0-1 126 218
(1.61%) (-0.46%) (-0.46%)
PE03S - Lea 370 5 1 481 26 0-1 374 480
(1.35%) (0.27%) (-0.21%) (-0.21%)
PE04S - Linton 449 6 7 833 27 0 9 448 842
(1.34%) (1.56%) (1.08%) (1.08%)
PE05S - Weston-under-Penyard 504 5 2 868 29 0-6 507 862
(0.99%) (0.40%) (-0.69%) (-0.69%)
1,633 20 10 1,643 2,764 102 0-1 2,763Penyard
(1.22%) (0.61%) (-0.04%) (-0.04%)
QU01N - Burghill 707 1 1 1,251 43 0-12 707 1,239
(0.14%) (0.14%) (-0.96%) (-0.96%)
QU02N - Dinmore 11 0 0 6 3 0 2 11 8
(33.33%) (33.33%)
QU03N - Hope-under-Dinmore 165 2 0 280 24 0 6 167 286
(1.21%) (2.14%) (2.14%)
QU04N - Newton 26 0 0 35 0 0-2 26 33
(-5.71%) (-5.71%)
ELECSTAT - Property/Elector Statistics by Area/PD/Street as of Now Page: 16Report Version Date:30/08/2013-1

Property/Elector Statistics by Area/PD as of 01/06/2018
including other electors Printed: 1 June 2018
Houses Electors
As First
Published
Added to
Register
Deleted As First
Published
Added to
Register
Deleted Applicants
Pending
Street DetailsCurrent Current
QU05N - Pipe & Lyde 138 0 0 293 7 0-1 138 292
(-0.34%) (-0.34%)
QU06N - Wellington 467 0 0 850 27 0-7 467 843
(-0.82%) (-0.82%)
1,514 3 1 1,516 2,715 104 0-14 2,701Queenswood
(0.20%) (0.07%) (-0.52%) (-0.52%)
RH01S - Hereford (Red Hill) 1,018 1 1 1,662 74 0 4 1,018 1,666
(0.10%) (0.10%) (0.24%) (0.24%)
RH02S - Hereford (Red Hill) 731 2 0 1,277 47 0-15 733 1,262
(0.27%) (-1.17%) (-1.17%)
1,749 3 1 1,751 2,939 121 0-11 2,928Red Hill
(0.17%) (0.06%) (-0.37%) (-0.37%)
ROE01S - Ross (East) 1,062 3 9 1,364 140 0 38 1,056 1,402
(0.28%) (0.85%) (2.79%) (2.79%)
ROE02S - Ross (East) 736 2 1 1,256 56 0 10 737 1,266
(0.27%) (0.14%) (0.80%) (0.80%)
ROE03S - Ross (East) 191 0 1 318 10 0 0 190 318
(0.52%) (0.00%)
1,989 5 11 1,983 2,938 206 0 48 2,986Ross East
(0.25%) (0.55%) (1.63%) (1.63%)
RON01S - Ross (North) 498 0 1 898 40 0 10 497 908
(0.20%) (1.11%) (1.11%)
RON02S - Ross (North) 873 0 0 1,344 83 0 12 873 1,356
(0.89%) (0.89%)
RON03S - Ross (North) 294 1 0 541 27 0 8 295 549
(0.34%) (1.48%) (1.48%)
1,665 1 1 1,665 2,783 150 0 30 2,813Ross North
(0.06%) (0.06%) (1.08%) (1.08%)
ROW01S - Ross (West) 895 1 0 1,602 73 0 5 896 1,607
(0.11%) (0.31%) (0.31%)
ROW02S - Ross (West) 844 3 5 1,084 91 0 3 842 1,087
(0.36%) (0.59%) (0.28%) (0.28%)
1,739 4 5 1,738 2,686 164 0 8 2,694Ross West
(0.23%) (0.29%) (0.30%) (0.30%)
ELECSTAT - Property/Elector Statistics by Area/PD/Street as of Now Page: 17Report Version Date:30/08/2013-1
Property/Elector Statistics by Area/PD as of 01/06/2018
including other electors Printed: 1 June 2018
Houses Electors
As First
Published
Added to
Register
Deleted As First
Published
Added to
Register
Deleted Applicants
Pending
Street DetailsCurrent Current
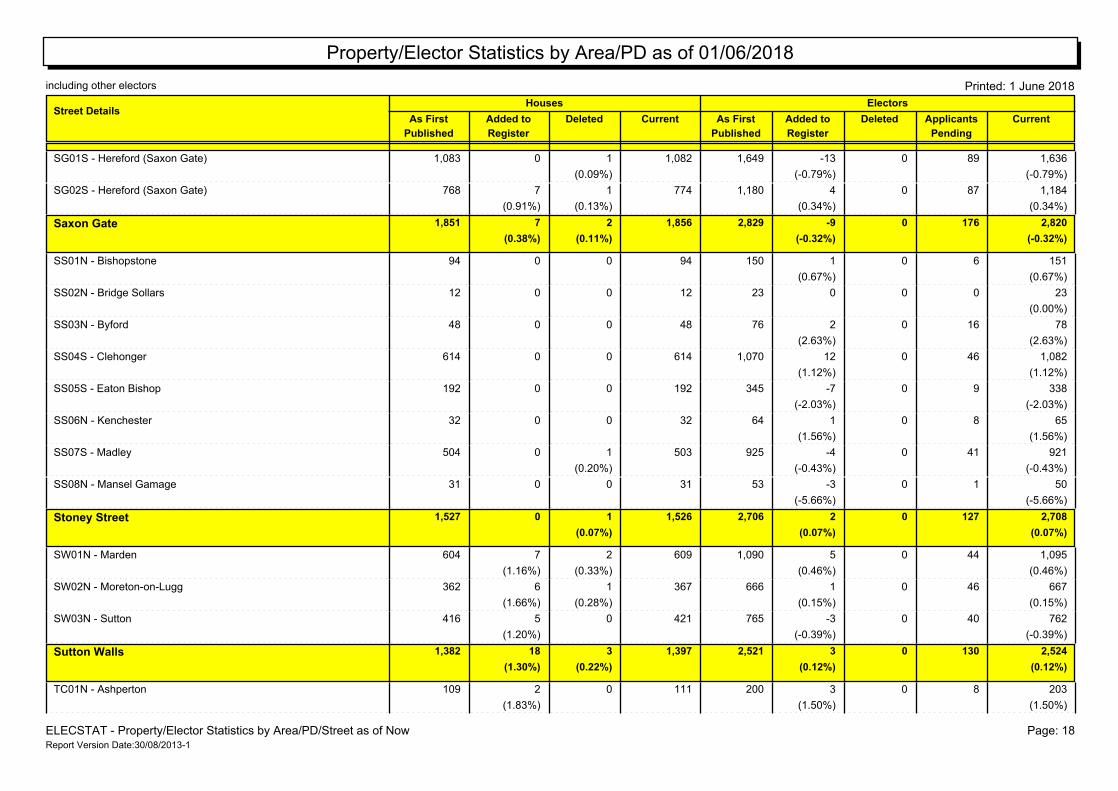
SG01S - Hereford (Saxon Gate) 1,083 0 1 1,649 89 0-13 1,082 1,636
(0.09%) (-0.79%) (-0.79%)
SG02S - Hereford (Saxon Gate) 768 7 1 1,180 87 0 4 774 1,184
(0.91%) (0.13%) (0.34%) (0.34%)
1,851 7 2 1,856 2,829 176 0-9 2,820Saxon Gate
(0.38%) (0.11%) (-0.32%) (-0.32%)
SS01N - Bishopstone 94 0 0 150 6 0 1 94 151
(0.67%) (0.67%)
SS02N - Bridge Sollars 12 0 0 23 0 0 0 12 23
(0.00%)
SS03N - Byford 48 0 0 76 16 0 2 48 78
(2.63%) (2.63%)
SS04S - Clehonger 614 0 0 1,070 46 0 12 614 1,082
(1.12%) (1.12%)
SS05S - Eaton Bishop 192 0 0 345 9 0-7 192 338
(-2.03%) (-2.03%)
SS06N - Kenchester 32 0 0 64 8 0 1 32 65
(1.56%) (1.56%)
SS07S - Madley 504 0 1 925 41 0-4 503 921
(0.20%) (-0.43%) (-0.43%)
SS08N - Mansel Gamage 31 0 0 53 1 0-3 31 50
(-5.66%) (-5.66%)
1,527 0 1 1,526 2,706 127 0 2 2,708Stoney Street
(0.07%) (0.07%) (0.07%)
SW01N - Marden 604 7 2 1,090 44 0 5 609 1,095
(1.16%) (0.33%) (0.46%) (0.46%)
SW02N - Moreton-on-Lugg 362 6 1 666 46 0 1 367 667
(1.66%) (0.28%) (0.15%) (0.15%)
SW03N - Sutton 416 5 0 765 40 0-3 421 762
(1.20%) (-0.39%) (-0.39%)
1,382 18 3 1,397 2,521 130 0 3 2,524Sutton Walls
(1.30%) (0.22%) (0.12%) (0.12%)
TC01N - Ashperton 109 2 0 200 8 0 3 111 203
(1.83%) (1.50%) (1.50%)
ELECSTAT - Property/Elector Statistics by Area/PD/Street as of Now Page: 18Report Version Date:30/08/2013-1

Property/Elector Statistics by Area/PD as of 01/06/2018
including other electors Printed: 1 June 2018
Houses Electors
As First
Published
Added to
Register
Deleted As First
Published
Added to
Register
Deleted Applicants
Pending
Street DetailsCurrent Current
TC02N - Aylton 54 0 1 109 5 0 2 53 111
(1.85%) (1.83%) (1.83%)
TC03N - Canon Frome 64 0 0 122 3 0-2 64 120
(-1.64%) (-1.64%)
TC04N - Castle Frome 67 0 1 126 5 0 3 66 129
(1.49%) (2.38%) (2.38%)
TC05N - Eggleton 29 0 0 55 3 0 1 29 56
(1.82%) (1.82%)
TC06N - Little Marcle 58 0 0 116 2 0 0 58 116
(0.00%)
TC07N - Moreton Jeffries 14 1 1 23 4 0 2 14 25
(7.14%) (7.14%) (8.70%) (8.70%)
TC08N - Much Cowarne 198 2 1 349 12 0-6 199 343
(1.01%) (0.51%) (-1.72%) (-1.72%)
TC09N - Munsley 50 0 0 94 2 0 2 50 96
(2.13%) (2.13%)
TC10N - Pixley 67 0 0 115 2 0 0 67 115
(0.00%)
TC11N - Putley 110 0 0 189 11 0-1 110 188
(-0.53%) (-0.53%)
TC12N - Stretton Grandison 55 0 0 88 2 0 0 55 88
(0.00%)
TC13N - Yarkhill 136 2 0 251 16 0-4 138 247
(1.47%) (-1.59%) (-1.59%)
TC14N - Felton 30 0 0 56 0 0-2 30 54
(-3.57%) (-3.57%)
TC15N - Ocle Pychard 130 1 0 231 18 0 6 131 237
(0.77%) (2.60%) (2.60%)
TC16N - Stoke Lacy 163 2 2 308 5 0 0 163 308
(1.23%) (1.23%) (0.00%)
TC17N - Ullingswick 116 0 0 212 1 0-2 116 210
(-0.94%) (-0.94%)
TC18N - Weston Beggard 85 1 0 170 6 0-4 86 166
(1.18%) (-2.35%) (-2.35%)
1,535 11 6 1,540 2,814 105 0-2 2,812Three Crosses
ELECSTAT - Property/Elector Statistics by Area/PD/Street as of Now Page: 19Report Version Date:30/08/2013-1

Property/Elector Statistics by Area/PD as of 01/06/2018
including other electors Printed: 1 June 2018
Houses Electors
As First
Published
Added to
Register
Deleted As First
Published
Added to
Register
Deleted Applicants
Pending
Street DetailsCurrent Current
(0.72%) (0.39%) (-0.07%) (-0.07%)
TU01S - Hereford (Tupsley) 594 1 1 1,159 32 0-9 594 1,150
(0.17%) (0.17%) (-0.78%) (-0.78%)
TU02S - Hereford (Tupsley) 791 0 0 1,387 45 0-2 791 1,385
(-0.14%) (-0.14%)
1,385 1 1 1,385 2,546 77 0-11 2,535Tupsley
(0.07%) (0.07%) (-0.43%) (-0.43%)
WE01N - Birley with Upper Hill 138 1 0 250 20 0-9 139 241
(0.72%) (-3.60%) (-3.60%)
WE02N - Brinsop & Wormsley 64 1 0 113 6 0 0 65 113
(1.56%) (0.00%)
WE03N - Canon Pyon 323 0 0 478 52 0 23 323 501
(4.81%) (4.81%)
WE04N - Dilwyn 325 2 1 588 20 0 0 326 588
(0.62%) (0.31%) (0.00%)
WE05N - Kings Pyon 68 0 0 133 0 0-1 68 132
(-0.75%) (-0.75%)
WE06N - Kings Pyon 46 0 0 71 4 0 2 46 73
(2.82%) (2.82%)
WE07N - Mansel Lacy 64 0 1 110 2 0 0 63 110
(1.56%) (0.00%)
WE08N - Weobley 650 0 0 983 33 0-4 650 979
(-0.41%) (-0.41%)
WE09N - Yazor 54 0 0 89 1 0-4 54 85
(-4.49%) (-4.49%)
1,732 4 2 1,734 2,815 138 0 7 2,822Weobley
(0.23%) (0.12%) (0.25%) (0.25%)
WH01S - Hereford (Whitecross) 675 0 0 1,128 96 0 2 675 1,130
(0.18%) (0.18%)
WH02S - Hereford (Whitecross) 873 8 3 1,480 68 0 5 878 1,485
(0.92%) (0.34%) (0.34%) (0.34%)
1,548 8 3 1,553 2,608 164 0 7 2,615Whitecross
(0.52%) (0.19%) (0.27%) (0.27%)
WI01S - Hereford (Widemarsh) 297 52 1 336 62 0 8 348 344
ELECSTAT - Property/Elector Statistics by Area/PD/Street as of Now Page: 20Report Version Date:30/08/2013-1
Property/Elector Statistics by Area/PD as of 01/06/2018
including other electors Printed: 1 June 2018
Houses Electors
As First
Published
Added to
Register
Deleted As First
Published
Added to
Register
Deleted Applicants
Pending
Street DetailsCurrent Current
(17.51%) (0.34%) (2.38%) (2.38%)
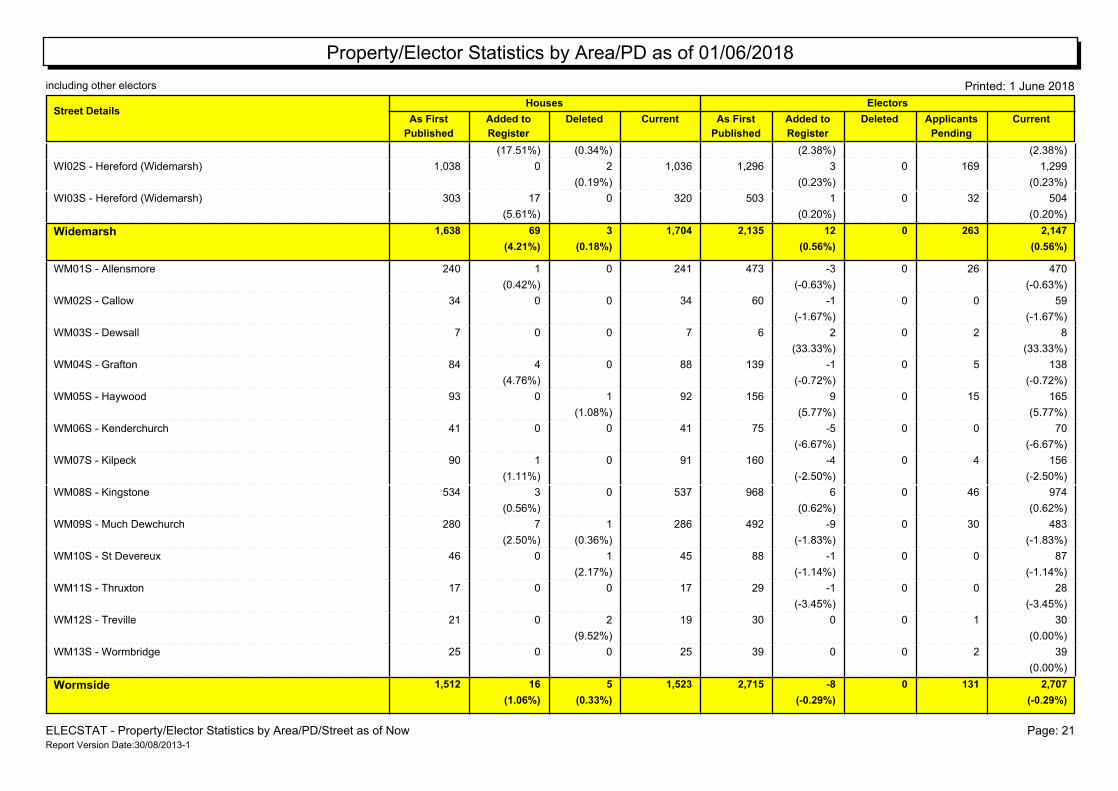
WI02S - Hereford (Widemarsh) 1,038 0 2 1,296 169 0 3 1,036 1,299
(0.19%) (0.23%) (0.23%)
WI03S - Hereford (Widemarsh) 303 17 0 503 32 0 1 320 504
(5.61%) (0.20%) (0.20%)
1,638 69 3 1,704 2,135 263 0 12 2,147Widemarsh
(4.21%) (0.18%) (0.56%) (0.56%)
WM01S - Allensmore 240 1 0 473 26 0-3 241 470
(0.42%) (-0.63%) (-0.63%)
WM02S - Callow 34 0 0 60 0 0-1 34 59
(-1.67%) (-1.67%)
WM03S - Dewsall 7 0 0 6 2 0 2 7 8
(33.33%) (33.33%)
WM04S - Grafton 84 4 0 139 5 0-1 88 138
(4.76%) (-0.72%) (-0.72%)
WM05S - Haywood 93 0 1 156 15 0 9 92 165
(1.08%) (5.77%) (5.77%)
WM06S - Kenderchurch 41 0 0 75 0 0-5 41 70
(-6.67%) (-6.67%)
WM07S - Kilpeck 90 1 0 160 4 0-4 91 156
(1.11%) (-2.50%) (-2.50%)
WM08S - Kingstone 534 3 0 968 46 0 6 537 974
(0.56%) (0.62%) (0.62%)
WM09S - Much Dewchurch 280 7 1 492 30 0-9 286 483
(2.50%) (0.36%) (-1.83%) (-1.83%)
WM10S - St Devereux 46 0 1 88 0 0-1 45 87
(2.17%) (-1.14%) (-1.14%)
WM11S - Thruxton 17 0 0 29 0 0-1 17 28
(-3.45%) (-3.45%)
WM12S - Treville 21 0 2 30 1 0 0 19 30
(9.52%) (0.00%)
WM13S - Wormbridge 25 0 0 39 2 0 0 25 39
(0.00%)
1,512 16 5 1,523 2,715 131 0-8 2,707Wormside
(1.06%) (0.33%) (-0.29%) (-0.29%)
ELECSTAT - Property/Elector Statistics by Area/PD/Street as of Now Page: 21Report Version Date:30/08/2013-1

Property/Elector Statistics by Area/PD as of 01/06/2018
including other electors Printed: 1 June 2018
Houses Electors
As First
Published
Added to
Register
Deleted As First
Published
Added to
Register
Deleted Applicants
Pending
Street DetailsCurrent Current
141,914 7,682 0 119 141,795 87,460 284 1,389 86,355
(1.61%) (0.33%) (0.08%) (0.08%)
ELECSTAT - Property/Elector Statistics by Area/PD/Street as of Now Page: 22Report Version Date:30/08/2013-1
Property/Elector Statistics by Area/PD as of 01/06/2018
including other electors Printed: 1 June 2018
Houses Electors
As First
Published
Added to
Register
Deleted As First
Published
Added to
Register
Deleted Applicants
Pending
Street DetailsCurrent Current
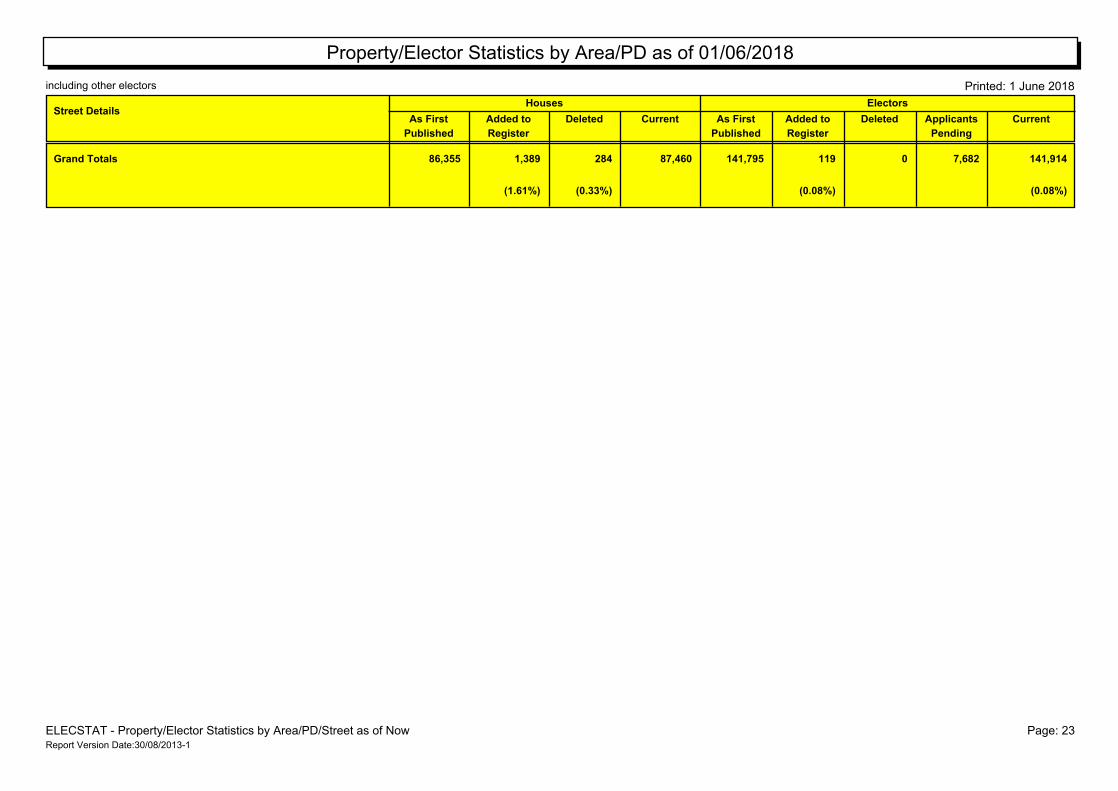
86,355 1,389 284 141,795 7,682 0 119Grand Totals 141,914 87,460
(1.61%) (0.33%) (0.08%) (0.08%)
ELECSTAT - Property/Elector Statistics by Area/PD/Street as of Now Page: 23Report Version Date:30/08/2013-1