propidium iodide competes with ca2+ to label pectin in pollen tubes and arabidopsis root
TRANSCRIPT

Propidium Iodide Competes with Ca2+ to Label Pectin inPollen Tubes and Arabidopsis Root Hairs1[W][OA]
Caleb M. Rounds2, Eric Lubeck3, Peter K. Hepler*, and Lawrence J. Winship
Department of Biology, University of Massachusetts, Amherst, Massachusetts 01003 (C.M.R., P.K.H.); andSchool of Natural Science, Hampshire College, Amherst, Massachusetts 01002 (E.L., L.J.W.)
We have used propidium iodide (PI) to investigate the dynamic properties of the primary cell wall at the apex of Arabidopsis(Arabidopsis thaliana) root hairs and pollen tubes and in lily (Lilium formosanum) pollen tubes. Our results show that in roothairs, as in pollen tubes, oscillatory peaks in PI fluorescence precede growth rate oscillations. Pectin forms the primarycomponent of the cell wall at the tip of both root hairs and pollen tubes. Given the electronic structure of PI, we investigatedwhether PI binds to pectins in a manner analogous to Ca2+ binding. We first show that Ca2+ is able to abrogate PI growthinhibition in a dose-dependent manner. PI fluorescence itself also relies directly on the amount of Ca2+ in the growth solution.Exogenous pectin methyl esterase treatment of pollen tubes, which demethoxylates pectins, freeing more Ca2+-binding sites,leads to a dramatic increase in PI fluorescence. Treatment with pectinase leads to a corresponding decrease in fluorescence.These results are consistent with the hypothesis that PI binds to demethoxylated pectins. Unlike other pectin stains, PI at lowyet useful concentration is vital and specifically does not alter the tip-focused Ca2+ gradient or growth oscillations. These datasuggest that pectin secretion at the apex of tip-growing plant cells plays a critical role in regulating growth, and PI representsan excellent tool for examining the role of pectin and of Ca2+ in tip growth.
The apical wall of tip-growing cells participatesdirectly in the process of growth regulation (McKennaet al., 2009; Winship et al., 2010), yet few methodspermit monitoring the wall properties of living cells.Despite this, several recent studies have enhanced ourunderstanding of the apical cell wall. Chemical anal-yses of isolated pollen tube wall material have re-vealed a complex mixture of pectic polysaccharideswith regions comprising long sequences of polygalac-turonic acid. Important patterns of pectin methoxyla-tion have been detected using immunocytochemicalapproaches, but these are limited to fixed cells(Dardelle et al., 2010). In a recent study, Parre andGeitmann (2005) used microindentation to show sig-nificant correlations between wall strength and growthrate. None of these techniques allow for easy investi-gation of the cell wall during growth.In an earlier study, we found that propidium iodide
(PI) vitally stains pollen tubes of lily (Lilium formosanum)
and tobacco (Nicotiana tabacum) and in particular re-veals with great clarity the thickened apical cell wall(Fig. 1; McKenna et al., 2009). In addition, the apical PIfluorescence oscillates and in lily pollen tubes corre-lates tightly with oscillations in wall thickness mea-sured by differential interference contrast (DIC) optics.Finally, these studies indicated that the PI fluorescencepredicted cell growth rates with high confidence,suggesting that PI binding may provide useful infor-mation about the physical and chemical properties ofthe cell wall.
PI is commonly used to visualize plant cell wallsby wide-field fluorescence and confocal microscopy(Fiers et al., 2005; Tian et al., 2006; Estevez et al., 2008)and to select viable cells during cell sorting (Deitchet al., 1982; Jones and Senft, 1985). A positivelycharged phenanthridine derivative, the propidium ionstains cell walls but does not pass through the intactcell membranes of living cells. It readily diffuses intodead cells and forms highly fluorescent complexes byintercalation between base pairs of double-strandednucleic acids, thus acting as an excellent indicator forcell vitality (Hudson et al., 1969). Binding to cell wallspresumably occurs by a different mechanism, since itis not accompanied by the dramatic increase in fluo-rescence and shift in absorption and emission maximaobserved when PI binds to nucleic acids. The mecha-nism of PI binding needs further exploration, as doesthe potential for broader use in other tip-growingplant cells.
In this report, we test two hypotheses: first, that PIstains other tip-growing cells with pectin-containingcell walls; and second, that PI and Ca2+ bind to thesame sites in these walls. This binding would occur
1 This work was supported by the National Science Foundation(grant no. MCB–0847876 to P.K.H.).
2 Present address: Department of Biology, Mount Holyoke Col-lege, South Hadley, MA 01075.
3 Present address: Department of Chemistry, California Instituteof Technology, Pasadena, CA 91106.
* Corresponding author; e-mail [email protected] author responsible for distribution of materials integral to the
findings presented in this article in accordance with the policydescribed in the Instructions for Authors (www.plantphysiol.org) is:Peter K. Hepler ([email protected]).
[W] The online version of this article contains Web-only data.[OA] Open Access articles can be viewed online without a sub-
scription.www.plantphysiol.org/cgi/doi/10.1104/pp.111.182196
Plant Physiology�, September 2011, Vol. 157, pp. 175–187, www.plantphysiol.org � 2011 American Society of Plant Biologists. All Rights Reserved. 175 www.plantphysiol.orgon January 28, 2019 - Published by Downloaded from
Copyright © 2011 American Society of Plant Biologists. All rights reserved.

through the interaction of partial positive chargescaused by localized deficits in p-orbital electrons as-sociated with three of the four nitrogen atoms of PI(Luedtke et al., 2005) coordinating with negativelycharged carboxyl and hydroxyl groups on homoga-lacturonans (HGs), as has been suggested in Oedogo-nium bharuchae (Estevez et al., 2008).Our findingsindicate that both hypotheses are satisfied. Notably,oscillatory changes in apical PI fluorescence occur and
are observed to anticipate oscillations in growth rate inArabidopsis (Arabidopsis thaliana) root hairs and Arab-idopsis pollen tubes. In addition, competition studiesindicate that PI and Ca2+ bind to the same sites in cellwalls. Supporting these studies, we demonstrate thatpectin methyl esterase (PME) creates more sites for PIbinding, presumably by demethoxylating HGs as theyare secreted, and that pectinase reduces PI fluores-cence dramatically. However, unlike other pectin-
Figure 1. PI fluorescence and growth rate oscillate in lily pollen tubes (A and B), Arabidopsis root hairs (C–E), and Arabidopsispollen tubes (F and G). A, The top panel shows a DIC image of a lily pollen tube, and the bottom panel shows PI fluorescence ofthe same tube. The PI fluorescence is pseudocolored, with white representing high signal and blue representing low signal. Bar =10 mm. B, Growth rate (blue) and PI fluorescence (red) are plotted on a line graph. Both oscillate with the same period but withdifferent phases. C, DIC image (top panel) and PI fluorescence image (bottom panel) of an Arabidopsis root hair. Bar = 10 mm. D,Two PI fluorescence images of the same root hair focused on the apex representing peak (top) and trough (bottom) PI signals.Bar = 5 mm. E, A line graph showing the growth rate (blue) and peak PI fluorescence at the apex (red) for the same root hair shownin C and D. F, The top panel shows a DIC image of an Arabidopsis pollen tube, and the bottom panel shows PI fluorescence of thesame tube. The PI fluorescence is pseudocolored, with white representing high signal and blue representing low signal. Bar = 5mm. G, Growth rate (blue) and PI fluorescence (red) are plotted on a line graph. Both oscillate with the same period but withdifferent phases. The growth rate between individual 3-s frames was smaller than the pixel size for our optics in both Arabidopsiscell types; to remove the noise this generated, a four-image (pollen) or five-image (root hair) running average is shown. A.U.,Arbitrary units.
Rounds et al.
176 Plant Physiol. Vol. 157, 2011 www.plantphysiol.orgon January 28, 2019 - Published by Downloaded from
Copyright © 2011 American Society of Plant Biologists. All rights reserved.

binding dyes, PI does not block Ca2+ channels at theconcentration used in live cell studies, nor does it alteroscillatory growth characteristics. Our findings pro-vide evidence that PI may be employed as a quanti-tative measure of Ca2+-binding sites and thus mayhave use as an indicator of the degree of cross-linkingof HGs and of cell wall extensibility.
RESULTS
Apical PI Labeling of Arabidopsis Root Hairs and PollenTubes Oscillates
Because PI vitally labels lily and tobacco pollen cellwalls and predicts growth rate, we asked whether asimilar phenomenon existed in two other well-studiedtip-growing plant cells: the Arabidopsis root hair andpollen tube. Monshausen et al. (2007) have shown thatroot hair growth rate oscillates, and they speculatedthat changes in cell wall properties lead to theseoscillations. The specific composition of root hair cellwalls remains unknown (Knox, 2008), although it isclear that HGs are important to growth (Diet et al.,2006) and that arabinogalactan proteins, frequentlyassociated with pectin deposits, localize to the tip ofmaize (Zea mays) root hairs (Samaj et al., 1999).We germinated Arabidopsis seeds on vertically ori-
ented agar pads affixed to microscope slides. Beforeimaging, we added water with or without supple-mental PI. Root hairs displayed a markedly differentdistribution of PI fluorescence from pollen tubes (Fig. 1,A, C, and D; Supplemental Movies S1 and S2). Inpollen tubes, the shanks are fluorescent, but the pre-dominant labeling is at the cell apex. It is this apicalfluorescence that has been shown to oscillate andpredict growth (Fig. 1, A and B; Supplemental MovieS1; McKenna et al., 2009). In root hairs, in contrast, thepredominant labeling occurs along the shanks. Al-though the tip is fluorescent, it is much dimmer thanthe rest of the cell wall (Fig. 1, C and D; SupplementalMovie S2). Also in root hairs, the DIC image shows nodramatic differences in wall thickness at the apexversus the shank. Nevertheless, ultrastructural studiesof root hairs show a thick cell wall at the apex,although it is unclear how different the thickness isfrom the wall of the shank (Galway et al., 1997).Using time-lapse recordings of PI fluorescence and
DIC images of root hairs, we examined changes in thePI fluorescence at the root hair tip and compared thesewith the growth rate (Fig. 1, D and E). Notably, weobserved distinct rhythmic fluctuations in the apicalfluorescence (Fig. 1, D and E). Root hairs grow moreslowly than lily pollen tubes; thus, when collectingimages at a rate of one per 3 s, the changes in growthare less than the resolution of the microscope, resultingin growth rate data that are noisy. We averaged thegrowth rate over five successive frames to correct forthis high-frequency noise. The resulting plots reveal aclear oscillatory pattern to the growth rate (Fig. 1E,
blue line) and an equally clear and dramatic oscillatorypattern in the apical PI fluorescence (Fig. 1E, red line).While the growth rate period and PI fluorescence pe-riod are similar, they are out of phase.
We next investigated the fluorescence pattern of PIin Arabidopsis pollen tubes. Several lines of evidencedemonstrate the presence of pectin at the Arabidopsispollen tube tip. PMEmutants have been identified thatshow significant fertility or growth deficits (Jiang et al.,2005; Tian et al., 2006). Furthermore, transcriptomeanalysis demonstrates that pectin-related enzymes areup-regulated substantially in growing pollen tubes(Honys and Twell, 2003). Arabidopsis pollen tubes ex-hibit more erratic growth rate changes than lily pollentubes and Arabidopsis root hairs. Roughly 33% of thepollen tubes we imaged sustained growth rate oscil-lations over several minutes (n = 14; SupplementalFig. S1; Supplemental Movie S3). The pattern of PIfluorescence in Arabidopsis pollen tubes is remark-ably similar to that of both tobacco (McKenna et al.,2009) and lily pollen tubes (Fig. 1, compare A and F).All show higher signal at the tip and a more uniformsignal along the shank. We examined the changes inthis fluorescence over time and compared it withgrowth rate changes (Fig. 1G). Both the growth rateand the fluorescence oscillate, although both signalsaremore erratic than in root hairs and lily pollen tubes.
PI Fluorescence Oscillations Precede Growth RateOscillations in Arabidopsis Root Hairs and Pollen Tubes
Given the oscillations in PI fluorescence and growthrate in Arabidopsis root hairs and pollen tubes, we feltit was important to explore their phase relationship.For this, we performed cross-correlation analysis toevaluate whether these two observed oscillatory phe-nomena were correlated as they are in lily and tobaccopollen tubes (McKenna et al., 2009).
We collected growth rate and corresponding PIfluorescence data from 10 growing root hairs. Growthrates varied from as slow as 17 nm s21 to as fast as28 nm s21, with an average of 22 6 1.3 nm s21 (n = 10).Similarly, oscillatory period varied from 72 s to asmuch as 104 s, or roughly 30% of the mean growth rateof 92 6 2.0 s (Table I). Cross-correlation analysis re-vealed that the PI fluorescence peaks precede the growthrate oscillation peaks by2112�. These data are remark-ably similar to the offsets of299� for lily and2124� fortobacco pollen tubes (McKenna et al., 2009).
For Arabidopsis pollen tubes, the data are lessconsistent. Growth rates (Supplemental Fig. S1; Sup-plemental Table S1) ranged from 29.8 nm s21 to as fastas 65 nm s21, with a mean rate of 526 7 nm s21 (n = 5).The oscillation period for growth rate was surprisinglysimilar to that in both lily and tobacco pollen tubes,with an average of 32 6 4 s. Cross-correlation analysisshowed that peaks in the PI signal preceded growthrate peaks by 247� 6 8�.
We express the phase shift in degrees or fractions ofa single cycle, where one complete cycle is 360�, rather
PI Staining of Root Hairs and Pollen Tubes
Plant Physiol. Vol. 157, 2011 177 www.plantphysiol.orgon January 28, 2019 - Published by Downloaded from
Copyright © 2011 American Society of Plant Biologists. All rights reserved.

than in an absolute value in seconds (McKenna et al.,2009). Support for this decision appears in Supple-mental Figure S2, which shows comparisons betweengrowth rate and the phase shift in seconds as well asbetween the growth rate and period in Arabidopsisroot hairs (Supplemental Fig. 2, A and B). The changesin period do not correlate with changes in growth rate;neither does the phase shift in seconds. However, thelonger the period, the longer the phase shift in seconds(Supplemental Fig. 2C), indicating that maximum PIstaining consistently occurs at a well-regulated frac-tion of a cycle before the peak in growth rate, regard-less of the actual rate.
PI Fluorescence Is Modulated by Ca2+ and Mg2+
PI has long been used as a root cell wall stain,although the mechanism of action is unclear (Fierset al., 2005; Tian et al., 2006; Estevez et al., 2008). Sincethe PI molecule carries two positive charges, we hy-pothesize that PI is binding to the same sites in the cellwall as Ca2+. While there are no published studies onthe electronic structure of PI, we can look to investi-gations of ethidium bromide, which contains an iden-tical phenanthridine core. X-ray crystallography, UV/visible and IR absorption, fluorescence emission, andNMR spectroscopy studies (Luedtke et al., 2005) showthat the carbon and hydrogen atoms of the phenan-thridium structure have relatively high electron den-sities, while nitrogen atoms are electron deficient,resulting in three positively charged regions in themolecule spaced 6 to 7 A apart. We reasoned that if PIwere interacting with the negative carboxyl groups inHGs, as our pollen tube and root hair data suggested(McKenna et al., 2009), then Ca2+ and Mg2+, two ionsthat interact with negative charges in the cell wall,might affect PI fluorescence. In this scenario, if weincreased the Ca2+ or Mg2+ in solution, we should see acorresponding decrease in PI fluorescence. Similarly,
an increase in PI concentration should have less effecton the observed fluorescence in a solution with higherCa2+ than in one with relatively lower Ca2+.
As a first step in investigating this hypothesis, wetransferred Arabidopsis roots that had been grown onHoagland medium in vertically oriented plates towater supplemented with 6.4 mM PI and increasingconcentrations of Ca2+ (Fig. 2A). The microscope andexposure settings were kept constant and the look-uptable is identical for each image, yet clearly, as theCa2+ concentration increased, the PI fluorescence de-creased markedly. These images were collected fromabove the expansion zone of the roots. The root hairs inthe 100 mM image are too dim to visualize, whereas inthe 1 mM image, they are shorter. The images weretaken within 20 min of immersion in PI, so a growtheffect does not account for the difference in root hairdensity. These results suggested that Ca2+ and PIcompete for the same sites in the cell walls.
To further characterize this interaction, we chose towork with lily pollen because controlling growth con-ditions is more efficacious and larger numbers areeasier to gather, compared with root hairs or Arab-idopsis pollen. We grew pollen tubes in our standardmedium and then prepared them for imaging.We thensupplemented the growth medium with six differentconcentrations of PI and three of Ca2+. To assess fluo-rescence, we measured a defined area at the tip ofthe pollen tube and subtracted background fluores-cence. Figure 2B shows that in a low-Ca2+ growthmedium of 10 mM (triangles), PI fluorescence isstrongly dependent on concentration. In contrast,at a higher Ca2+ concentration (1 mM), the fluorescenceincreases only slightly as PI concentration is increased(Fig. 2B, circles). The standard solution (100 mM Ca2+)shows an intermediate response (Fig. 2B, squares).
To investigate whether increasing concentrations ofMg2+ would alter PI fluorescence, we performed thesame experiment outlined above with the following
Table I. Cross-correlation analysis between growth rate and maximal PI fluorescence was performed for 10 Arabidopsis root hairs and pollen tubes
The data show that maximal PI fluorescence leads growth by 112.3� 6 3.9�.
Root Hair Pollen
Growth
RatePeriod Offset Offset
Growth
RatePeriod Offset Offset
nm s21 s s � nm s21 s s �19.5 72.0 218.8 294.0 43 38 25.8 255.516.8 87.2 224.7 2102.0 57 23 21.9 230.319.3 110.8 240.8 2132.6 63 23 21.5 223.726.3 91.6 226.1 2102.6 65 24.2 26.4 266.927.2 89.4 229.5 2118.8 30 42 26.8 258.820.7 107.8 232.1 2107.226.3 86.8 226.1 2108.326.0 82.4 225.1 2109.723.9 93.6 231.1 2119.616.8 103.8 237.0 2128.3
Mean 22.3 92.5 229.1 2112.3 51.5 31.7 24.5 247.0SE (6) 1.3 3.8 2.0 3.9 6 3.9 1.1 8.5
Rounds et al.
178 Plant Physiol. Vol. 157, 2011 www.plantphysiol.orgon January 28, 2019 - Published by Downloaded from
Copyright © 2011 American Society of Plant Biologists. All rights reserved.

ion concentrations (Fig. 2C): 10 mM Ca2+ (triangles),100 mM Ca2+ (squares), 10 mM Ca2+ + 90 mM Mg2+
(diamonds), and 100 mM Ca2+ + 1 mM Mg2+ (crosses).As expected, the medium supplemented with 10 mM
Ca2+ showed the most dramatic change in PI fluores-cence as PI concentration increased. In keeping withour hypothesis, if Ca2+ and Mg2+ were both competingwith PI for the same sites in the cell wall, we saw that100 mM Ca2+ and 10 mM Ca2+ + 90 mM Mg2+, whichcontain the same molarity of bivalent cation, showedthe same response. When the Mg2+ concentration wasincreased to 1 mM, the PI fluorescence showed thesame response visible when 1 mM Ca2+ was added(compare Fig. 2B, circles, with Fig. 2C, crosses).Analysis of the dependence of fluorescence on Ca2+,
Mg2+, and PI concentrations by nonlinear least-squaresfitting showed that the best-fit model was a Hillequation with a Hill coefficient between 1.8 and 2,consistent with previously reported cooperative bind-ing of Ca2+ to pectins during gelation (Garnier et al.,1994). Although cooperative binding kinetics usuallyis evidence of a conformational change during thesequential binding of ligands, in the case of linearassociation of HGs we may be seeing the effect of thefilling and unfilling of sequences of Ca2+-binding sites(Michel, 2007). Linear arrays of eight to 15 GalUAsubunits, as described in the modified egg-box model
for pectin Ca2+ binding (Braccini and Perez, 2001;Vincent andWilliams, 2009), are thought to result fromthe action of plant PME on esterified HGs and consti-tute the main binding regions for Ca2+ ions.
PI Growth Inhibition Can Be Ameliorated withCa2+ But Not Mg2+
High Ca2+ concentrations (greater than 10 mM) causepollen tube growth to arrest (Holdaway-Clarke et al.,2003). Although similar experiments have not beenpublished with regard to Mg2+, we expected that highconcentrations would interfere with growth throughbinding to carboxyls in the HGs. We reasoned that thiswould also be true of PI. Furthermore, Ca2+ and Mg2+
might be able to partially offset growth inhibition athigh PI concentrations.
We germinated lily pollen and then transferredthem to multiwell plates containing concentrations ofPI from 0 to 120 mM. The cells were allowed to recoverfor approximately 10 min and then imaged once. After20 min, we imaged them again. Average lengths formore than 40 pollen tubes were determined for eachtime point and concentration, and then the meanchange in growth was determined (Fig. 3A). In 100 mM
Ca2+, our standard lily growth medium (squares), pol-len tubes grew very close to the control growth rate
Figure 2. PI fluorescence decreaseswith increasing Ca2+ concentration. A,Arabidopsis roots incubated in 6.4 mM
PI in water with increasing amounts ofCa2+. B and C, Fluorescence of PI indifferent concentrations of PI and Ca2+
(B) or PI, Mg2+, and Ca2+ (C). In B,squares represent 100 mM Ca2+ (dashedline), triangles represent 10 mM Ca2+
(dotted and dashed line), and circlesrepresent 1 mM Ca2+ (solid line). In Band C, regression lines represent Hillplots. In B, fluorescence depends on theconcentration of Ca2+. Decreasing Ca2+
results in more fluorescence at a givenPI concentration. Each point representsthe average of at least 20 pollen tubes,and error bars represent SE. In C, trian-gles represent 10 mM Ca2+ (dotted anddashed line), squares represent 100 mM
Ca2+ (dashed line), diamonds represent10 mM Ca2+ + 90 mM Mg2+ (dotted line),and circles represent 10 mM Ca2+ plus1 mM Mg2+ (solid line). A.U., Arbitraryunits.
PI Staining of Root Hairs and Pollen Tubes
Plant Physiol. Vol. 157, 2011 179 www.plantphysiol.orgon January 28, 2019 - Published by Downloaded from
Copyright © 2011 American Society of Plant Biologists. All rights reserved.
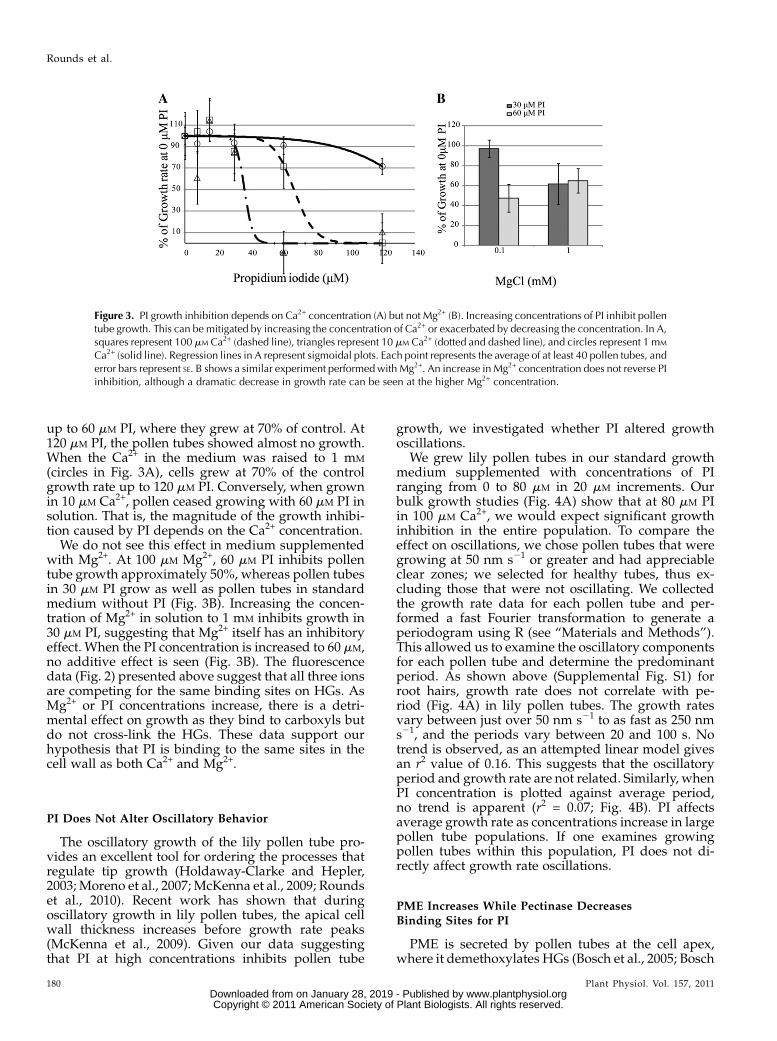
up to 60 mM PI, where they grew at 70% of control. At120 mM PI, the pollen tubes showed almost no growth.When the Ca2+ in the medium was raised to 1 mM
(circles in Fig. 3A), cells grew at 70% of the controlgrowth rate up to 120 mM PI. Conversely, when grownin 10 mM Ca2+, pollen ceased growing with 60 mM PI insolution. That is, the magnitude of the growth inhibi-tion caused by PI depends on the Ca2+ concentration.
We do not see this effect in medium supplementedwith Mg2+. At 100 mM Mg2+, 60 mM PI inhibits pollentube growth approximately 50%, whereas pollen tubesin 30 mM PI grow as well as pollen tubes in standardmedium without PI (Fig. 3B). Increasing the concen-tration of Mg2+ in solution to 1 mM inhibits growth in30 mM PI, suggesting that Mg2+ itself has an inhibitoryeffect. When the PI concentration is increased to 60 mM,no additive effect is seen (Fig. 3B). The fluorescencedata (Fig. 2) presented above suggest that all three ionsare competing for the same binding sites on HGs. AsMg2+ or PI concentrations increase, there is a detri-mental effect on growth as they bind to carboxyls butdo not cross-link the HGs. These data support ourhypothesis that PI is binding to the same sites in thecell wall as both Ca2+ and Mg2+.
PI Does Not Alter Oscillatory Behavior
The oscillatory growth of the lily pollen tube pro-vides an excellent tool for ordering the processes thatregulate tip growth (Holdaway-Clarke and Hepler,2003; Moreno et al., 2007; McKenna et al., 2009; Roundset al., 2010). Recent work has shown that duringoscillatory growth in lily pollen tubes, the apical cellwall thickness increases before growth rate peaks(McKenna et al., 2009). Given our data suggestingthat PI at high concentrations inhibits pollen tube
growth, we investigated whether PI altered growthoscillations.
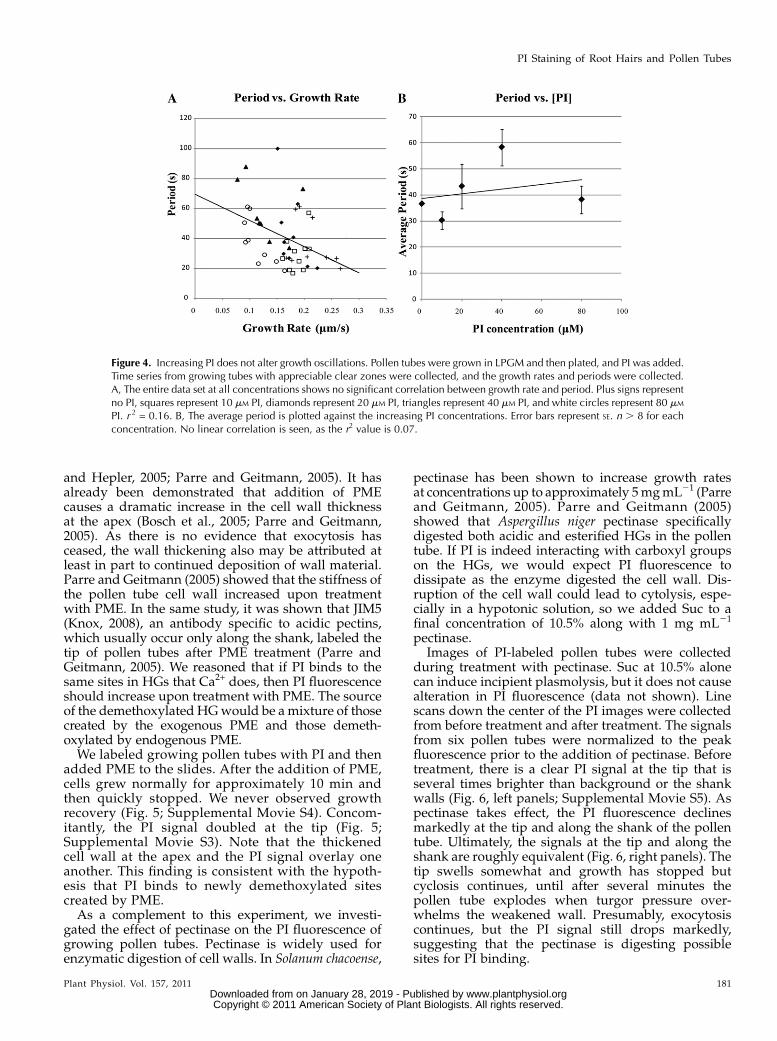
We grew lily pollen tubes in our standard growthmedium supplemented with concentrations of PIranging from 0 to 80 mM in 20 mM increments. Ourbulk growth studies (Fig. 4A) show that at 80 mM PIin 100 mM Ca2+, we would expect significant growthinhibition in the entire population. To compare theeffect on oscillations, we chose pollen tubes that weregrowing at 50 nm s21 or greater and had appreciableclear zones; we selected for healthy tubes, thus ex-cluding those that were not oscillating. We collectedthe growth rate data for each pollen tube and per-formed a fast Fourier transformation to generate aperiodogram using R (see “Materials and Methods”).This allowed us to examine the oscillatory componentsfor each pollen tube and determine the predominantperiod. As shown above (Supplemental Fig. S1) forroot hairs, growth rate does not correlate with pe-riod (Fig. 4A) in lily pollen tubes. The growth ratesvary between just over 50 nm s21 to as fast as 250 nms21, and the periods vary between 20 and 100 s. Notrend is observed, as an attempted linear model givesan r2 value of 0.16. This suggests that the oscillatoryperiod and growth rate are not related. Similarly, whenPI concentration is plotted against average period,no trend is apparent (r2 = 0.07; Fig. 4B). PI affectsaverage growth rate as concentrations increase in largepollen tube populations. If one examines growingpollen tubes within this population, PI does not di-rectly affect growth rate oscillations.
PME Increases While Pectinase DecreasesBinding Sites for PI
PME is secreted by pollen tubes at the cell apex,where it demethoxylates HGs (Bosch et al., 2005; Bosch
Figure 3. PI growth inhibition depends on Ca2+ concentration (A) but not Mg2+ (B). Increasing concentrations of PI inhibit pollentube growth. This can be mitigated by increasing the concentration of Ca2+ or exacerbated by decreasing the concentration. In A,squares represent 100 mM Ca2+ (dashed line), triangles represent 10 mM Ca2+ (dotted and dashed line), and circles represent 1 mM
Ca2+ (solid line). Regression lines in A represent sigmoidal plots. Each point represents the average of at least 40 pollen tubes, anderror bars represent SE. B shows a similar experiment performedwith Mg2+. An increase in Mg2+ concentration does not reverse PIinhibition, although a dramatic decrease in growth rate can be seen at the higher Mg2+ concentration.
Rounds et al.
180 Plant Physiol. Vol. 157, 2011 www.plantphysiol.orgon January 28, 2019 - Published by Downloaded from
Copyright © 2011 American Society of Plant Biologists. All rights reserved.
and Hepler, 2005; Parre and Geitmann, 2005). It hasalready been demonstrated that addition of PMEcauses a dramatic increase in the cell wall thicknessat the apex (Bosch et al., 2005; Parre and Geitmann,2005). As there is no evidence that exocytosis hasceased, the wall thickening also may be attributed atleast in part to continued deposition of wall material.Parre and Geitmann (2005) showed that the stiffness ofthe pollen tube cell wall increased upon treatmentwith PME. In the same study, it was shown that JIM5(Knox, 2008), an antibody specific to acidic pectins,which usually occur only along the shank, labeled thetip of pollen tubes after PME treatment (Parre andGeitmann, 2005). We reasoned that if PI binds to thesame sites in HGs that Ca2+ does, then PI fluorescenceshould increase upon treatment with PME. The sourceof the demethoxylated HGwould be amixture of thosecreated by the exogenous PME and those demeth-oxylated by endogenous PME.We labeled growing pollen tubes with PI and then
added PME to the slides. After the addition of PME,cells grew normally for approximately 10 min andthen quickly stopped. We never observed growthrecovery (Fig. 5; Supplemental Movie S4). Concom-itantly, the PI signal doubled at the tip (Fig. 5;Supplemental Movie S3). Note that the thickenedcell wall at the apex and the PI signal overlay oneanother. This finding is consistent with the hypoth-esis that PI binds to newly demethoxylated sitescreated by PME.As a complement to this experiment, we investi-
gated the effect of pectinase on the PI fluorescence ofgrowing pollen tubes. Pectinase is widely used forenzymatic digestion of cell walls. In Solanum chacoense,
pectinase has been shown to increase growth ratesat concentrations up to approximately 5mgmL21 (Parreand Geitmann, 2005). Parre and Geitmann (2005)showed that Aspergillus niger pectinase specificallydigested both acidic and esterified HGs in the pollentube. If PI is indeed interacting with carboxyl groupson the HGs, we would expect PI fluorescence todissipate as the enzyme digested the cell wall. Dis-ruption of the cell wall could lead to cytolysis, espe-cially in a hypotonic solution, so we added Suc to afinal concentration of 10.5% along with 1 mg mL21
pectinase.Images of PI-labeled pollen tubes were collected
during treatment with pectinase. Suc at 10.5% alonecan induce incipient plasmolysis, but it does not causealteration in PI fluorescence (data not shown). Linescans down the center of the PI images were collectedfrom before treatment and after treatment. The signalsfrom six pollen tubes were normalized to the peakfluorescence prior to the addition of pectinase. Beforetreatment, there is a clear PI signal at the tip that isseveral times brighter than background or the shankwalls (Fig. 6, left panels; Supplemental Movie S5). Aspectinase takes effect, the PI fluorescence declinesmarkedly at the tip and along the shank of the pollentube. Ultimately, the signals at the tip and along theshank are roughly equivalent (Fig. 6, right panels). Thetip swells somewhat and growth has stopped butcyclosis continues, until after several minutes thepollen tube explodes when turgor pressure over-whelms the weakened wall. Presumably, exocytosiscontinues, but the PI signal still drops markedly,suggesting that the pectinase is digesting possiblesites for PI binding.
Figure 4. Increasing PI does not alter growth oscillations. Pollen tubes were grown in LPGM and then plated, and PI was added.Time series from growing tubes with appreciable clear zones were collected, and the growth rates and periods were collected.A, The entire data set at all concentrations shows no significant correlation between growth rate and period. Plus signs representno PI, squares represent 10 mM PI, diamonds represent 20 mM PI, triangles represent 40 mM PI, and white circles represent 80 mM
PI. r 2 = 0.16. B, The average period is plotted against the increasing PI concentrations. Error bars represent SE. n . 8 for eachconcentration. No linear correlation is seen, as the r2 value is 0.07.
PI Staining of Root Hairs and Pollen Tubes
Plant Physiol. Vol. 157, 2011 181 www.plantphysiol.orgon January 28, 2019 - Published by Downloaded from
Copyright © 2011 American Society of Plant Biologists. All rights reserved.

PI Does Not Interfere with the Tip-Focused Ca2+ Gradient
in Pollen Tubes
The tip-focused Ca2+ gradient in pollen tubes hasbeen studied extensively for nearly two decades(Rathore et al., 1991; Miller et al., 1992). Inhibition ofgrowth has usually been shown to block the Ca2+
gradient (Hepler et al., 2001; Cole and Fowler, 2006;
Cardenas, 2009). The pectin dyes ruthenium red (Pictonand Steer, 1985; Bednarska, 1989; Ischebeck et al., 2008;Szumlanski and Nielsen, 2009) and coriphosphineO (Weis et al., 1988) have been used on plant cellsbut inhibit growth and block Ca2+ channels; they arenot useful as vital stains of pectin. We have alreadyshown that at working concentrations of PI and Ca2+,
Figure 5. PME causes a dramatic in-crease in PI fluorescence at the pollentube apex. A, DIC (top) and PI fluores-cence (bottom) images of a pollen tubebefore (0 min) and after (20 min) treat-ment with PME. At 20 min, the tip isclearly thicker and the fluorescencehas increased dramatically. Bar = 10 mm.B, A line graph representing the timecourse for the same pollen tube shownin A. Blue represents the growth rate,and red represents the PI fluorescenceat the pollen tube apex. Note that bothgrowth rate and PI apex fluorescencecontinue to oscillate until the pollentube stops, and then growth rate plum-mets and PI fluorescence surges intandem. The arrow in B shows wherePME was added to the slide. A.U.,Arbitrary units.
Figure 6. Pectinase decreases PI fluo-rescence and stops growth. A, Pectin-ase was added to growing lily pollentubes. The top panels showDIC imagesbefore and after pectinase addition.The bottom panels show the PI fluo-rescence of the same pollen tube at thesame time points with the same look-up table. B, Mean intensity of a linescan down the middle of six pollentubes before treatment with pectinaseon the left and after treatment on theright. The gray lines represent SE.
Rounds et al.
182 Plant Physiol. Vol. 157, 2011 www.plantphysiol.orgon January 28, 2019 - Published by Downloaded from
Copyright © 2011 American Society of Plant Biologists. All rights reserved.

cells grow at control rates. We wished to investigatewhether there would be changes in the Ca2+gradient.We injected pollen tubes with the ratiometric Ca2+-
sensitive dye fura-2 dextran. After removing the nee-dle, we added PI to the growth solution and thenimaged the cells (Fig. 7). The DIC image shows that thecell retains standard morphology with a rounded tipand an apical clear zone (Fig. 7A; Supplemental MovieS6). The PI fluorescence also appears normal for agrowing pollen tube (compare with Fig. 1; McKennaet al., 2009). The Ca2+ gradient has a tip high peak anddecreases to a basal level of approximately 150 nM. If PIwere interfering with Ca2+ channels, we would expectan alteration in the magnitude of the gradient. Fur-thermore, as shown in Figure 5B, the oscillatory pro-files of growth rate, PI, and Ca2+ correspond topublished data. These data give us confidence that PIis not interfering with Ca2+ uptake (Pierson et al., 1996;McKenna et al., 2009).
DISCUSSION
In this study, we provide evidence that PI, whichvitally stains plant cell walls, competes with divalentcations, especially Ca2+, and binds to carboxyl residueson HGs. With these properties, PI staining allowsanalysis of the link between wall deposition and cellgrowth. Notably, we expand our understanding ofoscillatory growth and show that in root hairs, as wellas pollen tubes, an increase in apical HG accumulationprecedes peaks in growth rate.As PI represents an excellent tool for understanding
the physiology of wall extensibility in divergent tip-growing plant cells, we invested considerable effort in
determining the mechanism of cell wall binding. Thecompetition studies, for example, indicate that Ca2+,Mg2+, and PI interact with a common wall component,namely the HGs. Several previous studies indicate thatCa2+ cross-links GalUA residues, lending strength tothe cell wall (Thibault and Rinaudo, 1985). AlthoughMg2+ also interacts with these negative charges, it doesnot create links between the pectin chains (Thibaultand Rinaudo, 1985; Malovıkova et al., 2004). Models ofthe electrostatic charge on the surface of the PI mol-ecule show three partial positive charges associatedwith tertiary nitrogen atoms that are 6 to 7 A apart. Thenegative charges on the GalUA residues occur atsimilar intervals, suggesting that Ca2+ and PI bind tothe same sites in cell walls.
Because Ca2+ itself inhibits growth at high concen-trations, we explored the interactions of Ca2+, Mg2+,and PI on growth and PI fluorescence in lily pollentubes. We show that in low-Ca2+ medium, PI dramat-ically increases in fluorescence as its concentrationincreases (Fig. 2B). In a higher Ca2+ concentration, theeffect is much more gradual, and in the range testedthe fluorescence is never as bright. The effect ofincreasing Mg2+ concentration is quite similar, sup-porting the hypothesis that all three ions are interact-ing with the same charges. Initially, this suggestedcompetitive binding of Ca2+ and PI for HGs. However,the regression model that most closely fits the datasuggests cooperative binding. In this scenario, PI andCa2+ interact with the same binding sites, but only Ca2+
effectively cross-links HGs, so that a higher proportionof binding sites occupied by Ca2+ limits the ability of PIto intercalate between HGs (for model, see Fig. 8). Atsufficiently high PI concentrations, cross-linking byCa2+ is reduced, and the wall loses strength so that
Figure 7. PI does not interfere with tip-focused cytosolic Ca2+ gradient ([Ca2+]i).A, DIC (top), PI fluorescence (middle),and [Ca2+]i (bottom) images of a grow-ing pollen tube that has been injectedwith fura-2 dextran and labeled withPI. Bar = 10 mm, and the Ca2+ gradientscale is in nanomolar. B, Line graphsshowing the growth rate (top), apical PIsignal (middle), and [Ca2+]i (bottom) atthe apex of the pollen tube shown in A.Growth rate, PI, and [Ca2+]i continueto oscillate in the samemanner as eachof the phenomena measured individu-ally. A.U., Arbitrary units.
PI Staining of Root Hairs and Pollen Tubes
Plant Physiol. Vol. 157, 2011 183 www.plantphysiol.orgon January 28, 2019 - Published by Downloaded from
Copyright © 2011 American Society of Plant Biologists. All rights reserved.

tubes burst at or near the tip. Thus, increased cross-linking due to high Ca2+ concentration simultaneouslymakes PI binding energetically less favorable andstiffens the cell wall. This model is supported byfindings showing that Ca2+ binds to HGs in thismanner in vitro (Malovıkova et al., 2004).
The interplay between cell wall extensibility and theconstant of turgor pressure (Winship et al., 2010)ultimately regulates tip growth. This study showsthat the amount of demethoxylated HG available forCa2+ binding oscillates at the tips of root hairs as itdoes in pollen tubes. These data suggest a fundamentalmechanism for tip growth based upon two coun-terpoised processes. First, exocytosis of largely me-thoxylated HG replaces wall material carried awayfrom the tip by expansion, locally reducing the rela-tive concentration of binding sites for Ca2+, thusmaking the wall more extensible. Second, demeth-oxylation by PME increases the relative concentrationof Ca2+-binding sites, leading to a progressively lessextensible wall due to Ca2+ cross-linking (Fig. 8). Aprevious study showed that PME exocytosis itselfoscillates (McKenna et al., 2009), suggesting that,along with the exocytosis of HGs, this could accountfor changes in cell wall extensibility and oscillationsin growth rate. PI, by sampling a small fraction of thetotal Ca2+-binding sites available, reports on the de-position of cell wall (Fig. 8).
These data focus our attention on the control ofexocytosis in our effort to understand the mechanismsof both oscillations and growth. There has been muchcompelling work concerning the targeting of exocyto-sis (Preuss et al., 2004; Lee et al., 2008; Nielsen et al.,2008; Szumlanski and Nielsen, 2009; Cheung et al.,
2010). For pollen tubes in particular, external signalsinfluence the directionality of growth (Okuda et al.,2009; Chae and Lord, 2011). How can these two factorsbe coordinated? It seems unlikely that wall extensibil-ity itself changes first. Somehow, external signals arelinked through intracellular processes to changes incell wall extensibility. It is unclear what the intracel-lular signals are that could lead to directional growthchanges. In addition to the molecular tools of overex-pressed proteins and the probes for assessing the ionicchanges in the cytoplasm, with PI we have a reporterfor changes within the cell wall, which should allowfurther understanding of the basic mechanism of tip-growing plant cells as they respond to their environ-ment.
MATERIALS AND METHODS
Pollen Tube Growth Conditions
Pollen was grown as described previously (Rounds et al., 2010). Briefly, all
pollen was from lily (Lilium formosanum) stocks stored at –80�C and germi-
nated for 1 to 1.5 h on a rotator at room temperature in a standard growth
medium (LPGM): 7% (w/v) Suc, 1.6 mMH3BO3, 0.1 mM CaCl2, and 15 mMMES
buffer adjusted to pH 5.7 with KOH (a final concentration of KOH of
approximately 6 mM); all reagents were from Fisher Scientific unless otherwise
noted. For microscopic observations, a pollen suspension was spread on
custom-made well slides with a growth medium solution containing a final
concentration of 0.7% (w/v) low-melting agarose (Sigma-Aldrich). The im-
mobilized pollen was then covered with fresh growth medium for imaging.
Cells were allowed to recover for at least 0.5 h before imaging or further
manipulations.
PI Staining of Pollen Tubes
For PI staining of the primary cell wall, the growth medium covering the
immobilized and recovered cells on microscope slides was replaced with
Figure 8. Model for binding of Ca2+
and PI to HGs during tip growth. Dis-organized chains of highly methoxy-lated HG leave the growing cellby exocytosis. In the cell wall, PMEdemethoxylates the chains, creatinglinear regions of negatively chargedcarboxyl groups. In the presence ofCa2+, cooperative binding occurs be-tweenHG chains, creating a stiff gel. Inthe presence of Ca2+ and PI, both ionsbind to carboxyls, although PI cannotcross-link.
Rounds et al.
184 Plant Physiol. Vol. 157, 2011 www.plantphysiol.orgon January 28, 2019 - Published by Downloaded from
Copyright © 2011 American Society of Plant Biologists. All rights reserved.

LPGM supplemented with 20 to 40 mM PI (Sigma). Cells were imaged more
than 10 min after addition of the stain.
Root Hair Growth Conditions
Prestratified, surface-sterilized Arabidopsis (Arabidopsis thaliana Columbia
ecotype) seeds were germinated on agar pads affixed to microscope slides.
The agar medium consisted of 1% (w/v) Bacto-agar (Difco) and 1% (w/v) Suc
in a modified Hoagland medium (Bannigan et al., 2006). The slides were
placed in standard petri dishes and oriented so that the roots would grow
across the slide. Seeds were germinated and grown in constant yellow light
(approximately 100 mmol m22 s21) at 22�C. For root hair growth analysis,
seedlings were analyzed between 2 and 4 d. Slides were removed and the
preparation was covered in modified Hoagland medium supplemented with
10 mM PI. The preparation was then covered with a coverslip and sealed on
three sides with a 1:1:1 mixture of petroleum jelly, lanolin, and paraffin (Vidali
et al., 2009). Roots were allowed to recover for at least 3 h before imaging.
Newly emerging root hairs were selected for imaging.
Growth Inhibition Experiments
PI growth inhibition experiments were performed largely as described
(Rounds et al., 2010). Briefly, pollen was germinated in control LPGM for
approximately 1 h. The pollen suspension was then divided into aliquots on
12-well plates with the indicated amounts of Ca2+ and PI. The cells were
allowed to recover for 20 min and then imaged. After 20 min, the cells were
imaged again. All images were calibrated with a micrometer. Imaging was
performed using a 13 lens on a stereomicroscope (Leica MZ16FA) using a
CCD camera (Leica DF300FX). Images were analyzed using ImageJ (sbweb.
nih.gove/ij), and analysis was performed in Excel. Regression curves were
generated using the nonlinear least-squares regression analysis command in R
(Ihaka and Gentleman, 1996).
PI/Ca2+ Fluorescence Competition
The experimental setup was performed largely as described for the
inhibition experiments. Data acquisition was performed with the Nikon
TE300microscope (see below) using a 203 objective and the light path settings
described in “Microscopy and Imaging” below. PI fluorescence exposure time
was 1 s. Data analysis was performed using ImageJ (Abramoff et al., 2004). The
average fluorescence in a 3-3 3-pixel box at the pollen tube tip was measured.
Background was calculated by taking the average fluorescence in a 20-pixel
box. Approximately 40 pollen tubes were measured for each treatment.
Data were tabulated in Excel, and regression curves were generated using
the nonlinear least-squares regression analysis command in R (Ihaka and
Gentleman, 1996).
Microscopy and Imaging
PI and DIC images were acquired using a CCD camera (Quantix Cool Snap
HQ; Roper Scientific) attached to a Nikon TE300 inverted microscope (Nikon
Instruments) with a 403/1.3 numerical aperture oil-immersion objective lens
for pollen and a 603/1.4 numerical aperture oil-immersion lens for root hairs.
All the equipment was operated with MetaMorph/MetaFluor (Molecular
Devices) software. A filter wheel system (L10-2; Sutter Instruments), mounted
immediately before the CCD camera, controlled the position of a polarizing
filter for DIC or an emission filter for fluorescence imaging. Fluorescence
excitation light was provided by a 175-W ozone-free xenon lamp in a DG-4
switching system (Sutter Instruments). Transmitted light was provided by a
low-voltage halogen lamp. We used the following filter setup for PI imaging:
emission, 495/103; a 565 dichroic long pass; and excitation 509 long pass
(all filters from Chroma). Exposure times varied but were generally approx-
imately 25 ms for DIC and approximately 800 ms for PI unless otherwise
stated. For imaging fura-2 dextran simultaneously with PI, we employed the
following filters: for fura emission, 340 and 380 nm; for PI, 490 nm. A triple
band (UV/DAPI/FITC/rhodamine) dichroic was employed. No emission
filter was used for fura, but a 640/25 emission filter was employed for PI.
Excitations were as follows: 150 ms at 340 nm, 50 ms at 380 nm, 15 ms for DIC,
and 850 ms at 490 nm. The DG-4 excitation was set to 25% for fura-2 dextran
imaging, as brighter intensities tended to harm the cell.
In Vitro Growth Rate Experiment with PME
and Pectinase
Exogenous orange peel PME (Sigma-Aldrich) treatment was carried out
largely as described (Bosch et al., 2005). Briefly, pollen tubes were germinated
and then plated for microscopy with PI staining as described above. Once the
pollen tubes had recovered, 1 well volume of a solution containing orange
peel PME at 30 units mL21 was added for a final concentration of 15 units
mL21. Images (both DIC and fluorescence) were collected at 3-s intervals.
Pectinase experiments were carried out in much the same way using pectinase
(USB) from Aspergillus niger. The enzyme was added along with LPGM with
extra Suc to bring the final concentration to 10.5% Suc and 1 mg mL21
pectinase. Line scans were performed using the linescan feature of Meta-
Morph, and statistical analysis was performed using Excel. The images used
for analysis were from the tenth frame of image collection, before the addition
of pectinase, and the last frame of image collection, after incubation in
pectinase.
Intracellular Ca2+ Measurement
Cells were pressure injected with fura-2 dextran as described (Cardenas
et al., 2008). After image collection, analysis was performed using ImageJ.
Masks were made for each frame in entire movies and then background was
subtracted. The images were Gaussian filtered, and then the entire movies
were ratioed using the ratioplus plugin for ImageJ at 32 bits so as to obtain
fractional ratio values. These were then calibrated using standard methods
described elsewhere (Roy et al., 1999).
Growth Rate Measurement andCross-Correlation Analysis
Growth rate was measured using the tip-tracking feature of the Meta-
Morph software package (Molecular Devices). For both PI and ratioed fura-2
dextran images, the intensity along line scans (20 pixels wide) down the center
of the tube was collected for each image in entire movies. A custom R script
(Ihaka and Gentleman, 1996) was then used to find the peak PI or Ca2+ values
near the X,Y position of the tip of the pollen tube (or root hair) based on the
MetaMorph tracking file. The resulting traces were detrended to remove
bleaching artifacts, and cross-correlation was performed using a custom R
script (Supplemental Protocols S1 and S2) and as described previously
(Cardenas et al., 2006; Lovy-Wheeler et al., 2006; McKenna et al., 2009).
Supplemental Data
The following materials are available in the online version of this article.
Supplemental Figure S1. Oscillatory profiles of Arabidopsis.
Supplemental Figure S2. Root hair oscillation.
Supplemental Movie S1. Lily pollen tube labeled with PI.
Supplemental Movie S2. Arabidopsis root hair labeled with PI.
Supplemental Movie S3. Arabidopsis pollen tube labeled with PI.
Supplemental Movie S4. PME treatment of PI-labeled lily pollen tube.
Supplemental Movie S5. Pectinase treatment of PI-labeled lily pollen tube.
Supplemental Movie S6. Fura-2 dextran-injected and PI-labeled lily
pollen tube.
Supplemental Protocol S1. R script for cross-correlating PI, Ca2+, and
growth rate.
Supplemental Protocol S2. R script for determining period of an oscilla-
tory pollen tube.
ACKNOWLEDGMENTS
We thank Dr. M. Bezanilla and Dr. T.I. Baskin and members of their
respective laboratories for helpful discussions.
Received June 21, 2011; accepted July 14, 2011; published July 18, 2011.
PI Staining of Root Hairs and Pollen Tubes
Plant Physiol. Vol. 157, 2011 185 www.plantphysiol.orgon January 28, 2019 - Published by Downloaded from
Copyright © 2011 American Society of Plant Biologists. All rights reserved.

LITERATURE CITED
Abramoff MD, Magelhaes PJ, Ram SJ (2004) Image processing with
ImageJ. Biophotonics Int 11: 36–42
Bannigan A, Wiedemeier AMD, Williamson RE, Overall RL, Baskin TI
(2006) Cortical microtubule arrays lose uniform alignment between cells
and are oryzalin resistant in the Arabidopsis mutant, radially swollen 6.
Plant Cell Physiol 47: 949–958
Bednarska E (1989) The effect of exogenous Ca2+ ions on pollen grain
germination and pollen tube growth. Sex Plant Reprod 2: 53–58
Bosch M, Cheung AY, Hepler PK (2005) Pectin methylesterase, a regulator
of pollen tube growth. Plant Physiol 138: 1334–1346
Bosch M, Hepler PK (2005) Pectin methylesterases and pectin dynamics in
pollen tubes. Plant Cell 17: 3219–3226
Braccini I, Perez S (2001) Molecular basis of C(2+)-induced gelation in
alginates and pectins: the egg-box model revisited. Biomacromolecules
2: 1089–1096
Cardenas L (2009) New findings in the mechanisms regulating polar
growth in root hair cells. Plant Signal Behav 4: 4–8
Cardenas L, Lovy-Wheeler A, Kunkel JG, Hepler PK (2008) Pollen tube
growth oscillations and intracellular calcium levels are reversibly mod-
ulated by actin polymerization. Plant Physiol 146: 1611–1621
Cardenas L, McKenna ST, Kunkel JG, Hepler PK (2006) NAD(P)H
oscillates in pollen tubes and is correlated with tip growth. Plant
Physiol 142: 1460–1468
Chae K, Lord EM (2011) Pollen tube growth and guidance: roles of small,
secreted proteins. Ann Bot (in press)
Cheung AY, Niroomand S, Zou Y, Wu HM (2010) A transmembrane formin
nucleates subapical actin assembly and controls tip-focused growth in
pollen tubes. Proc Natl Acad Sci USA 107: 16390–16395
Cole RA, Fowler JE (2006) Polarized growth: maintaining focus on the tip.
Curr Opin Plant Biol 9: 579–588
Dardelle F, Lehner A, Ramdani Y, Bardor M, Lerouge P, Driouich A,
Mollet J-C (2010) Biochemical and immunocytological characterizations
of Arabidopsis pollen tube cell wall. Plant Physiol 153: 1563–1576
Deitch AD, Law H, deVere White R (1982) A stable propidium iodide
staining procedure for flow cytometry. J Histochem Cytochem 30:
967–972
Diet A, Link B, Seifert GJ, Schellenberg B, Wagner U, Pauly M, Reiter
WD, Ringli C (2006) The Arabidopsis root hair cell wall formation
mutant lrx1 is suppressed by mutations in the RHM1 gene encoding a
UDP-L-rhamnose synthase. Plant Cell 18: 1630–1641
Estevez JM, Leonardi PI, Alberghina JS (2008) Cell wall carbohydrate
epitopes in the green alga Oedogonium bharuchae f. minor (Oedogoniales,
Chlorophyta). J Phycol 44: 1257–1268
Fiers M, Golemiec E, Xu J, van der Geest L, Heidstra R, Stiekema W, Liu
CM (2005) The 14-amino acid CLV3, CLE19, and CLE40 peptides trigger
consumption of the root meristem in Arabidopsis through a CLAVATA2-
dependent pathway. Plant Cell 17: 2542–2553
Galway ME, Heckman JW Jr, Schiefelbein JW (1997) Growth and ultra-
structure of Arabidopsis root hairs: the rhd3 mutation alters vacuole
enlargement and tip growth. Planta 201: 209–218
Garnier C, Axelos MAV, Thibault J-F (1994) Selectivity and cooperativity
in the binding of calcium ions by pectins. Carbohydr Res 256: 71–81
Hepler PK, Vidali L, Cheung AY (2001) Polarized cell growth in higher
plants. Annu Rev Cell Dev Biol 17: 159–187
Holdaway-Clarke TL, Hepler PK (2003) Control of pollen tube growth:
role of ion gradients and fluxes. New Phytol 159: 539–563
Holdaway-Clarke TL, Weddle NM, Kim S, Robi A, Parris C, Kunkel JG,
Hepler PK (2003) Effect of extracellular calcium, pH and borate on
growth oscillations in Lilium formosanum pollen tubes. J Exp Bot 54:
65–72
Honys D, Twell D (2003) Comparative analysis of the Arabidopsis pollen
transcriptome. Plant Physiol 132: 640–652
Hudson B, Upholt WB, Devinny J, Vinograd J (1969) The use of an
ethidium analogue in the dye-buoyant density procedure for the isola-
tion of closed circular DNA: the variation of the superhelix density of
mitochondrial DNA. Proc Natl Acad Sci USA 62: 813–820
Ihaka R, Gentleman R (1996) R: a language for data analysis and graphics. J
Comput Graph Statist 5: 299–314
Ischebeck T, Stenzel I, Heilmann I (2008) Type B phosphatidylinositol-4-
phosphate 5-kinases mediate Arabidopsis and Nicotiana tabacum pollen
tube growth by regulating apical pectin secretion. Plant Cell 20:
3312–3330
Jiang L, Yang SL, Xie LF, Puah CS, Zhang XQ, Yang WC, Sundaresan V, Ye
D (2005) VANGUARD1 encodes a pectin methylesterase that enhances
pollen tube growth in the Arabidopsis style and transmitting tract. Plant
Cell 17: 584–596
Jones KH, Senft JA (1985) An improved method to determine cell viability
by simultaneous staining with fluorescein diacetate-propidium iodide. J
Histochem Cytochem 33: 77–79
Knox JP (2008) Revealing the structural and functional diversity of plant
cell walls. Curr Opin Plant Biol 11: 308–313
Lee YJ, Szumlanski A, Nielsen E, Yang Z (2008) Rho-GTPase-dependent
filamentous actin dynamics coordinate vesicle targeting and exocytosis
during tip growth. J Cell Biol 181: 1155–1168
Lovy-Wheeler A, Kunkel JG, Allwood EG, Hussey PJ, Hepler PK (2006)
Oscillatory increases in alkalinity anticipate growth and may regulate
actin dynamics in pollen tubes of lily. Plant Cell 18: 2182–2193
Luedtke NW, Liu Q, Tor Y (2005) On the electronic structure of ethidium.
Chemistry 11: 495–508
Malovıkova A, Rinaudo M, Milas M (2004) Comparative interactions of
magnesium and calcium counterions with polygalacturonic acid. Bio-
polymers 34: 1059–1064
McKenna ST, Kunkel JG, Bosch M, Rounds CM, Vidali L, Winship LJ,
Hepler PK (2009) Exocytosis precedes and predicts the increase in
growth in oscillating pollen tubes. Plant Cell 21: 3026–3040
Michel D (2007) Cooperative equilibrium curves generated by ordered
ligand binding to multi-site molecules. Biophys Chem 129: 284–288
Miller DD, Callaham DA, Gross DJ, Hepler PK (1992) Free Ca2+ gradient
in growing pollen tubes of Lilium. J Cell Sci 101: 7–12
Monshausen GB, Bibikova TN, Messerli MA, Shi C, Gilroy S (2007)
Oscillations in extracellular pH and reactive oxygen species modulate
tip growth of Arabidopsis root hairs. Proc Natl Acad Sci USA 104:
20996–21001
Moreno N, Colaco R, Feijo JA (2007). The pollen tube oscillator: integrating
biophysics and biochemistry into cellular growth and morphogenesis.
In S Mancuso, S Shabala, eds, Rhythms in Plants: Phenomenology,
Mechanisms, and Adaptive Significance. Springer-Verlag, Berlin,
pp39–62
Nielsen E, Cheung AY, Ueda T (2008) The regulatory RAB and ARF
GTPases for vesicular trafficking. Plant Physiol 147: 1516–1526
Okuda S, Tsutsui H, Shiina K, Sprunck S, Takeuchi H, Yui R, Kasahara
RD, Hamamura Y, Mizukami A, Susaki D, et al (2009) Defensin-like
polypeptide LUREs are pollen tube attractants secreted from synergid
cells. Nature 458: 357–361
Parre E, Geitmann A (2005) Pectin and the role of the physical properties
of the cell wall in pollen tube growth of Solanum chacoense. Planta 220:
582–592
Picton JM, Steer MW (1985) The effects of ruthenium red, lanthanum,
fluorescein isothiocyanate and trifluoperazine on vesicle transport,
vesicle fusion and tip extension in pollen tubes. Planta 163: 20–26
Pierson ES, Miller DD, Callaham DA, van Aken J, Hackett G, Hepler PK
(1996) Tip-localized calcium entry fluctuates during pollen tube growth.
Dev Biol 174: 160–173
Preuss ML, Serna J, Falbel TG, Bednarek SY, Nielsen E (2004) The
Arabidopsis Rab GTPase RabA4b localizes to the tips of growing root hair
cells. Plant Cell 16: 1589–1603
Rathore KS, Cork RJ, Robinson KR (1991) A cytoplasmic gradient of
Ca2+ is correlated with the growth of lily pollen tubes. Dev Biol 148:
612–619
Rounds CM, Hepler PK, Fuller SJ, Winship LJ (2010) Oscillatory growth
in lily pollen tubes does not require aerobic energy metabolism. Plant
Physiol 152: 736–746
Roy SJ, Holdaway-Clarke TL, Hackett GR, Kunkel JG, Lord EM,
Hepler PK (1999) Uncoupling secretion and tip growth in lily pollen
tubes: evidence for the role of calcium in exocytosis. Plant J 19:
379–386
Samaj J, BraunM, Baluska F, Ensikat H, Tsumuraya Y, Volkmann D (1999)
Specific localization of arabinogalactan-protein epitopes at the surface
of maize root hairs. Plant Cell Physiol 40: 874–883
Szumlanski AL, Nielsen E (2009) The Rab GTPase RabA4d regulates
pollen tube tip growth in Arabidopsis thaliana. Plant Cell 21: 526–544
Thibault JF, Rinaudo M (1985) Interactions of mono- and divalent coun-
Rounds et al.
186 Plant Physiol. Vol. 157, 2011 www.plantphysiol.orgon January 28, 2019 - Published by Downloaded from
Copyright © 2011 American Society of Plant Biologists. All rights reserved.
terions with alkali- and enzyme-deesterified pectins in salt-free solu-
tions. Biopolymers 24: 2131–2143
Tian GW, Chen MH, Zaltsman A, Citovsky V (2006) Pollen-specific pectin
methylesterase involved in pollen tube growth. Dev Biol 294: 83–91
Vidali L, van Gisbergen PAC, Guerin C, Franco P, Li M, Burkart GM,
Augustine RC, Blanchoin L, Bezanilla M (2009) Rapid formin-medi-
ated actin-filament elongation is essential for polarized plant cell
growth. Proc Natl Acad Sci USA 106: 13341–13346
Vincent RR, Williams MA (2009) Microrheological investigations give
insights into the microstructure and functionality of pectin gels. Carbo-
hydr Res 344: 1863–1871
Weis KG, Polito VS, Labavitch JM (1988) Microfluorometry of pectic
materials in the dehiscence zone of almond (Prunus dulcis [Mill.] DA
Webb) fruits. J Histochem Cytochem 36: 1037–1041
Winship LJ, Obermeyer G, Geitmann A, Hepler PK (2010) Under pres-
sure, cell walls set the pace. Trends Plant Sci 15: 363–369
PI Staining of Root Hairs and Pollen Tubes
Plant Physiol. Vol. 157, 2011 187 www.plantphysiol.orgon January 28, 2019 - Published by Downloaded from
Copyright © 2011 American Society of Plant Biologists. All rights reserved.