proportional symbol mapping in r - journal of statistical ... · 2 proportional symbol mapping in r...
TRANSCRIPT

JSS Journal of Statistical SoftwareJanuary 2006, Volume 15, Issue 5. http://www.jstatsoft.org/
Proportional Symbol Mapping in R
Susumu TanimuraNagasaki University
Chusi KuroiwaUniversity of Tokyo
Tsutomu MizotaNagasaki University
Abstract
Visualization of spatial data on a map aids not only in data exploration but also incommunication to impart spatial conception or ideas to others. Although recent carto-graphic functions in R are rapidly becoming richer, proportional symbol mapping, whichis one of the common mapping approaches, has not been packaged thus far. Based onthe theories of proportional symbol mapping developed in cartography, the authors devel-oped some functions for proportional symbol mapping using R, including mathematicaland perceptual scaling. An example of these functions demonstrated the new expressivepower and options available in R, particularly for the visualization of conceptual pointdata.
Keywords: visualization, cartography, thematic map, propotional symbol, R.
1. Introduction
The visualization of spatial data on a map is crucial to impart spatial conception or ideasto others or to explore spatial data. This spatial data is usually expressed on a commonthematic map, such as a choropleth, proportional symbol, isarithmic, or dot map.
Each type of spatial data can be expressed using the most suitable type of thematic mappingmethod mentioned above for the best representation of data. Therefore it is essential tocarefully select a suitable mapping method in order to draw a thematic map. However,some mapping software occasionally do not support the mapping method selected as the bestchoice. Sophisticated mapping software should support many types of mapping so that userscan select one for the best representation of their spatial data.
Recently, cartographic packages in R including maptools, mapproj, rgdal, Rmap, and RAr-cInfo have been developed more actively and improved. This has facilitated the constructionof thematic maps such as choropleth and dot maps. Despite these recent enhancements in car-tographic functions in R, proportional symbol mapping, which is one of the common mappingapproaches, has not been packaged thus far.
2 Proportional Symbol Mapping in R
Data
Mathematical Scaling
Perceptual Scaling
10 100 500
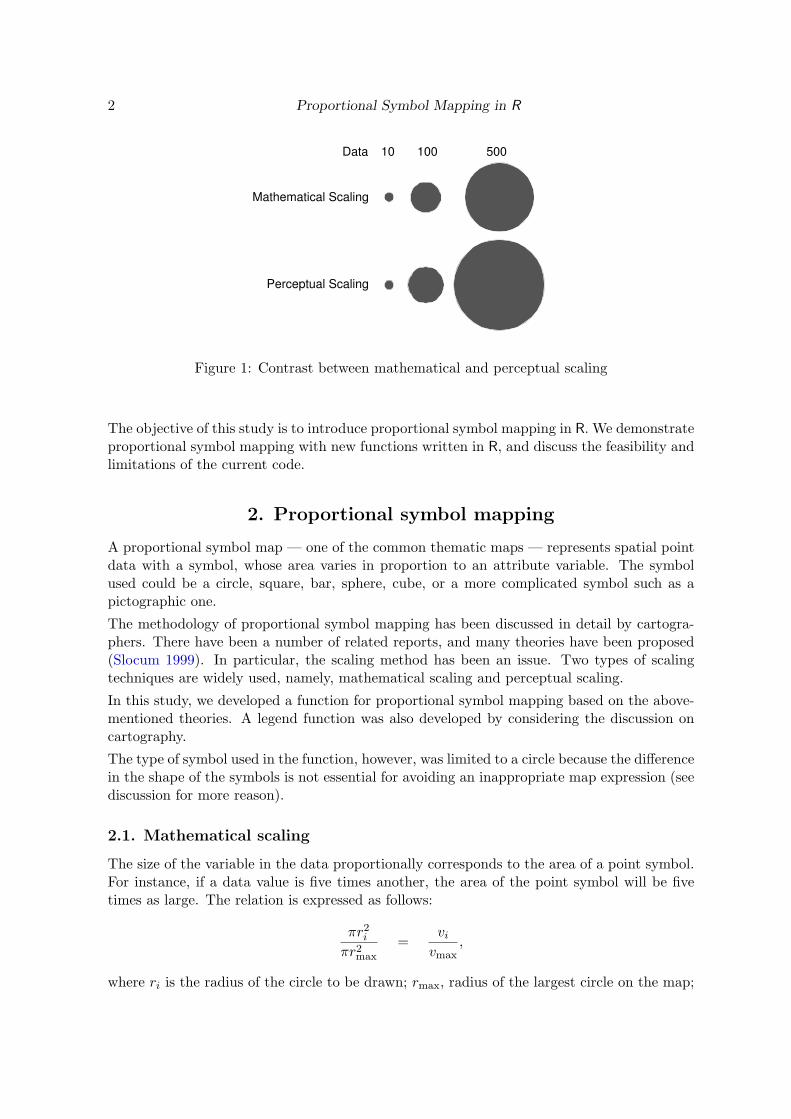
Figure 1: Contrast between mathematical and perceptual scaling
The objective of this study is to introduce proportional symbol mapping in R. We demonstrateproportional symbol mapping with new functions written in R, and discuss the feasibility andlimitations of the current code.
2. Proportional symbol mapping
A proportional symbol map — one of the common thematic maps — represents spatial pointdata with a symbol, whose area varies in proportion to an attribute variable. The symbolused could be a circle, square, bar, sphere, cube, or a more complicated symbol such as apictographic one.
The methodology of proportional symbol mapping has been discussed in detail by cartogra-phers. There have been a number of related reports, and many theories have been proposed(Slocum 1999). In particular, the scaling method has been an issue. Two types of scalingtechniques are widely used, namely, mathematical scaling and perceptual scaling.
In this study, we developed a function for proportional symbol mapping based on the above-mentioned theories. A legend function was also developed by considering the discussion oncartography.
The type of symbol used in the function, however, was limited to a circle because the differencein the shape of the symbols is not essential for avoiding an inappropriate map expression (seediscussion for more reason).
2.1. Mathematical scaling
The size of the variable in the data proportionally corresponds to the area of a point symbol.For instance, if a data value is five times another, the area of the point symbol will be fivetimes as large. The relation is expressed as follows:
πr2i
πr2max
=vi
vmax,
where ri is the radius of the circle to be drawn; rmax, radius of the largest circle on the map;
Journal of Statistical Software 3
vi, value of the variable for which the circle will be drawn; and vmax, the maximum value ofthe variable.
By solving for ri, we obtain
ri =(
vi
vmax
)0.5
× rmax. (1)
This formula was implemented in R code as the default scaling for drawing a map.
2.2. Perceptual scaling
It is well known that the perceived area of proportional symbols dose not match their math-ematical area; rather, we are inclined to underestimate the area of larger symbols. As asolution to this problem, it is reasonable to modify the area of larger circles in order to matchit with the perceived area.
Flanney (1971) experimentally derived a power function exponent of 0.5716 to adjust for thismismatch. For perceptual scaling, we can replace the exponent in (1) with the followingapproximation:
ri =(
vi
vmax
)0.57
× rmax.
This figure is still widely cited and used for proportional symbol mapping (Slocum 1999).
Figure 1 shows an example of circles drawn with mathematical and perceptual scaling tounderstand the extent of the difference between them. Since perceptual scaling adjusts thearea of circles in order to account for underestimation, the area of the larger circle in perceptualscaling is larger than that in mathematical scaling.
2.3. Legend design
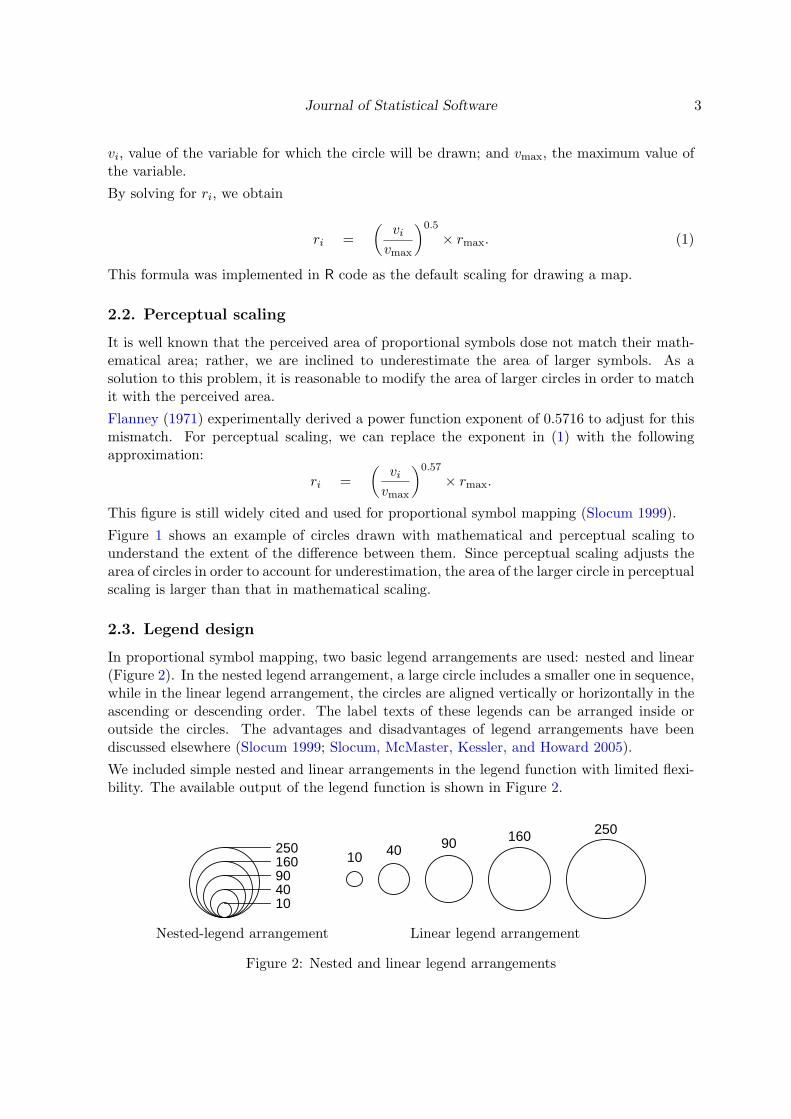
In proportional symbol mapping, two basic legend arrangements are used: nested and linear(Figure 2). In the nested legend arrangement, a large circle includes a smaller one in sequence,while in the linear legend arrangement, the circles are aligned vertically or horizontally in theascending or descending order. The label texts of these legends can be arranged inside oroutside the circles. The advantages and disadvantages of legend arrangements have beendiscussed elsewhere (Slocum 1999; Slocum, McMaster, Kessler, and Howard 2005).
We included simple nested and linear arrangements in the legend function with limited flexi-bility. The available output of the legend function is shown in Figure 2.
250160904010
10 40 90 160 250
Nested-legend arrangement Linear legend arrangement
Figure 2: Nested and linear legend arrangements

4 Proportional Symbol Mapping in R
3. R code
The R code of the proportional symbol mapping function (also available in the accompanyingfile ‘ProportionalSymbolMap.R’) is as follows:
ProportionalSymbolMap <- function(map,variable,type=c("mathematical","perceptual"),max.size=1500,symbol.fg=grey(.2), symbol.bg=grey(.5),legend.loc, legend.breaks,legend.type=c("nested","linear"),legend.cex=.6)
{if(missing(map)) stop("map object is missing.")if(!inherits(map, "Map")) stop("Map.obj must be of class Map")if(missing(variable)) stop("variable to be plot is missing")verts <- Map2points(map)[order(variable, decreasing = TRUE),]type <- match.arg(type)switch(type,
mathematical = scale <- sqrt(variable/max(variable))*max.size,perceptual = scale <- ((variable/max(variable))^0.57)*max.size)
scale <- scale[order(variable, decreasing = TRUE)]symbols(verts[,1:2],circle=scale/1.1,bg=symbol.bg,fg=symbol.fg,
inches=FALSE,add=TRUE)if((! missing(legend.loc)) & (! missing(legend.breaks))) {switch(type,
mathematical = {legend.r <- sqrt(legend.breaks/max(variable))*max.size
},perceptual = {legend.r <- ((legend.breaks/max(variable))^0.57)*max.size
})legend.type <- match.arg(legend.type)switch(legend.type,
nested = {r <- rev(legend.r); b <- rev(legend.breaks)for (i in 1:length(r)) {symbols(legend.loc[1],legend.loc[2]+r[i],
circle=r[i]/1.1,inches=FALSE,add=TRUE,bg=symbol.bg,fg=symbol.fg)
lines(c(legend.loc[1],legend.loc[1]+1.2*r[1]),rep(legend.loc[2]+2*r[i],2))
text(legend.loc[1]+1.2*r[1]+par("cxy")[1]/2,legend.loc[2]+2*r[i], b[i], adj=c(0,.5),cex=legend.cex)
}},

Journal of Statistical Software 5
linear = {r <- legend.rgap <- r[length(r)%/%2]s <- vector(); for (i in 1:length(r)) s[i] <- sum(r[1:i])x <- 2*s-r+(0:(length(r)-1))*gap + legend.loc[1]symbols(x, rep(legend.loc[2],length(r)), circles=r/1.1,
inches=FALSE, bg=symbol.bg, fg=symbol.fg, add=TRUE)text(x, legend.loc[2]+r+par("cxy")[2]*legend.cex, legend.breaks,
adj=c(.5,1), cex=legend.cex)})
}}
The default set in this function shows mathematical scaling, a gray symbol, and the maximumradius of 1500. Prior to mapping proportional symbols, a base map is essentially required onthe graphic device of R as a “new plot” termed in R. This is because a proportional symbolwithout the base map appears vague and may be confusing for the readers; however, in thefuture, the function can be expanded to be independent of the base map if the users stronglyrequest this. The order of the plotting symbol is determined such that a circle overlays alarger circle.
When both the legend location (legend.loc) and the divided sizes of the legend circles(legend.breaks) are specified, the legend is drawn; otherwise, it is not drawn. The defaultlegend is designed in the nested legend arrangement, while the linear legend arrangement isused when legend.type="linear". Gaps between the legend circles in the linear type arefixed at the same length as the radius of the medium-sized circle in the legend.
Another problem is how to decide the breaks, i.e., whether to set equal intervals or select themost representative symbols appearing on the map. The solution to this problem is left tothe user’s decision rather than incorporating it as an automatic process in the function.
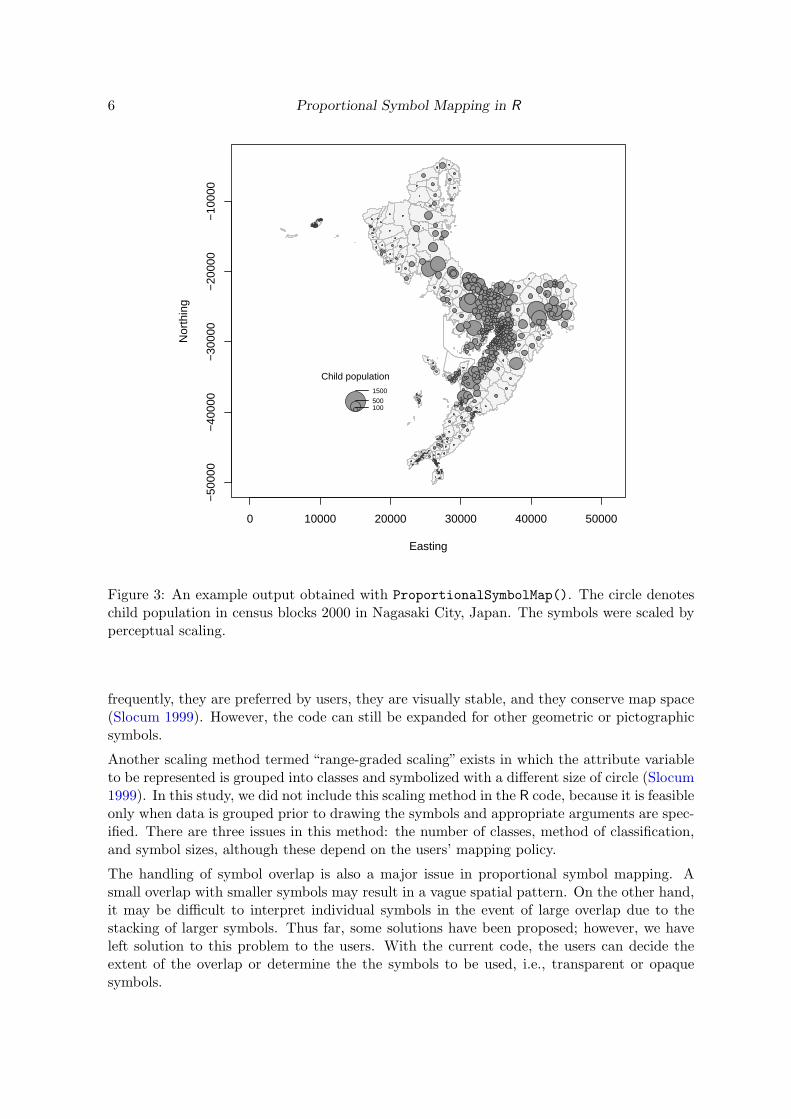
A sample output of ProportionalSymbolMap() is shown in Figure 3. From this figure, wecan easily understand the distribution of child population in Nagasaki City.
4. Discussion
We developed the proportional symbol mapping function by using the R language rather thanby the linkage (e.g. import and export) of external mapping software. It is important thatall operations are completely controlled by R commands and limited to the R environmentbecause such a condition yields immense benefits.
The advantage of proportional symbol mapping is that it displays attribute values for boththe measured point location (true point data) and the representative point of a polygon (con-ceptual point data). In such case, this mapping method is superior to choropleth mappingbecause the latter requires the display of the classification of values, while proportional symbolmapping does not. Therefore, providing the proportional symbol mapping function is benefi-cial for R users because it provides an appropriate approach to visualize true or conceptualpoint data.
The current code supports only circles for symbolization because they have been used most
6 Proportional Symbol Mapping in R
0 10000 20000 30000 40000 50000
−50
000
−40
000
−30
000
−20
000
−10
000
Easting
Nor
thin
g
1500
500100
Child population
Figure 3: An example output obtained with ProportionalSymbolMap(). The circle denoteschild population in census blocks 2000 in Nagasaki City, Japan. The symbols were scaled byperceptual scaling.
frequently, they are preferred by users, they are visually stable, and they conserve map space(Slocum 1999). However, the code can still be expanded for other geometric or pictographicsymbols.
Another scaling method termed “range-graded scaling” exists in which the attribute variableto be represented is grouped into classes and symbolized with a different size of circle (Slocum1999). In this study, we did not include this scaling method in the R code, because it is feasibleonly when data is grouped prior to drawing the symbols and appropriate arguments are spec-ified. There are three issues in this method: the number of classes, method of classification,and symbol sizes, although these depend on the users’ mapping policy.
The handling of symbol overlap is also a major issue in proportional symbol mapping. Asmall overlap with smaller symbols may result in a vague spatial pattern. On the other hand,it may be difficult to interpret individual symbols in the event of large overlap due to thestacking of larger symbols. Thus far, some solutions have been proposed; however, we haveleft solution to this problem to the users. With the current code, the users can decide theextent of the overlap or determine the the symbols to be used, i.e., transparent or opaquesymbols.
Journal of Statistical Software 7
5. Conclusion
The R function described in this paper is an initial function for proportional symbol mapping.It provides basic but sufficinet functionality for users who would like to express the attributevalues of spatial point data. Consequently, R is equipped with new expressive power and moreoptions.
Acknowledgments
We are especially grateful to Dr. Akihiko Suyama of the Radiation Effects Research Founda-tion for his valuable comments and advice.
References
Flanney J (1971). “The Relative Effectiveness of Some Common Graduated Point Symbolsinthe Presentation of Quantitative Data.” Canadian Cartographer, 8(2), 96–109.
Slocum TA (1999). Thematic Cartography and Visualization. Prentice Hall, New Jersey.
Slocum TA, McMaster RB, Kessler FC, Howard HH (2005). Thematic Cartography andGeographic Visualization. Pearson Education, Inc., Upper Saddle River, NJ, 2nd edition.
Affiliation:
Susumu TanimuraDepartment of Socio-environmental MedicineInstitute of Tropical MedicineNagasaki University1-12-4 Sakamoto, Nagasaki, 852-8523, JapanE-mail: [email protected]
Journal of Statistical Software http://www.jstatsoft.org/published by the American Statistical Association http://www.amstat.org/
Volume 15, Issue 5 Submitted: 2005-10-02January 2006 Accepted: 2006-01-24