proposal for air pollution monitoring system … · w. batko, z. skrobacki, m. oliszewski....
TRANSCRIPT

Journal of KONES Powertrain and Transport, Vol. 23, No. 3 2016
PROPOSAL FOR AIR POLLUTION MONITORING SYSTEM WITH PARTICULAR ATTENTION TO LINEAR EMISSIONS
Wojciech Batko
AGH University of Science and Technology Department of Mechanics and Vibroacoustics
Mickiewicza Avenue 30, 30-059 Kraków, Poland e-mail: mailto:[email protected]
Zbigniew Skrobacki
Kielce University of Technology Faculty of Mechatronics and Mechanical Engineering
Tysiąclecia Państwa Polskiego Avenue 7, 25-314 Kielce, Poland e-mail: [email protected]
Marek Oliszewski
AGH University of Science and Technology Department of Mechanics and Vibroacoustics
Mickiewicza Avenue 30, 30-059 Krakow, Poland e-mail: mailto:[email protected]
Abstract
At the beginning of the twentieth century, annual CO2 emissions were around 3 billion tons, while the current levels are 10 times higher now. It is estimated that approximately 22% of the so-called LINEAR emissions are produced by the Transport sector. The vehicles produced today have much lower CO2 emissions, however the number of vehicles on the streets is steadily growing – which in turn spikes up the emissions. Various policies have been put into place to protect the people, and the environment from the harmful impact of the automotive industry. However, the process of identifying the negative emitters such as point, line, and surface emitters is difficult due to the fact that they take place simultaneously. The transport and the spread of pollutant gas are mainly dependent upon the atmospheric phenomena recorded locally. Key factors include atmospheric pressure, wind speed and direction, and the phenomenon of temperature inversion and heat transfer phenomena in the atmosphere to name a few. The factors I have just mentioned are affected by the area’s topography, the concentration of buildings & plants in a given area that affect the oxygen levels in the area. Therefore, there is a need to establish a system for continuous monitoring of air quality with regard to the use of heating systems, operating systems, transportation management and vehicle traffic. This type of system shall consist of a “network & quote; of measuring instruments deployed in various locations within the measured territory. The use of a measuring system will: record pollution levels, pinpoint trouble areas, allow us to forecast the future pollution levels, as record necessary data to forecast the atmospheric conditions. The expert module will allow the use of artificial intelligence in the analysis of gathered data. Paper examines a system that meets the above-mentioned criteria. The system was created by an interdisciplinary research team led by Prof. Dr. Eng. W. Batko of the Academy of Mining and Metallurgy in Krakow, Poland.
Keywords: transport, road transport, simulation, combustion engines, air pollution, environmental protection
1. Introduction
The scientific and technical advancement in the last 200 years has led to major changes in our everyday lives, as well as the surrounding environment. If viewed from the anthropocentric
ISSN: 1231-4005 e-ISSN: 2354-0133 DOI: 10.5604/12314005.1216398

W. Batko, Z. Skrobacki, M. Oliszewski
perspective these are all very positive effects. The Earth scientists however, tend to have a very opposing view on this matter. They are quick to point out negative aspects the technical advancements have on the environment and our health.
This negative aspect of human activity is called Anthropoid Pressure. More information on the negative effects of the Anthropoid Pressure can be found from a wide range of publications, among others, the IPCC (Intergovernmental Panel on Climate Change) and the Polish National literature, among others in [13, 14].
The industrialization and population growth results in increased demand for energy obtained from fossil fuels. Increased consumption of oil, coal and gas resulted in greenhouse effect, as well as the infiltration of CO2 into the seas and oceans, which causes their acidification. The increased water acidity levels will cause biotope by destroying the coral reefs in the near future. At the beginning of the 20th century, the yearly CO2 emission amounted to 3 million tons, which is still 10 times less than the current CO2 emissions [12]. It is estimated that around 22% of the current CO2 emissions are created as part of the linear emissions, which in turn is generated by today’s transportation system. If we were to concentrate on the urban areas (excluding the so-called “heating season”) the linear emission can surpass its daily limit of upwards of 40% of the norm. When compared the CO2 concentration levels found in rural areas are around 380-440 ppm (v) with a busy street in an urban environment at 700 ppm(v) [14], the difference is staggering. Vehicles with combustion engines are also responsible for the emission of other greenhouse effects, and many other side effects that are harmful to the human health, and the environment. 2. Identification of pollutants emitted by the transport system into the Atmosphere
We can assume that almost 98% of the components of the combustion engine’s emissions are made up of particles that are inert to the surrounding environment. Non-toxic compounds include water vapour, and gases listed in Table 1.
Tab. 1. Acceptable non-toxic levels of vehicle emissions to the environment [10]
Component
% in a total volume of
Comments Engine ZI Engine ZS
Nitrogen (N2) 71.0 – 76.0 76.0 – 77.0 Non-toxic
Oxygen (O2) 0.1 – 2.0 10.0 – 16.0 Non-toxic
Steam (H2O) 7.0 – 11.0 3.5 – 5.0 Non-toxic
Carbon dioxide (CO2) 6.5 – 14.0 3.5 – 7.0 Non-toxic. greenhouse gas
Hydrogen (H) 0.1 – 4.0 0.0 – 0.1 Non-toxic
Just over 1% of toxic fumes are compounds presented in Table 2. Emissions from diesel-powered vehicles emit 0.3 % of toxic compounds in exhaust volume.
They differ from the gasoline-powered engines in that they produce higher contents of solids in the soot. They have been found to carry 14 mutagen compounds at a concentration of 2 to 13 ppm for 1 dm3 of diesel oil burned [1]. The smaller the soot particle is, the more dangerous it becomes for human health. Almost all the compounds listed in Table 3 are excreted in larger volumes in the exhaust fumes of gasoline-powered engine when compared with the diesel engine.
When comparing the harmfulness of these compounds need to pay attention to hydrocarbons in the form of volatile organic compounds. Volatile organic compounds (VOC – volatile organic compounds) may contain large amounts of various compounds, with methane (CH4) being one of the most important greenhouse gases. Other hydrocarbons present are called non-methane volatile organic compounds (NMVOC – non-methane volatile organic compounds), found to be
26

Proposal for Air Pollution Monitoring System with Particular Attention to Linear Emissions
carcinogenic and mutagenic (may cause heritable genetic damage). This group of dangerous compounds includes Polycyclic Aromatic Hydrocarbons (PAHs – polycyclic aromatic hydrocarbons); compounds of Benzene (C6H6) and 1.3 -Butadiene (C4H6). In Polish legislation, Benzene is the only hydrocarbon, for which defined concentration limits are (5.0 µg/m3) due to the human health factor Benzene belongs to the aromatic hydrocarbons. It causes toxic effects both through contact with the skin and through the respiratory system. It can cause damage to the nervous system and bone marrow, conditions such as anaemia, and leukaemia [14]. Large amounts of NMVOC containing Benzene are emitted by gasoline-powered engines, as well as the outdated heating furnaces burning solid carbonaceous fuels. The spark-ignition engines benzene is formed by the combustion of aromatic hydrocarbons contained in gasoline. Aromatic hydrocarbons make up a significant part of petrol. A perfect example is the Super 95 gasoline containing between 34 to 41% of Aromatic Hydrocarbons by volume. The volume of Benzene emissions is strongly influenced by the conditions on the road, the age of vehicles and their technical condition. During high traffic times, the concentration of Benzene in the air close to the road surface exceeds 20 µg/m3.
Tab. 2. Acceptable non-toxic levels of vehicle emissions for the people & the environment
Component
% in a total volume of
Comments Engine ZI Engine ZS
Carbon monoxide (CO) 2.0-10.0 0.01-0.1 Highly toxic; causes weakness of the heart by limiting the cells access to oxygen;
Nitrogen Oxide (NOX) 0.0-0.8 0.0-0.5 Toxic, causes skin & eye irritation; respiratory system problems; inflammation of the lungs, as well as bronchitis; very likely to cause damage to leafs; Volatile organic compounds (VOC ) contain various hydrocarbons (HxCx);
Volatile organic compounds (VOC) contain various hydrocarbons (HxCx)
0.1-1.0 0.01-0.4 VOCs can have different effects on human health and the environment, as well as nitrogen oxides contribute to the formation of ozone, which can damage lung tissue, methane CH4 is a greenhouse gas;
Aldehydes (RCHO) 0.0-0.3 0.0-0.03 Toxic
Sulphur dioxide (SO2) approx.
0.01
approx.
0.04
Toxic, irritant to skin; negative side effects on eyes and respiratory tract; can cause lung cancer; damages plant tissues;
Total Suspended Particulate (PM), (particles of solid particles from liquid droplets and aerosols)
0.007 Toxic; negative side effects on the respiratory and circulatory system; may cause cancer and heart disease;
A comprehensive assessment of the dangers of compounds found in automobile exhaust emissions and is included in numerous publications including Polish and foreign and [3, 5, 6, 7, 8, 9, 10, 14, 15, 17].
Based on the research done by the European Union conducted in the last decade of the twentieth century as part of the COST program (European Co-operation in the Field of Scientific Research) Action 319 “the estimated pollution emissions from the transport industry” research papers can be found on the internet at: http://www.inrets.fr/infos /cost319/index.html.
27
W. Batko, Z. Skrobacki, M. Oliszewski
Every few years the EU adopts increasingly restrictive emissions standards for new cars. Currently underway is [16] a monographic description of changes in EU emission rules and the principles upon which vehicles are approved for use, with regard to emissions. It presents a number of studies, both in stop & go situations, and longer road trips. 3. Linear emission and our mission
The simplest engineering calculations of emissions coming from gasoline engines are based on the basic knowledge of the chemical reaction of oxidation of the combustible ingredients contained in fuels [11]. In order to determine overall weight or volume of the exhaust gas from the combustion of mass or fuel depends on the available data about the makeup of the fuel (ex. mass; volume; fuel components, or the calorific value of the fuel).
The exact calculation of emissions is a difficult task that requires advanced knowledge of fuel combustion and the events associated with which according to the literature [3] can be classified as follows: – complete combustion of fuel & oil, – incomplete combustion of fuel & oil, – incomplete combustion of fuel & oil, – thermal dissociation of exhaust gases and vapours of fuel & oil, – processes accompanying the combustion example; oxidation of nitrogen in the air.
The above-mentioned phenomena depend on things such as engine design, regulatory changes, the type of fuel used, as well as the maintenance frequency. Achieving lower emissions can be achieved by: a) using improved emission lowering techniques b) keeping the engine maintained c) ensuring that devices responsible for lowering emissions are maintained [3]. In the 70's, some European countries began working on advanced models of emission control of vehicles on the road, with the consideration of additional key elements. As a result, many different models were created, yet the only common elements pointed to the relationship amongst groups of cars, as opposed to individual vehicles. In the monograph [2] we can see the classification of the various models and their characteristics, as well as the use case, and the description of their development.
A significant achievement of long-term and coordinated work of research teams from many countries is a model COPERT (Computer Programme to Calculate Emission from Road Traffic), which was created as part of the scientific program CORINAIR (Coordinated Environmental Information).
As a result of a successful long-term cooperation amongst the various research teams from different the so-called model COPERT (Computer Programme to Calculate Emission from Road Traffic) came about. A long time collaboration that was created as part of the scientific program named CORINAIR (Coordination’ Information Environmental). Model COPERT is being improved, and new versions are being released under the same name [4]. COPERT III is the version recommended by the General Directorate for Construction of National Roads and Motorways to be used in environmental road study cases [19]. The founders of COPERT used the average emissions of different groups of vehicles, taking into consideration the state of the fleet of the particular European country. When conducting traffic simulations, the parameters taken into consideration included road conditions characteristics, the speed and the density of the traffic, as well as the vehicle type. The simulation allowed for data collection about fuel consumption, as well as emissions from particles such as: Carbon Dioxide, Carbon Monoxide, Nitrogen Oxides, Nitrous Oxide, Sulphur Oxides, Ammonia, Hydrocarbons, Methane, Aromatic Hydrocarbons (PAH - polycyclic aromatic hydrocarbons), Dioxins and Furans, Heavy metals, particulate matter PM (particulate matter). In Poland, a system called OPERAT with capabilities similar to those COPERT was created. Both programs allow you to calculate the spread of the emitted gases and dust from road vehicles. OPERAT system uses a methodology that is consistent with the recommendations of the regulations
28

Proposal for Air Pollution Monitoring System with Particular Attention to Linear Emissions
of the Polish Ministry of the Environment. The Regulation presents a detailed methodology dispersion of gas and dust for point, surface and line emitters.
This methodology is based on Pasquille'a [18] equation and the theory known as the Gaussian cloud model. After using a number of simplifications and transformations in the differential equation of turbulent diffusion [11] equation Pasquille'a emissions linear in its simplest form to calculate the gas concentration at a point specified by the Cartesian coordinates (x, z) has the form:
𝐶𝐶(𝑥𝑥, 𝑧𝑧) = 2𝑚𝑚𝐿𝐿
√2𝜋𝜋𝑈𝑈𝜎𝜎𝑧𝑧 𝑒𝑒𝑥𝑥𝑒𝑒 �− 1
2� 𝑧𝑧𝜎𝜎𝑧𝑧 �2� , (1)
where: C – gas concentration (impurities), x, z – appropriate distance and height from the emission source[m], mL – linear extraction efficiency [g/(m·s)], U – the average wind speed in the direction corresponding to the road [m/s], σz – the dispersion coefficient of contamination as determined by empirical dependence model by
Briggs [m/m]. In situations when the wind direction is not perpendicular to the road, you can either one of the
other models, such as Luhar's, Patil's or Turner’s. One of the main reasons why Pasquille’s model became such a success is its versatility. It takes into consideration the impact of the weather conditions, and the terrain. When taking measurements, the user has the option to choose one of the appropriate programs corresponding to the outdoor weather conditions. There are six options including wind speed; clouds, daylight/nigh time, solar radiation. Picking the corresponding program allows the user to get more readings that are accurate. Field conditions are taken into account by determining the aerodynamic and roughness of the terrain, as well as degree of the area’s development. Current Polish regulations regarding the emission measurements are contained in the Environmental Protection Law. 4. The need for emission monitoring in selected terrain
Thanks to the latest technological innovations the modern cars nowadays are more efficient, have lower C02 emissions, and produce more power than ever before in the history of the mankind. However, with the automobile’s popularity rising, so is the emission of harmful gases into the atmosphere in urban areas. In the EU alone, between 1990-2004 the CO2 emissions increased by 26%, while reducing greenhouse gas emissions approx. 5 % [12]. Urban traffic is responsible for 40% of CO2 emissions and 70% of emissions of other pollutants. Environment protection acts have been put into place to protect the people from harmful impacts of the transport industry. There is a continuous need to monitor the air quality, as well as a need to identify new point, line and surface emitters.
The process of identifying emitters is very complex, as many factors such as atmospheric phenomena, terrain conditions play part. This was previously described by Pasquille’s model on page 3. The CO2 emissions are in part affected by the city structures, and the architectural make of the landscape. In polycentric cities, the increased emissions are caused by an increase in the transport industry. In densely populated cities monocentric cities the emission has dropped, due to the increased efficiency associated with such urban models.
Linear emissions are characterized by emission source located low to the ground, emissions being directed in a downward position, irregular emission. After a closer analysis of the following local conditions: a) topography, b) the distribution plants/bushes at varying heights, c) the density of the architectural infrastructure we can safely say that the above factors hinder the natural ventilations & circulation of the area. In fact, these factors can disrupt the natural emission cycle, thus causing the emissions to accumulate in the selected areas. The data recorded by one of the measuring stations (nodes) can be viewed as unreliable for the following reasons: a) lack of data on
29
W. Batko, Z. Skrobacki, M. Oliszewski
concentrations forming compounds (the so-called “background”); b) the data obtained will be heavily dependent on the speed and direction of the wind. Because of the above-mentioned factors, there is a need to establish a system of continuous air quality monitoring performed by multiple stations forming a network in which the amount and location can be determined after a thorough analysis of the local conditions has been done (taking into consideration the impact of surface, point and linear emitters). A measuring system with stations (nodes) located in multiple locations in the area that’s being investigated should provide us with the following: pollutant data values (in the form of a time series), the ability to located the main pollutants; the ability to predict the distribution of concentrations of pollutants in the air; the ability to record the observe & record the current emission values (taking into consideration the weather conditions); the ability to generate analysis reports (using the Expert module /neural network). 5. An automated system for continuous measurement of emissions
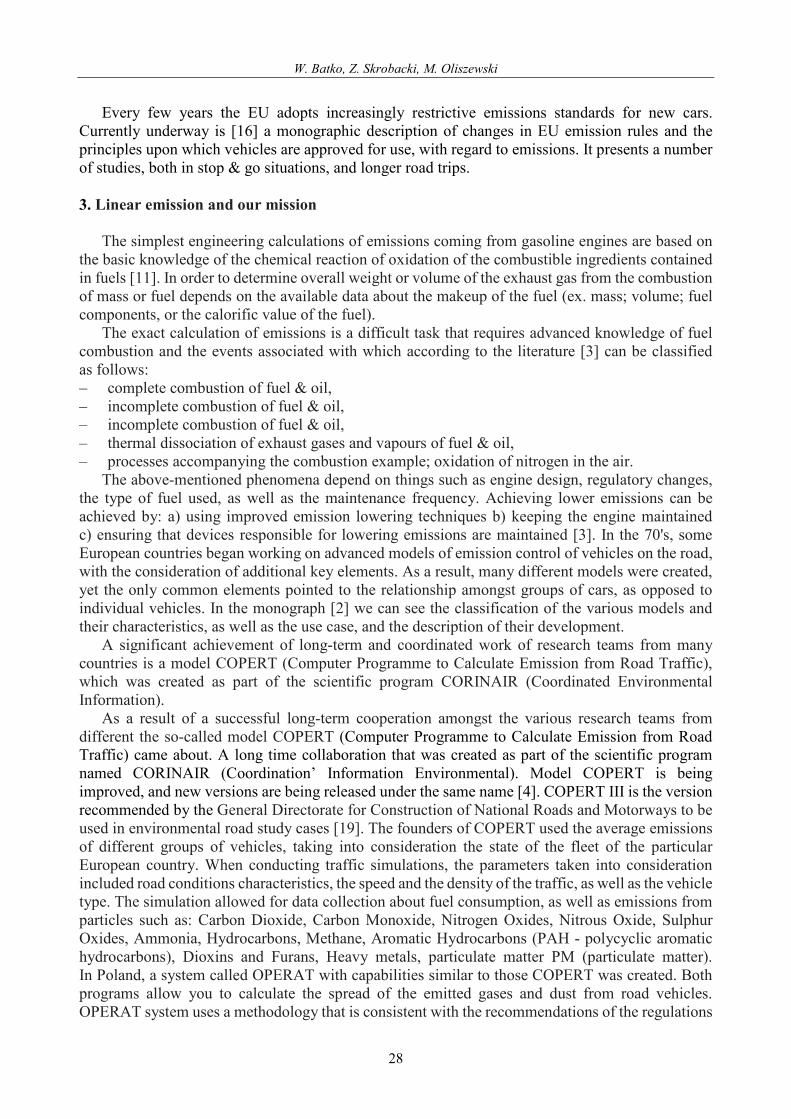
In order to identify the contributing factors behind linear emissions, it is necessary to analyse the relationship between traffic density, noise levels and air pollution. Our prototype monitoring system, which is based on the innovative technology, incorporating energy-efficient monitoring stations equipped with electrochemical sensors measuring gas concentrations, as well as o C, CO2, NO2 and O3. Our prototype system is equipped with sensors that monitor not only emissions, but also temperature, humidity, and atmospheric pressure.
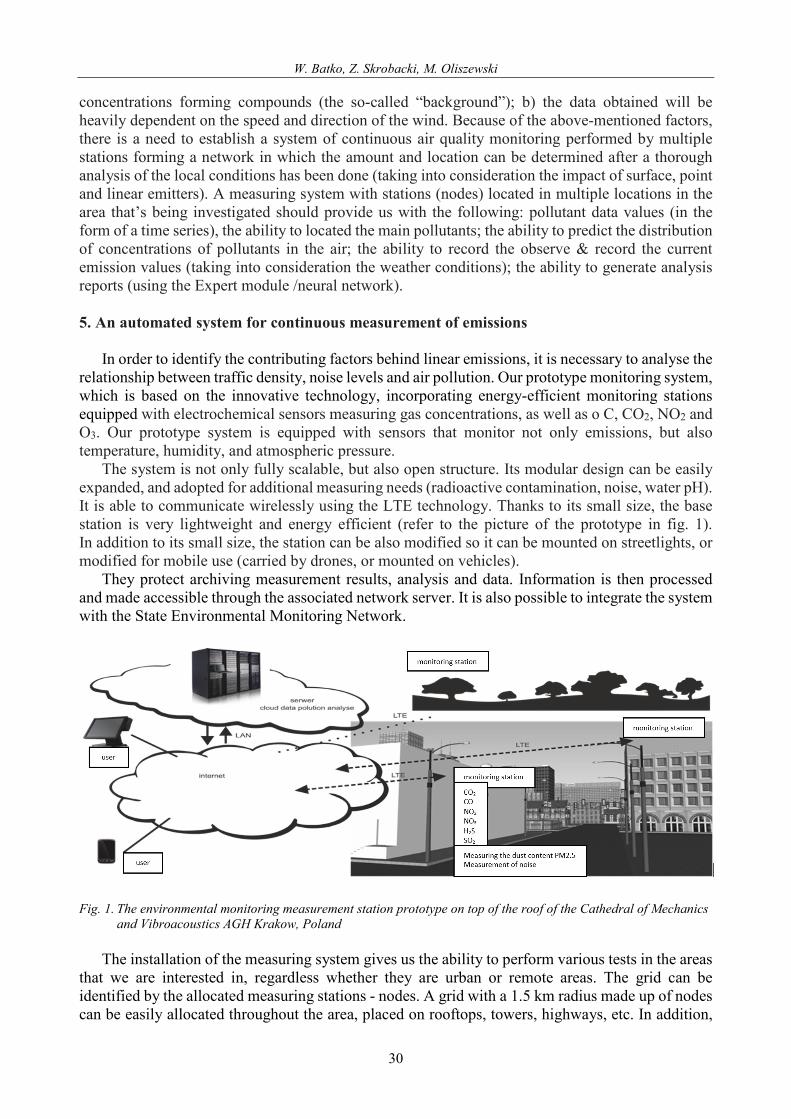
The system is not only fully scalable, but also open structure. Its modular design can be easily expanded, and adopted for additional measuring needs (radioactive contamination, noise, water pH). It is able to communicate wirelessly using the LTE technology. Thanks to its small size, the base station is very lightweight and energy efficient (refer to the picture of the prototype in fig. 1). In addition to its small size, the station can be also modified so it can be mounted on streetlights, or modified for mobile use (carried by drones, or mounted on vehicles).
They protect archiving measurement results, analysis and data. Information is then processed and made accessible through the associated network server. It is also possible to integrate the system with the State Environmental Monitoring Network.
Fig. 1. The environmental monitoring measurement station prototype on top of the roof of the Cathedral of Mechanics and Vibroacoustics AGH Krakow, Poland
The installation of the measuring system gives us the ability to perform various tests in the areas
that we are interested in, regardless whether they are urban or remote areas. The grid can be identified by the allocated measuring stations - nodes. A grid with a 1.5 km radius made up of nodes can be easily allocated throughout the area, placed on rooftops, towers, highways, etc. In addition,
30
Proposal for Air Pollution Monitoring System with Particular Attention to Linear Emissions
if the measuring nodes are appropriately dispersed they can also be used to measure noise. Thus, we can create quickly and efficiently a system that will not only measure emission levels, but noise levels as well. For uninterrupted emission measurements, we recommend the use of mobile (self-powered) measuring stations, with linear arrangement on each side of the street. In order to get proper readings, the measuring stations shall be placed at three or more different height levels (lower, middle, upper). The measuring stations shall measure in synchronous mode. The synchronization is overlooked by a central server, whose role is to archive the emissions data, concentrations of gases from each monitoring station. This type of a complex measurement system will allow for snapshot readings of the area monitored in time increments no less than 1-2 seconds. Data obtained will allow the user to fine tune the mathematical model of air pollutant emissions under observance of the various emitters, the speed of their movement and the influence of atmospheric parameters.
Fig. 2. Block diagram of the air quality-monitoring network 6. Final Comments
Improving the air quality and the quality of life in an urban environment is the main goal here. The prototype of the emission monitoring system was developed with safety of the residents in mind. The ability to collect data about air pollution, its main causes & sources gives more insight. Being able to pinpoint the major trouble areas in terms of traffic, road noise and concentration of pollutants is crucial. In today’s world, the ability to work with a spatial information system is the decisive factor in running a SMART CITY. As mentioned in the article, in today’s environment there is an ongoing need to support decisions using data, and artificial intelligence. The prototype system does exactly that, by providing decision support, and generating rating phenomena using the expert module. Being able to forecast the concentration of air pollutants used to be considered rocket science, but that is behind us now. With the above-mentioned system running a SMART CITY and keeping emission levels under control is available here now.
31

W. Batko, Z. Skrobacki, M. Oliszewski
References [1] Baczewski, K., Kałdoński, T., Paliwa do silników o zapłonie samoczynnym, Wydawnictwo
Komunikacji i Łączności, Warszawa 2004. [2] Brzozowska, L., Brzozowski, K., Drąg, Ł., Transport drogowy a jakość powietrza
atmosferycznego. Modelowanie komputerowe w mezoskali, Wydawnictwo Komunikacji i Łączności, Warszawa 2009.
[3] Chłopek, Z., Ochrona środowiska naturalnego, Wydawnictwo Komunikacji i Łączności, Warszawa 2002.
[4] COPERT [in:] www.emisia.com/copert. [5] EEA: Air quality in Europe, Report No. 5/2015, Published 30.11.2015 [in:]
www.eea.europa.eu/publications/. [6] EEA: Evaluating 15 years of transport and environmental policy integration – TERM 2015:
Transport indicators tracking progress towards environmental targets in Europe, Report No. 7/2015. Published 14 Dec 2015 [in:] www.eea.europa.eu/publications/.
[7] EEA: Explaining road transport emission – A-non technical guide, Published 27.01.2016 [in:] www.eea.europa.eu/publications/.
[8] EMEP/CORINAIR: Atmospheric Emission Inventory Guidebook, First edition, European Environment Agency, Copenhagen, Denmark 1996 [in:] www.eu-portal.net.
[9] EMEP/CORINAIR Atmospheric Emission Inventory Guidebook. Draft second edition. EMEP Task Force on Emission Inventories, 1998, http://www.aeat.co.uk/netcen/airqual/TFEI/unece. htm.
[10] Gronowicz, J., Ochrona środowiska w transporcie lądowym, Wydawnictwo i Zakład Poligrafii Instytutu Eksploatacji w Radomiu, Radom 2003.
[11] Juraszka, B., Dąbrowski, T., Podstawy ochrony atmosfery, Wydawnictwo Politechniki Koszlińskiej, Koszalin 2011.
[12] Kamieniecki, K., Twoje miasto – Twój klimat, Instytut na rzecz Ekorozwoju, Warszawa 2008. [13] Kassenberg, A., Ja, mój samochód, ale nasz klimat, Instytut na rzecz Ekorozwoju, Wydawca:
Polska Zielona Sieć, Kraków 2006. [14] Kociołek-Balawejder, E., Stanisławska, E., Chemia środowiska, Wydawnictwo Uniwersytetu
Ekonomicznego we Wrocławiu, Wrocław 2012. [15] Merkisz, J., Ekologiczne problemy silników spalinowych, Wydawnictwo Politechniki
Poznańskiej, Poznań 1998. [16] Merkisz, J., Pielecha, J., Radzimirski, S., Emisja zanieczyszczeń motoryzacyjnych w świetle
nowych przepisów Unii Europejskiej, Wydawnictwo Komunikacji i Łączności, Warszawa 2012.
[17] OECD, Environmental data compendium 1997, Organization for Economic Co-operation and Developmentt Publication Services, Paris 1997, [in:] www.eu-portal.net.
[18] Pasquill, F., Smith, F. B., Atmospheric Diffusion, Chichester UK, Ellis Horwood 1983. [19] Bohatkiewicz, J., Metoda prognozowania emisji zanieczyszczeń powietrza od pojazdów – model
i program komputerowy COPERT III. Biuro Ekspertyz i Projektów Budownictwa Komunikacyjnego „EKKOM”, Krakow 2008.
32