proposal metrics dashboard - california chapter - apmp · proposal metrics dashboard ... every 6...
TRANSCRIPT

Proposal Metrics Dashboard What Gets Measured Gets Done
Topics
Why Keep Metrics?
What Metrics Should We Keep?
What is the Easiest Way to Collect Metrics?
What is the Easiest Way to Report Metrics?
Tips and Tricks to Building a Dashboard
A Few Excel Basic Tools
A Few Excel Advanced Tools
Walk Through the Live Dashboard
Questions
Slide 2

Where to Get the Dashboard and Presentation
www.pgeeks.com
User Name: APMP
Password: 2013
Download Files
Slide 3
Why Keep Metrics?
Helps YOU Recognize a Winning and a Losing Proposal Earlier than Award Date Help Increase Win Ratios Helps Prioritize Proposal Activities Helps with Bid / No-Bid Decisions
Help Proposal Team Morale Increases the Metrics on if the Team Did a Great Job or Not Nothing Wrong with Losing a Race When You Did Your Best
Helps Upper Management Relationship Imagine Giving a Report that Says:
Slide 4
“Win Ratio is 95% When We Find Out About the Proposal 2 Months in Advance of RFP. Win Ratio is 10% When We
Know About the Proposal 1 Week After the RFP.”

What Metrics Should We Keep? Different Categories of Metrics
Basic Data (minimum amount) Names Dates Numbers Text
Key Metrics (maximum amount) Yes / No (understand the default) Drop Down Choices Formulas
Slide 5
Remember You Want to Be Able to Collect These in a
Minimal Amount of Time

Mark White’s Top Ten Metrics
Early Notification of RFP
Capture Plan Completed Prior to RFP Release
Identify Program Manager Early
Compliance Matrix Completed Prior to Kick-Off
Responsibility Matrix Completed Prior to Kick-Off
Formal Kick-Off Meeting
Formal Red Team Review
Formal Schedule
Deadline Dates Met
Oral Proposals Required
Slide 6
Other Metrics Checklist for RFP Used
Client Debrief Received
Executive Summary Used
Experience Matrix Used in the Proposal
Key Personnel Matrix Used in the Proposal
Identify Win Themes Early
Hard Copies Required
Soft Copies Required
Formal Pink Team
Percentage of Graphics
Formal Edit
Slide 7
What Parts Can
We Do Without
and Still Win?
What is the Easiest Way to Collect Metrics?
Who Typically a Single Person within the
Proposal Center is Responsible for the Master Collection Each Proposal Manager enters their
own information Could have a separate spread sheet for
each proposal manager That information is transferred on a
monthly or quarterly basis
When At First Assignment of the Proposal At RFP Release At Red Team At Final Production At Award
How Simple Excel Spreadsheet Metrics go across columns Proposals go down rows
Slide 8
Add Metric Collection to Your Checklist
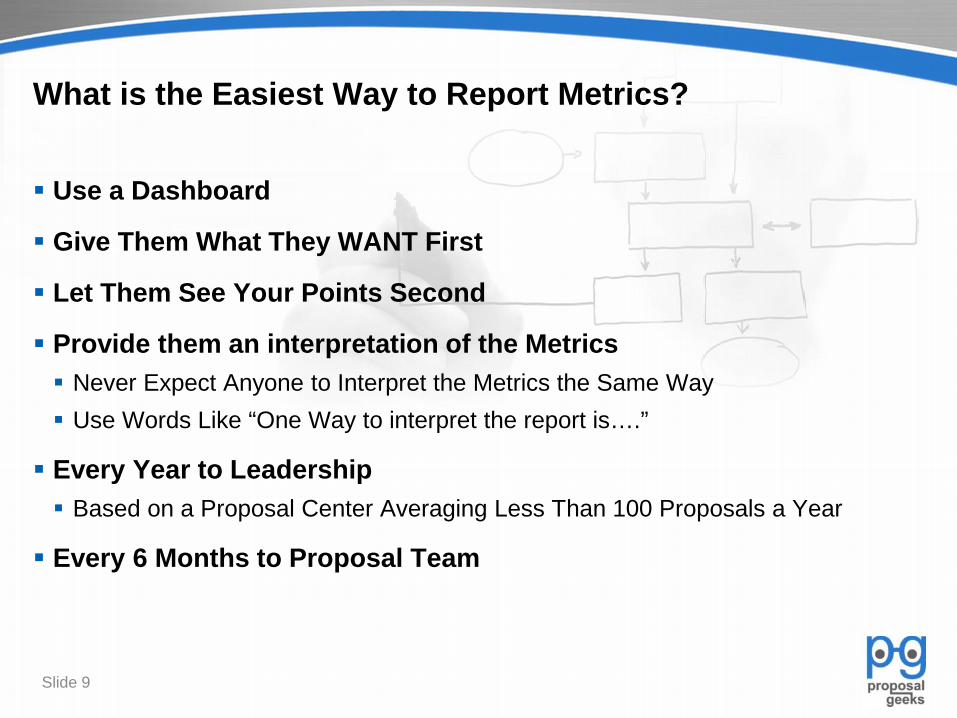
What is the Easiest Way to Report Metrics?
Use a Dashboard
Give Them What They WANT First
Let Them See Your Points Second
Provide them an interpretation of the Metrics Never Expect Anyone to Interpret the Metrics the Same Way Use Words Like “One Way to interpret the report is….”
Every Year to Leadership Based on a Proposal Center Averaging Less Than 100 Proposals a Year
Every 6 Months to Proposal Team
Slide 9

Tips and Tricks to Building a Dashboard
Naming Conventions Cells Ranges Validation Lists
Using Styles Build Menu as You Go Color Code You Can Always Change the Styles to the Same Look at End
Build It as If You Plan to Train People to Use It
Slide 10

A Few Excel Basic Tools and Tips
Naming Cells and Ranges
Name Manager
Validation Lists
Don’t Format the Entire Sheet Format Sets of 100 Gray Line at Bottom of Formatted Set Archive at 500 or Sooner if Applicable
Slide 11

Name Manager
Use Consistent Prefixes for Sorting and Using in Formulas From To Small From = S_F Small To = S_T
Result R_RFP R_Due R_Size
Vlist_
Keep Range Ends Consistent $E$104 $M$104 $O$104 $P$104 Slide 12
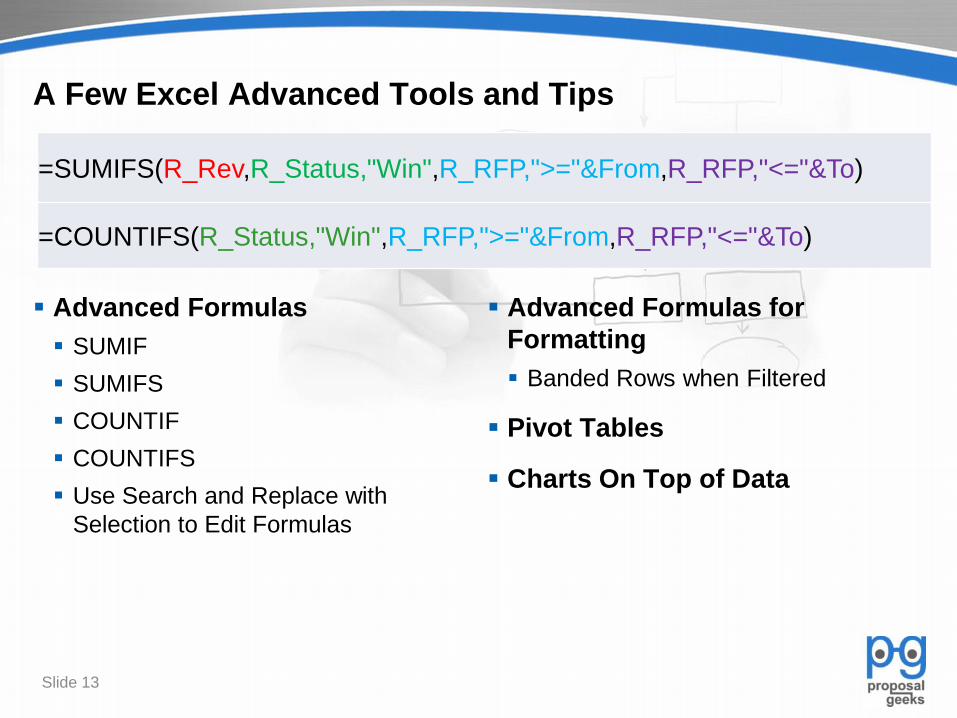
A Few Excel Advanced Tools and Tips
Advanced Formulas SUMIF SUMIFS COUNTIF COUNTIFS Use Search and Replace with
Selection to Edit Formulas
Advanced Formulas for Formatting Banded Rows when Filtered
Pivot Tables
Charts On Top of Data
Slide 13
=SUMIFS(R_Rev,R_Status,"Win",R_RFP,">="&From,R_RFP,"<="&To)
=COUNTIFS(R_Status,"Win",R_RFP,">="&From,R_RFP,"<="&To)

Walk Through the Live Dashboard
Slide 14
Drop Down Choice On
Hover
When Yes, We Win 100%
When No, We Win 25%
NOTE: At time of design. Excel bug with 100% stacked charts with numbers between 83 and 90%. Graphic will appear wrong.

How to Customize Your Dashboard
Change the From and To Dates on the Dashboard Sheet
Change the Min and Max Amounts on the Dashboard Sheet
Change the Factor Amount for Projections
To Change to Your Own Metrics Don’t Change Formulas Don’t Change Range Names DO Change the Metric Name on V Lists Tab DO Change the Column Title (Purple) on Proposal Metrics Tab
Slide 15
Questions
Slide 16