propositions & programs that really work in...
TRANSCRIPT

Advancing Channel Value Propositions & Programs that really work in Distribution Julian Dent VIA International

Advancing Compelling Propositions
To advance a compelling proposition, first you have to: • Think like a distributor, understand their business model • Focus on the outcomes they are measured on • Focus on the metrics they use to assess vendor performance • Identify where they are hurting right now
Then you can put together a proposition that: • Addresses the above • Leverages your unique strengths and assets • Is clear, consistent and can be communicated by your front line
teams
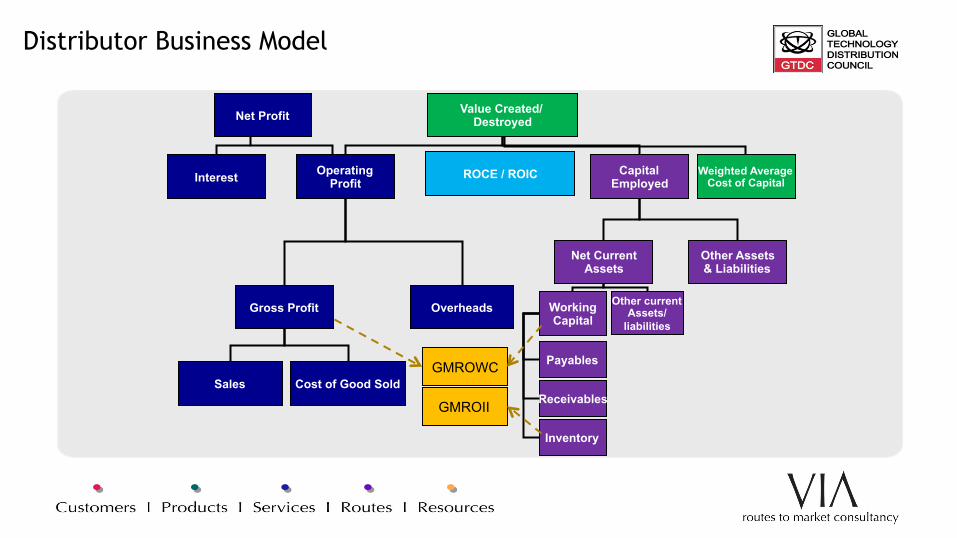
Distributor Business Model
Sales Cost of Good Sold
Gross Profit Overheads
Interest
Net Profit
Capital Employed
Net Current Assets
Payables
Receivables
Inventory
Other Assets & Liabilities
Other current Assets/
liabilities Working Capital
Weighted Average Cost of Capital
Operating Profit
Value Created/ Destroyed
ROCE / ROIC
GMROII
GMROWC

Global Broadline distributor model: Ingram Micro 2015

Global Broadline distributor model: Tech Data 2015

Global Value-Added Distributor model: Avnet 2014/15
Avnet
Year 2 June 27 , 2015 AccountsYear 1 June 28 , 2014 Accounts
Year 2 $687 2.5% $6,528 $5,422Year 1 $635 2.3% $6,272 $5,152
Year 2 $828 3.0% $10,800 $5,378Year 1 $790 2.9% $11,251 $6,099
Year 2 $3,194 11.4% $2,366 8.5% $4,272 $1,106Year 1 $3,226 11.7% $2,436 8.9% $4,979 $1,120
Year 2 $27,925 100% $24,731 88.6% $2,482 37 $934Year 1 $27,500 100% $24,274 88.3% $2,613 39 $1,577
Year 2 $5,054 66 Year 1 $5,221 69
Year 2 $3,338 49 $3,338Year 1 $3,402 51 $3,402
Year 2 $4,198 53 Year 1 $4,432 57
GMROWC Working capital
76%73%
Receivables
GMROII Payables Payables
129%123%
$1,106$1,120
Revenue Cost of Sales Inventory Other current liabilities
$2,297
Gross profit Overheads Cash Non interest liabilities Cash
10.1%
Operating profit Fixed assets Total Assets
Excess cash & non int liabs
$2,158
Net Operating profit after tax ROCE Capital
employedInvested capital
10.5%
ROIC
12.7%12.3%

Global Value-Added Distributor model: Arrow 2015

4. CEO for a Day
See if you can put yourselves into shoes of the distributor CEO

Activity: The new Distributor CEO
You have been appointed CEO of CenterState:
ê Review the 2 years of financial statements & ratios
ê Identify your three most significant positive trends over the period
ê Identify your three major areas of concern
ê Be prepared to share your answers

CenterState Distribution business model

CenterState Distribution business model

Debrief: CenterState CEO 1. Revenue up 10% and Gross
Margins up $131m
2. Operating margin up 0.2%
ê Operating Profit up 29%
ê Overheads down as % of sales and only up $56m
3. ROCE improved by 21% (6.7% à 8.1%)
DPO up 1 day
1. Cash reserves down by $471m
ê Additional $479m of WC (up 24%) to do $2.3bn (up 10%) additional turnover
2. Gross margin down 0.3%
3. Working capital up 4 days as DPO up only 1 day
ê DIO up 4 days, to 53 days
ê DSO up 1 day
GMROII down 9% & GMROWC down by 16%
ROIC down 0.1%

Key business model insights
Profit is a very small number between big numbers Capital intensive, cash flow matters Many small changes add up Earn and turn matter Key ratios and metrics
(GM%, NM%, DIO, DSO, DPO, WC Days) Combination measures are used to manage the business model
and measure vendors (ROCE, GMROII, GMROWC)

Margin trends - All Distributors
0
20,000
40,000
60,000
80,000
100,000
120,000
140,000
160,000
180,000
-5%
0%
5%
10%
15%
2008 2009 2010 2011 2012 2013 2014 2015
Reve
nue
$Thousands
Mar
gin
%Distributor Margin Trend - Total
Revenue $ Gross Margin % Overheads % Operating Margin % Net Margin % (Pre Tax)

Working Capital Broadline Distributors
0
10
20
30
40
50
60
70
80
90
2008 2009 2010 2011 2012 2013 2014 2015
Days
Distributor Working Capital Trend - Broadline
InventoryDIO
ReceivablesDSO
PayablesDPO
WorkingCapital Days

Working Capital Value Added Distributors
0
10
20
30
40
50
60
70
80
90
2008 2009 2010 2011 2012 2013 2014 2015
Days
Distributor Working Capital Trend - VAD
InventoryDIO
ReceivablesDSO
PayablesDPO
WorkingCapital Days

Developing your own Programs
• What are the distributor’s objectives?
• Which measures matter most?
• How do we as a vendor perform inside the distributor’s business model?
Business case
Vendor program Strategies Business
Priorities
• What are the distributor’s strategies?
• How does it plan to execute them?
• Which measures will change?
• What should be the business impact?
• How well does the program fit the distributor’s strategies?
• How will other distributors respond to this program?
• What measures will be affected & how?
• What is the timing and cash flow impact?
• What are the risks?

How do we perform inside the distributor’s business model?

Category report card – How are vendors performing?

How will our Vendor Program impact the distributors’ business model?
Profitability impact Working Capital impact Risks Revenues Gross Margins
(FE & BE) Cost structure Inventory Receivables Payables

Example: Assessing Vendor Programs
Program 1: • Extended credit (25 days) or Consignment stock to support channel take-up
of cloud-centric offerings • Have to take on additional specialist sales & product management headcount
(which vendor funds only 50%) • Have to support resellers delivering projects with longer implementation
cycles (resulting in increased receivables) Program 2 • PFR program which drives growing the SMB-focused reseller base because
vendor is taking larger resellers direct • Marketing funds are available to support well-engineered programs Program 3 • Quarter-end inventory loading, with additional lucrative rebate for achieving
certain volumes. Rebate to be paid on normal basis (ie 90 days after earning)

First Question: What are the distributor’s objectives (from the previous analysis)?
Profitability impact Working Capital impact Risks Revenues Gross Margins
(FE & BE) Cost structure Inventory Receivables Payables

Debrief: What are the distributor’s objectives (from the previous analysis)?
Profitability impact Working Capital impact Risks Revenues Gross Margins
(FE & BE) Cost structure Inventory Receivables Payables
Continued growth Reverse declining Gross Margins
Further reduction dependent on growth
Inventory days need reducing urgently
DSO needs reducing
Need credit lines to grow with sales
Cash facilities constrain growth
Second Question: How will the program impact the business measures of the distributor?

Debrief: Business impact of Program 1 (cloud-centric offering)
Profitability impact Working Capital impact Risks Revenues Gross Margins
(FE & BE) Cost structure Inventory Receivables Payables
Continued growth Reverse declining Gross Margins
Further reduction dependent on growth
Inventory days need reducing urgently
DSO needs reducing
Need credit lines to grow with sales
Cash facilities constrain growth
New growth from cloud services
Higher margins on new offerings
Incremental headcount costs
Neutral at best – may have to take on new SKUs
Will increase unless strong credit management on traditional business
Extended credit Cash tied up Credit limits exhausted Revenues below targets New sales staff unproductive

Debrief: Business impact of Program 2 (PFR program)
Profitability impact Working Capital impact Risks Revenues Gross Margins
(FE & BE) Cost structure Inventory Receivables Payables
Continued growth Reverse declining Gross Margins
Further reduction dependent on growth
Inventory days need reducing urgently
DSO needs reducing Need credit lines to grow with sales
Cash facilities constrain growth
Loss of revenue from larger resellers
Higher margins from SMB focused resellers
Higher account handling cost from more accounts
Neutral Will increase unless strong credit management on SMB resellers
Neutral Cannot replace lost revenue fast enough Threat to net profit if extra cost > extra funding Rebates
MDF funding to offset marketing activities

Debrief: Business impact of Program 3 (Quarter-end inventory loading)
Profitability impact Working Capital impact Risks Revenues Gross Margins
(FE & BE) Cost structure Inventory Receivables Payables
Continued growth Reverse declining Gross Margins
Further reduction dependent on growth
Inventory days need reducing urgently
DSO needs reducing Need credit lines to grow with sales
Cash facilities constrain growth
Likely to increase… or bulge
Under threat from discounting to hit volume targets
Neutral Will bulge due to loading
Will increase with vendor debit and sales bulge
Neutral Rebates passed to street so not available for financing stock Over-trading exhausts cash limits
Rebates may be consumed by discounts

Advancing Compelling Propositions
To advance a compelling proposition, first you have to: • Think like a distributor, understand their business model • Focus on the outcomes they are measured on • Focus on the metrics they use to assess vendor performance • Identify where they are hurting right now
Then you can put together a proposition that: • Addresses the above • Leverages your unique strengths and assets • Is clear, consistent and can be communicated by your front line teams How can you develop this level of mastery?

GTDC Certificate & Diploma in Distribution
This is to certify that
Julian Dent
Chairman
VIA International Ltd
Tim Curran
CEO Global Technology Distribution Council
Has achieved the GTDC accreditation standard of
Certificate
in Technology Distribution
Date awarded: 28/11/2013 Certificate no: 344991/C
BRIDGET MELLITCHEY
This is to certify that
Has achieved the GTDC accreditation standard ofDiplomain Technology Distribution
Julian DentChairmanVIA International Ltd
Tim CurranCEOGlobal Technology Distribution Council
RENTON D’SOUZA
Date awarded: 29/06/2015Diploma no: 797476/D

Gaining momentum with Vendors..
• Acer • Apple • Canon • Cisco • Eaton • Fujitsu • Hewlett-Packard • Hitachi Data Systems
• Juniper Networks • Intel • Lexmark • McAfee • Microsoft • Netapp • StarTech • Symantec • VMware

Course content
• Certificate • The role of distribution • Distributor business model • Margins & profitability • Working capital and the cash-to-cash
cycle • Productivity & capital efficiency
measures
• Diploma • The value of different distribution
models (to vendors and final tier) • Optimizing vendor–distributor
engagement • Leveraging the distribution business
model • Category management • Effective vendor propositions and
programs • New business models (services and
cloud)

Day 1 Day 2
10:30
TRAVEL 9:00 10:45
REVIEW OF DAY 1
6 PRODUCT MANAGER FOR A DAY - how to improve the numbers
1 INTRODUCTION
2 THE ROLE & VALUE OF DISTRIBUTION - Broadline & Value added - Value to vendors - Value to final tier
7 MANAGING GROWTH
3 DISTRIBUTION BUSINESS MODELS - ROCE, ROIC, Economic Profit - Benchmarks & trends
8 Business model evolution - services, - infrastructure - cloud, etc 4 CEO FOR A DAY
12:40 LUNCH
13:15 16:20
5 DISTRIBUTOR MICRO-ECONOMICS - Front end, Back end margins - Contribution profits - Stock & Working capital management - Prompt payment incentives - Portfolio Management
13:00 15:00
9 HOW TO ASSESS VENDOR PROGRAMS - compensation programs - marketing programs
10 APPLICATION TO YOUR OWN ROLE
11 PRE-EXAM PREPARATION
6 PRODUCT MANAGER FOR A DAY
TRAVEL
17:15 End of day
GTDC Diploma Course Agenda

Accreditation process
Take Diploma F2F Course
Take Diploma exam
Diploma
Take Certificate Self-study
Take Certificate
exam
Certificate
Take Certificate F2F Course
Take Certificate
Webinar
Take Certificate on-
line course
Refresher course

Typical benefits from adopting the Diploma
It helps to:
• “Change the conversation” with distributors from Margins to ROCE
• “Drive a much richer conversation with distributors about their business model, key financial metrics and the levers to improve our attractiveness as a vendor”
• “Access new levers” in the relationship
• Go into the conversations with “a Point of view” about what they want, and how to achieve it
• Think about which levers the Account Managers can control themselves, and which levers the Vendor can control

How to progress interest?
• Check out information on GTDC.org or viaint.com
• Course information leaflet
• Contact Julian for further information: • [email protected]

Thank you! Next steps:
This is to certify that
Has achieved the GTDC accreditation standard of
Diplomain Technology Distribution
Julian DentChairmanVIA International Ltd
Tim CurranCEOGlobal Technology Distribution Council
RENTON D’SOUZA
Date awarded: 29/06/2015 Diploma no: 797476/D
Your name here!