proracing sim, llc. 3400 democrat road, suite 207 memphis, tn
TRANSCRIPT

DeskTop FastLap5 & FastLapSim5 Vehicle Simulations—�DeskTop FastLap5 & FastLapSim5
ProRacing Sim, LLC.3400 Democrat Road, Suite 207
Memphis, TN 38��8
For Tech Support Contact:Web: www.ProRacingSim.com
Email: [email protected]

2—DeskTop FastLap5 & FastLapSim5 Vehicle Simulations
MOTION SOFTWARE, INC., SOFTWARE LICENSEPLEASE READ THIS LICENSE CAREFULLY BEFORE BREAKING THE SEAL ON THE DISKETTE ENVELOPE AND USING THE SOFTWARE. BY BREAKING THE SEAL ON THE DISKETTE ENVELOPE, YOU ARE AGREEING TO BE BOUND BY THE TERMS OF THIS LICENSE. IF YOU DO NOT AGREE TO THE TERMS OF THIS LICENSE, PROMPTLY RETURN THE SOFTWARE PACKAGE, COMPLETE, WITH THE SEAL ON THE DISKETTE ENVELOPE UNBROKEN, TO THE PLACE WHERE YOU OBTAINED IT AND YOUR MONEY WILL BE REFUNDED. IF THE PLACE OF PURCHASE WILL NOT REFUND YOUR MONEY, RETURN THE ENTIRE UNUSED SOFTWARE PACKAGE, ALONG WITH YOUR PURCHASE RECEIPT, TO MOTION SOFTWARE, INC., AT THE ADDRESS AT THE END OF THIS AGREEMENT. MOTION SOFTWARE WILL REFUND YOUR PURCHASE PRICE WITHIN 60 DAYS. NO REFUNDS WILL BE GIVEN IF THE PACKAGING HAS BEEN OPENED.
Use of this package is governed by the following terms:1. License. The application, demonstration, and other sof tware accompanying this License, whether on disk or on any other media (the “Motion Software, Inc. Software”), and the related documentation are licensed to you by Motion Software, Inc. You own the disk on which the Motion Software, Inc. Software are recorded but Motion Software, Inc. and/or Motion Software, Inc.’s Licensor(s) retain title to the Motion Software, Inc. Software, and related documentation. This License allows you to use the Motion Software, Inc. Software on a single computer and make one copy of the Motion Software, Inc. Software in machine-readable form for backup purposes only. You must reproduce on such copy the Motion Software, Inc. Copyright notice and any other proprietary legends that were on the original copy of the Motion Software, Inc. Software. You may also transfer all your license rights in the Motion Software, Inc. Software, the backup copy of the Motion Software, Inc. Software, the related documentation and a copy of this License to another party, provided the other party reads and agrees to accept the terms and conditions of this License.2. Restrictions. The Motion Software, Inc. Software contains copyrighted material, trade secrets, and other proprietary material, and in order to protect them you may not decompile, reverse engineer, disassemble or otherwise reduce the Motion Software, Inc. Software to a human-perceivable form. You may not modify, network, rent, lease, loan, distribute, or create derivative works based upon the Motion Software, Inc. Software in whole or in part. You may not electronically transmit the Motion Software, Inc. Software from one computer to another or over a network.3. Termination. This License is effective until terminated. You may terminate this License at any time by destroying the Motion Software, Inc. Software, related documentation, and all copies thereof. This License will terminate immediately without notice from Motion Software, Inc. If you fail to comply with any provision of this License. Upon termination you must destroy the Motion Software, Inc. Software, related documentation, and all copies thereof.4. Export Law Assurances. You agree and certify that neither the Motion Software, Inc. Software nor any other technical data received from Motion Software, Inc., nor the direct product thereof, will be exported outside the United States except as authorized and permitted by United States Export Administration Act and any other laws and regulations of the United States.5. Limited Warranty on Media. Motion Software, Inc. warrants the disks on which the Motion Software, Inc. Software are recorded to be free from defects in materials and workmanship under normal use for a period of ninety (90) days from the date of purchase as evidenced by a copy of the purchase receipt. Motion Software, Inc.’s entire liability and your exclusive remedy will be replacement of the disk not meeting Motion Software, Inc.’s limited warranty and which is returned to Motion Software, Inc. or a Motion Software, Inc. authorized representative with a copy of the purchase receipt. Motion Software, Inc. will have no responsibility to replace a disk damaged by accident, abuse or misapplication. If after this period, the disk fails to function or becomes damaged, you may obtain a replacement by returning the original disk, a copy of the purchase receipt, and a check or money order for $10.00 postage and handling charge to
Motion Software, Inc. (address is at the bottom of this agreement).6. Disclaimer of Warranty on Motion Software, Inc. Software. You expressly acknowledge and agree that use of the Motion Software, Inc. Software is at your sole risk. The Motion Software, Inc. Software and related documentation are provided “AS IS” and without warranty of any kind, and Motion Software, Inc. and Motion Software, Inc.’s Licensor(s) (for the purposes of provisions 6 and 7, Motion Software, Inc. and Motion Software, Inc.’s Licensor(s) shall be collectively referred to as “Motion Software, Inc.”) EXPRESSLY DISCLAIM ALL WARRANTIES, EXPRESS OR IMPLIED, INCLUDING, BUT NOT LIMITED TO, THE IMPLIED WARRANTIES OF MERCHANTABILITY AND FITNESS FOR A PARTICULAR PURPOSE. Motion Software, Inc. DOES NOT WARRANT THAT THE FUNCTIONS CONTAINED IN THE Motion Software, Inc. SOFTWARE WILL MEET YOUR REQUIREMENTS, OR THAT THE OPERATION OF THE Motion Software, Inc. SOFTWARE WILL BE UNINTERRUPTED OR ERROR-FREE, OR THAT DEFECTS IN THE Motion Software, Inc. SOFTWARE WILL BE CORRECTED. FURTHERMORE, Motion Software, Inc. DOES NOT WARRANT OR MAKE ANY PRESENTATIONS REGARDING THE USE OR THE RESULTS OF THE USE OF THE Motion Software, Inc. SOFTWARE OR RELATED DOCUMENTATION IN TERMS OF THEIR CORRECTNESS, ACCURACY, RELIABILITY, OR OTHERWISE. NO ORAL OR WRITTEN INFORMATION OR ADVICE GIVEN BY Motion Software, Inc. OR A Motion Software, Inc. AUTHORIZED REPRESENTATIVE SHALL CREATE A WARRANTY OR IN ANY WAY INCREASE THE SCOPE OF THIS WARRANTY. SHOULD THE Motion Software, Inc. SOFTWARE PROVE DEFECTIVE, YOU (AND NOT Motion Software, Inc. OR A Motion Software, Inc. AUTHORIZED REPRESENTATIVE) ASSUME THE ENTIRE COST OF ALL NECESSARY SERVICING, REPAIR, OR CORRECTION. SOME JURISDICTIONS DO NOT ALLOW THE EXCLUSION OF IMPLIED WARRANTIES, SO THE ABOVE EXCLUSION MAY NOT APPLY TO YOU.7. Limitation of Liability. UNDER NO CIRCUMSTANCES INCLUDING NEGLIGENCE, SHALL Motion Software, Inc. BE LIABLE FOR ANY INCIDENT, SPECIAL, OR CONSEQUENTIAL DAMAGES THAT RESULT FROM THE USE, OR INABILITY TO USE, THE Motion Software, Inc. SOFTWARE OR RELATED DOCUMENTATION, EVEN IF Motion Software, Inc. OR A Motion Software, Inc. AUTHORIZED REPRESENTATIVE HAS BEEN ADVISED OF THE POSSIBILITY OF SUCH DAMAGES. SOME JURISDICTIONS DO NOT ALLOW THE LIMITATION OR EXCLUSION OF LIABILITY FOR INCIDENTAL OR CONSEQUENTIAL DAMAGES SO THE ABOVE LIMITATION OR EXCLUSION MAY NOT APPLY TO YOU.In no event shall Motion Software, Inc.’s total liability to you for all damages, losses, and causes of action (whether in contract, tort (including negligence) or otherwise) exceed the amount paid by you for the Motion Software, Inc. Software.8. Controlling Law and Severability. This License shall be governed by and construed in accordance with the laws of the United States and the State of California. If for any reason a court of competent jurisdiction finds any provision of this License, or portion thereof, to be unenforceable, that provision of the License shall be enforced to the maximum extent permissible so as to effect the intent of the parties, and the remainder of this License shall continue in full force and effect.9. Complete Agreement. This License constitutes the entire agreement between the parties with respect to the use of the Motion Software, Inc. Software and related documentation, and supersedes all prior or contemporaneous understandings or agreements, written or oral. No amendment to or modification of this License will be binding unless in writing and signed by a duly authorized representative of Motion Software, Inc.
Motion Software, Inc. and ProRacing Sim, LLC.3400 Democrat Road, Memphis, TN 38��8© 1994, 2009 By Motion Software, Inc. All rights reserved by Motion Software, Inc. MS-DOS, DOS, Windows, and Windows95/98/Me/NT/2000/XP and Vista are trademarks of Microsoft Corporation. IBM is a trademark of the International Business Machines Corp.DeskTop Dyno, DragSim, DeskTop DynoSim5, DeskTop DragStrip, DeskTop DragSim, DragSim, FastLapSim5, Dyno Shop and other DeskTop software products are trademarks of Motion Software, Inc. All other trademarks, logos, or graphics are the property of their respective owners.

DeskTop FastLap5 & FastLapSim5 Vehicle Simulations—3
ACKNOWLEDGMENTS: Larry Atherton of Motion Software, Inc., wishes to thank the many individuals who contributed to the de-velopment and marketing of this program:
Brent Erickson, Simulation Designer, Lead Programmer and Principal Architect of FastLapSim5. A brilliant programmer, Brent’s positive “can-do” attitude is backed up by his ability to accomplish what many dismiss as impossible. FastLapSim5, an extremely complex and feature-packed program, is a reality because of Brent’s creative design, dedication (over four years of effort were devoted to FastLapSim5), and his desire to give his fellow road-racing enthusiasts the best possible tool to improve performance and gain a competitive edge.
And special thanks are due to all the market-ing and management personnel of ProRacing Sim, LLC., Software especially:
Ron Coleman, His enthusiasm for this soft-ware and the building of an outstanding marketing network made this entire project possible.
ACKNOWLEDGMENTS, ETC.
“Scooter” Brothers, He was the first to see special value in simulation software. A multi-talented engineer and camshaft expert, Scooter’s insight and dedication to excellence is greatly appreciated.
And thanks to the many other individuals who have contributed to the successful develop-ment and marketing of this software.
Larry Atherton, Pres., CEOMotion Software, Inc.
The text, photographs, drawings, and other artwork (hereafter referred to as information) contained in this publication is provided without any warranty as to its usability or performance. Specific system configurations and the applicability of described procedures both in software and in real-world conditions—and the qualifications of individual readers—are beyond the control of the publisher, therefore the publisher disclaims all liability, either expressed or implied, for use of the information in this publication. All risk for its use is entirely assumed by the purchaser/user. In no event shall Motion Software, Inc., be liable for any indirect, special, or consequential damages, including but not limited to personal injury or any other damages, arising out of the use or misuse of any information in this publication or out of the software that it describes. This manual is an independent publication of Motion Software, Inc. All trademarks are the registered property of the trademark holders.The publisher (Motion Software, Inc.) reserves the right to revise this publication or change its content from time to time without obligation to notify any persons of such revisions or changes.
This publication is the copyright property of Motion Software, Inc., Copyright © �995, 2008 by Motion Software, Inc. and is provided to ProRacing Sim, LLC. through license. All rights reserved. All text and photographs in this publication are the copyright property of Motion Software, Inc. It is unlawful to reproduce—or copy in any way—resell, or redistribute this information without the expressed written permission of Mo-tion Software, Inc. This PDF document may be downloaded by
DeskTop FastLap5 and FastLapSim5 5 users and prospective buyers for informational and educational use only. No other uses are permitted.

4—DeskTop FastLap5 & FastLapSim5 Vehicle Simulations
Motion Software SOFTWARE LICENSE ... 2
ACKNOWLEDGMENTS ............................. 3
INTRODUCTION ......................................... 6 How It Works ....................................... 6 Product Versions ............................... 9 Feature Table .................................... �0 FastLapSim5 Requirements ............ �2 Requirements In Detail .................... �3
INSTALLATION ......................................... �4 Installing FastLapSim ...................... �4 Starting FastLapSim ........................ �5
PROGRAM OVERVIEW ........................... �7 Main Program Screen ...................... �7 Title Bar ...................................... �7 Program Menu Bar .................... �7 Component Categories ............. �9 DirectClick™ Menus ................. 2� Range Limit & Status Line ........ 2� Simulation Selection Tabs ........ 2� Screen Display Tabs ................. 22 Performance Data Display........ 22 Vehicle Lap Controls ................. 23 Windows Size Buttons .............. 23 Vertical Screen Divider ............. 23 Main Program Toolbar .............. 23 QuickAccess™ Buttons ........... 24 Horizontal Screen Divider ........ 24 Additional Toolbars ................... 24 GG-Diagram ............................... 24 Track Display ............................. 24 Using The Mouse Or Keyboard ....... 24 DirectClick™ Menu Choices............ 25 Fields Accepting Numeric Input ..... 26 The Meaning Of Screen Colors ....... 27
COMPONENT MENUS ............................. 28 The Track Category Menus.............. 28 Vehicle Category Menus .................. 28 Vehicle Name ............................. 30
CONTENTS Wheelbase ................................. 30 Front/Rear Track Widths ........... 30 Vehicle Weight ........................... 30 CG Locations ............................. 3� Using the CG Calculator ...... 3� Frontal Area ............................... 32 AeroDragAndLiftCoefficient . 32 Front/Rear Wing Dimensions ... 33 The Engine Category Menus ........... 34 Engine Menu .............................. 34 Built-In Engine Selections ........ 34 Custom Engine Power Curve ... 34 Enter Peak Power/Torque .... 35 Enter Power/Torque ............. 36 Import DynoSim Engine Files .. 37 Displacement ............................. 38 The Drivetrain Category Menus ...... 38 Transmission ............................. 38 Number Of Gears ................. 39 Trans Gear Ratios ................ 39 Coupling ..................................... 39 Clutch .................................... 39 Torque Converter ................. 40 Rear-Drive Ratio ........................ 4� Front/Rear Driving Wheels ....... 42 The Suspension/Tires Menus .......... 42 Suspension Setup ..................... 42 Spring Calculator Tab ............... 44 Damper Calculator Tab ............. 46 Geometry Calculator Tab .......... 47 Tire/Brake Calculator Tab ......... 49 Peak Grip .............................. 5� Peak Slip ............................... 5� Brake Component Specs.......... 52 Front/Rear Anti-Roll Bar Calc. . 53 The Driving Category Menus ........... 54 Driving Style Menu .................... 54 Shift Time ................................... 55 Shift Accuracy & Error ............. 55 Steer Time .................................. 56 The Weather Category Menus ......... 56 Weather Menu ............................ 56 Humidity ..................................... 56

DeskTop FastLap5 & FastLapSim5 Vehicle Simulations—5
CONTENTS Equivalent Elevation ................. 56 Wind Direction/Speed ............... 57 Temperature ............................... 57 The Simulation Results Options ..... 57 THE SIMULATION RESULTS DISPLAY .. 59 Main Results Screen ........................ 60 Results Graph ................................... 6� Axis Scaling ...................................... 6� Graph Options/Properties ............... 62 Graph Data ................................. 63 Graph Properties ....................... 63 DataZones™ .............................. 63 Table Display .................................... 64 Track View Display ........................... 66 GG-Diagram Display ........................ 67 PopUp LapTime™ Window .............. 68 PopUp SimData™ Window .............. 68
THE TRACK EDITOR ............................... 69 Track Editor Overview...................... 69 How It Works ..................................... 70 Saving & Opening Track Files ......... 7� Track Setup Window ........................ 7� Description Group ..................... 7� Track Scale Group..................... 72 Track Width Group .................... 72 Grid Setup Group ...................... 72 View Group ................................ 72 Segments Group ....................... 73 Track Editor Building Tools ............. 73 Build Track Tool ........................ 73 Selection Tools .......................... 74 Add Point Tool ........................... 74 Remove Point Tool .................... 74 Reorder Points Tool .................. 74 Set Start/Finish Line Tool ......... 74 Track Editor Positioning Tools ........ 75 Magnifying Glass Tool .............. 75 Display Full Track Tool ............. 75 Center Around Point Tool ......... 76 Move Track Tool ........................ 76 Track Editor Undo Tool .................... 76
Track Editor Other Tools .................. 77 Calculate Raceline .................... 77 Track Setup ................................ 78 Building Your First Track ................. 78 Building A Real-World Track ........... 83
PRINTING ............................................... 96 Printing Vehicle And Track Data ..... 96 ProTools™ Printing Features .......... 99 OTHER PROGRAM FEATURES ............ �00 Program Versions........................... �00 DeskTop Version ..................... �00 Sim Version.............................. �00 Sim Features............................ �0� Feature Table ........................... �02 .DYN File Compatibility ........... �03 General Simulation Assumptions . �03 Engine ...................................... �03 Environment ............................ �04 Raceline ................................... �04 Transmission/Differentials ..... �05 Aerodynamics ......................... �05
THE HANDLING CLINIC ........................ �06 Finding CG Height Of A Real Car .. �06 Chassis Setup—Introduction ........ �06 Setup ........................................ �07 Chassis Adjustment/Table �... �09 Using Table 2—Primary .......... �09 Using Table 3—Secondary ......��9 Checklist of Causes & Effects....... �29
ROAD RACE GLOSSARY ...................... �33
FREQUENTLY ASKED QUESTIONS ..... �54
TRACK TESTING NOTES ...................... �57
6—DeskTop FastLap5 & FastLapSim5 Vehicle Simulations
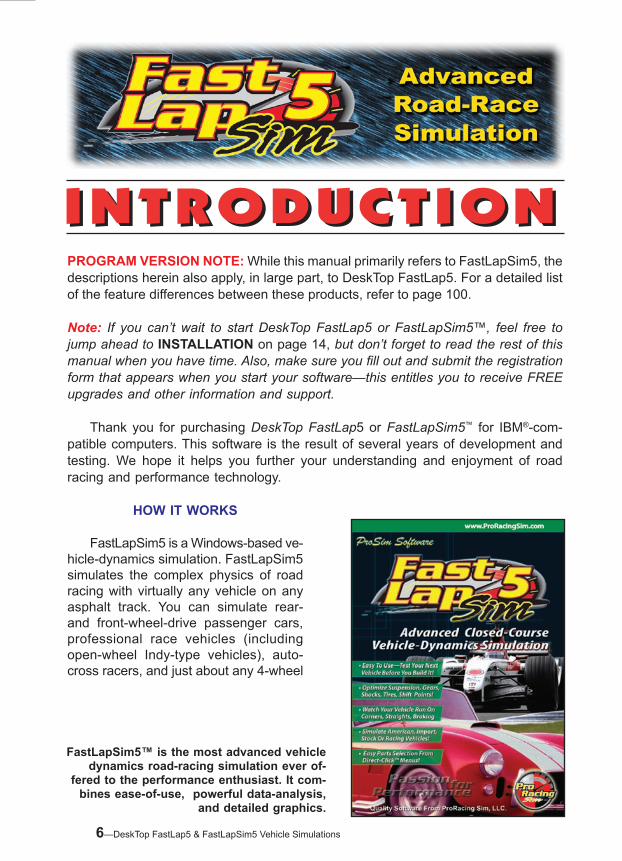
INTRODUCTIONINTRODUCTIONPROGRAM VERSION NOTE: While this manual primarily refers to FastLapSim5, the descriptions herein also apply, in large part, to DeskTop FastLap5. For a detailed list of the feature differences between these products, refer to page 100.
Note: If you can’t wait to start DeskTop FastLap5 or FastLapSim5™, feel free to jump ahead to INSTALLATION on page 14, but don’t forget to read the rest of this manual when you have time. Also, make sure you fill out and submit the registration form that appears when you start your software—this entitles you to receive FREE upgrades and other information and support.
Thank you for purchasing DeskTop FastLap5 or FastLapSim5™ for IBM®-com-patible computers. This software is the result of several years of development and testing. We hope it helps you further your understanding and enjoyment of road racing and performance technology.
HOW IT WORKS
FastLapSim5 is a Windows-based ve-hicle-dynamics simulation. FastLapSim5 simulates the complex physics of road racing with virtually any vehicle on any asphalt track. You can simulate rear- and front-wheel-drive passenger cars, professional race vehicles (including open-wheel Indy-type vehicles), auto-cross racers, and just about any 4-wheel
FastLapSim5™ is the most advanced vehicle dynamics road-racing simulation ever of-
fered to the performance enthusiast. It com-bines ease-of-use, powerful data-analysis,
and detailed graphics.

DeskTop FastLap5 & FastLapSim5 Vehicle Simulations—7
vehicle you can dream up. You can select and change any vehicle component, and modify driver input from “perfect” to amateur, and see the results in seconds on a comprehensive data display. Note: This program functions similarly to the DeskTop Dyno and DynoSim, and us-ers of these engine simulations should find the menus and interface incorporated in this product a familiar sight. In a nutshell, FastLapSim5 lets you test vehicles on any one of dozens of sup-plied race tracks, or you can build just about any closed-course track you can imagine (a closed-course track forms a closed loop, where the end of the course meets the starting point). Then select from a wide variety of vehicle components, driver inputs, and weather conditions using DirectClick™ pop-up menus to easily “assemble” a test vehicle. After the vehicle is complete, a comprehensive simulation of vehicle dynam-ics is performed as the vehicle moves throughout the entire course. The simulation results resemble a typical data-acquisition display, and can include a wide variety of “recorded” variables, including Vehicle Speed, Lateral and Longitudinal Acceleration, Engine Rpm, Braking Forces, Suspension Movement, and much more. In addition, a comprehensive table lists various Elapsed Times, Engine Rpms, Vehicle Speeds, etc., at critical points and/or track segments throughout the course. FastLapSim5 begins the simulation process by determining an optimum race line. This is one of the most difficult tasks in the simulation. An ideal race line al-lows the vehicle to accelerate as soon and as long as possible, brake as late as possible, and traverse a corner at the largest possible radius. FastLapSim5 uses several techniques to perform this complex calculation. First, the race line is ap-proximated as a series of points. At each point the curvature or corner radius is calculated and a default lane (a lane is a possible vehicle path across the width
Introduction To FastLapSim5
FastLapSim5 incorporates a clean, intuitive user inter-face. If you wish to change a component, simply click on the component name and select a new component from a pop-up DirectClick™ menu. The comprehensive data displays are fully cus-tomizable. Multiple vehicle and/or data comparisons are possible. All components and graphics displays can be printed in full color.
FastLapSim5 Main Component Screen

8—DeskTop FastLap5 & FastLapSim5 Vehicle Simulations
Introduction To FastLapSim5
of the track) is assigned. The next step iterates through the paths, modifying lane assignments, and recalculating the curvatures until optimum path through the track has been found. Once this initial path is computed, the next step applies a theoretical speed through each point by assuming that corner speed is limited only by peak tire grip. The speed and radius are calculated to determine braking points (the positions on the track where the brakes are applied). A final calculation uses a repeating process called Gradient Descent to further improve the race line and estimate lap time. If the new path offers a performance
The TrackEditor™One of the most powerful features of both the DeskTop and Sim versions
of FastLap is the TrackEditor™. Here, you can design any track you can
imagine, from simple ovals to com-plex road courses. Even simulate a
parking-lot autocross. The TrackEdi-tor™ is a full-featured graphics edi-
tor, allowing a what-you-see-is-what-you-get construction and editing of
turns, straights, and track widths.
Finding The Optimum Race Line
FastLapSim5 begins the simu-lation process by determining
an optimum race line (green line). This complex task lo-
cates the path that will allow the vehicle to accelerate as
soon and as long as possible, brake as late as possible, and
traverse a corner at the larg-est possible radius (and the
greatest speed).

DeskTop FastLap5 & FastLapSim5 Vehicle Simulations—9
Introduction To FastLapSim5
improvement, the specifications are maintained; if no improvement is noted, the path is modified again, and the process is repeated until there is convergence on an optimal path. Despite the complexity of the underlying simulation, FastLapSim5 has been de-signed to be easy to use. In addition to an intuitive, point-and-click interface with DirectClick™ menus, this software contains a built-in analysis system that scrutinizes selected components and combinations. An alert is triggered when component com-binations may produce unreliable results. You are then presented with information that will help you correct the problem and maintain the highest predictive accuracy and data reliability. In addition to the features provided in DeskTop FastLap5, there are many ad-vanced features in FastLapSim5, including the ProTools™ Kit™ described below, in the table on page 10, and in the Product Features chapter starting on page 100.
Product Versions
FastLap5 is available in two versions: 1) DeskTop, and 2) a Sim version with ProTools™ (for more information on these versions, see page 100). The DeskTop FastLap5 program version includes a powerful set of features that allows most en-thusiasts and professionals to test components and determine optimum combinations for just about any closed-course racing application. All essential simulation features are included in this “basic” mode. FastLapSim5 with ProTools™ extends existing features to allow a more technical and/or detail analysis of vehicle performance. For example, using FastLapSim5, the user can measure and monitor numerous vehicle data sets, including Accelerations and Speeds. The ProTools™ Kit (activated in the Sim version) adds additional dynamics and force measurements, including individual wheel movements and forces, etc.
If you are a serious enthusiast, racer, or part of a professional team,youwillfindtheadditionaltools and features supplied in FastLapSim5 helpful in your vehicle simulation efforts. Many features in the DeskTop version have been enhanced with ex-tended functionality. In addition, there are new features aimed directly at the professional, like the DataZones™, Extended Graphing, and ProPrinting™ that generates a “presentation-qual-ity” test report including the name and logo of your com-pany.
Program Features, Data Zones™

�0—DeskTop FastLap5 & FastLapSim5 Vehicle Simulations
Introduction To FastLapSim5
FastLapClosed-Course Simulations
FastLap5 SimulationProgram Features
DeskTop Series Sim Series
DeskTopFastLaps
FastLapSims With ProTools™
Multi-Page FastLap5 Test Reports Yes Yes
Load Engine Simulation Files Yes Yes
Front- And Rear-Wheel Drive Yes Yes
LapTime Slip™ Yes YesGraph Reticle Synchronized
With Vehicle Position Yes Yes
DirectClick™ Menus Yes YesComprehensive Suspension Mods Yes Yes
C.G. Calculator Yes YesU.S./Metric Units Yes Yes
Track Editor™ Create Your Own Custom Track Yes Yes
SimData™ Telemetry WindowSynchronized With Graph Reticle No Yes
Real-Time Simulation Screen No YesTest Multiple Vehicles No Yes
On-Graph ComparisonsUp To Four Vehicles No Yes
Extended Color Display/Interface No YesHigh-Resolution Testing No Yes
ProTools™ Data Displays No YesProPrinting™ Extended Reports No Yes
Graph DataZones™ Display No YesIterative Spring/Damper Testing No Yes
Track-Segment Data Analysis No Yes

DeskTop FastLap5 & FastLapSim5 Vehicle Simulations—��
Introduction To FastLapSim5
Here are some of the features available in the Sim version with ProTools™: • A Real-Time Simulation Screen: View the simulation process realtime, review
an extensive data display, watch the simulation zero-in on the best braking points and corner speeds, see suspension movement, G-forces, and more!
• Simulation Optimization: This ProTools™ feature includes optimization routines that perform a more in-depth analysis of every corner, braking points, all suspen-sion movement and forces applied to the test vehicle. This calculation-intensive analysis, when activated by the user, predicts lap times and vehicle performance data with the highest possible accuracy. If you need the most accurate analysis possible, the ProTools™ Optimization will help you achieve your goals.
• The Spring/Damper QuickCalculator™: A powerful ProTool for serious perfor-mance seekers. This tool will help pick the most appropriate shock absorber for any spring rate. The Calculator tests dampers with the current spring, perform-ing a spring/shock dyno simulation and selecting a combination that effectively dampens the spring (without overdamping). The Spring/Damper QuickCalcula-tor™ is an indispensable tool for zeroing-in on the best shock combinations for virtually any vehicle or track.
• The Optimum Gear Iterator™: This ProTool performs a quick iteration using the current vehicle setup and simulation test data to find the best transmission and rear-axle ratios for the test vehicle. The Optimum Gear Iterator™ is another
ProData Table (ProTools™) FastLapSim5 displays an additional Pro-Data™ table of segment times, helpful in professional track tuning efforts. Up to30segmentscanbedefinedforanytrack.

�2—DeskTop FastLap5 & FastLapSim5 Vehicle Simulations
Introduction To FastLapSim5tool that will give any serious racer a winning edge.
• Track Segments defines portions of the track as “segments.” Segments begin and end at Corner Points, and once defined, segments can be used to analyze vehicle entrance and exit speeds, average speeds, and other vehicle data. Op-tionally, choose unique colors for each segment, making visual identification a snap. Up to 30 segments can be defined for each track.
• Graph DataZones™: Set colored ranges on any simulation results graph to mark target times, distances, accelerations, speeds, or any other race variables. DataZones also can be used to graphically indicate gear ratios overlaid on speed, acceleration, and other distance-based data-sets. DataZones produce profes-sional-looking graphs, isolate vehicle characteristics, help detect excess speeds or loads, and add color to graphic displays.
• ProTools also includes track-segment ProData™ that is calculated and displayed in an additional table of test results (available by selecting the ProData tab at the bottom of the graph screen). Up to 30 segments can be defined and uniquely colored. Each segment of the track can be used to record and analyze vehicle entrance and exit speeds, average times, and more.
• Pro-Printing™: Allows you to printout a comprehensive, presentation test report of any simulated vehicle on any track. This professional report includes a custom cover page with the name of your business and/or vehicle designer, vehicle data, all performance data tables, graphic performance data, and all extended data available with ProTools (as described above). Even include an optional Table of Contents and/or Glossary of Terms with your test reports. Use this eye-popping report to make the best presentation possible of your latest vehicle simulation designs.
FastLapSIM5 REQUIREMENTS
Here are the basic hardware and software requirements to properly run FastLapSim:
• An (IBM™ compatible) PC with a CD-ROM drive. • 32MB of RAM (random access memory) for Windows95/98/Me; 256MB for Win-
dows2000/XP and 512MB for Vista. • Windows95/98/Me or Windows 2000/XP or Windows Vista • A video system capable of at least 800 x 600 resolution). Recommend 1024 x
768 or higher to optimize screen display of engine components and performance analysis graphics.
• A fast system processor (1GHz or faster) will improve processing speeds; es-pecially helpful for Iterative analysis. However, FastLapSim5 will operate on any Windows95/98/Me/NT/2000/XP or Vista system, regardless of processor.
• A mouse. • Any Windows compatible printer (to obtain dyno-test printouts).

DeskTop FastLap5 & FastLapSim5 Vehicle Simulations—�3
REQUIREMENTSADDITIONAL CONSIDERATIONS
Windows95/98/Me/NT/2000/XP and Vista: FastLapSim5 is a 32-bit program designed for Windows95 through WindowsXP and Vista. FastLapSim5 is also compatible with WindowsNT (we recommend that if you use WindowsNT, use version 4.0 with service pack 6 or later). If you use an early version of Windows95, make sure to install the latest service packs for both Windows and for Internet Explorer (use the Windows Update feature available in the Start Menu or visit www.microsoft.com to locate up-dates and service packs for your operating system).
Video Graphics Card And Monitor: An 800 x 600 resolution monitor/video card are required to use FastLapSim5. Systems with 1024 x 768 resolution or higher provide more screen “real estate,” and this additional display space is very helpful in com-ponent selection and power-curve analysis.Note �: See FAQ on page 154 for help in changing the screen resolution of your system and monitor.
System Processor: FastLapSim5 is extremely calculation-intensive. Over 50 million mathematical operations are performed for each complete track simulation. While the program has been written in fast C++ and hand-tuned assembler to optimize speed, a faster processor will improve data analysis capabilities. To reduce calculation times and extend the modeling capabilities of the program, use the fastest processor pos-sible.
Mouse: A mouse (trackball, or other pointer control) is required to use FastLapSim5. While most component selections can be performed with the keyboard, several op-erations within FastLapSim5 require the use of a mouse.
Printer: FastLapSim5 can print a comprehensive “Track-Test Report” of a simulated dyno engine on any Windows-compatible printer. If you use a color printer, the data curves and component information will print in color (see page 96 for more informa-tion about FastLapSim5 printing).
Introduction To FastLapSim5

�4—DeskTop FastLap5 & FastLapSim5 Vehicle Simulations
INSTALLATIONINSTALLATIONSoftware Installation
The installation for DeskTop FastLap5 or FastLapSim5 is a quick and easy pro-cess. Review these points and follow the installation steps below:
• Windows 95/98/Me® or Windows NT/2000/XP/Vista® is required (see page 9 for more information about system requirements).
• A software SETUP program will install FastLapSim5 onto the Windows-Install drive in the FastLapSim5 directory. Placing program files within this directory will ensure that future upgrades and enhancements will install correctly. Please accept the default installation path for trouble-free operation.
Read and perform each of the following steps carefully:
�) Start Windows.
2) Insert the DeskTop FastLap5 or FastLapSim5 CD-ROM into your CD drive.
3) An Installation Menu will be displayed on your desktop within 5 to 30 seconds (depending on the speed of your CD drive). From the options provided, click on Install DeskTop FastLap5 or FastLapSim5.
Note: If the software Installation Menu does not automatically appear on your desktop within 30 to 60 seconds, choose Settings from the Start menu, select Control Panels, then click Add/Remove Programs, finally click on Install.
4) Click Next to view the Motion Software, Inc./ProRacing Sim License Agreement. Read the Agreement and if you agree with the terms, click I Accept..., then click Next to continue with the installation.
5) A Readme file includes the latest changes made to this software and informa-tion not available at the time this Users Manual was published. After you have reviewed the Readme, click Next to proceed with the installation.

DeskTop FastLap5 & FastLapSim5 Vehicle Simulations—�5
6) Next you will be presented a dialog indicating the recommended install directory and/or path. If you cannot install the program on the recommended drive or at the location indicated, you can click CHANGE and enter an alternate location.
Note: If you do not install this software at the recommended location, updates or upgrades to this simulation released in the future may not install properly or function correctly on your system.
7) The Ready To Install screen gives you a chance to review installation choices. Press Back to make any changes; press Install to begin copying files to your system.
8) When main installation is complete, the Setup Complete screen will be displayed. Click Finish to close this window.
Starting DeskTop FastLap5 or FastLapSim5
9) To start the DeskTop FastLap5: , open the Windows Start menu, select Programs, then choose ProRacing Sim Software, DeskTop FastLap5 Track Simulation, and finally click on the DeskTop FastLap5 Closed-Course Simulation icon displayed in that folder.
To start the FastLapSim5, open the Windows Start menu, select Programs, then choose ProRacing Sim Software, FastLapSim5 Track Simulation, and finally click on the FastLapSim5 Closed-Course Simulation icon displayed in that folder.
�0) When you first start the program, a Registration dialog will be displayed. Please fill in the requested information, including the serial number found on page 8 of the QuickStart Guide. Then press the Proceed button. If you have an Internet connection, your registration will be submitted to ProRacingSim automatically. If you do not have an Internet connection, you will be presented with other registra-tion options. If you do not register this simulation, you may not qualify for tech support.
��) You can access additional information about our simulation software and obtain technical support by visiting (www.ProRacingSim.com) or by opening the Start menu, select Programs, ProRacing Sim Software, then click on Tech Support Website icons found in any of the application folders.
�2) Please review the remainder of this Users Manual for more information on menu selections, program functions, and simulation tips.
�3) If you experience installation problems, please review program requirements on pages 9-10 and take a few minutes to look over the following sources of informa-
Installing & Starting FastLapSim5
�6—DeskTop FastLap5 & FastLapSim5 Vehicle Simulations
Installing & Starting FastLapSimtion before you contact technical support:
• The FAQs on page 154 provide additional installation and operational questions-and-answers.
• Visit the Tech Support section of the ProRacing Sim Software website for ad-ditional tips and FAQs.
If you cannot find a solution to your problem, please email [email protected]. Thoroughly explain the problems you are having. Provide as much detail as possible, including the program version you are running (found in the About dialog box available from the Help menu within the program).
If you prefer, you can contact tech-support at:
ProRacing Sim Software, LLC. 3400 Democrat Road, Suite 207 Memphis, TN 38��8 Tech: 90�-259-2355, or visit our Web: www.proracingsim.com Email (preferred method to contact support): [email protected]
Support Note�: Tech support will only be provided to registered users. Please complete the Registration Form that appears when you first start your software to qualify for technical support from the ProRacing Sim Software staff.Support Note2: If you need to change your address or any other personal in-formation after you have registered this software, simply select Registration from the Help menu, make any necessary address changes, then press Proceed to send your updated info ProRacing Sim.

DeskTop FastLap5 & FastLapSim5 Vehicle Simulations—�7
OVERVIEWOVERVIEW
THE MAIN PROGRAM SCREEN
The Main Program Screen allows you to select vehicle components, dimensions, and specifications. In addition, track data, vehicle performance data curves and/or simulation numeric data are displayed in graphical and chart form. The Main Program Screen is composed of the following elements:
�) The Title Bar displays the program name followed by the name of the currently-selected simulation file.
2) The Program Menu Bar contains nine pull-down menus that control overall program function. Here is an overview of these control menus, from left to right
(1) Title Bar
(6) SimulationSelection
Tabs
(7) Right Pane Display Tabs(7) Left PaneDisplay Tabs
(10) WindowsSizeButtons
(8) PerformanceData Curves ForCurrent Vehicle
(9) Vehicle LapControls
(16) GG Diagram
(5) Range LimitsAnd Status Line
(2) ProgramMenu
Bar
(4) Pop-UpDirectClick™ Menu
(12) Tool-BarIcons
(11) Vertical Divider
(17) Current Track
(14) HorizontalDivider
(15) Enlarge/Reduce Graph,Track, and GGDiagram(3) Vehicle
ComponentCategories
AndStatus Boxes
(13) Quick-AccessButtons™

�8—DeskTop FastLap5 & FastLapSim5 Vehicle Simulations
Program Overview
(additional information on menu functions is provided elsewhere in this guide):
File—Opens and Saves FastLapSim5 test files, prints engine components and power curves, allows the quick selection of the most recently used FastLapSim5 files, and contains a quit-program selection.
Edit—Clears all component choices from the currently-selected simulation. (The Simulation Selection Tab indicates the currently-selected simulation; see Simulation Selection Tabs, below).
View—Allows you to turn various Toolbars, the Status Bar and (in the Sim versions) Workbook layout on or off. In addition, you can select the overall color scheme for FastLapSim5 from this menu.
Simulation—Run performs a simulation using the current component se-lections. Run With Real-Time Data (a feature in FastLapSim5) performs a simulation while displaying a detail analysis of simulation progress and realtime data “acquisition” (takes longer). Simulation Results Setup opens a dialog that allows you to select several program options, including the Data Save Interval (for telemetry), an Optimize Simulation function (a Sim program option that improves accuracy), whether to Save Simulation Results (save telemetry) data, several other options that limit vehicle body roll, yaw, etc., and a checkbox for Fast Graph Update, a feature that can improve the
Program Menu BarProgram Menu Bar contains nine pull-down menus that control overall program function.
Run With Real-Time DataThe Run With Real-Time Data screen performs a simulation while dis-
playing a full analysis of simulation progress and real-time data acquisi-
tion.
DeskTop FastLap5 & FastLapSim5 Vehicle Simulations—�9
All ComponentsSelected
CategoryIncomplete
Program Overviewspeed at which the track is displayed on your computer system (effectiveness depends on the video system installed in your computer).
Units—Selects between the US and Metric measurement systems.
Tools—Contains several tools and calculators that can be used to find opti-mum component combinations. The first selection opens the Gear Iterator™ and Spring-Damper Calculator™ (Sim program version ProTools™ feature). The Lap-Time Slip selection opens a quick-reference “time slip” that can be positioned anywhere on the FastLapSim5 window. The SimData™ window provides a detailed display of performance data for the currently-selected reticle position (click on the results graph to show the data reticle). The final selections open the Custom Engine Power Curve... and Import DynoSim Engine File... dialog boxes.
Window—A standard Windows menu for arranging and selecting simulation display screens.
Help—Gives access to this Users Guide, Registration, and launches the Motion Program Updater.
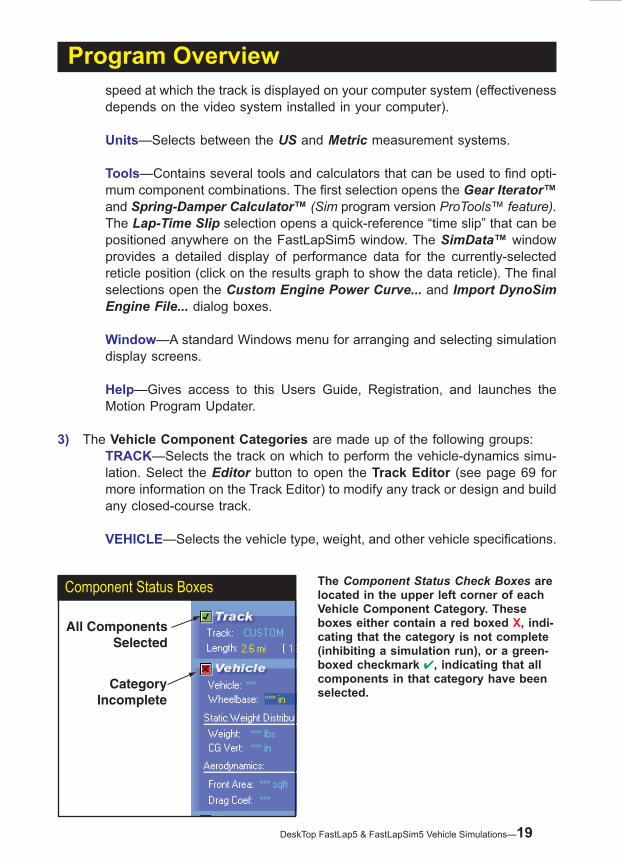
3) The Vehicle Component Categories are made up of the following groups: TRACK—Selects the track on which to perform the vehicle-dynamics simu-
lation. Select the Editor button to open the Track Editor (see page 69 for more information on the Track Editor) to modify any track or design and build any closed-course track.
VEHICLE—Selects the vehicle type, weight, and other vehicle specifications.
Component Status Boxes The Component Status Check Boxes are located in the upper left corner of each Vehicle Component Category. These boxes either contain a red boxed X, indi-cating that the category is not complete (inhibiting a simulation run), or a green-boxed checkmark ✔, indicating that all components in that category have been selected.

20—DeskTop FastLap5 & FastLapSim5 Vehicle Simulations
Empty ComponentFields
CloseMenu
AcceptCurrent
Selection
Bounding Box
Program Overview
Press the CG Calc button to open the Center-Of-Gravity Calculator, a tool that determines CG location from corner weights.
ENGINE—Selects an engine from a pop-up list of various powerplants, im-ports DynoSim engine files, or allows the direct entry of any engine power curve (either in the form of a “dyno-test” curve or by entering peak power and torque values). This category also includes a Redline RPM field (the maximum engine speed used in the simulation).
DRIVETRAIN—Selects the transmission type, gear ratios, coupling (clutch or torque converter), rear-axle ratio, and other drivetrain specifications.
SUSPENSION & TIRES—Selects the type of suspension and tires that will
PopUp Component Menu
The PopUp, DirectClick™ Component Menuslistcomponentsandspecifica-
tions for each of the Component Catego-ries.Clickonanycomponentspecifica-
tion to open its menu. The menu will close when a selection is complete (or
accept the current selection by clicking on the green ✔). If you wish to close the
menu before making a new selection, click the red X repeatedly or press the
Escape key until the menu closes.
Incomplete Component FieldsComponentfieldsthatdonotyetcontain valid entries are marked with a series of asterisks. This indicates that thefieldsareemptyand(most)requiredatainput.Numericfieldsacceptdirectkeyboard entry or selections from pro-
vided drop-down menus. Text selection fields(liketheVehicle or Transmission
choice menus) only accept selections from the associated drop-down menus. When a valid selection has been made, it will replace the asterisks next to the
fieldnames.

DeskTop FastLap5 & FastLapSim5 Vehicle Simulations—2�
Program Overviewbe modeled in the simulation. This comprehensive data-entry category allows simple pop-up menu selections or you can enter custom specs for virtually every suspension component. Click the Setup button to open the detail suspension data-entry screen.
DRIVING STYLE—Selects the level of proficiency of the driver on the selected course. Shift Time, Shift Accuracy, Shift Error Rpm, and Steer Time can be individually modified.
WEATHER—Selects the temperature, barometric pressure, humidity, wind speed, wind direction, and equivalent elevation.
NOTES—Enter any comments about the current simulation. Notes are saved with the vehicle .FLP file.
Note: Each component category (except NOTES) contains a Status Box located in the upper left corner. These boxes either contain a red boxed X, indicating that the category is not complete (inhibiting a simulation run), or a green-boxed checkmark ✔, indicating that all components in that category have been se-lected. When all component categories have green checks, a simulation can be performed using the current data values and the results will be displayed in the graph on the right of the Main Program Screen (the simulation and data plot will be performed automatically if Autorun is checked in the Simulation drop-down menu, see Simulation Menu description, on page 17).
4) The PopUp DirectClick™ Component Menus contain components and speci-fications for each of the Component Category choices. Click on any component specification to open its menu. The menu will close when a selection is complete. If you wish to close the menu before making a new selection, click the red X next to the drop-down box repeatedly or press the Escape key until the menu closes.
5) Several Component Category menus allow direct numeric entry. During this data entry, the range of acceptable values will be displayed in the Range Limit And Status Line at the bottom of the screen.
6) The Advanced and ProTools versions of FastLapSim5 can simulate several ve-hicles at once. Switch between “active” vehicles by selecting one of the Tabs in the Simulation Selection Tabs located just above the Range Limit Line. The currently-selected simulation (filename) is indicated on the foreground Tab. The filename of the currently-selected FastLapSim5 file is also displayed in the Title Bar.
7) The Main Program Screen is divided into three panes (the width and height of

22—DeskTop FastLap5 & FastLapSim5 Vehicle Simulations
Program Overview
these panes are adjustable; drag the vertical and/or horizontal screen dividers to resize, see �� and �4, below). Both the right and left panes contain Screen Display Tabs. Use these Tabs to switch the displays to component lists, graphs, or other data displays.
8) The Performance Data Display Curves indicate the acceleration, speed, en-gine rpm, suspension movement, and much more about the simulated vehicle. The curves shown on page 17 are the default display, however, the data can be customized by right-clicking the graph and reassigning any curve using the Graph Options Box. When simulation curves are visible on the graph (after a simulation has been completed), a single click on the graph will display a reticle line that points to a specific set of data points obtained from realtime data. Open the SimData™ Slip, see 12, below, and page 68 for a direct display of data under the reticle.
9) Using the Vehicle Lap Controls, you can replay the “action” as the vehicle moves over the track, brakes for the turns, and accelerates down the straightaways. The slider adjusts the replay speed from slow-motion, through real time, and to ten-times speeds. Open the SimData™ window (see �2, below) to review data-
Upper And Lower Graph Options Boxes
The graphic data display canbemodifiedbyright-
clicking on the upper graph and reassigning
each curve in the Graph Options Menu. In addi-
tion, you can use the Properties... choice avail-able at the bottom of the Menu to setup compari-
sons between “active” vehicles. Right-clicking
on either the lower track or GG diagram opens an option menu that can be used to customize these
displays.

DeskTop FastLap5 & FastLapSim5 Vehicle Simulations—23
Program Overview
acquisition info as the vehicle runs the course.
�0) The Main Program Screen also incorporates Windows Size Buttons. These buttons provide standard maximizing, minimizing, and closing functions that are common to all windows applications. Refer to your Windows documentation for more information on the use of these buttons.
��) The widths of program panes are adjustable. Simply drag the Vertical Screen Divider to resize the Component-Selection and Graphics-Display panes. By drag-ging the Vertical Screen Divider to the left screen edge, vehicle-performance graphs can be enlarged to full screen for maximum resolution. Also see �4, below.
�2) The Tool Bar contains a series of icons that speed up the selection of commonly used program functions and features. The Tool Bar in FastLapSim5 contains the following icons: Create A New Simulation Setup, Open Saved Simulation, Save Current Simulation, Print Current Vehicle/Simulation Data, Run Simulation, Open Gear & Damper Calculators™, Open Lap-TimeSlip™, Open SimData™ Window, Open Track Editor, Open the CG Calculator, Open Gear Chart, Open Suspension Setup dialog box, Open Power-Curve Dialog, Open DynoSim-File Importer, and display program “About Box.”
�3) Several component categories contain QuickAccess Buttons™ that give “one-click” access to important data-entry functions and calculators: 1) The TRACK category contains an Editor button that opens the Track Editor, 2) the VEHICLE
Simulation Results Graph With Data Reticle
When simulation curves are visible on the graph (after a simulation has been completed), a sin-gle click on the graph will display a reticle line thatpointstoaspecificlocation on the test lap. Open the Simula-tion Data Window for a display of exact data under the reticle.

24—DeskTop FastLap5 & FastLapSim5 Vehicle Simulations
Program Overviewcategory contains a CG Calc button that opens the Center-Of-Gravity Calculator, 3) the ENGINE category contains an HP Curve button that opens the Power-Curve Entry dialog box, and 4) the SUSPENSION & TIRES category contains a Setup button that opens a comprehensive Suspension Dialog, used to change virtually every element of the front and rear suspension.
�4) The heights of the right-hand, graphics-display panes are adjustable. Simply drag the Horizontal Screen Divider to resize the Graphics Displays. By dragging the Horizontal Screen Divider to the top or bottom of the screen, the upper or lower vehicle-performance data displays can be enlarged for optimum resolution.
�5) This additional Toolbar, positioned along the right side of the Main Program Screen, lets you quickly zoom-in and -out on the Data Display (top group of icons), the Track Display (center group of icons), and the GG Display (lower group of icons).
�6) The GG Diagram shows the range of forces generated by the vehicle throughout the test lap. Each dot represents the total of all forces acting on the vehicle at each one-hundreth of second (default). Acceleration dots are displayed above the horizontal centerline, deceleration is below the line. Left lateral acceleration is shown to the left of the vertical centerline, and right lateral acceleration is shown to the right of the vertical line. The circles indicate increasing forces in 1-G steps.
�7) The Track Display provides a representation of the current track and shows the vehicle position as a small rectangle. As you move the reticle through the data set (as described on page 68), exact data points can be viewed for every position on the track in the DataSim™ window, available from the main Toolbar (see �2 on page 21).
HOW TO SETUP AND RUN A SIMULATION
Begin using FastLapSim5 by selecting a track, then “assemble” a test vehicle from component parts:
�) Start FastLapSim5 and load an existing vehicle simulation with Open from the File menu (or select New to begin a new vehicle buildup from “scratch”). For new vehicles, all component categories start off empty, indicated by strings of asterisks (****) next to each incomplete component label.
2) Move the mouse cursor into the TRACK category and double click the left mouse button on the asterisks in the Track field.
3) When the component-menu bounding box appears, click on the ▼ symbol to

DeskTop FastLap5 & FastLapSim5 Vehicle Simulations—25
open the American, European, or Custom submenus.
4) Move the mouse pointer through the menu choices.
5) When the Track submenus open, move the mouse cursor over the choices in one of the submenus.
6) Click the left mouse button on your selection. This loads the track specifications in the TRACK category. Note that the red boxed X (Status Box) on the left of the TRACK category changed to a green-boxed checkmark ✔, indicating that the selection(s) in this category have been completed.
7) To close the menu without making a selection, click the red X on the right of the bounding box or press the Escape key until the menu closes.
8) Continue making component selections until all the category Status Boxes have changed to green. At this point a vehicle simulation can be performed by choos-ing Run from the Simulation drop-down menu. When the simulation is complete (this may take several minutes, see page 12 and 13) the results will be displayed on the graphs and tables in the right pane of the Main Program Screen.
DIRECT-ENTRY™ MENU CHOICES
When a component field supports direct data entry, the bounding box will have a white interior (see left photo, below). On the other hand, if the only selection possible is a choice from the drop-down menu, the bounding box will have a gray interior. Component-field menu selections are detailed in the tables on the next two pages.
Program Overview
Gray Background:No numeric input
accepted. Makeselection from
drop-down menu.
White Background:Numeric input
accepted. Entervalue or makeselection from
drop-down menu.
Fields Accepting Direct Input Fields Not Accepting Direct Input
Componentfieldsthatsupportdirectdata entry have white bounding boxes (left, and the table on page 26). When the only selection possible is a choice from the menu, the bounding box will have a gray interior (above, and the table on page 27).
26—DeskTop FastLap5 & FastLapSim5 Vehicle Simulations
Program Overview
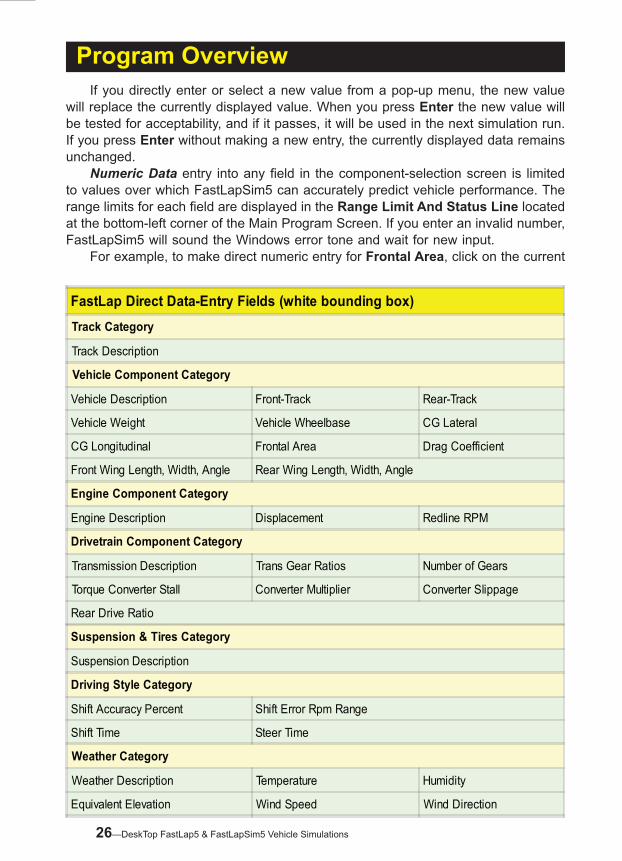
FastLap Direct Data-Entry Fields (white bounding box)Track Category
Track Description
Vehicle Component Category
Vehicle Description Front-Track Rear-Track
Vehicle Weight Vehicle Wheelbase CG Lateral
CG Longitudinal Frontal Area Drag Coefficient
Front Wing Length, Width, Angle Rear Wing Length, Width, Angle
Engine Component Category
Engine Description Displacement Redline RPM
Drivetrain Component Category
Transmission Description Trans Gear Ratios Number of Gears
Torque Converter Stall Converter Multiplier Converter Slippage
Rear Drive Ratio
Suspension & Tires Category
Suspension Description
Driving Style Category
Shift Accuracy Percent Shift Error Rpm Range
Shift Time Steer Time
Weather Category
Weather Description Temperature Humidity
Equivalent Elevation Wind Speed Wind Direction
If you directly enter or select a new value from a pop-up menu, the new value will replace the currently displayed value. When you press Enter the new value will be tested for acceptability, and if it passes, it will be used in the next simulation run. If you press Enter without making a new entry, the currently displayed data remains unchanged. Numeric Data entry into any field in the component-selection screen is limited to values over which FastLapSim5 can accurately predict vehicle performance. The range limits for each field are displayed in the Range Limit And Status Line located at the bottom-left corner of the Main Program Screen. If you enter an invalid number, FastLapSim5 will sound the Windows error tone and wait for new input. For example, to make direct numeric entry for Frontal Area, click on the current

DeskTop FastLap5 & FastLapSim5 Vehicle Simulations—27
Program OverviewFastLap Menu-Only Selection Fields (gray bounding box)Suspension Component Category
Suspensioni Setup
Drivetrain Component Category
Transmission Coupling
Drivnig Wheels
Driving Style Category
Driving Style Description
Area value (or asterisks, if no data is present). The range limits for Frontal Area will be displayed in the Range Limit And Status Line (square feet). Make an entry within the acceptable range followed by Enter. If you select an invalid number, FastLapSim5 will sound an error tone and wait for new entry.
THE MEANING OF SCREEN COLORS
The colors used on the component-selection screen provide information about various vehicle components and specifications. Here is a quick reference to screen color functionality (as it applies to the color set used in FastLapSim5):
White Field Labels: All vehicle component fields and specifications in each com-ponent category are displayed in white. These fields can be followed by ei-ther Yellow (calculated only) or Light Blue (changeable) values, as described below.
Yellow Numeric Values: Yellow specifications, such as Barometer, indicate that they are automatically calculated by program and cannot be directly altered.
Light Blue (cyan): All specifications that can be changed by the user through pull-down menus or direct data entry are displayed in light blue.
28—DeskTop FastLap5 & FastLapSim5 Vehicle Simulations
COMPONENT MENUSCOMPONENT MENUSTHE TRACK CATEGORY
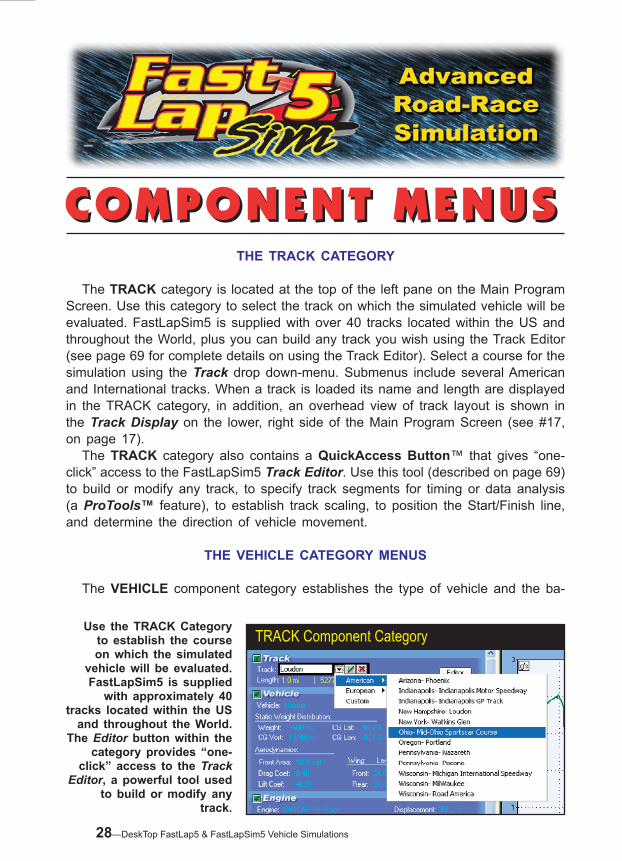
The TRACK category is located at the top of the left pane on the Main Program Screen. Use this category to select the track on which the simulated vehicle will be evaluated. FastLapSim5 is supplied with over 40 tracks located within the US and throughout the World, plus you can build any track you wish using the Track Editor (see page 69 for complete details on using the Track Editor). Select a course for the simulation using the Track drop down-menu. Submenus include several American and International tracks. When a track is loaded its name and length are displayed in the TRACK category, in addition, an overhead view of track layout is shown in the Track Display on the lower, right side of the Main Program Screen (see #17, on page 17). The TRACK category also contains a QuickAccess Button™ that gives “one-click” access to the FastLapSim5 Track Editor. Use this tool (described on page 69) to build or modify any track, to specify track segments for timing or data analysis (a ProTools™ feature), to establish track scaling, to position the Start/Finish line, and determine the direction of vehicle movement.
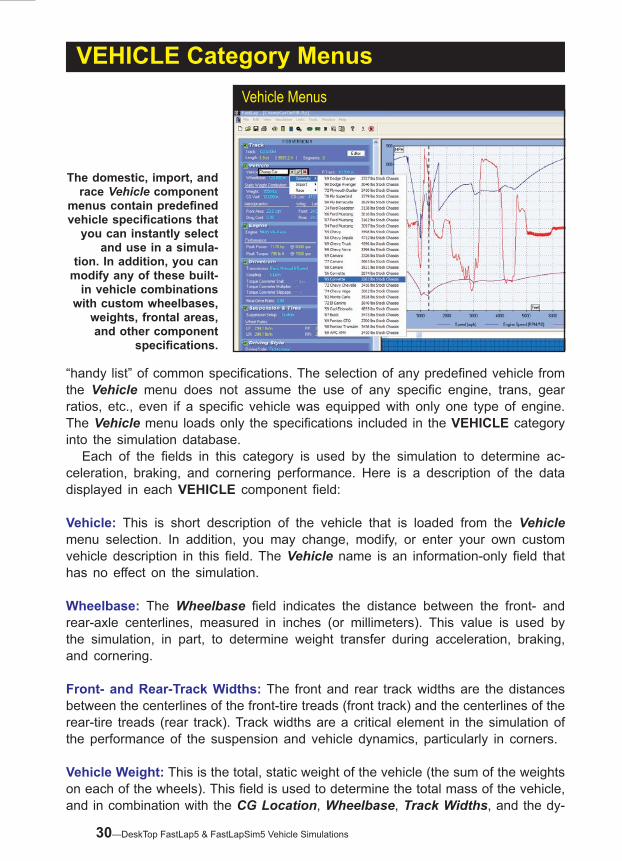
THE VEHICLE CATEGORY MENUS
The VEHICLE component category establishes the type of vehicle and the ba-
TRACK Component CategoryUse the TRACK Category
to establish the course on which the simulated
vehicle will be evaluated. FastLapSim5 is supplied
with approximately 40 tracks located within the US
and throughout the World. The Editor button within the
category provides “one-click” access to the Track
Editor, a powerful tool used to build or modify any
track.

DeskTop FastLap5 & FastLapSim5 Vehicle Simulations—29
sic chassis and aerodynamics configuration. This category has sixteen data-entry fields. The Vehicle menu is located on the upper-left of the VEHICLE category. By opening this menu, you are presented with a variety of domestic, import, and race-only predefined vehicle configurations. If any one of these choices is selected, the appropriate vehicle name, weight, wheelbase, front- and rear-track widths, location of driving wheels, center-of-gravity locations, frontal area, aero drag coefficient, and wing specifications are loaded into the VEHICLE category. In addition to, or instead of, selecting an existing vehicle configuration, you can directly enter individual ve-hicle specifications (within the acceptable range limits, displayed at the bottom of the screen in the Range Limit And Status Line). The Vehicle menu, and the VEHICLE category in general, can be considered a
VEHICLE Category Menus
VEHICLE Component CategoryOpening the Vehicle menu presents a variety of pre-defineddomestic, sport-
compact, and race vehicle configurations.Eachof
these selections loads the appropriate vehicle name,
weight, wheelbase, CG locations, frontal area, drag coefficient, andwingspeci-fications into theVEHICLE
category.
The Track Editor
FastLapSim5 (Advanced and ProTools versions) includes a powerful Track Editor “construction set.” Use this tool (described in de-tail on page 69) to build or modify any track, to specify track segments for timing or data analysis, to es-tablish track scaling, to position the Start/Finish line, and to determine the direction of vehicle movement. The Track Editor can be used to build any closed-course track with any number of turns. Turns and straights are constructed with “control points” using a technique similar to that used in the Adobe Illustrator™ drawing program.
30—DeskTop FastLap5 & FastLapSim5 Vehicle Simulations
“handy list” of common specifications. The selection of any predefined vehicle from the Vehicle menu does not assume the use of any specific engine, trans, gear ratios, etc., even if a specific vehicle was equipped with only one type of engine. The Vehicle menu loads only the specifications included in the VEHICLE category into the simulation database. Each of the fields in this category is used by the simulation to determine ac-celeration, braking, and cornering performance. Here is a description of the data displayed in each VEHICLE component field:
Vehicle: This is short description of the vehicle that is loaded from the Vehicle menu selection. In addition, you may change, modify, or enter your own custom vehicle description in this field. The Vehicle name is an information-only field that has no effect on the simulation.
Wheelbase: The Wheelbase field indicates the distance between the front- and rear-axle centerlines, measured in inches (or millimeters). This value is used by the simulation, in part, to determine weight transfer during acceleration, braking, and cornering.
Front- and Rear-Track Widths: The front and rear track widths are the distances between the centerlines of the front-tire treads (front track) and the centerlines of the rear-tire treads (rear track). Track widths are a critical element in the simulation of the performance of the suspension and vehicle dynamics, particularly in corners.
Vehicle Weight: This is the total, static weight of the vehicle (the sum of the weights on each of the wheels). This field is used to determine the total mass of the vehicle, and in combination with the CG Location, Wheelbase, Track Widths, and the dy-
VEHICLE Category MenusVehicle Menus
The domestic, import, and race Vehicle component
menuscontainpredefinedvehiclespecificationsthat
you can instantly select and use in a simula-
tion. In addition, you can modify any of these built-
in vehicle combinations with custom wheelbases,
weights, frontal areas, and other component
specifications.

DeskTop FastLap5 & FastLapSim5 Vehicle Simulations—3�
VEHICLE Category Menusnamic forces applied to the vehicle as it moves along the track, FastLapSim5 will determine the instantaneous center of mass of the vehicle and the forces transferred through each tire at every 0.001-second throughout the race.
CG Locations (Vertical, Lateral, and Longitudinal): The CG Location fields indi-cate where, within the three-dimensional space of the vehicle, the center of mass is located (assuming the vehicle is static on a level surface). The Vertical CG location is the height of the center of mass as measured from of the road surface. The Lateral and Longitudinal fields indicate the left/right and front/rear distribution of vehicle weights and are shown as percentages; for example, Lateral CG indicates the percentage of total vehicle weight that rests on the left tires. In other words, if the weight on both right tires is 1200 pounds and the weight on the left tires is 1000 pounds, the Lateral CG distribution of weight is approximately 45% (left weight divided by total vehicle weight, or 1000 / 2200 = 45.5%). The Longitudinal CG indicates the percentage of total vehicle weight that rests on the front tires. For example, if the weight on the front tires is 900 pounds and the weight on the rear tires is 1300 pounds, the Longitudinal CG distribution of weight is 41% (front weight divided by total vehicle weight, or 900 / 2200 = 41%). All three CG values can be quickly calculated using the CG QuickCalculator™, available by clicking the CG Calc button in the VEHICLE category.
Using The CG QuickCalculator™: Finding the CG height and the longitudinal and lateral CG weight distribution for any vehicle is quicker and less error-prone using this calculator. If you are modeling a real-world vehicle, first measure (using individual wheel scales) the weight at each wheel, and the total weight on the front or rear axle when the opposite end of the vehicle is raised 18 to 24 inches. In addition
CG QuickCalculator™The CG QuickCalculator™willhelpyoufindthe CG height and the longitudinal and lateral CG weight distribution for any vehicle. Press
the USE button to apply newly calculated val-ues to the simulation database (updating the
values in the VEHICLE category).

32—DeskTop FastLap5 & FastLapSim5 Vehicle Simulations
VEHICLE Category Menus
to this data, the CG QuickCalculator™ will apply the wheelbase entered in the VEHICLE category to determine the required CG values. Simply enter the values in the appropriate fields (boxes), and the total vehicle weight and the CG values will be calculated. Press the USE button to apply the new values to the simulation database (updating the values in the VEHICLE category).
Frontal Area: This field displays the square-foot area displaced as the vehicle moves forward through the air. Combined with the Aero Drag Coefficient (discussed next) FastLapSim5 can determine the aerodynamic drag resisting the forward movement of the vehicle throughout the race.Note: If you do not know the Frontal Area of the vehicle that you would like to model, you can select a vehicle with a similar front-body design from the Vehicle menu. You can also calculate the Frontal Area by drawing representations of the main components of the front of the vehicle as rectangles on graph paper. For ex-ample, to determine the displaced area of the windshield, measure the true height of the windshield (the height of the top of windshield to the ground minus the height of the bottom of the windshield to the ground) and its width in inches and draw a rectangle of the same (scaled; perhaps 1 foot equals 1 inch) dimensions. Then multiply the height by the width and divide by 144 to obtain the square-foot frontal area of the windshield. Continue this process for the hood, grill, bumper, tires, and all surfaces that you can view from the front of the vehicle; the surfaces that deflect air as the vehicle moves forward. When you add up the area of all of the measured surfaces, you will have determined the Frontal Area of the vehicle.
AeroDragAndLiftCoefficient: Aero Drag is the ratio of the actual aerodynamic forces on the vehicle (usually measured in a wind tunnel) compared to the calcu-lated drag of a flat-front object (like a box, generating the highest possible wind resistance) with the same Frontal Area. Smaller numbers indicate that the vehicle can move more efficiently move through the air (than a flat surface). The Aero Drag Coefficient is always less than 1.0.
Measuring CG Weights
If you are modeling a real-world vehicle,firstmeasure(usingin-
dividual wheel scales) the weight at each wheel. Then measure the
total weight on the front or rear axle when the opposite end of the
vehicle is raised �8 to 24 inches. Enter these values in the appropri-
atefieldsintheCGCalculator.Totalvehicle weight and the CG values
will be calculated.

DeskTop FastLap5 & FastLapSim5 Vehicle Simulations—33
ENGINE Component CategoryThe ENGINE compo-nent category estab-lishes the basic type
of engine used in the simulated vehicle and its power curve.
Note: If you do not know the Aero Drag Coefficient of the vehicle you would like to model, you can select a vehicle with a similar front-body design from the Vehicle menu and, based on the aero coefficients displayed, make an “educated guess” of a coefficient that would approximate the vehicle you would like to model. You can also select the Lift Coefficient for the test vehicle. Lift aerodynamics simulate the lift (or downforce) applied to the vehicle by the shape of the body and/or cowling and other airfoils that are incorporated into the body structure. A positive number indicates lift (from +0.01 to +0.99; a value of +1.0 would lift the vehicle off of the track) and a negative number will apply a downforce (from -0.01 to - 4.00; -4.00 applies four times the vehicle weight to the track). Lift or downforce is applied to the body at the CG point.
Front- And Rear-Wing Dimensions: The simulation calculates the downforces and drag from an airfoil-type front wing and rear wing. The basic dimensions of Length, Width, and Angle (angle of attack—the angle produced by the centerline of the wing relative to the moving airstream). These three fields can be modified for each wing and establish the operational characteristics of downforce and drag (drag increases as downforce increases). A wing, as modeled in FastLapSim, is defined by its surface area (length x width) and its angle of attack. The forces produced by the wings are applied at the CG height over the front and rear axles, respectively.
Wing Configuration The wing models used in FastLapSim5 include end platesandGurneyflaps.In addition, the simulation includes chord-angle model-ing. This is a measurement of the shape of wing surfac-es and provides an indicator of the ability to produce lift with a zero attack angle. In FastLapSim5 the chord angle is set to zero degrees; lift is produced only when the angle of attack is greater than zero.
VEHICLE Category Menus

34—DeskTop FastLap5 & FastLapSim5 Vehicle Simulations
ENGINE Category Menus
If you wish to disable either or both wings, set the attack angle to zero.Note On Wing Simulation: The wing models used in FastLapSim5 also include end plates and Gurney flaps, however, the dimensions for these components is fixed within the simulation. In addition, the simulation also includes chord-angle modeling. This is a measurement of the shape of wing surfaces and provides an indicator of the ability to produce lift with a zero attack angle. In FastLapSim5 the chord angle is set to zero degrees, indicating that both wings will develop no lift on their own; lift is produced only when the angle of attack is greater than zero.
THE ENGINE CATEGORY MENUS
The ENGINE component category establishes the type of engine used in the simulated vehicle and its basic power curve. This category has three data-entry fields (and four additional display-only fields). The menu selections in the ENGINE category are:
Engine: This menu is located in the upper-left corner of the ENGINE component category. This menu allows the selection of several built-in test engines, or you can load any DynoSim engine file, and you also can specify any engine power curve using the Custom Engine Power Curve dialog:
Built-In Engine Selections: The engine menu includes a list of several Street, Track, and Race engines. Use these choices to quickly load an engine power curve and displacement into the simulation database. The power curves from these choices can be easily modified after making an engine selection by clicking the HP Curve button in the ENGINE category.Custom Engine Power Curve: This selection opens the Custom Engine Power Curve dialog screen that allows direct entry of power/torque values or, by en-tering the peak torque and horsepower values, FastLapSim5 can calculate the
Built-In Engine Selections
The engine menu includes a basic list of several Street, Track, and Race engines (in addition, you can load any engine power curve, see pages 35 and 36). Use these choices to quickly load an engine power curve and displacement into the simulation database. The power curves from these choicescanbeeasilymodifiedbyclickingthe HP Curve button to open the Custom Power Curve dialog screen.

DeskTop FastLap5 & FastLapSim5 Vehicle Simulations—35
horsepower and torque curves. Note: The Custom Engine Power Curve dialog box may be opened at any time by either clicking the Custom Power Curve icon in the Toolbar, by selecting Cus-tom Engine Power Curve from the Tools menu (located in the Menu Bar), or by clicking on the HP Curve button in the ENGINE component category. Some tips in using this dialog box follows:
How To Enter Peak Power/Torque: The Peak Power/Torque data entry is the quick method to load an engine power curve into FastLapSim. By simply entering the peak torque and power values (sometimes published
ENGINE Category Menus
Irregular Power CurveIf the horsepower and torque curve extrapolated from Peak values has
an unusual “bump” or “dip,” it is probably caused by using incorrect
Peak Power/Torque Rpm points. FastLapSim5 will always draw
power and torque curves that pass through the entered peak power
and torque points. If these values don’t correspond with the appropri-ate rpm values, a nonuniform curve
will be generated (as shown on the right). Try changing the power/
torque or rpm values to obtain smooth curves.
Using The Peak Power/Torque Method
The Peak Power/Torque data entry method lets FastLapSim5 calculate the entire power curve from the peak-horsepower and peak-torque values (often published in “road tests” in magazines or books). To activate this method, click on the Peak Power/Torque radio but-ton. When peak horsepower and torque values have been entered, FastLapSim5 will extrapolate a complete horsepower and torque curve and replace any existing power values with the new, calcu-lated values.

36—DeskTop FastLap5 & FastLapSim5 Vehicle Simulations
in road-test magazines), and the rpm points at which these peaks occur, FastLapSim5 will calculate the power and torque curves, display them on the graph, and list the individual power points in the table. To activate this method of data entry, activate the Peak Power/Torque radio button located at the top-left of the dialog. When activated, individual Torque and Power fields for all rpm points are dimmed. When peak horsepower, torque, and rpm values have been entered in the fields to the right of the radio buttons, FastLapSim5 will extrapolate complete curves and replace any existing power values with the new, calculated values. Click OK to transfer these values to the simulation; click Cancel to discard any changes and revert to previous power values (if any).Note: If the horsepower and torque curve extrapolated from Peak values has an unusual “bump” or “dip” (see photo on previous page), it is probably caused by using a Peak Horsepower or Peak Torque value that does not correspond to the Peak Power/Torque Rpm points. FastLapSim5 will always attempt to draw power and torque curves that pass through the entered peak power and torque points. If these values don’t correspond with the appropriate rpm values, a nonuniform curve will be generated. Try changing the power/torque or rpm values to obtain smooth curves.
How To Directly Enter A Power/Torque Curve: To activate this method of data entry, click on either the Power or Torque radio button (not Peak Power/Torque) located at the top-left of the dialog box. If you select Power, the program will accept horsepower values; if you select Torque, the pro-gram allows the direct entry of torque values. The Start Rpm and Step Rpm values located in the top-right corner of the dialog box (default 2000
Using The Direct Data Entry Method
ENGINE Category Menus
You can directly enter engine power curve data by clicking on either the Power or Torque radio buttons. If you select Power, the program will accept horsepower values; if you select Torque, the program allows the direct entry of torque values. The Start and
Step Rpm values (located in the top-right corner of the dialog box) determine the start-and
step-rpm values for each power point, up to 26 data-entries.

DeskTop FastLap5 & FastLapSim5 Vehicle Simulations—37
Import DynoSim5 Engine Files FastLapSim5 will directly import DynoSim5enginefiles.Toloada DynoSim test engine, select Import DynoSim Engine File fromtheEnginemenu.Afile-open dialog box allows you se-lectanyDynoSim5fileonyoursystem. The default location for DynoSim5enginefilesisC:\DynoSim5\EngineFiles (.DYN)
ENGINE Category Menusand 500rpm, respectively), indicate at what rpm the power curve begins and the speed increase for each power point, for up to 26 data-entry points or 14,500 rpm maximum. If you wish to extend the power curve beyond 14,500 rpm, simply increase the Start or Step Rpm.Important Note: Specify the Start and Step values BEFORE you enter the power curve, or you may not obtain the power curve you desire. If you change either the Step or Start Rpm values after a power curve has been entered, the program will attempt to change only the rpm points; the horsepower and torque values will remain unchanged. In addition, if you select an rpm range that invalidates some of the power-point values used by the program (like shift rpm or redline rpm), some of the horsepower and torque values may be altered by the program to “fill-in” the discrepancy. As a result, we recommend that you establish the Start and Step values BEFORE you enter any power curve data and only change Start and Step values with caution. Now enter the first horsepower or torque value, press the TAB key, and the related torque or horsepower value will be calculated and placed in the adjacent field. When you have entered the final power-curve value, press Enter or click OK to close the dialog box and load the power curve into the simulation.Data Entry Tip: If you need to expand the power curve to higher rpm values, click the up-scroll-arrow next to the Data Points field (just above the OK button); or reduce the number of power values by clicking on the down-scroll-arrow. When you expand the number of power points, the horsepower value in the last entry field is duplicated in the added fields, however the torque value is recalculated for the higher rpm values.
Import DynoSim5 Engine Files: FastLapSim5 will directly import DynoSim5 engine files. This is, by far, the fastest way to store engine performance data
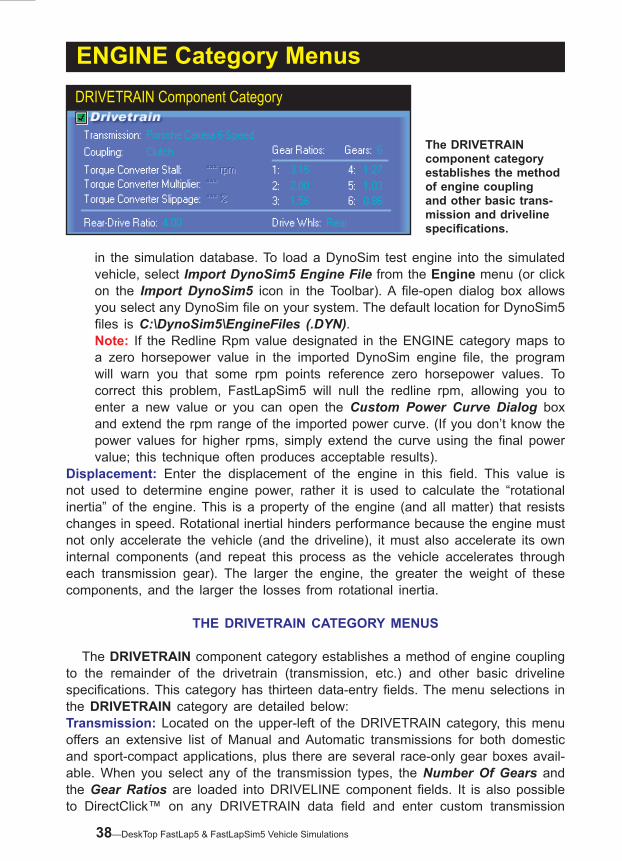
38—DeskTop FastLap5 & FastLapSim5 Vehicle Simulations
in the simulation database. To load a DynoSim test engine into the simulated vehicle, select Import DynoSim5 Engine File from the Engine menu (or click on the Import DynoSim5 icon in the Toolbar). A file-open dialog box allows you select any DynoSim file on your system. The default location for DynoSim5 files is C:\DynoSim5\EngineFiles (.DYN).Note: If the Redline Rpm value designated in the ENGINE category maps to a zero horsepower value in the imported DynoSim engine file, the program will warn you that some rpm points reference zero horsepower values. To correct this problem, FastLapSim5 will null the redline rpm, allowing you to enter a new value or you can open the Custom Power Curve Dialog box and extend the rpm range of the imported power curve. (If you don’t know the power values for higher rpms, simply extend the curve using the final power value; this technique often produces acceptable results).
Displacement: Enter the displacement of the engine in this field. This value is not used to determine engine power, rather it is used to calculate the “rotational inertia” of the engine. This is a property of the engine (and all matter) that resists changes in speed. Rotational inertial hinders performance because the engine must not only accelerate the vehicle (and the driveline), it must also accelerate its own internal components (and repeat this process as the vehicle accelerates through each transmission gear). The larger the engine, the greater the weight of these components, and the larger the losses from rotational inertia.
THE DRIVETRAIN CATEGORY MENUS
The DRIVETRAIN component category establishes a method of engine coupling to the remainder of the drivetrain (transmission, etc.) and other basic driveline specifications. This category has thirteen data-entry fields. The menu selections in the DRIVETRAIN category are detailed below:Transmission: Located on the upper-left of the DRIVETRAIN category, this menu offers an extensive list of Manual and Automatic transmissions for both domestic and sport-compact applications, plus there are several race-only gear boxes avail-able. When you select any of the transmission types, the Number Of Gears and the Gear Ratios are loaded into DRIVELINE component fields. It is also possible to DirectClick™ on any DRIVETRAIN data field and enter custom transmission
ENGINE Category MenusDRIVETRAIN Component Category
The DRIVETRAIN component category establishes the method of engine coupling and other basic trans-mission and driveline specifications.

DeskTop FastLap5 & FastLapSim5 Vehicle Simulations—39
specs.Note: The Coupling Method (either a Clutch or a Torque Converter) is selected separately from the transmission type and is NOT determined from a Transmission menu selection (Coupling is described later).Number Of Gears: The Gears menu establishes the number of forward gear ratios for the transmission. You can choose 1 (for direct drive) to 6 forward gears.Transmission Gear Ratios: FastLapSim5 will impose several rules upon the en-try of each transmission Gear Ratio. Each higher gear (2nd, 3rd, etc.) must be numerically lower than the previous gear, and all ratios must fall between 9.99:1 and 0.50:1.Coupling: This menu allows the selection of either Clutch or Torque Converter coupling (connection) between the engine and the transmission. As mentioned earlier, this choice is completely independent of the Transmission selection. In fact it is possible to “assemble” and test both of these driveline combinations:
• Manual Transmission With A Clutch• Automatic Transmission With A Torque Converter
and the following two combinations are also possible:• Manual Transmission With A Torque Converter• Automatic Transmission With A Clutch
While it may be rare (or impossible) to build either of the last two combinations in the real world, FastLapSim5 makes it possible to try virtually any combination. Keep in mind that the Transmission (Manual or Automatic) and Coupling (Clutch or Torque Converter) are separately selected and independently evaluated by the simulation.
Clutch: This Power Coupling selection activates a sophisticated clutch model. The clutch will automatically adjust itself to the power, weight, and driving char-acteristics of the vehicle. It will offer sufficient slippage to absorb high shock loads to the drivetrain. It will provide a near-slip-free shifts and hook up solidly at speed. As horsepower increases, the clutch model will change to accommo-date the needs of high horsepower applications. You can consider FastLapSim5 clutch model to be near-optimum, and the Lap Times predicted with this model
DRIVETRAIN Category MenusTransmission Selections
FastLapSim5 offers an exten-sive list of Manual and Auto-matic transmissions for both domestic and sport-compact applications. It is also possible to DirectClick™ on any DRIVE-TRAINdatafieldandentercus-tom transmission specs. When a transmission selection is made, the Number Of Gears and the Gear Ratios are loaded into DRIVELINEcomponentfields.

40—DeskTop FastLap5 & FastLapSim5 Vehicle Simulations
to be in-line with competitive vehicles.Torque Converter: This menu choice opens the Torque Converter submenu that offers several torque-converter combinations. When any of these choices is selected, the appropriate Stall Rpm, Torque Multiplier, and Slip percentage will be loaded into the DRIVETRAIN category. It is also possible to DirectClick™ any of these DRIVETRAIN data fields and enter custom values. The torque converter is typically composed of an impeller, turbine, and a stator fitted with blades that direct fluid and power flow. The engine drives the impeller that imparts energy to the internal fluid. The turbine is attached to the input shaft of the transmission and is driven by the fluid flow generated by the turbine. The stator is locked to a fixed shaft and does not rotate. This stationary stator redirects fluid flow against the impeller and raises the torque forces on the turbine higher than the load imparted by the impeller alone. This Torque Multiplication dramatically increases efficiency and performance in standing starts. Typical torque multipliers range from 1.9 to 2.5 for most automotive ap-plications. In other words, the torque (lb-ft) measured at the turbine (input to
DRIVETRAIN Category MenusPower Coupling Menu
The Coupling menu allows the selection of either a Clutch or a Torque Converter.
Keep in mind that the Transmission (Manual
or Automatic) and Coupling (Clutch or
Torque Converter) are separately selected and independently
evaluated by the simulation.
Torque Converter Specifications When any torque converter is selected, the Stall Rpm, Torque Multiplier, and Slip percent-agefieldsbecomeactiveinthe DRIVETRAIN category. Use FastLapSim5 built-in selections orDirectClick™anydatafieldand enter custom values.

DeskTop FastLap5 & FastLapSim5 Vehicle Simulations—4�
DRIVETRAIN Category Menusthe transmission before the vehicle begins to move) is 1.9- to 2.5-times greater than the torque generated by the engine. Since the torque converter is a “fluid coupling,” it can never be as efficient as a clutch (some passenger-car torque converters incorporate a clutch that “locks up” the converter at higher road speeds and improves cruising efficiency; this is not modeled in FastLapSim). The built-in inefficiency in all torque con-verters is measured (in part) as a Slip Percentage. The higher the slip, the greater the rpm difference between the input and output rpm above the stall speed (discussed next). Typical automotive torque converters slip between 6 and 15%. Finally, every torque converter has a rated Stall Speed that indicates the maximum engine speed that can be achieved at wide-open throttle with the vehicle standing still (i.e., before the transmission input shaft begins to rotate). For street applications and some racing applications, a low stall speed (1000 to 1500rpm) optimizes the efficiency of the converter and takes advantage of the low-speed torque capability of some engines. On the other hand, high-speed engines, especially used in standing-start competition, produce peak torque at much higher engine speeds. To accommodate these applications, a torque converter can be modified to stall at higher rpm (3000 to 5000 or more). At these speeds, racing engines transfer near-peak torque loads to the rear wheels at the starting line, assuring maximum acceleration. However, high stall speeds also reduce efficiency and can dramatically increase transmissions fluid temperatures. For road racing applications a stock (non-lock-up—lockup converters will not withstand racing use), large diameter, low-stall-speed converter is often the best choice, since it is likely to have the highest efficiency, the lowest slippage, and impart the least amount of heat to the transmission fluid.
Rear-Drive Ratio Menu The Rear-Drive Ratio is the numerical gear ratio of the front or rear driving axle, depending on whether the vehicle is front- or rear-wheel drive. This ratio indicates the number of turns the drive-shaft (or pinion gear) rotates for each revolution of the rear wheels.

42—DeskTop FastLap5 & FastLapSim5 Vehicle Simulations
SUSPENSION & TIRES Category Menus
Rear-Drive Ratio: The Rear-Drive Ratio is the numerical gear ratio of the rear-driving axle or—in the case of front-wheel drive vehicles—the front-driving axle. This ratio indicates the number of turns the driveshaft (or pinion gear) rotates for each revolu-tion of the rear wheels. The Rear-Drive Ratio submenu in FastLapSim5 includes several common (automotive) rear-axle ratios. It is also possible to DirectClick™ on Rear-Drive Ratio and enter any custom ratio between 9.99:1 to 0.50:1.Driving Wheels: The Drive Wheels field accepts either Front or Rear entries. This field establishes the simulation model that applies engine torque to the front or rear wheels.
THE SUSPENSION & TIRES CATEGORY MENUS
The SUSPENSION & TIRES component category, despite its “simple” appear-ance, is probably the most complex and comprehensive category in FastLapSim. The menu selections in this category (really, in all component categories) have been designed to be easy to use, with the vast array of technical choices “hidden” below the surface, but fully available by “drilling down” into more detailed data-entry screens. This allows fast and powerful selections from the topmost menus, while still allowing minute adjustments to individual components. Details of the these selctions follow:
Despite its “simple” appearance, the Suspension & Tires component category is the most complex and comprehensive in FastLapSim. Click the Setup button to modify individual component specs.
SUSPENSION & TIRES Component Category
Several “prepackaged” choices of entire suspen-sion setups, including selections for suspen-sion design, spring rates, sway bars, shocks, tires, and brakes are available from the Suspen-sion Setup menu. Using these choices you can quickly evaluate “stable” system packages on a variety of vehicles and tracks. And if you wish to modify component groups to test their effect on vehicle handling and performance, simply click on the Setup button to open the Suspension Setup dialog box or select “Custom Suspension” from the Suspension Setup menu.
Suspension “Packages”

DeskTop FastLap5 & FastLapSim5 Vehicle Simulations—43
SUSPENSION & TIRES Category Menus
Suspension Setup: This menu presents several “prepackaged” choices of entire suspension setups, including selections for suspension design, spring rates, sway bars, shocks, tires, and brakes. Using these upper-level choices you can quickly evaluate “stable” system packages on a variety of vehicles and tracks. And if you wish to modify component groups to test their effect on vehicle handling and per-formance, simply click on the Setup button to open the Suspension Setup dialog box. The Suspension Setup dialog introduces another “level” of menus. Rather than selecting entire suspension packages, these menus offer a range of components
Spring Damper Geometry Tire Brake Front Roll Bar Rear Roll Bar
Coil Spring Bump Force Spring D1Arm Lat. Peak Diameter Bar Length Bar Length
Number of Coils BF Velocity Spring D2Connector Lon. Peak Thickness Inner Bar Dia. Inner Bar Dia.
Coil Diameter Rebound Force Spring BellcrankRatio Lat. Slope Pad Area Outer Bar Dia. Outer Bar Dia.
Wire Width RF Velocity Damper D1 Arm Lon. Slope Friction Coef. Arm Length Arm Length
Torsion Bar Bump Slope Damper D2Connector Shape Rear Bias
Bar Length Rebound Slope Damper BellcrankRatio Stiffness Front Bias
Inner Bar Dia. Maximum Travel Curvature
Arm Length Static Toe Camber Slope
Leaf Spring Static Camber Spring Rate
Number of Leaves Diameter
Length Width
Width Pressure
Thickness
Manual
Spring Rate
There are seven major categories of
componentspecifica-tions available in the
suspension Setup Dialog box. With a
huge number of com-ponent combinations, you can test, modify,
andfine-tuneyourvehicle to optimize
lap times.
Suspension Setup DialogUse the Suspension Setup Dialog Box to modify individual components for each
wheel and test their effect on vehicle handling and performance. Rather than
selecting entire suspension packages as you can from the Main Component Screen, these menus offer a range of
components in each of the Spring, Damper, Geometry, Tire/Brake, and Front/
Rear Sway Bar categories. Here you’ll findcomponentselectionsandspecifica-tions of common, off-the-shelf products.
If you would like to “dig deeper” still and trycustomcomponentsandspecifica-tions, click on any one of the four cal-culator buttons next to the component
categories. The �8 calculator screens available in this dialog box let you test
a virtually unlimited number of possible combinations. The four graphs indicate
how the spring on each wheel is damped by the shock absorber. For details on using these graphs, see pages 46-47).

44—DeskTop FastLap5 & FastLapSim5 Vehicle Simulations
SUSPENSION & TIRES Category Menusin each of the Spring, Damper, Geometry, Tire/Brake, and Front/Rear Sway Bar categories. These component selections offer components and specifications from lists of common values or off-the-shelf products. If you would like to “dig deeper” and try custom components and specifications, click on any one of the four calculator buttons next to the component categories grouped together for each wheel. (Note: The four graphs indicate how spring motion at each wheel is damped by the shock absorber; for details on interpreting these graphs, see page 46). The total of 18 calculator screens let you select suspension designs and component specifications. With, literally, billions of possible suspension component combinations, this is the heart of FastLapSim—these selections allow you to test, modify, and fine-tune your suspension to optimize lap times. The following information offers an overview of the individual component selec-tions provided in the SUSPENSION & TIRES component categories (for additional help in tuning suspension components, see The Handling Clinic on page 106):
Spring Calculator Tab: Clicking on the calculator buttons next to the Spring drop-down menus will open a Spring Calculator. Here you can select three types of spring systems for that particular wheel: Coil Springs, Torsion Bars, or Leaf Springs (the suspension arm/linkage designs are chosen in the Ge-ometry Tab, discussed later). When you select one of the three spring types, the related fields for that spring are activated. Enter the required specifications, and the spring rate will be calculated and displayed in the Spring Rate field. Refer to the spring il-lustration for “keys” to the required data. The range limits for each variable are displayed in the Range Limit Line at the bottom of the dialog box.Note: Instead, you can directly enter a spring rate by clicking the Manual box and entering a spring rate value in the Spring Rate field.
Spring Calculator Tab The Spring Calculator Tab lets you select three types of spring systems for each wheel: Coil Springs, Torsion Bars, or Leaf Springs.When you select one of the three spring types, the related fieldsforthatspringareactivated. Enter the requiredspecifications,and the spring rate will be calculated and displayed in the Spring Ratefield.(Alternatively, you can di-rectly enter a spring rate by clicking the Manual box.)
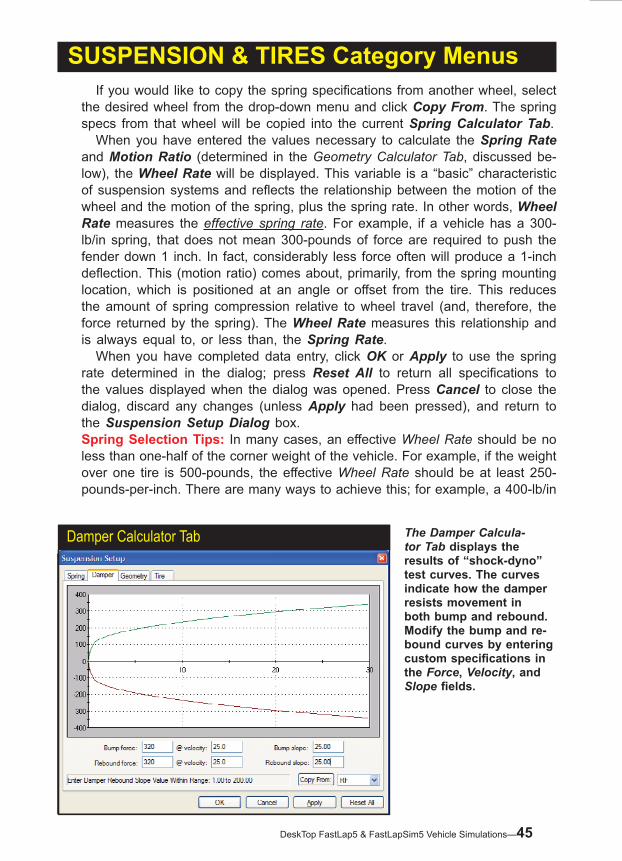
DeskTop FastLap5 & FastLapSim5 Vehicle Simulations—45
If you would like to copy the spring specifications from another wheel, select the desired wheel from the drop-down menu and click Copy From. The spring specs from that wheel will be copied into the current Spring Calculator Tab. When you have entered the values necessary to calculate the Spring Rate and Motion Ratio (determined in the Geometry Calculator Tab, discussed be-low), the Wheel Rate will be displayed. This variable is a “basic” characteristic of suspension systems and reflects the relationship between the motion of the wheel and the motion of the spring, plus the spring rate. In other words, Wheel Rate measures the effective spring rate. For example, if a vehicle has a 300-lb/in spring, that does not mean 300-pounds of force are required to push the fender down 1 inch. In fact, considerably less force often will produce a 1-inch deflection. This (motion ratio) comes about, primarily, from the spring mounting location, which is positioned at an angle or offset from the tire. This reduces the amount of spring compression relative to wheel travel (and, therefore, the force returned by the spring). The Wheel Rate measures this relationship and is always equal to, or less than, the Spring Rate. When you have completed data entry, click OK or Apply to use the spring rate determined in the dialog; press Reset All to return all specifications to the values displayed when the dialog was opened. Press Cancel to close the dialog, discard any changes (unless Apply had been pressed), and return to the Suspension Setup Dialog box.Spring Selection Tips: In many cases, an effective Wheel Rate should be no less than one-half of the corner weight of the vehicle. For example, if the weight over one tire is 500-pounds, the effective Wheel Rate should be at least 250-pounds-per-inch. There are many ways to achieve this; for example, a 400-lb/in
SUSPENSION & TIRES Category Menus
Damper Calculator Tab The Damper Calcula-tor Tab displays the results of “shock-dyno” test curves. The curves indicate how the damper resists movement in both bump and rebound. Modify the bump and re-bound curves by entering customspecificationsinthe Force, Velocity, and Slopefields.

46—DeskTop FastLap5 & FastLapSim5 Vehicle Simulations
SUSPENSION & TIRES Category Menusspring could be mounted inward and/or at an angle from vertical, or a 300-lb/in spring could be mounted vertically and as close to the wheel as possible.Damper Calculator Tab: Clicking on any of the four calculator buttons next to the Damper drop-down menus will open a Damper Calculator Tab. Here you can view “shock-dyno” curves for the damper used on that particular wheel. The curves indicate how the damper resists movement in both the bump (compres-sion; as shown on the top of the graph) and rebound (extension shown on the lower portion of the graph). You can modify the bump and rebound curves by entering custom specifications in the Force, Velocity, and Slope fields. The Force and Velocity are directly linked together: The Force indicates the pounds of force required to move the piston with the indicated Velocity (in inches per second). The Slope adjusts the shape of the curve. The higher the Slope, the greater resistance is offered to slow movements, the lower the Slope, the more slowly the resistance builds as Velocity increases. If you would like to copy the damper specs from another wheel, select the desired wheel from the drop-down menu and click Copy From:. The damper specs from that wheel will be copied into the current Damper Calculator Tab. When you have completed data entry, click OK or Apply to use the damper specifications shown in the dialog; press Reset All to return all specifications to the values displayed when the dialog was opened. Press Cancel to close the dialog and discard any changes (providing the Apply button had not been pressed), and return to the Suspension Setup Dialog box.Damper Selection Tips: When designing a spring/damper setup, optimum dampening of suspension movement is the goal. Dampening is dependant on several factors including Spring Rate, Geometry Design, Unsprung Weight, and of course the characteristics of the Damper (shock absorber). There are three possible outcomes when installing components: the suspension can be over-damped, under-damped, or critically-damped.Over-dampening occurs when the shock absorber is too stiff and non-compliant in bump (compression), preventing the spring from doing its job, i.e., returning the tire to the road surface as quickly as possible. Over-dampening acts as if springs with excessive rates had been installed, resisting movement and forcing
Over Dampening SuspensionOver-dampening occurs when the shock absorber is too stiff and non-
compliant in bump (compression), preventing the spring from doing its
job, i.e., returning the tire to the road surface as quickly as possible. Over-
dampening acts as if springs with too high a rate have been installed, resisting movement and forcing the tires to loose contact with the road
surface longer than necessary.

DeskTop FastLap5 & FastLapSim5 Vehicle Simulations—47
SUSPENSION & TIRES Category Menus
the tires to loose contact with the road surface longer than necessary.An under-damped suspension allows the spring to oscillate (compress and relax) more times than necessary; letting the tire leave the road surface sev-eral times after encountering a bump. Under-dampening is often the result of the damper contributing insufficient force in bump, allowing the spring to store excessive energy which is returned to the wheel on rebound.Critical-dampening is the goal. This allows the suspension to move and react but not oscillate. The suspension returns the tire to the road surface as quickly as possible, optimizing traction and handling.The three nearby graphs show how each of these suspension setups respond to an input (bump). The curves show suspension movement (vertical axis) over time (horizontal axis). Notice how the critical-dampened system absorbs energy in compression and extension, but does not continue to bounce. It returns the wheel to a stable position in less than 0.30-seconds.Geometry Calculator Tab: Clicking on any of the four calculator buttons next to the Geometry drop-down menus will open a Geometry Calculator Tab. Here you can specify the length of critical suspension arms, their mounting points, overall suspension travel, and basic pre-race alignment geometry. The Geometry Calculator supports three types of suspension systems: Coil Over Shock Independent, MacPherson Strut Independent, and Coil- or Leaf-Sprung Straight Axle. Refer to the suspension illustrations for “keys” to the required data. The range limits for each variable are displayed in the Range Limit Line at the bottom of the dialog box. When you have entered data in each of the
Under Dampening Suspension An under-damped suspension allows the spring to oscillate (compress and relax) more than necessary; let-ting the tire leave the road surface multiple times after encountering a bump. Under-dampening is often the result of the damper contributing insufficientforceinbump,allowingthe spring to store excessive energy which is returned to the wheel on rebound.
Critical Dampening Suspension
Critical-dampening is the goal. This allows the suspension to move and react but not oscillate. The suspen-
sion returns to the tire to the road surface as quickly as possible, opti-
mizing traction and handling.

48—DeskTop FastLap5 & FastLapSim5 Vehicle Simulations
Wheel Motion Spring Motion
SUSPENSION & TIRES Category Menus
fields in the Spring Geometry group, the Motion Ratio for the suspension will be calculated. Similarly, when the fields in the Damper Geometry group have been completed, the Motion Ratio of the damper will be calculated.If the suspension design on the vehicle you wish to model is not included in the Geometry Calculator, or you do not know all the dimensions required by the calculator, you can manually enter any effective Motion Ratio by clicking one of the Manual radio buttons.Note �: The Motion Ratio is the relationship between vertical wheel movement and the spring or damper movement. For example, if the Motion Ratio was 0.5 (50%), a 2-inch vertical wheel movement would result in a spring/damper motion of 1-inch (50%).Note 2: A Bellcrank is a device, shaped similarly to a 30-, 60-, 90-degree
Motion Ratio
The Motion Ratio is the relationship between vertical wheel movement
and the actual spring or damper movement (Spring Motion divided
by Wheel Motion). For example, if the Motion Ratio was 0.5 (50%), a 2-inch vertical wheel movement
would result in a spring/damper motion of �-inch (50%).
Geometry Calculator TabThe Geometry Calculator Tab sets the lengths of
critical suspension arms, their mounting points,
overall suspension travel, plus basic pre-race align-
ment geometry. Coil Over Shock Independent,
MacPherson Strut Inde-pendent, and Coil- or
Leaf-Sprung Straight Ax-les are supported. When data has been entered in
eachofthefields,theMo-tion Ratio for the suspen-sion will be calculated. In addition, any motion ratio
can be entered by click-ing the Custom box.

DeskTop FastLap5 & FastLapSim5 Vehicle Simulations—49
SUSPENSION & TIRES Category Menus
triangle, that either increases or decreases the amount of motion applied to one end of the triangle. The bellcrank pivots around one point (usually through a mounting hole). The other two points connect to the suspension and/or the spring/damper (one end is often connected to a push rod and the other end is directly connected to the spring/damper). When the pushrod moves, it causes the bellcrank to pivot and compress the spring. If a bellcrank has a ratio of 0.5, this means that the end imparting motion (usually the pushrod end or the side connected to the wheel) will move twice as much as the side connected to the spring. In this case, the pushrod link would be connected to the longer side of the triangle and the spring to the shorter end. In most bellcrank systems, the spring and damper act through the same bellcrank, but there are some suspension designs that use separate bellcranks for the spring and damper. FastLapSim5 supports none, single-, and dual-bellcrank designs.Note 3: If your suspension system does not use a bellcrank mechanism, set the bellcrank ratio(s) to 1.00. With the Spring and Damper Motion Ratios defined, enter the Total Sus-pension Travel, the Static Toe and Static Camber settings for the selected wheel. If you would like to copy all the suspension geometry specifications from another wheel, select the desired wheel from the drop-down menu and click the Copy From: button. The geometry specs from that wheel will be copied into the current Geometry Calculator Tab. When you have completed data entry, click OK or Apply to use the Motion Ratios, Travel, and Alignment specs in the current simulation; press Reset All to return all specifications to the values displayed when the dialog was opened. Press Cancel to close the dialog, discard any changes (providing the Apply button had not been pressed), and return to the Suspension Setup Dialog box.Tire/Brake Calculator Tab: Clicking on any of the four calculator buttons next to the Tire/Brake drop-down menus will open a Tire/Brake Calculator (Tab).
Bellcrank In Suspension DesignA Bellcrank is a device shaped similarly to a 30-, 60-, 90-degree
triangle. It either increases or decreases the amount of motion
applied to one end of the triangle. The bellcrank pivots around one
point, the other points connect the suspension to the spring/dampers. This Koni equipped Formula-� sus-pension system transfers motion to the dampers and other suspension-
tuning elements through a meticu-lously designed pushrod/bellcrank
system.

50—DeskTop FastLap5 & FastLapSim5 Vehicle Simulations
Tire/Brake Calculator TabThe Tire Calculator Tab
will help you analyze tire performance and how
tire variables affect the test vehicle. The graph
indicates how much force can be generated by the
tire throughout its slip-an-gle range. The peaks are the maximum forces that can be produced by the tire. For racing applica-
tions, look for a tire that produces a quick falloff from peak forces, since thisprovidessignificantfeedback and allows the driver to immediately re-
spond to loosing grip.
Here you can specify critical tire and brake specifications for each specific corner of the vehicle. The tire graph will help you analyze tire performance and show how changing any of the tire variables will affect performance. The vertical axis indicates the force (in pounds) being generated by the tire/ground interaction (traction) with a 500-pound vertical test load on the tire. The horizontal axis is the angle of “slippage”; commonly called the Slip Angle for lateral loads (green line) and the Slip Ratio for longitudinal loads (red line). In effect, the Slip Angle and Slip Ratio measure how much the tire is sliding or slipping on the pavement (either laterally, on turns, or longitudinally, on acceleration or braking). The graph shows how much force can be generated by the tire throughout the slip-angle
SUSPENSION & TIRES Category Menus
Rapid Falloff In GripA tire that generates a quick falloff in tractive forces as the slip angle increases will transfer an obvious
change to the driver (the steering wheel response quickly shifts from stiff to light as the tire transi-
tions from sticking to sliding across the road sur-face). This is ideal for a racing since it allows the
driver to immediately respond to changing grip.

DeskTop FastLap5 & FastLapSim5 Vehicle Simulations—5�
range. The peaks in the traces are the maximum forces that can be produced by the tire. For racing applications, a tire that produces a quick falloff from peak forces as the slip angle increases will transfer an obvious change to the driver (the steering wheel response quickly shifts from stiff to light as the tire transitions from sticking to sliding across the road surface). This is commonly used in rac-ing applications since it allows the driver to immediately respond to changes in grip. If the tire performance curves are flatter and tire forces remain high as the slip angle increases, it can lead the driver past the point of no return; by the time the driver realized the tires are sliding it could be too late to effectively recover. Optimum tire selection is entirely dependent on type of vehicle and race track you wish to model. While the Tire group contains twelve tunable elements (as defined by tire manufacturers), the two factors that determine the major handling characteristics of the tire are Peak Grip and Peak Slip. Peak Grip—This defines the maximum (peak) force that the tire can generate with the road surface. For a fixed vertical load, no matter how much horsepower is applied or how well the chassis is tuned, the forces produced by the tires will never increase beyond this value. Since Peak Grip is dependant on vertical load, adding downforce is the only way to increase traction forces. In general, the following values represent common Peak Grip values for various classes of tires:
Street Tire 0.7 to 1.0Autocross 1.0 to 1.5Race 1.2 to 1.8Sticky Qualifying Tire 1.5 to 2.5Drag-Racing “Slick” 3.0 to 6.0
Peak Slip—This value indicates the Slip Angle at which the tire reaches its maximum limit of Peak Grip. The lower the Peak Slip, the more quickly the tire
SUSPENSION & TIRES Category MenusSlow Falloff In Grip
Ifthetireperformancecurvesareflatterandtireforces remain high as the slip angle increases, it
can lead the driver past the point of no return in a high-speed turn; by the time the driver realized the
tires are sliding, it could be too late to effectively recover.

52—DeskTop FastLap5 & FastLapSim5 Vehicle Simulations
SUSPENSION & TIRES Category Menuswill reach Peak Grip. Tires with this characteristic tend to feel stiff and abruptly change traction characteristics. The higher the Peak Slip angle, the more the tire will tend to slip before starting to slide. This makes the tires feel mushy and can contribute to oversteer. Most street tires have peaks in the range of 8- to 11-degrees. Race tires are generally lower, falling between 7- to 9-degrees.Note �: The Slip Angle and Slip Ratio are a measure of the difference in the direction of the vehicle relative to the “direction” of the tire. For example, if a vehicle is moving in a straight line but the front wheels are turned at 5 degrees, a 5-degree slip angle is generated that, in turn, creates a force that causes the car to yaw. Similarly, in the longitudinal direction, the Slip Ratio measures the difference between road speed and wheel speed. So, when you hit the gas, the angular velocity of the tire increases and it moves faster than road speed. This generates a Slip Ratio that produces a force (shown on the graph) that propels the car forward.Note 2: Tire width does not affect the forces shown on the graph. What does change tire forces is the weight of the tire which directly affects wheel damping and the simulation. It’s built into the other values. Also, while it’s generally true that a wider tire will have more grip, tire composition is much more important than width.
Brake Component Specs And Front/Rear-Brake-Bias Slider: The Brake Group is located at the bottom of the Tire/Brake Calculator (Tab). Here you can specify critical brake specifications for each wheel. Optimal lap-times can only be achieved when the vehicle has been equipped with as much braking power as possible, and the large braking forces generated
Analyze Slip RatiosForward/Rear brake bias can be easily adjusted. The goal is to achieve optimum braking without tirelockup.Iftherearbrakeslockupfirst,move
the bias slider in the Tire/Brake Calculator toward the front brakes. Examine the Slip Ratios (dis-
played here in the SimData™ Window available in the Tools menu) for the front and rear tires when entering a braking zone: A higher negative peak
indicates that wheel lockup is imminent. When the front and rear tires reach a peak simultaneously,
the bias has been properly established. For most vehicles, optimum bias should around 60% to 70%
toward the front.

DeskTop FastLap5 & FastLapSim5 Vehicle Simulations—53
are properly proportioned to each wheel. Maximum braking for any vehicle is directly related to the physical size of the disk rotors and pads that can installed at each wheel. In FastLapSim, however, there are no limitations imposed by this real-world constraint, but keep sizing practical if you are trying to evaluate a realistic vehicle. Forward/Rear brake bias can be easily adjusted, in both FastLapSim5 and the real-world. The goal is to achieve heavy braking without tire lockup. If the rear brakes lockup first, move the bias toward the front brakes. Examine the Slip Ratios (displayed in the SimData™ Window available in the Tools menu) for the front and rear tires when entering a braking zone: A higher negative peak indicates that wheel lockup is imminent. When the front and rear tires reach a peak simultaneously, the bias has been properly established. For most vehicles, optimum bias should around 60% to 70% front bias.Brake Note �: FastLapSim5 models brake pedal and master cylinder pressures. Because of this, virtually all braking systems can be simulated accurately using the variables available in the Tire/Brake Calculator Tab.Brake Note 2: The frictional coefficient of the brake pad is dependent on its construction and composition: common materials are Organic, Metallic, and Semi-Metallic. Organic materials are commonly used in street applications. They contain asbestos, glass, and other synthetic materials. These compounds have frictional coefficients that range from 0.25 to 0.30. Fully-metallic pads were developed for high-performance applications. They offer excellent braking and resistance to high temperatures. Although some early metallic pads were so abrasive they would wear through brake drums, modern metallic pads are more practical and offer frictional coefficients between 0.30 to 0.45. Semi-metallic pads were developed to provide a compromise in performance between the limited braking potential of organic compounds and the harshness of metallic. Modern semi-metallic pads are usually asbestos-free, and offer some high-performance characteristics, however, they often fade at higher temperatures. Semi-metallics frictional coefficients range from 0.25 to 0.35. All-out competition (often carbon-fiber) brake components can generate frictional coefficients as high as 0.60.Brake Note 3: FastLapSim5 does not directly model drum brakes. While most road race vehicles use disk brakes, you can “modify” the disk parameters to simulate drum brakes:
Diameter = Use this as the inner diameter of the drum.Thickness = This is the depth of the drum.Pad area = This is the area of the shoe.Friction Coef. = The coefficient of friction of the shoe material.
This cross-reference will allow FastLapSim5 to reasonably approximate drum-brake performance.Front And Rear Anti-Roll Bar Calculators: Clicking on either calculator but-ton next to the Anti-Roll Bar drop-down menus will open an Anti-Roll Bar Calculator. Enter the dimensions of the bar and the lever-arm length, and the calculator will determine the anti-roll rate (in pounds per inch of deflection)
SUSPENSION & TIRES Category Menus

54—DeskTop FastLap5 & FastLapSim5 Vehicle Simulations
DRIVING Component Category The DRIVING com-ponent category determines the shift points, the steering reaction time, and other basic driving/driver characteris-tics.
DRIVING Category MenusAnti-Rollbar Calculator Tabs
Use the Anti-Roll Bar Calculator to determine the anti-roll rate (in pounds perinchofdeflection)forthefrontor
rear bar. This is the force generated by the difference in travel between the two
sides of the vehicle. The compressed side will transmit a force through the bar that reduces the load on the op-posite tire, producing a counter-roll
force on the body at the bar attachment point, resulting in a roll force of the opposite direction (anti-roll). Unfor-
tunately, choosing the most effective Anti-Roll-Barrateforanyspecificappli-
cation is often relegated to a trial-and-error process. Fortunately, that’s where
FastLapSim5 shines.
for a front or rear bar. The deflection force is generated by the difference in travel between the two sides of the vehicle. The compressed side will transmit a force through the bar that reduces the load on the opposite tire, producing a counter-roll force on the body at the bar attachment point. This causes the body to roll in the opposite direction (anti-roll).Anti-Roll Bar Setup: Choosing the most effective Anti-Roll-Bar rate for any specific application is often relegated to a trial-and-error process. It is easy to calculate the bar rate when the required anti-roll rate is known. Unfortunately, finding the needed roll rate is pure guesswork in most situations.
THE DRIVING CATEGORY MENUS
The DRIVING component category determines the Shift-Up and Down-Shift points, Shift Time, Steering Reaction Time, and other basic driving/driver characteristics. The menu selections and component fields are detailed below:
Driving Style: This menu offers a simple and easy way to establish Shift Rpms, Shift Time, and Steering Reaction Time. Each of the choices in this menu

DeskTop FastLap5 & FastLapSim5 Vehicle Simulations—55
DRIVING Category Menus
The Driving Style menu offers a simple and easy way to estab-
lish Shift Rpms, Shift Time, and Steering Reaction Time. Each of
the three choices in this menu (Conservative, Aggressive, and
Professional) apply unique mod-els to these variables and emulate
aspecificdrivingstyle.
Built-In Driving Style DefaultsShift RpmAccuracy
Shift RpmError Shift Time
Steering ReactionTime
Conservative Driving Style
90% 600rpm 0.250-seconds 120.0 degrees/sec
Aggressive Driving Style
95% 400rpm 0.100-seconds 240.0 degrees/sec
Professional Driving Style
98% 100rpm 0.010-seconds 260.0 degrees/sec
apply unique model to these and other variables. The models are illustrated in the Driving Style Defaults table on the page 55. The three basic Driving Style choices offer a quick way to select the variables needed to simulate most racing scenarios. Each selection directs FastLapSim5 to determine a specific Up/Down Shift Rpm (by analyzing the current engine power curve, vehicle position on the track, and other variables), the Shift Time, and the Steering Reaction Time. It is also possible to DirectClick™ on these calculated data fields and enter custom values.Shift Time: This value only applies to vehicles that use Clutch Engagement (Torque Converter transmission shift times are set to zero, since power flow to the driving wheels is not interrupted during a shift) and specifies the amount of time the driver takes to complete an up-shfit or down-shift. During the Up-Shift Time the driveline is effectively in “neutral,” sending the engine to the redline and the acceleration to zero. When the shift time has elapsed, the next gear is engaged and the vehicle continues to accelerate. During a Down-Shift Time, the driveline offers no engine braking for the length of time specified in the Shift Time field. When shift time has elapsed, the previous gear is engaged and the engine continues to offer driveline braking (or acceleration if the throttle is depressed). Shift Up/Down Accuracy and Shift Error Rpm: FastLapSim5 determines the engine speeds at which the transmission shifts into the next higher or lower gear. The simulation performs a detailed analysis that takes into consideration the position of the vehicle on the track (proximity to the next turn, etc.), whether the vehicle is braking or accelerating, the current transmission gear and ratio, the up/down shift gear ratio and resulting engine speed and vehicle braking or acceleration that would result from changing gears. This analysis is performed at each 0.001-second throughout the race. The simulation places a high priority on finding the best point on the track to down/up shift to maintain engine rpms as close to peak engine torque as possible. Because of the complexity in determining shift points, specifying the exact shift rpms are not appropriate for FastLapSim. Instead, the simulation uses the values entered in the Shift Accuracy and Shift Error Rpm fields to modify
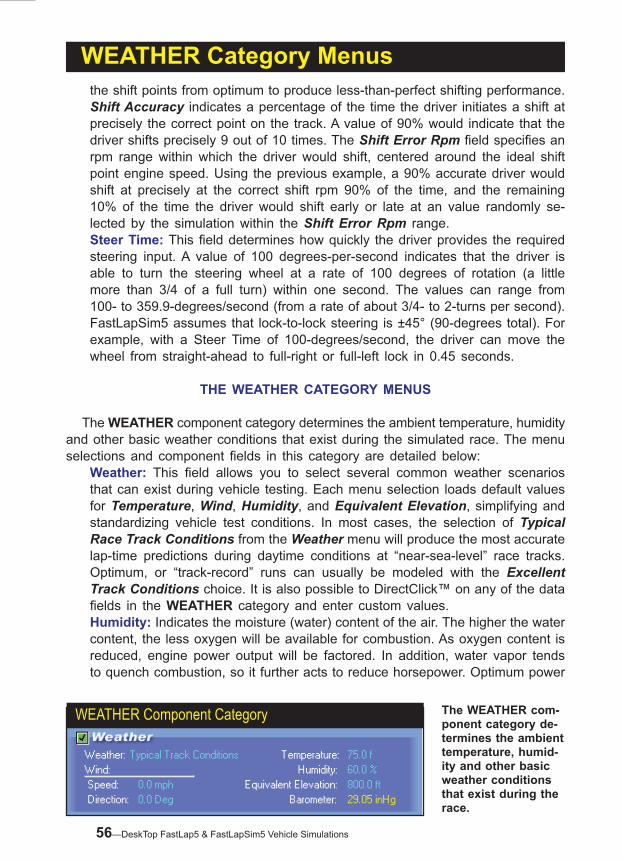
56—DeskTop FastLap5 & FastLapSim5 Vehicle Simulations
WEATHER Component Category The WEATHER com-ponent category de-termines the ambient temperature, humid-ity and other basic weather conditions that exist during the race.
WEATHER Category Menusthe shift points from optimum to produce less-than-perfect shifting performance. Shift Accuracy indicates a percentage of the time the driver initiates a shift at precisely the correct point on the track. A value of 90% would indicate that the driver shifts precisely 9 out of 10 times. The Shift Error Rpm field specifies an rpm range within which the driver would shift, centered around the ideal shift point engine speed. Using the previous example, a 90% accurate driver would shift at precisely at the correct shift rpm 90% of the time, and the remaining 10% of the time the driver would shift early or late at an value randomly se-lected by the simulation within the Shift Error Rpm range.Steer Time: This field determines how quickly the driver provides the required steering input. A value of 100 degrees-per-second indicates that the driver is able to turn the steering wheel at a rate of 100 degrees of rotation (a little more than 3/4 of a full turn) within one second. The values can range from 100- to 359.9-degrees/second (from a rate of about 3/4- to 2-turns per second). FastLapSim5 assumes that lock-to-lock steering is ±45° (90-degrees total). For example, with a Steer Time of 100-degrees/second, the driver can move the wheel from straight-ahead to full-right or full-left lock in 0.45 seconds.
THE WEATHER CATEGORY MENUS
The WEATHER component category determines the ambient temperature, humidity and other basic weather conditions that exist during the simulated race. The menu selections and component fields in this category are detailed below:
Weather: This field allows you to select several common weather scenarios that can exist during vehicle testing. Each menu selection loads default values for Temperature, Wind, Humidity, and Equivalent Elevation, simplifying and standardizing vehicle test conditions. In most cases, the selection of Typical Race Track Conditions from the Weather menu will produce the most accurate lap-time predictions during daytime conditions at “near-sea-level” race tracks. Optimum, or “track-record” runs can usually be modeled with the Excellent Track Conditions choice. It is also possible to DirectClick™ on any of the data fields in the WEATHER category and enter custom values.Humidity: Indicates the moisture (water) content of the air. The higher the water content, the less oxygen will be available for combustion. As oxygen content is reduced, engine power output will be factored. In addition, water vapor tends to quench combustion, so it further acts to reduce horsepower. Optimum power

DeskTop FastLap5 & FastLapSim5 Vehicle Simulations—57
Zero Degrees(Tail Wind)
Wind Direction:Zero Degrees Aligns With The DirectionOf Vehicle Movement At TheStart/Finish Line.
+ 45 Degrees
– 45 Degrees
WEATHER Category Menus
is produced at 0% humidity.Equivalent Elevation: This field accepts the altitude above sea level for the race simulation, assuming the barometric pressure at sea level is 29.92-inches of mercury (see note, below). As altitude is increased, the atmospheric pres-sure (called barometric pressure) decreases, reducing the oxygen available for combustion. As oxygen content is reduced, engine power output will be factored. Elevation values from -2000 feet (below sea level) to 30,000 feet (above sea level) can be used for testing.Note: The Barometric Pressure displayed in the WEATHER category is calcu-lated from Equivalent Elevation. The calculated barometric pressure and the actual barometric pressure at the race track my be quite different. This is due, primarily, to the barometric pressure at sea level varying from the assumed standard of 29.92-inches of mercury. For example, if the actual elevation of a track is 1000ft, an Equivalent Elevation of 1800ft may be required to reproduce the barometric pressure reading taken at the track at the time of the race. If the barometric pressure is known, enter an Equivalent Elevation that reproduces that same barometric pressure to obtain the most accurate simulation results.Wind Direction and Speed: This data field establishes the ambient wind con-ditions during the race. Wind conditions are used to determine overall vehicle drag and side loading. Wind Direction is relative to the starting line, regard-less of the orientation the track. A zero-degree wind direction would indicate a direct tail wind at the starting line. A 45-degree wind would blow from the left and behind. A 180-degree wind is a head wind.Wind Speed indicates the speed of the prevailing wind. Values from -200 to 200mph are permitted. Wind Speed is always assumed to be measured directly in line with wind direction.Temperature: This field accepts the ambient air temperature. In combination with the Humidity and Elevation, FastLapSim5 is able to calculate the oxygen
Wind Direction Measurement
The Wind Direction within FastLapSim5 is always measured in the direction of the start-ing line. A zero-degree Wind Direction would indicate a direct tail wind on the test vehicle
(at the starting line). A +45-degree wind would blow from the upper-left and behind. A ±�80-de-
gree wind is a head wind.

58—DeskTop FastLap5 & FastLapSim5 Vehicle Simulations
Simulation Results Setupcontent of inducted air. As oxygen content is reduced, engine power output will be factored. The Temperature field will accept -50°F to +180°F.
THE SIMULATION RESULTS SETUP SELECTIONS
The next section discusses simulation results. Options are provided in the Results Setup Dialog (select Results Setup from the Simulation pull-down menu; see photo on next page) that allow you to influence how the simulation will perform an analysis of the current vehicle components and track. Here is a short description of these options:
Data Save Interval: The items in this area modify how often results data telem-etry is saved during a simulation run.
Fixed Interval: Will save vehicle acquisition data at a fixed time interval. The box sets the amount of time that will pass between each data “snapshot.”Fixed Distance: Will save data at fixed distances. The box specifies the dis-tances for each data “snapshot.”
Simulation Optimization: When selected, Simulation Optimization performs additional calculation to optimize accuracy. Calculation times will increase when this feature is enabled. Note: This is a ProTools™ option only.Save Simulation Run Data: Enables saving telemetry data displayed in the main data-acquisition graph (in an .FLD file) along with the vehicle/track setup data (in an .FLP file). If the option is unchecked, only the vehicle/track setup data will be saved.Advanced Options box: These options adjust how the simulation will react to oversteer, understeer, wheelspin, etc. If these maximum values are exceeded during testing, the simulation will make driving adjustments so that the vehicle does not exceed these values, usually by slowing the vehicle.
Max Roll: This is the maximum amount of allowed body roll.Max Off Line: This value specifies the maximum distance that the vehicle will be allowed to deviate from the “ideal” race line. Limiting this value often limits understeer and oversteer. Yaw Tolerance: Yaw measures the difference between the direction in which the vehicle is pointing and the direction in which it is moving. Yaw Tolerance establishes how much Yaw is permitted in the simulation. A 0.0 tolerance will maintain body yaw very close to the slip-angle limits of the rear tires. A value of 1.0 (maximum value) will allow much greater yaw. In many cases, a Yaw Tolerance of 0.0 will slow lap times, while larger values may improve performance.Accuracy: This value determines the precision used to locate braking/steer-ing/acceleration points on the track. The smaller the value, the more accurate the results, but the longer the simulation will take to complete calculations.
Fast Graph Update: If the graph display “flashes” during data playback (as the reticle moves), try changing this option. Video cards respond differently, so turning Fast Update on or off may provide the cleanest display on your system.

DeskTop FastLap5 & FastLapSim5 Vehicle Simulations—59
(5) Table Selection Tab
(5) Underlying Table
(9) Pop-Up SimData™
(8) Pop-Up Lap Time
(6) Track View Display
WindowsSizeButtons
(4) Graph Options
(7) GG Diagram
(2) Underlying Results Graph
(1) Main Program Results Screen
(3) Axis Scaling (2) Results
Graphs
SIMULATION RESULTSSIMULATION RESULTS
When all the component categories have been completed (all categories have green Status Boxes) you can begin a simulation by selecting Run from the Simula-tion Drop-Down Menu. Simulation results will be displayed on fully-scalable preci-sion graphs. The default display begins at the start/finish line, marked by the left vertical axis, and continues throughout the course to conclude, once again, at the start/finish line, designated by the right vertical axis. The curves plotted on these graphs are the result of a comprehensive mathematical analysis of the forces act-ing on the vehicle, at each one-thousandth of a second, as it negotiates the turns and straights of the track. The data graphs are fully customizable and can display virtually any performance variable on any axis. Auto-scaling or manual-axis scaling are easily setup by right-clicking within any graph. And you’ll find a comprehensive “table” display of elapsed times and speeds, rpm data, times in each gear, horse-

60—DeskTop FastLap5 & FastLapSim5 Vehicle Simulations
power, torque and more. The Simulation Results displays, shown on these pages, are composed of several elements that help retrieve the most information from any simulation test. An overview of each of these elements follows:
�) The Main Program Screen is divided into three sections (called panes), with the component selection categories on the left and the result displays on the right (by default). The vertical and horizontal dividers between each pane can be moved (click-hold and drag) to increase the size of any results display to suit your requirements. The graphs will redraw and rescale to compensate for changes in display area.
Simulation Results DisplaysUpper And Lower Results Screens
Race results are displayed in top-and-bottom screen windows (called panes). The main graph is a Speed Combo Plot along with Lateral Acceleration. Note the DataZones™ within the main graph displaying vehicle speed bands (a ProTools™ feature).
Move Pane Dividers To Increase Graph DetailThe horizontal and verti-cal screen dividers can be moved to allow the graph
more display area. This screen shows the dividers
moved down and to the left to display graph data
nearly “full screen.”

DeskTop FastLap5 & FastLapSim5 Vehicle Simulations—6�
2) The main Results Graph consists of three axis, a left and right (vertical), and bottom (horizontal) axis. The upper graph displays (by default) Engine Speed (rpm), Vehicle Speed, and Lateral Acceleration. The Speed Combo Plot selected for the Y1 variable includes both vehicle speed and engine speed displayed on the left vertical axis (the curves use the same scale). The Lateral Acceleration line shows the side-force “Gs” as the vehicle travels throughout the course on the right vertical axis. A reticule line (dotted vertical indicator line) can be used to locate exact positions on the course and analyze performance data at that point. Activate the reticule by left-clicking anywhere on the graph. Click-hold and drag the reticule to any position. As you move the reticule, the Track and GG-Diagram windows remain synchronized to the reticule position. To view the exact data “under” a particular point, open the SimData™ Window (open the Tools drop-down menu and select SimData™ Window).
Note: Each graph axis can be reassigned to at least one other variable. Right-Click any graph to display the Graph Options Submenu and assign performance data to any graph axis. Y1-Data is displayed on the left vertical axis; Y2-Data is displayed on the right vertical axis, and X-Data is displayed on the horizontal axis.
3) The results graphs support several methods of Axis Scaling. Each axis will scale to Low, Medium, High, and Auto-Scale ranges. When Auto-Scaling is turned off, the axis values remain constant, establishing a fixed baseline for direct curve comparison. Small values will display near the bottom of the graph; large values will position curves near the top of the graph or even disappear beyond the top margin. On the other hand, Auto-Scaling ensures that the data curves are always visible and display at 80 to 90% of full graph height for maximum resolution. When the same units are displayed on the left and right
Simulation Results DisplaysGraphs Can Be Fully CustomizedThe results graph consists
of three axis; a left, right, and bottom (horizontal)
axis. Each of these axis can be assigned one or more
engine, vehicle, or track data variables. Right click on the graph to display the Graph
Options Submenu to as-sign variables to any graph axis (or display one of the
Speed or Rpm Combo Plots). If ProTools™ are activated, individual wheel data, such as Spring Force, Slip, etc.,
can also be graphed and analyzed.

62—DeskTop FastLap5 & FastLapSim5 Vehicle Simulations
Simulation Results Displays
vertical axis, FastLapSim5 will use “Intelligent Auto-Scaling” that maintains the same scaling for both axis (scaling values are determined by the minimum and maximum values derived from BOTH curves), making comparisons between data curves easier and more accurate.
4) Right click on the graph to open the Graph Options Submenu, then select Properties. This will open a dialog box that has allows three tabbed data
Graph Properties—Graph Data Use the Graph Data Properties dialog box to establish on-graph comparisons of up to four track/vehicle simu-lations. Activate the Multiple Document radio button, then select the comparison data from the Graph Data Sets drop-down menus.
Graph Zoom/Center/PropertiesToolBar
Track Zoom/CenterToolBar
GG-Diagram Zoom/PropertiesToolBar
Graph Zoom/Center/PropertiesToolBar
Track Zoom/CenterToolBar
GG-Diagram Zoom/PropertiesToolBar
The Results Screen ToolBar ButtonsLocated to the right of the Results Graph, three
Toolbar button groups allow quick and easy
adjustments to each of the three Results Displays. The top group controls
the Zoom, Centering, and Properties for the main
data Graph Display. The central group performs Zoom and Center func-
tions for the Track Display (lower, left), and the bot-
tom Toolbar group adjusts the Zoom and Properties of the GG-Diagram. Like
all Windows Toolbars, you can drag each of these tool pallets to any loca-
tion on the Main Program Screen. They can even be
“docked” with the main Toolbars above the Com-ponent Selection catego-
ries.
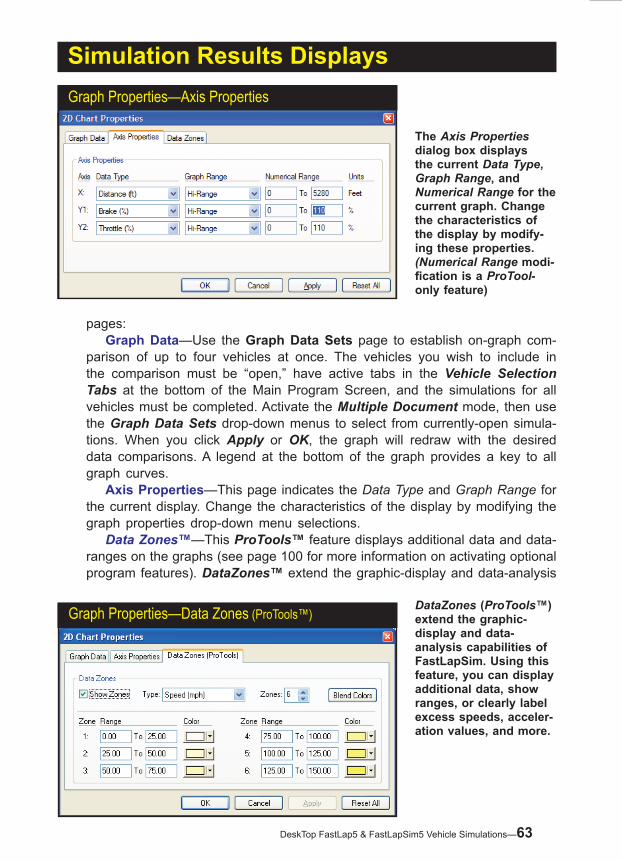
DeskTop FastLap5 & FastLapSim5 Vehicle Simulations—63
Simulation Results Displays
pages: Graph Data—Use the Graph Data Sets page to establish on-graph com-
parison of up to four vehicles at once. The vehicles you wish to include in the comparison must be “open,” have active tabs in the Vehicle Selection Tabs at the bottom of the Main Program Screen, and the simulations for all vehicles must be completed. Activate the Multiple Document mode, then use the Graph Data Sets drop-down menus to select from currently-open simula-tions. When you click Apply or OK, the graph will redraw with the desired data comparisons. A legend at the bottom of the graph provides a key to all graph curves.
Axis Properties—This page indicates the Data Type and Graph Range for the current display. Change the characteristics of the display by modifying the graph properties drop-down menu selections.
Data Zones™—This ProTools™ feature displays additional data and data-ranges on the graphs (see page 100 for more information on activating optional program features). DataZones™ extend the graphic-display and data-analysis
Graph Properties—Axis Properties
The Axis Properties dialog box displays the current Data Type, Graph Range, and Numerical Range for the current graph. Change the characteristics of the display by modify-ing these properties. (Numerical Range modi-ficationisaProTool-only feature)
Graph Properties—Data Zones (ProTools™)DataZones (ProTools™) extend the graphic-display and data-analysis capabilities of FastLapSim. Using this feature, you can display additional data, show ranges, or clearly label excess speeds, acceler-ation values, and more.

64—DeskTop FastLap5 & FastLapSim5 Vehicle Simulations
Simulation Results Displays
capabilities of FastLapSim. Using this feature, you can display additional vehicle data and/or show ranges for target values or clearly label dangerously high engine speeds, vehicle speeds, excessive aero drag, and more. To setup a DataZone display, first select the data that you would like to display from the Type drop-down menu.
Note: DataZone display variables must be the same as, or directly derived from, one of the variables currently displayed on the graph (so that it can share axis scaling). For example, you can display Speed DataZones on standard Speed Combo Plot graph since Vehicle Speed is a variable displayed on one of the axis of the graph, but Spring Force cannot be included on the Speed graph since there is no axis for pounds (Speed Combo Plots two vertical axis consist of G’s, Speed, and Engine Speed [Rpm] drawn on the speed axis).
Next, select the number of DataZones you would like to display by clicking on the “up” or “down” arrows next to the Zones field. You can modify the Range values and Colors for each zone (if you set a starting and ending color, press Blend Colors to have FastLapSim5 build a uniform transition between these colors for intermediate zones). Click on Apply or OK to draw the specified zones on the main graphic display.
5) In addition to 2D graphing capability described above, a chart (table) display is available by clicking on the Table tabs located at the bottom of both the Component Selection Category and the Results Display panes. The chart lists a variety of elapsed times, speeds, rpms, driving styles, and weather conditions recorded during the test run. In addition, the power and torque values for the current engine are displayed in 500rpm increments from 2000 to 14,500rpm.
The topmost part of the table shows the full-course race results: LapTime and Average Speed. The next data points are the Peak Vehicle Speed and Peak Engine Speed (rpm) reached during the lap. Elapsed Time In Gear Per Lap data can also be found at the top of the table. This indicates the
DataZones™ Display
This DataZone display (a ProTools™ feature) shows Lateral Acceleration bands drawn on the standard Speed Combo Plot graph. The DataZone range values are indicated on the right of the graph, and the banded blue area shows increasing force levels from 4- through 9-G’s.

DeskTop FastLap5 & FastLapSim5 Vehicle Simulations—65
Simulation Results Displays
duration of time the transmission was engaged in each gear during the lap (a combination of the acceleration and deceleration times). The two groups of data just above the Engine Power table display the Weather Conditions and the Driving Skills that were used during the lap test.
Note: If you have activated the ProTools™ features of FastLapSim5 (see page 100 for more information on optional program features), you can display a table of performance data recorded for each track segment that you define. For information on using track-segments, refer to the Track Editor, on page 69).
ProTools™ Segment Data AnalysisThe ProTools™ option also activates a comprehensive table of track segment
data. For information on how to use track segments, refer to the Track Editor Chap-
ter, page 69).
Table Shows Exact Results
In addition to 2D graphing, FastLapSim5 of-fers a table display, available by clicking the
“Table” tabs located at the bottom of the Com-ponent Screen and the Results Displays. The chart lists a variety of elapsed times, speeds, rpms, driving styles, and weather conditions recorded during the test run. In addition, the
exact power and torque values for the current engine are displayed in 500rpm increments
from 2000 to �4,500rpm.

66—DeskTop FastLap5 & FastLapSim5 Vehicle Simulations
Position Slider Control
Track View Display GG-Diagram Display
ReturnTo Starting
Line
BeginPlayback
PlaybackSpeed
Simulation Results Displays
6) The Track View Display provides an overhead view of the track and the test vehicle. The track and vehicle are drawn to scale, and the vehicle reflects the current wheelbase and wheel-track widths. Use the track View Toolbar on the right of the Main Program Screen (see page 62) to zoom in and out and center the Track. The position of the vehicle on the track is synchronized with the reticule position on the main data display (display the reticule on the data graph by left-clicking anywhere on the graph). You can move through the course in three ways: 1) Move (left-click-hold, then drag) the reticule on the data graph to any position, 2) Move the Slider Control located just above the Track View, or 3) Press the Play button just above the GG-Diagram Display (discussed next). If you use the Play feature, you can adjust playback speeds using the small slider control to the right of the Play button. The center position (default)
Track View Display And Controls
The Track View Display provides an overhead view of the track and the test vehicle. The position of the vehicle on the track is synchronized with the reticule on the main data display. Move through the course by dragging the graph reticule, moving the Position Slider, or by pressing the Play button just above the GG-Diagram Display.
Track Vehicle Representation Not only is the position of the test vehicle synchronized with the data-graph reticule, it is drawn true-to-scale, with accurate wheelbase and track widths. Press the Play button and “go for a ride” around the track in realtime. The corner-ing and braking points and speeds have been optimized by FastLapSim, based on the current component selections.

DeskTop FastLap5 & FastLapSim5 Vehicle Simulations—67
Simulation Results Displays
will playback at realtime speeds; move the slider to the left to slow playback or to the right to speedup vehicle movement faster than realtime. The small button located to the left of Play will reset the playback to the beginning of the test lap (to the Start/Finish Line). Open the SimData™ Window (discussed below) to view exact telemetry data for the current vehicle position.
7) The GG Diagram Display displays the instantaneous sum of all forces act-ing on the test vehicle recorded at every 0.001-second as the vehicle moves through the course. The sum of the forces (added using vector math) produces a total resulting force and a direction in which that force is acting. The im-age in the GG-Diagram is made up of dots, each positioned at the tip of one of these force/direction arrows. For example, if a vehicle experiences a 2-G braking force on a straight section of track, this force acts directly in line with vehicle movement (along the vertical centerline of the GG-Diagram), but it acts to reduce forward movement (the head of the arrow points down). The brak-ing force for this example would be displayed as a dot below the horizontal centerline, directly on the vertical centerline, positioned at the 2-G-ring location. The GG-Diagram displays cornering forces as dots positioned to the left or right of the vertical centerline. Acceleration is mapped as dots above the horizontal centerline. The crosshair indicator locates the single dot that represents the total force applied to the test vehicle at that instant in time. The GG-Diagram shows all of the thousands of recorded force vectors measured throughout the test lap as a scatter-diagram.
Note: The GG-Diagram is a powerful way to obtain an at-a-glance overview of vehicle performance. For a chassis that is set up well, combined with an experienced and consistent driver, the dot pattern will congregate around the “circle” of maximum tire traction. In most cases, however, the dot pattern will spread out around the diagram, but it still should show the “average” level of
GG-Diagram Display
The GG-Diagram is comprised of single dots, each representing the total force applied to the test vehicle at on instant in time. Braking forces are shown as dots below the horizontal center-line. Cornering forces map dots to the left or right of the vertical centerline, and acceleration forces fall above the horizontal centerline. The crosshair indicator locates the dot that represents the total force and its direction applied to the test vehicle at the current instant in time. In this example, the crosshair is located below the horizontal cen-terline, to the left of the vertical centerline. This indicates that the vehicle is experiencing braking and right-cornering forces with a magnitude of about �.5-G.
Acceleration
12
34
56
7
Braking
Current Forces Pointer
RightCorner
LeftCorner
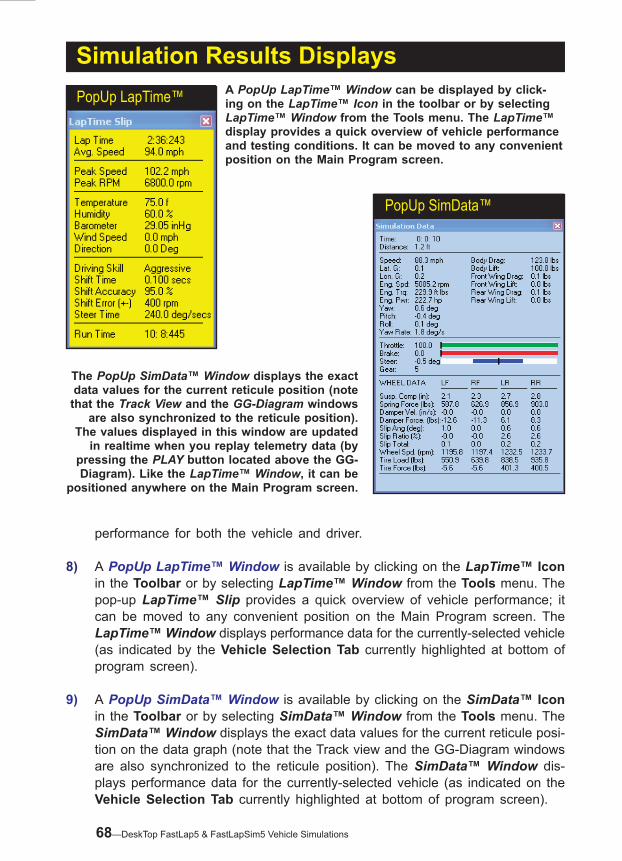
68—DeskTop FastLap5 & FastLapSim5 Vehicle Simulations
Simulation Results DisplaysPopUp LapTime™ A PopUp LapTime™ Window can be displayed by click-
ing on the LapTime™ Icon in the toolbar or by selecting LapTime™ Window from the Tools menu. The LapTime™ display provides a quick overview of vehicle performance and testing conditions. It can be moved to any convenient position on the Main Program screen.
performance for both the vehicle and driver. 8) A PopUp LapTime™ Window is available by clicking on the LapTime™ Icon
in the Toolbar or by selecting LapTime™ Window from the Tools menu. The pop-up LapTime™ Slip provides a quick overview of vehicle performance; it can be moved to any convenient position on the Main Program screen. The LapTime™ Window displays performance data for the currently-selected vehicle (as indicated by the Vehicle Selection Tab currently highlighted at bottom of program screen).
9) A PopUp SimData™ Window is available by clicking on the SimData™ Icon in the Toolbar or by selecting SimData™ Window from the Tools menu. The SimData™ Window displays the exact data values for the current reticule posi-tion on the data graph (note that the Track view and the GG-Diagram windows are also synchronized to the reticule position). The SimData™ Window dis-plays performance data for the currently-selected vehicle (as indicated on the Vehicle Selection Tab currently highlighted at bottom of program screen).
PopUp SimData™
The PopUp SimData™ Window displays the exact data values for the current reticule position (note
that the Track View and the GG-Diagram windows are also synchronized to the reticule position).
The values displayed in this window are updated in realtime when you replay telemetry data (by
pressing the PLAY button located above the GG-Diagram). Like the LapTime™ Window, it can be
positioned anywhere on the Main Program screen.

DeskTop FastLap5 & FastLapSim5 Vehicle Simulations—69
THE TRACK EDITORTHE TRACK EDITORTrack Building
ToolsTrack Building
Tools
Active Control Point(selected)Curvature
Handles
Track PositioningToolsTrack PositioningTools
Undo
Basic TrackSpecifications
Open AndSave Tracks
Open Track SetupPerform Undo
Track EditorWindow Scale
Control Points(numbered)
Track Width For Selected Point Curvature Handle Adjustments
Open Track Setup Dialog
Recalculate Raceline
THE TRACK EDITOR—AN OVERVIEW
While FastLapSim5 is a powerful simulation, the usefulness of this technology would be limited if it could only model a few dozen of the most popular tracks and courses. The Track Editor built into both DeskTop and Sim versions of FastLap5

70—DeskTop FastLap5 & FastLapSim5 Vehicle Simulations
Corner Point 1Curvature (Rev.)
Corner Point 2Curvature (Rev.)
Corner Point 1Curvature (Fwd.)
Corner Point 2Direction
Corner Point 1Direction
Corner Point 2Curvature (Fwd.)
1
2
The Track Editor
addresses this issue and makes it possible to build any track you can imagine using a what-you-see-is-what-you-get interface. Determine the radii of the turns and the length of the straightaways, then simply click the location for each Control Point on a precision background grid. The Track Editor will draw the track for you, turn by turn. After building the basic framework, use the built-in editing tools to fine tune each element of the track. When this process is complete, you’re ready to test any vehicle on the newly-built track. The Track Editor lets you create any track you can dream up, from super speedway to parking-lot autocross.
HOW IT WORKS
The Track Editor uses a drawing technique called vector graphics. Vector draw-ings define the transitions between turns and straightaways with Corner Points. Each Corner Point not only marks a transition in the track, but also it determines the initial radius (curvature) and direction of the turn. These dimensions are indi-
Building A Track By Placing Corner PointsThe Track Editor built in to FastLapSim5 allows you to
build any track you can dream up, from super speedway to
parking-lot autocross using a what-you-see-is-what-you-get
interface. The Track Editor will draw the track for you, turn by turn. After building
the basic framework, use the built-ineditingtoolstofine
tune each element of the track (note the corner radius adjust-
ment being made on Corner Point #�). When complete,
you’re ready to test any ve-hicle on the newly-built track.
Vector Graphic Drawing Elements The Track Editor uses vector graphics todefinethetransitionsbetweenturnsand straightaways. Corner Points mark a transition in the track and determines the initial radius (curvature) and direction of the turn. These dimensions are indi-cated with curvature handles; the longer the handles, the greater the radius; and the direction of the handles dictate the direction of the turn. While this technique may seem complex, after you have con-structed a few tracks, you will soon feel comfortable placing corner points and curvature handles.

DeskTop FastLap5 & FastLapSim5 Vehicle Simulations—7�
Open AndSave Tracks
Open Track SetupPerform Undo
The Track Editorcated with curvature handles; the longer the handles, the greater the radius; and the direction of the handles dictate the direction of the turn. While this technique may seem complex, after you have constructed a few tracks, you will soon feel comfortable placing corner points and curvature handles. In fact, this technique offers both high precision and easy adjustment, and building even complex tracks in the Track Editor can be accomplished quickly. You may find it helpful to read through this entire chapter before using the Track Editor. On the other hand, if you would like to “play” with the drawing tools and functions as you learn, you can either build a track from scratch or open one of the tracks supplied with FastLapSim5 and modify it by moving or adding corner points and adjusting curvature handles.
FIRST THINGS FIRST—SAVING & OPENING TRACK FILES AND THE TRACK-SETUP WINDOW
Before exploring Track Editor construction tools, two important topics need to be covered. The first is the use of File Open and Save functions available from the File drop-down menu (note: saved track files are automatically given a .TK extension and stored in the Track Files (.TK) directory). Use File Save to regularly back up your work as you build and modify tracks. Saving ensures that a backup is available if unwanted track modifications cannot be undone. While the Track Editor includes a powerful Undo function, play it safe and regularly save your work. The File drop-down menu also provides an Open File command that loads track files included with FastLapSim5 and tracks that you have created and saved. The Track Editor searches the Track files (.TK) directory (by default) for valid track files. In addition to the File Open and Save functions, there are several important Track Editor defaults that should be reviewed before you build a track. Open the Track Setup window from the Edit drop-down menu or click the Track Setup icon in the Toolbar. The following groups are available within the Track Setup dialog:
The Description Group, located at the top of the Track Setup dialog, includes
Opening And Saving Track Files (.TK)Use File Save Track to regularly back up your work. Saving ensures that a backup is avail-able if unwanted track modificationscannotbe undone. The File
drop-down menu also provides an Open File
command that loads trackfilesincludedwithFastLapSim5 and tracks
that you have created and saved.

72—DeskTop FastLap5 & FastLapSim5 Vehicle Simulations
The Track Editor Setup Dialog
Important Track Editor defaults can be found in the Track Setup window. Open the Track Setup from the Edit drop-down menu or click the Track Setup icon in the Toolbar (on the right end of the icon group). The track Segments is a Pro-Tool™ allows you to analyze vehicle entrance and exit speeds, average speeds through segments (up to 30 segments canbedefined),andotherperformancedata.
The Track Editor
two fields: 1) Text entered in the Track Name field will be displayed on the Track Editor construction screen and in the TRACK Component Category, and 2) The Description field accepts any further descriptive text (entry here is optional).
The Track Scale Group provides a slider that establishes the scale of track display from 0.1- to 50.0-feet-per-pixel (this scale can also be set easily from within the Track Editor construction window).
The Track Width Group sets the Default Width for each Corner Point added to a track, also changes the Width of any selected Corner Point. By selecting Set All Points, you can force the Track Editor to set all Corner Points on the current track to the Default Width. The Reverse Track button will reverse the order of all Corner Points and Directions, reversing the direction of vehicle movement on the track. After using this feature, you may have to fine-tune some Corner Points to reestablish correct/optimum Directions and Curvatures.Note: The Undo Tool does not undo a Reverse Track operation, however, you can apply a second Reverse Track operation to Undo the first track reversal.
The Grid Setup Group includes a slider that determines spacing between background grid lines. Set any scale from 1- to 1,000-feet per grid line. This group also includes two check boxes: 1) Click the Draw Grid box to display the background grid, and 2) Click the Snap To Grid box to force Corner Points to align with background gridlines (helpful during track construction).
The View Group includes two check boxes: 1) The Draw Filled Track box (checked by default) displays the Track as a filled-in “road,” rather than two thin guard rails, and 2) The Show Point Numbers box allows you to choose

DeskTop FastLap5 & FastLapSim5 Vehicle Simulations—73
Track Building Tools
Active Control Point(selected)
0˚
90˚
CurvatureHandles
PositionStart/Finish Line
RenumberControl Points
Undo Up ToLast 20 Actions
Basic TrackSpecifications
SelectedControl Point
Track Width
Track EditorWindow Scale
Selection Tool (Move PointsOr Change Curvatures)
Build Track Tool(Add Points In Order)
Add (+) or Remove (-)Control Point
Control Points(numbered)
CurvatureScale Values
Forward and Reverse Curvature SlidersCurvature Into (Rev) and Out Of (Fwd) Turns
Align Curvature Handles Toward Next Control PointAlign Curvature Handles
Toward Previous Control PointDirecton of Curvature Handles, Relative To Right Pointing Zero
Swap Directon of Curvature Handles
Tools For Building A TrackAn understanding of each Track Editor tool is essential to working
accuratelyandefficientlyin the Track Editor
environment. Each tool is selected by clicking an icon in the Toolbar.
As each tool is selected the appropriate icon is highlighted. Tools are organized in two main
groups. The Track Build-ing Group (shown here) and the Track Position-
ing Group (described later).
The Track Editorwhether to display sequential numbers for the Corner Points.
Finally, the Segments Group (a Sim program version feature, see Product Features on page 100) defines portions of the track as segments. Segments always begin and end at Corner Points. Once defined, a segment can be used to analyze vehicle entrance and exit speeds, average speeds, and other performance data. To activate segments, click the Show Segments box and select the number of segments with the arrows in the # Segs field. Optionally, choose a color for each segment, making it easy to visually identify segments. Up to 30 segments can be defined for each track.
TRACK EDITOR TOOLS
To quickly and accurately build and modify tracks, a thorough understanding of each Track Editor tool is essential. Each tool is selected by clicking an icon in the Toolbar located at the top of the Track Editor window. As each tool is selected the appropriate icon is highlighted. Tools are organized in two main groups. The Track Building Group contains six icons, and each performs a unique track building and/or modifying function:
The Build Track Tool is the first icon in the Track Building Group. Use this tool to build a track, Corner Point by Corner Point, in order, from scratch. Click on the construction window to place the first point. It will automatically be numbered zero. Note that when you click to locate the second point, the Track Editor will establish the direction (from the zero to the one

74—DeskTop FastLap5 & FastLapSim5 Vehicle Simulations
The Track Editorpoint) that vehicles will race on the track. As soon as you click the location of the third point (all tracks must have at least three points), the Track Editor will draw the track between all points using the default width specified in the Track Setup dialog. If you insert a Corner Point at the wrong location, either click the Undo Tool or use the Selection Tool to reposition the Point (the Undo and Selection Tools are discussed below).
The Selection Tool is used to adjust the location of Corner Point and the length and direction of their curvature handles. Click on any Corner Point to highlight the point. Click on the forward or reverse curvature handles to drag them to a new length or direction. Position the Selection Tool directly over a Corner Point to activate the move function (indicated by a four-headed cursor arrow). Left-click and drag the Corner Point to a new location. Click anywhere on the background grid to deselect all points.
The Add Point Tool will add a new Corner Point at any location. The Track Editor will insert the new Corner Point within the closest track segment. After the point has been inserted, the Add Point Tool will automati-cally deselect and the cursor will revert to the Selection Tool. If you insert a new Corner Point at the wrong location, click the Undo Tool to remove the Point (the Undo Tool is discussed below). Use the Selection Tool (described above) to fine-tune the position of the new Corner Point.
The Remove Point Tool deletes an existing Corner Point on the track. Like the Add Point Tool, the Remove Tool will automatically deselect and the cursor will revert to the Selection Tool after a Corner Point has been deleted. If you delete the wrong Corner Point, click the Undo Tool to restore the Corner Point and return the track to its previous condition.
The Reorder Points Tool is used to reorganize how the track is drawn from Corner Point to Corner Point. If the Points are in the correct location, but the track has been drawn incorrectly, the Reorder Point Tool can be used to renumber the drawing sequence. When this tool is selected, the Show Point Numbers option (available in the Track Setup dialog) is activated. Use the Reorder Tool by clicking on the last correctly ordered Corner Point; this begins a new counting sequence from that point number. Next, click on each subsequent point in the new desired order. The track will automatically redraw to the new Point numbering system. If you click on the wrong Corner Point, used the Undo Tool to restore the previous Point number, then continue reordering Corner Points. The Reorder Point Tool remains selected until you select another tool in the Track Editor.
The location of the Start/Finish Line is set using the Start/Finish Tool. Select this tool from the Toolbar and click anywhere on the track

DeskTop FastLap5 & FastLapSim5 Vehicle Simulations—75
to position the Start/Finish Line. Like the Add Point Tool, the Start/Finish Tool will revert to the Selection Tool after the Start/Finish Line has been located. If you click on the wrong location, either use the Undo Tool or, simply, use this tool again to reposition the Start/Finish line.
The next set of tools in the Track Editor Toolbar is the Track Positioning Group. This toolset contains four icons, each performing a unique track positioning/zooming function:
The Magnifying Glass Tool will zoom in or out on any portion of the track display. This tool remains selected until another tool is used. The Magnifying Glass Tool zooms-in by default and switches to a zoom-out func-tion when the Control Key is depressed. In addition, you can click and drag a selection in the Track Construction Window and the Magnifying Glass Tool will display the selected area as large as possible. To return to a standard full-track display, use the Display Full Track Tool (discussed next).
The Display Full Track Tool re-sizes the display to the horizontal or vertical margins of the track, centering the track within the window. This tool can be used with any other tool in the Track Editor Toolbar, since it does not remain selected. Using the Display Full Track Tool centers the full-track within the window and immediately returns selection to the previously active tool. To center the track around a particular Corner Point, use the Center Around Point Tool (discussed next).
The Track EditorTools For Positioning/Zooming The Track
The Track Positioning Group provides a set of four tools (the Magnify-ing Glass, Display Full
Track, Center Around Point, and the Move
Track Tool), each per-forming a unique track
positioning/zooming function.
Track Building Tools
Active Control Point(selected)
0˚
90˚
CurvatureHandles
Track Positioning Tools
Undo Up ToLast 20 Actions
Basic TrackSpecifications
SelectedControl Point
Track Width
Track EditorWindow Scale
Magnifying Glass Tool
Display Full Track Tool Center Around Pont Tool
Move Track Tool
Control Points(numbered)
CurvatureScale Values
Forward and Reverse Curvature SlidersCurvature Into (Rev) and Out Of (Fwd) Turns
Align Curvature Handles Toward Next Control PointAlign Curvature Handles
Toward Previous Control PointDirecton of Curvature Handles, Relative To Right Pointing Zero
Swap Directon of Curvature Handles

76—DeskTop FastLap5 & FastLapSim5 Vehicle Simulations
The Center Around Point Tool provides an easy way to position any selected Corner Point in the middle of the construction window. This allows easier Curvature-Handle and Corner-Point adjustments. To use this tool, first select any Corner Point on the track (using the Selection Tool), then click on the Center Around Point Tool, and the track will be repositioned so that the selected Point appears in the center of the construction window (at current magnification). Like the Display Full Track Tool, this tool can be used with any other tool in the Track Editor Toolbar, since it does not remain selected. Using the Center Around Point Tool centers the track around the selected Corner Point and immediately returns selection to the previously active tool.Note: If no Corner Point is selected when this tool is activated, the track will be centered in the display window at the current magnification.
The Move Track Tool (represented by a hand) “grabs” the track and lets you to position it anywhere within the Track Editor construction win-dow. The tool is activated by clicking the Move Track Tool icon, then holding the left mouse button depressed while you drag the track to a new location. The Move Track Tool remains at selected until another tool is chosen.
One of the most important tools in the Track Editor Toolbar is the Undo Tool. This tool will undo any operation performed by any of the above tools. Clicking the Undo Tool multiple times will undo up to the last 20 changes made in the track display. Using this tool, along with regular File Save operations (see page 71), will minimize the likelihood of loosing any work that you’ve invested in
The Track Editor
Tools For Performing Other FunctionsA third set of tools is performs “other”
functions. These two tools include Calculate Raceline that displays
the optimum driving path that vehicles try to
maintain on the track, and the Track Setup
Dialog that provides a convenient shortcut to the Track Setup Dialog
window (where you can set several track-building
default values).
Track Building Tools
Active Control Point(selected)
0˚
90˚
CurvatureHandles
Track Positioning ToolsOther Functions
Open Track Setup DialogUndo Up To
Last 20 Actions
Basic TrackSpecifications
SelectedControl Point
Track Width
Track EditorWindow Scale
Recalculate Raceline
Control Points(numbered)
CurvatureScale Values
Forward and Reverse Curvature SlidersCurvature Into (Rev) and Out Of (Fwd) Turns
Align Curvature Handles Toward Next Control PointAlign Curvature Handles
Toward Previous Control PointDirecton of Curvature Handles, Relative To Right Pointing Zero
Swap Directon of Curvature Handles

DeskTop FastLap5 & FastLapSim5 Vehicle Simulations—77
The Track Editor
building and modifying track files.
The final set of tools in the Track Editor Toolbar are located in the Other Func-tions Group. The two icons include Calculate Raceline that determines the optimum driving path that vehicles try to maintain on the track, and the Open Track Setup Dialog that provides a convenient shortcut to the Track Setup Dialog window (see page 71):
Calculate Raceline performs one of the most complex functions within FastLapSim. An ideal raceline will allow the car to accelerate as soon and as long as possible, brake as late as possible, and traverse a corner at the largest possible radius. FastLapSim5 uses two techniques to derive this solution. First, a raceline is approximated by a series of points, at which the curvatures or corner radii are calculated and default lanes (several possible paths across the track) are assigned. The next step iterates lane assignments (performs multiple tests) modifying paths and recalculating the curvatures until the most linear (shortest) path through the track has been found. Once this path is computed, the theoretical maximum speed through each point is determined, assuming speed is limited by peak tire grip. When this step is complete, a new series of calculations analyze the computed speeds and radii to determine where braking should begin. The last computation cycle uses a Gradient De-scent technique to optimize the calculated path. As this is performed, the path is modified slightly, and the lap times are estimated. If the new path proves to be an improvement, its specifications are retained, if it is not the quickest path through the track, the entire process is repeated until there is a convergence upon an optimal path. Raceline calculation requires millions of mathematical operations, however, it only requires about two seconds of calculation time on 1GHz or faster processors.
Calculate Raceline
The Calculate Raceline tool per-forms one of the most complex functions within FastLapSim. An ideal raceline allows the vehicle to accelerate as soon and as long as possible, brake as late as possible, and traverse a corner at the largest possible radius. The raceline is displayed as a green path on the track.

78—DeskTop FastLap5 & FastLapSim5 Vehicle Simulations
Track Setup opens the Track Setup Window used to establish several important Track Editor defaults. See page 71 for a complete description of the Track Editor Setup window.
BUILDING YOUR FIRST TRACK
The next section in this chapter provides an in-depth look at the complete pro-cess of building a complex track using the Track Editor. However, if you have never used the Track Editor, we recommend that you review the following step-by-step procedures for building a simple track. This tutorial will help you become familiar with basic track-editing tools, and the experience you gain here will help you tackle more complex track construction projects (like the Portland International Raceway Track constructed in the next section). The following steps will detail process of constructing a simple Tri-Oval track. For the purposes of this tutorial, the dimensions of any real-world track are not duplicated, rather the intention is to focus on the construction process and using specific tools in the Track Editor. It is not important that the track you build look exactly like the one illustrated on these pages. However, despite any differences that might exist, your Tri-Oval track should be fully usable within FastLapSim5 to test any vehicle.Note: This section assumes that you have read the previous information in this chapter on the basic tools provided in the Track Editor. If you are not familiar with this material, we encourage you to refer to this information if you are uncertain about the function of any tool used in this tutorial.
The Track Editor
Building Your First Track: Step 1Open the Track Editor by either selecting Track Editor from the Tools drop-down
menu or by clicking the Editor button in the Track Component Category. At this
point you should see an empty Track Editor window on your screen.

DeskTop FastLap5 & FastLapSim5 Vehicle Simulations—79
Build Track Tool
Click FirstPoint Here (4,7)
Click SecondPoint Here (6,4)
Track Is Drawn WhenThird Point Is Placed
Click ThirdPoint Here (4,6)
The Track EditorBuilding Your First Track: Step 2
Open the Track Setup window by select-ing the Track Setup icon in the Toolbar
or by choosing Track Setup from the Edit drop-down menu. The defaults displayed in this window establish the basic setup
for the Tri-Oval track we are about to build. Set your dialog box to match these
values, including a Track Width of 80 feet.
Building Your First Track: Step 3 Activate the Build Track Tool by click-ing on the small hammer located in the Toolbar. Place (by clicking) three Corner Points, in order, as described in the text. When you place the third Corner Point, the track editor will draw a track connect-ing these points. If the track doesn’t look similar to this photo, click on the Undo Tool (multiple times if necessary) and reposition the three points.
Step �: If necessary, start FastLapSim5 and open the Track Editor by either selecting Track Editor from the Tools drop down menu or by clicking the Edi-tor button in the Track Component Category. If a track is visible in the Track Editor construction window, select New Track from the File drop down menu. At this point, you should have an empty Track Editor window displayed on your screen.
Step 2: Open the Track Setup window by selecting the Track Setup icon in the Toolbar or by choosing Track Setup from the Edit menu. Set the values

80—DeskTop FastLap5 & FastLapSim5 Vehicle Simulations
Corner Point Zero
Selection Tool
Press Match Rev ToOrient Point Direction
Drag CurvatureHandle To A LengthOf 700, Or Enter 700In The ForwardCurvature Field (below)
700 ForForward Curvature
for the Tri-Oval track we are about to build to match those in the Step-2 photo, including a Track Width of 80 feet.
Step 3: Activate the Build Track Tool by clicking on the small hammer located in the Toolbar. Place (by clicking) three Corner Points, in order, as described below. Start with Point 0 and locate it about 4 grid lines from the left and about 7 grid lines from the top. Place the second Point (Point Numbered 1) about 6 grid lines from the left and 4 grid lines from the top. Next, place the third Point
The Track Editor
Build Track Tool
Click FifthPoint Here (13, 4)
Click SixthPoint Here (13, 4)
Click FourthPoint Here (7,4)
Building Your First Track: Step 4
Building Your First Track: Step 5Adjusting the Corner Points will smooth transitions from the straightaways into
the turns. Zoom in to the Corner Point #0, and activate the Selection Tool. Highlight the Corner Point by clicking on the small
square next to the Point number. Next, drag the forward curvature handle (with
the red square) to a length of 700, or enter 700 directly in the Forward Curva-
ture Scale box, also located in the Control Point Data area. This will increase the
curve radius. Now, click on the Match Rev button to align the Corner Point direction with the previous Corner Point (Point 5).
At this point, your track should look simi-lar to this photo. If it doesn’t, click on the
Undo Tool (multiple times if necessary) and repeat the procedures in Step 5.
Use the Build Track Tool to continue add-ing points to the track. When all points have been placed, the track should look similar to this photo.
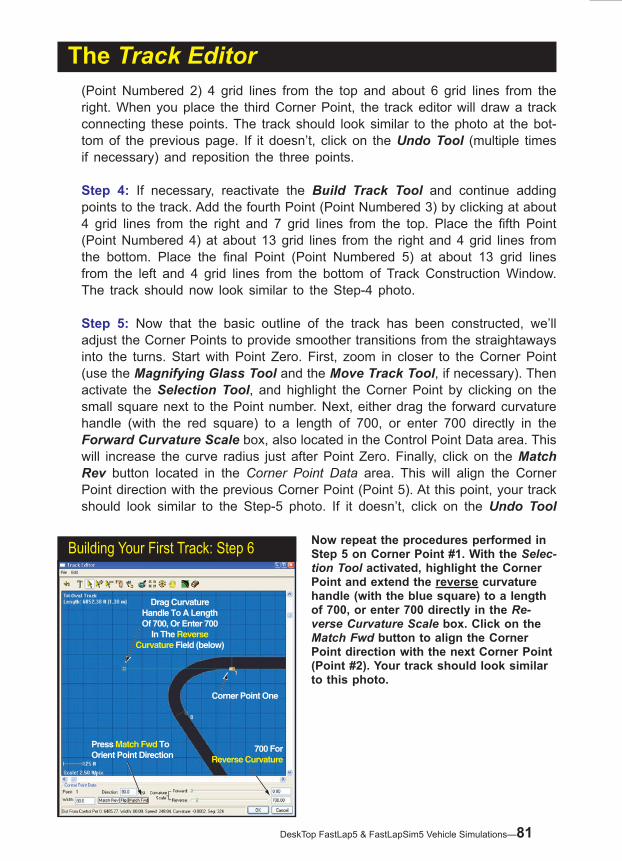
DeskTop FastLap5 & FastLapSim5 Vehicle Simulations—8�
The Track Editor(Point Numbered 2) 4 grid lines from the top and about 6 grid lines from the right. When you place the third Corner Point, the track editor will draw a track connecting these points. The track should look similar to the photo at the bot-tom of the previous page. If it doesn’t, click on the Undo Tool (multiple times if necessary) and reposition the three points.
Step 4: If necessary, reactivate the Build Track Tool and continue adding points to the track. Add the fourth Point (Point Numbered 3) by clicking at about 4 grid lines from the right and 7 grid lines from the top. Place the fifth Point (Point Numbered 4) at about 13 grid lines from the right and 4 grid lines from the bottom. Place the final Point (Point Numbered 5) at about 13 grid lines from the left and 4 grid lines from the bottom of Track Construction Window. The track should now look similar to the Step-4 photo.
Step 5: Now that the basic outline of the track has been constructed, we’ll adjust the Corner Points to provide smoother transitions from the straightaways into the turns. Start with Point Zero. First, zoom in closer to the Corner Point (use the Magnifying Glass Tool and the Move Track Tool, if necessary). Then activate the Selection Tool, and highlight the Corner Point by clicking on the small square next to the Point number. Next, either drag the forward curvature handle (with the red square) to a length of 700, or enter 700 directly in the Forward Curvature Scale box, also located in the Control Point Data area. This will increase the curve radius just after Point Zero. Finally, click on the Match Rev button located in the Corner Point Data area. This will align the Corner Point direction with the previous Corner Point (Point 5). At this point, your track should look similar to the Step-5 photo. If it doesn’t, click on the Undo Tool
Corner Point One
Press Match Fwd ToOrient Point Direction
Drag CurvatureHandle To A LengthOf 700, Or Enter 700
In The ReverseCurvature Field (below)
700 ForReverse Curvature
Now repeat the procedures performed in Step 5 on Corner Point #�. With the Selec-tion Tool activated, highlight the Corner Point and extend the reverse curvature handle (with the blue square) to a length of 700, or enter 700 directly in the Re-verse Curvature Scale box. Click on the Match Fwd button to align the Corner Point direction with the next Corner Point (Point #2). Your track should look similar to this photo.
Building Your First Track: Step 6

82—DeskTop FastLap5 & FastLapSim5 Vehicle Simulations
Perform The Same OperationTo The Other Corner Points
CalculatedRaceline
Calculate Raceline Tool
Use the same procedures described in the last two steps to adjust the curvature scales for points 2, 3, 4 and 5 to 700-feet. Remember to apply curvature to the handles that face into the turn, and align and Corner Point directions with their adjacent straightaways. After adjusting all the Corner Points, click the Calculate Raceline Tool. A smooth green raceline should be displayed within the track. If there are any “strange” wiggles or bumps, one or more of the Corner Point handles are pointing in the wrong direc-tion.Whenyouhavefinished,yourtrackshould look like this.
Building Your First Track: Step 7
The Track Editor
(multiple times if necessary) and repeat the procedures in this step.
Step 6: In this step, we will repeat procedures performed in Step 5 on Corner Point One. With the Selection Tool activated, highlight Corner Point One by clicking on the small square next to the number. Next, extend the reverse cur-vature handle (with the blue square) to a length of 700, or enter 700 directly in the Reverse Curvature Scale box. Now, click on the Match Fwd button to align the Corner Point direction with the next Corner Point (Point 2). Your track should look similar to the Step-6 photo, and the turn should offer a much smoother transition from and to the adjacent straightaways.
Step 7: The track is taking shape. This step applies similar curvature adjust-ments to the remaining Corner Points. Use the same procedures described in the last two steps to adjust the curvature scales for points 2, 3, 4 and 5 to 700. Remember to apply the curvature to the handles that face into the turn, and align and Corner Point directions with their adjacent straightaways. After adjusting all the remaining Corner Points, click on the Calculate Raceline Tool. A smooth green raceline should be displayed within the track. If there are any “strange” wiggles or bumps in the raceline, it is probably due to one or more of the Corner Point handles pointing in the wrong direction. When you have finished, your track should look similar to the Step-7 photo.
Step 8: All that remains is saving the track (use the File drop-down menu), closing the Track Editor by clicking the OK button, and using your new track in the next simulation run. The photo in Step-8 shows the results of running a simulation on the Tri-Oval track. The vehicle is a hot Mustang.

DeskTop FastLap5 & FastLapSim5 Vehicle Simulations—83
The Track Editor
Step 9: Now that we’ve covered the basics of building a track, try modifying the simple Tri-Oval by adding S-turns, changing the curvature of one or more Corner Points, or changing track width and determining their effects on raceline calculation and simulation results. Review the Track Editor tools described on pages 73 to 77, and experiment with each one. After you build a couple of additional “simple” tracks, you’ll be ready to model an real-world track in the Track Editor (the subject of the next section).
BUILDING A REAL-WORLD RACETRACK IN THE TRACK EDITOR
A track can be completely free-form, representing no real-world track, such as the Tri-Oval used in the previous example. Or you can choose to model a track based on actual racetrack. Duplicating a real-world track in the Track Editor can, at first, seem a daunting challenge. However, taken one step at a time, the job can be reduced to a series of relatively simple steps. Regardless of the track, the building process consists of these ten basic steps:
�) Locate or draw an “overhead view” map of the track.2) Pick an arbitrary origin point for all measurements (a convenient origin
point is often the center of the area bounded by the track).3) Place Corner Points on a track map.4) Measure X,Y coordinates of all Corner Points relative to origin.5) Scale X,Y coordinates from the map measurements to full-scale (real-
world) dimensions.
All that remains is sav-ingthetrackfile(.TK)andclosing the Track Editor. Use your new track in the next simulation run. Here are the results of running a simulation on the newly-constructed Tri-Oval track. The test vehicle is a hot Mustang.
Building Your First Track: Step 8

84—DeskTop FastLap5 & FastLapSim5 Vehicle Simulations
6) Set a Default Width for the track in the Track Setup window.7) Build the track by placing the full-scale Corner Points in the Track
Editor window; add Points in the direction of vehicle movement.8) Zoom In and adjust Corner Point locations and Curvature Handles.9) Adjust trackwidths, if necessary, andfine tuneall points.�0) Set the Start/Finish line location.
Step �: Locate Or Draw A Track Map
In this section, we will detail the process of building a replica of an existing track: Portland International Raceway (PIR). To make this process substantially easier we are using a detailed drawing of the Raceway. This drawing was compiled from published sketches and track data. Since this drawing was made to scale (300-feet = 1-inch), it will further simplify duplicating this layout. A table is included with corner radii and straightaway lengths, although this data is not needed to build a track in FastLapSim. Unfortunately, most published maps will not provide this level of detail. However, always try to obtain an overhead track map, aerial photo, or any other descriptive data of the track before you attempt modeling in the Track Editor. Having this information handy will save you considerable frustration.
Step 2: Preparing The Map
In order to extract the Control Point locations from the drawing, some preparation is necessary. First an origin from which all points are measures must be chosen. The origin point always has the X,Y coordinates of 0,0, meeting that all points are measured relative to this point in both horizontal and vertical directions. You can place the origin anywhere on the map you like; it really doesn’t matter. What does matter is that all the Corner Points on the track are measured from this point. The following assumptions always apply to measurements made from the origin-point:
The Track Editor
Thefirststepinbuild-ing a real-world racetrack in the Track Editor is to base your “construction work” on a detailed draw-ing of the Raceway. This drawing was compiled from published sketches and track data (scale is 300-feet = �-inch). Always try to obtain an overhead track map, aerial photo, or any other descriptive data of the track before you attempt modeling in the Track Editor.
A Basic Track Map

DeskTop FastLap5 & FastLapSim5 Vehicle Simulations—85
Any point to the left of the origin will have a negative X coordinate.Any point to the right of the origin will have a positive X coordinate.Any point above the origin will have a positive Y coordinate,Any point below the origin will have a negative Y coordinate.
These assumptions establish a uniform way to enter Control Point measurement data into the Track Editor. Since the origin within the Track Editor Construction Window is positioned in the center of the screen, an origin point location that matches the Track Editor makes Control Point data entry a bit more straightforward. However, an origin point located elsewhere (e.g., in the upper-left corner of the track map, the default location when using Windows Paint® to help you perform map measure-ments, as described below) really won’t complicate data-point entry in the Track Editor and will produce the same results. The entire measurement and data-entry process will become clear as you follow along with this tutorial.
Step 3: How To Position Corner Points
With an origin selected (we’ve chosen the approximate center of the area bounded by the track, as shown in the drawing, below), we’ll begin to locate Corner Points on the track. Corner Points are places where track curvature changes, in other words,
We have selected an origin (the double-X in the center of the track) from which to mea-sure all points on the track. Corner Points are located where track curvature changes: whereturnsbegin,end,orwherethereisasignificantchangeinturnradius.Theexcep-tion is Corner Point #�; it marks the Start/Finish line (it is not required).
Preparing The Track Map & Locating Corner Points
The Track Editor

86—DeskTop FastLap5 & FastLapSim5 Vehicle Simulations
where turns begin, end, or where there is a significant change in turn radius. In the case of the PIR Raceway, we’ll arbitrarily place the first Corner Point (point #0) at the start of the main straightaway. This is the location where the last, shal-low turn ends and the straightaway begins. We’ll place the second Corner Point (point #1) at the Start/Finish line. While there is no curvature change at this point, it simply acts as a marker and is entirely optional.Note: In almost all cases, curvature transitions in the track must have Corner Points positioned at the beginning and end of transitions, however, Corner Points can also be used as “markers,” placed anywhere on the track. But use marker points spar-ingly, since they can produce unwanted changes in track shape, and extraneous Corner Points will slow down simulation calculations. The third Corner Point (point #2) is positioned at the end of the straightaway, where the track begins a sharp 90-degree turn (called C1). The next Corner Point (point #3) is located exactly where this 90-degree corner ends, beginning a very short straight (called B). The next Corner Point (point #4) is positioned just at the start of the 100-degree corner (called C2). The next point (point #5) marks the end of this same corner as it terminates into a straightaway (called C). Using this same technique, continue placing Corner Points throughout the remainder of the track as shown in the illustration on page 85). There are a few Corner-Point positions (Points #14, #18, and #21) that require some additional explanation. At first it may look like Point #14 is accidentally placed within the turn marked by Points #13 and #15. However, at Point #14, the track transitions from a corner radius to a very short, nearly-straight section, then bends to the left at Point #15. While it is not absolutely necessary to place a point here, the track will be most accurately modeled if this slight change in curvature and short “straight” section is properly modeled. A similar situation exits at Point #18. Here the right turn has two distinct radii, a shallow entrance, then a tighter (smaller radius) section between Points #18 and #19. A Corner Point is required at Point #18 to model this changing radius. A different situation exists at Point #21. This point act as BOTH the termination of turn 5A and the beginning of the large, sweeping, right-hand turn 6. Since there is no straight section of track between these turns, and one turns blends smoothly into the other (like the transition between turns 7 and 8), only a single Corner Point is needed to “identify” the change in curvature.
Step 4: Measuring Corner Point X,Y Locations
When all of the Corner Points have been placed on the track map, the next step
The Track EditorWhen all of the Corner Points have been placed on the track map, measure the
distances from the Corner Points to the origin point. Here are all of the Corner Point location measurements for PIR Raceway. We scanned the drawing into a graphics ed-iting program (Photoshop®), set the “zero point” for the ruler on the track origin point,
and simply read the distances to all Corner Points from the Info Box in the program (see photo on page 88).
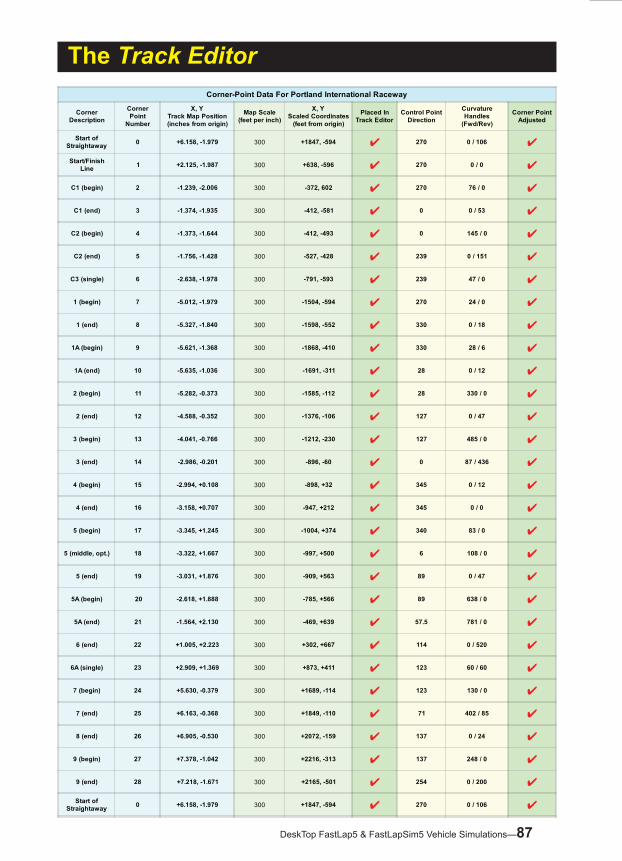
DeskTop FastLap5 & FastLapSim5 Vehicle Simulations—87
The Track EditorCorner-Point Data For Portland International Raceway
CornerDescription
CornerPoint
Number
X, YTrack Map Position(inches from origin)
Map Scale(feet per inch)
X, YScaled Coordinates
(feet from origin)
Placed InTrack Editor
Control PointDirection
CurvatureHandles
(Fwd/Rev)
Corner PointAdjusted
Start ofStraightaway 0 +6.�58, -�.979 300 +�847, -594 ✔ 270 0 / �06 ✔
Start/FinishLine � +2.�25, -�.987 300 +638, -596 ✔ 270 0 / 0 ✔
C� (begin) 2 -�.239, -2.006 300 -372, 602 ✔ 270 76 / 0 ✔
C� (end) 3 -�.374, -�.935 300 -4�2, -58� ✔ 0 0 / 53 ✔
C2 (begin) 4 -�.373, -�.644 300 -4�2, -493 ✔ 0 �45 / 0 ✔
C2 (end) 5 -�.756, -�.428 300 -527, -428 ✔ 239 0 / �5� ✔
C3 (single) 6 -2.638, -�.978 300 -79�, -593 ✔ 239 47 / 0 ✔
� (begin) 7 -5.0�2, -�.979 300 -�504, -594 ✔ 270 24 / 0 ✔
� (end) 8 -5.327, -�.840 300 -�598, -552 ✔ 330 0 / �8 ✔
�A (begin) 9 -5.62�, -�.368 300 -�868, -4�0 ✔ 330 28 / 6 ✔
�A (end) �0 -5.635, -�.036 300 -�69�, -3�� ✔ 28 0 / �2 ✔
2 (begin) �� -5.282, -0.373 300 -�585, -��2 ✔ 28 330 / 0 ✔
2 (end) �2 -4.588, -0.352 300 -�376, -�06 ✔ �27 0 / 47 ✔
3 (begin) �3 -4.04�, -0.766 300 -�2�2, -230 ✔ �27 485 / 0 ✔
3 (end) �4 -2.986, -0.20� 300 -896, -60 ✔ 0 87 / 436 ✔
4 (begin) �5 -2.994, +0.�08 300 -898, +32 ✔ 345 0 / �2 ✔
4 (end) �6 -3.�58, +0.707 300 -947, +2�2 ✔ 345 0 / 0 ✔
5 (begin) �7 -3.345, +�.245 300 -�004, +374 ✔ 340 83 / 0 ✔
5 (middle, opt.) �8 -3.322, +�.667 300 -997, +500 ✔ 6 �08 / 0 ✔
5 (end) �9 -3.03�, +�.876 300 -909, +563 ✔ 89 0 / 47 ✔
5A (begin) 20 -2.6�8, +�.888 300 -785, +566 ✔ 89 638 / 0 ✔
5A (end) 2� -�.564, +2.�30 300 -469, +639 ✔ 57.5 78� / 0 ✔
6 (end) 22 +�.005, +2.223 300 +302, +667 ✔ ��4 0 / 520 ✔
6A (single) 23 +2.909, +�.369 300 +873, +4�� ✔ �23 60 / 60 ✔
7 (begin) 24 +5.630, -0.379 300 +�689, -��4 ✔ �23 �30 / 0 ✔
7 (end) 25 +6.�63, -0.368 300 +�849, -��0 ✔ 7� 402 / 85 ✔
8 (end) 26 +6.905, -0.530 300 +2072, -�59 ✔ �37 0 / 24 ✔
9 (begin) 27 +7.378, -�.042 300 +22�6, -3�3 ✔ �37 248 / 0 ✔
9 (end) 28 +7.2�8, -�.67� 300 +2�65, -50� ✔ 254 0 / 200 ✔
Start ofStraightaway 0 +6.�58, -�.979 300 +�847, -594 ✔ 270 0 / �06 ✔

88—DeskTop FastLap5 & FastLapSim5 Vehicle Simulations
Distance Indicator In Inches From Center-Of-Track Origin In (X,Y) Coordinates
Origin Point
is to measure the distances from the Corner Points to the origin point (the location of the origin point was discussed earlier, see page 84). Remember, regardless of the Corner Point locations, the following assumptions always apply to origin-point measurements: 1) Corner Points to the left of the origin have -X values, 2) Points to the right of the origin have +X values, 3) Corner Points above the origin have +Y values, and 4) Points below the origin have -Y values. The nearby table lists all of the Corner Point location measurements for PIR Raceway measured relative to the origin point shown on the track drawing. For example, Corner Point #23 is located above and to the right of the origin point, meaning that its X and Y values will both be positive (refer to the photo on page 85). Corner Point #23 lies 2.909-inches to the right and 1.369-inches above the origin. So the X,Y coordinate for Point #23 is (+2.909, +1.369), note this value has been recorded in the table for Point #23.
Note: You may ask how this distance can be measured so accurately. There are precision measuring instruments, like digital calipers, that can perform this function, however, if you have access to a scanner and computer, you can let the computer do the “hard work” for you. Scan the drawing and display it in a graphics editing program (Photoshop® is an awesome tool for measuring distances, but the free Win-dows Paint® program also works fine—find Paint in the Start/Accessories submenu). These programs, and others like them, often have a way to measure how many units (inches, pixels, etc.; the units don’t matter) one point is located from another. Simply set your origin point, or use the default origin point in the program, and measure the distances, in (X,Y) coordinates from the origin to each Corner Point and record it in a table. If you cannot scan the track map into a computer or use a graphics program to help measure Corner Point distances, draw gridlines on the track map to aid measuring X and Y coordinates of any point on the track.
The Track Editor
While you can use preci-sion measuring instruments, like digital calipers, if you have access to a scanner and computer, you can let the computer do the “hard work” of precisely measuring track map distances. Scan the drawing and display it in a graphics editing program (like Paint™ or Photoshop™). Set your origin point and measure the distances, in (X,Y) coordinates, from the origin to each Corner Point.
Measuring The Track Map In Photoshop®
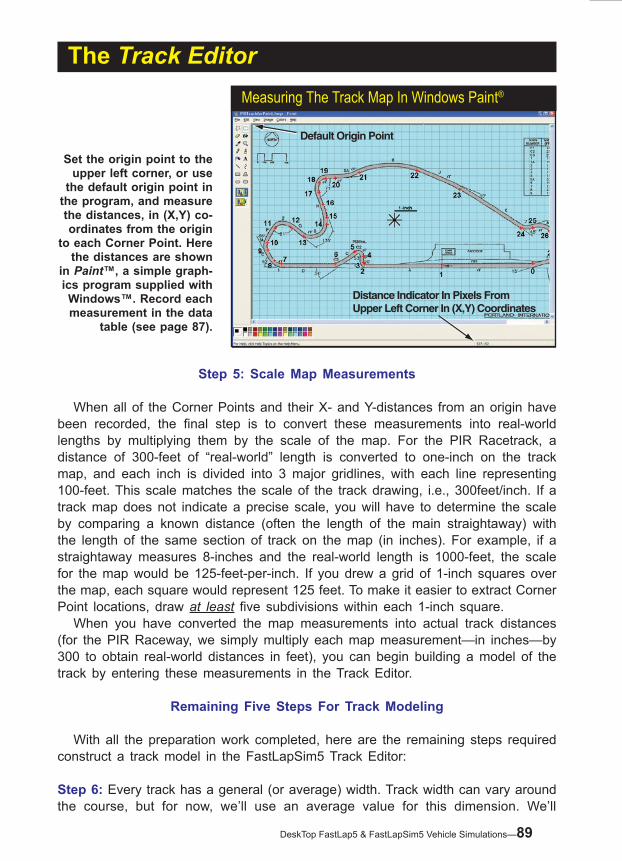
DeskTop FastLap5 & FastLapSim5 Vehicle Simulations—89
Distance Indicator In Pixels FromUpper Left Corner In (X,Y) Coordinates
Default Origin Point
The Track Editor
Step 5: Scale Map Measurements
When all of the Corner Points and their X- and Y-distances from an origin have been recorded, the final step is to convert these measurements into real-world lengths by multiplying them by the scale of the map. For the PIR Racetrack, a distance of 300-feet of “real-world” length is converted to one-inch on the track map, and each inch is divided into 3 major gridlines, with each line representing 100-feet. This scale matches the scale of the track drawing, i.e., 300feet/inch. If a track map does not indicate a precise scale, you will have to determine the scale by comparing a known distance (often the length of the main straightaway) with the length of the same section of track on the map (in inches). For example, if a straightaway measures 8-inches and the real-world length is 1000-feet, the scale for the map would be 125-feet-per-inch. If you drew a grid of 1-inch squares over the map, each square would represent 125 feet. To make it easier to extract Corner Point locations, draw at least five subdivisions within each 1-inch square. When you have converted the map measurements into actual track distances (for the PIR Raceway, we simply multiply each map measurement—in inches—by 300 to obtain real-world distances in feet), you can begin building a model of the track by entering these measurements in the Track Editor.
Remaining Five Steps For Track Modeling
With all the preparation work completed, here are the remaining steps required construct a track model in the FastLapSim5 Track Editor:
Step 6: Every track has a general (or average) width. Track width can vary around the course, but for now, we’ll use an average value for this dimension. We’ll
Set the origin point to the upper left corner, or use
the default origin point in the program, and measure the distances, in (X,Y) co-ordinates from the origin
to each Corner Point. Here the distances are shown
in Paint™, a simple graph-ics program supplied with Windows™. Record each measurement in the data
table (see page 87).
Measuring The Track Map In Windows Paint®

90—DeskTop FastLap5 & FastLapSim5 Vehicle Simulations
X and YDistances From The
Origin Point
leave adjusting widths for the “fine-tuning” steps to come. The drawing on page 85 shows that the average width of PIR Raceway is about 60 feet. Enter 60-feet into the default Width Field in the Track Setup Window (see page 71 for more information on the Track Setup screen). Choose OK to return to the Track Editor construction window.
Step 7: Now we can start creating the track in the Track Editor (remember to Save your work periodically). Start off by centering the work area in the Track Editor construction window by clicking on the Center Track Tool, then select the Build Track Tool from the Toolbar (the hammer icon). This tool will place Corner Points consecutively, and it is this sequential order that determines the direction of vehicle movement on the track. Make sure that each point you place follows consecutively along the track.Note: You may find it helpful to place Corner Points that locate the main straight-away first, as we did on the Track Map. Since the straightaway is often one of the largest objects in the track, it forms an visual reference from which to place the remaining Corner Point locations (although this technique is not required; you can start with any Corner Point in the Track Editor). The first Corner Point we’ll place for PIR Raceway will fix the start of the main straightaway. Lookup the real-world coordinates for that point in the data table. The point location is: (+1847, -594). This means that the point is located 1847-feet to the right and 594-feet down from the origin point (the center of the construction window). Move the Build Track Tool within the Track Editor window and review the location of the tool, relative to the Track Editor origin point, by the numbers dis-played in the Status Line. The X and Y values are displayed in feet from the origin. Move the Build Tool until approximately X: 1847, Y: 594 is displayed (it doesn’t have to be exact, we’ll adjust the points when we zoom in later). If these points
The Track Editor
Use the Build Track Tool within the Track Editor window and review the location of the tool, relative to the Track Editor origin point, by the numbers displayed in the Status Line. The X and Y values are displayed in feet from the origin. Move the Build Tool until approximately X: 1847, Y: -594 is displayed (it doesn’t have to be exact, we’ll adjust the points when we zoom in later).
Track Editor X and Y Position In Status Line

DeskTop FastLap5 & FastLapSim5 Vehicle Simulations—9�
The Track Editor
are not located within the construction window, click on the Up and Down or Left and Right arrows at the ends of the scroll bars to move the “ground” in the Track Window until the coordinates are visible (click on the Windows Maximize button to display the Track Editor full screen and present the largest displayable construction area). When you are reasonably close to the coordinates, click the left mouse but-ton once. A single point will be placed. Continue placing points in order. When you place the third point, the Track Editor will draw a connecting track between each point (three points, at minimum, are required to define any track). Continue placing
AfteryouhaveplacedthefirstCornerPoint, continue placing points in order.
When you place the third point, the Track Editor will draw a connecting track be-tween each point (three points, at mini-mum,arerequiredtodefineanytrack).
Placing Three Corner Points
Continue placing Points, in order, until you have created Corner Points at all measured locations on the track. The track should look similar to the Track Map, ex-cept that the corners will be too “square.” If, while you are placing points, you click in the wrong location, simply click the Undo Tool and re-place that point. When you have placed all Corner Points, de-select the Build Track Tool by clicking on the Selection Tool. Your Track Editor screen should look like this.
All Corner Points Placed

92—DeskTop FastLap5 & FastLapSim5 Vehicle Simulations
Match Corner PointDirection Forward And Reverse
The Track Editor
Points, in order, until you have created Corner Points at all measured locations on the track. The track should look similar to the Track Map, except that the corners will be too “square.” If you place a Corner Point in the wrong location, simply click the Undo Tool and re-place that point. When you have placed all Corner Points, deselect the Build Track Tool by clicking on the Selection Tool.
Step 8: With all the Corner Points placed, there are three adjustments needed for each point: Location, Direction, and Forward-and-Reverse Curvature. First, use the Zoom Tool and examine the position of each Point. Make any adjustments by clicking on the point and dragging it to the correct location (Point position data is displayed in the Status Line when dragging the Corner Point). Repeat this process for all Corner Points. When the Corner Points are properly positioned, the next adjustment “aims” Corner Points (and the track) in the correct directions. Establishing the correct Corner Point Direction is relatively straightforward. If a Corner Point is located at a transition from a straightaway into a turn, the Corner Point Direction is aligned with the straightaway (as shown in the previous tutorial, Building Your First Track, on page 78). To help set Point directions, use the Match Fwd and Match Rev buttons to align Points with the next or previous Corner Point. The Match Fwd button will orient the Corner Point Direction in-line with (point directly at) the next Corner Point. The Match Rev button will orient the Corner Point Direction toward the previous Corner Point. If a Corner Point falls in between turns, for example, in the middle of a series of turns, such as “S-Curves,” or in the middle of a singe turn that may have a changing radius, the Corner Point Direction may need to be positioned at a tangent to the track or somewhere in between. A good example of this can be found on Point #18 on the PIR track. This point redirects the turn toward a sharper (smaller)
With all the Corner Points placed, there are three adjustments needed: Loca-tion, Direction, and Forward-and-Reverse Curvature. First, use the Zoom Tool and examine the position of each Point. Make any adjustments by clicking on the point and dragging it to the correct location (Point position data is displayed in the Status Line). Repeat this process for all Corner Points. When the Corner Points are properly positioned, the next adjustment “aims” Corner Points (and the track) in the correct directions. If a Corner Point is located at a transition from a straightaway into a turn, the Corner Point Direction is aligned with the straightaway. To help set Point directions, use the Match Fwd and Match Rev buttons to align Points with the next or previous Corner Point.
Curvature Match Buttons

DeskTop FastLap5 & FastLapSim5 Vehicle Simulations—93
Width Changed At Point#0 and #1 To 100-Feet
The Track Editor
If a Corner Point falls in between turns, for example, in the middle of a series of turns, such as “S-Curves,” the Corner Point Direction may need to be positioned at a tangent to the track or somewhere in between. A good example of this can be found on Point #�8 on the PIR track. This point redirects the turn toward a sharper (smaller) radius. The Corner Point direction is 6-degrees, or slightly tilted to the right from vertical, more-or-less at a tangent to track direction.
Corner Point Within A Turn
radius. The Corner Point direction is 6-degrees, or slightly tilted to the right from vertical, more-or-less at a tangent to track direction. The last Corner Point adjustments set the Forward and Reverse Curvatures. These attributes apply the correct “shape” to the corners. The Forward Curvature, indicated by the length of the Red Curvature Handle, defines the radius of the track as it moves away from a Corner Point (moving in the direction of vehicle movement). The Reverse Curvature, indicated by the length of the Blue Curvature Handle, defines the radius of the track as it approaches the Corner Point. In most cases where a straightaway meet a turn, it will only be necessary to adjust one of the Curvature handles (usually the Forward Curvature), but for more complex
FastLapSim5 allows each Corner Point to have a width setting. The width of the track between Points is an interpolation
of the widths of the two adjacent Corner Points. If you set a control point width to �00-feet and one to 60-feet, the track will
gradually taper from �00-feet to 60-feet. For example, the main strait at PIR is
slightly wider than the remainder of the track. To set this width change, select
Point #0 and change the Widthfieldto80-feet in the lower part of the Track Editor
window. Also change the Width of Corner Point #� (located at the Start/Finish line)
to 80-feet wide. Now the straightaway measures 80-feet across and tapers down
to 60-feet by Corner Point #2.
Changing Corner Point Width

94—DeskTop FastLap5 & FastLapSim5 Vehicle Simulations
adjustments, both the Forward and Reverse Curvatures may need to be extended to achieve the desired corner shape.
Step 9: The track is nearly complete, however, some tracks vary significantly in width from corner to corner. FastLapSim5 allows each Corner Point to have a width setting. The width of the track between Points is an interpolation of the widths of the two adjacent Corner Points. If you set a control point width to 100-feet and one to 60-feet, the track will gradually taper from 100-feet at the first Corner Point to 60-feet at the next Corner Point. For example, the main strait at PIR is slightly wider than the remainder of the track. To set this width change, select Point #0 and change the Width field to 80-feet in the lower part of the Track Editor window. Also change the Width of Corner Point #1 (located at the Start/Finish line) to 80-feet wide. Now the straightaway measures 80-feet across and tapers down to 60-feet by Corner Point #2.Note: If you would like to set all Corner Points to the same Width, the Track Setup window includes a Set All Points check box. Place a checkmark in this box and set the Default Track Width to the desired value. When you close the Track Setup window, all the Corner Points on the track will be reset to the default value. Before you move on to the final step in building a real-world track, click on the Calculate Raceline Tool in the Toolbar and verify that a smooth raceline passes though each corner and straightaway. If you see any loops or strange bumps in the raceline it means that a control point is not pointing in the proper direction or that two control points are overlapping. Zoom In to discover the problem. Finally, give each Corner Point one final review. If any of the curves in the track need fine-tuning, moving Corner Point positions and slightly adjusting Directions and Curvatures should fix any issues. If, despite your best efforts, you cannot obtain the
The Track Editor
ThefinalstepistopositiontheStart/Fin-ish Line. This is done with the Start/Fin-ish Tool located in the Toolbar. Activate
this tool then click on the track where you want to position the Start/Finish Line.
The Start/Finish Line on the PIR track is located at Point #�, so Zoom In on that point and click directly on the track at
the Point #� position. A small red line will appear at exactly the Start/Finish point. If you would like to reposition the Start/Fin-ish Line, simply use the Start/Finish Tool
again.
Place The Start/Finish Line

DeskTop FastLap5 & FastLapSim5 Vehicle Simulations—95
desired track shape, you may need to add an additional Corner Point to increase your tuning flexibility at that location.
Step �0: The final step in completing your track model is to position the Start/Fin-ish Line. This is done with the Start/Finish Tool located in the Toolbar. Activate this tool then click on the track where you want to position the Start/Finish Line. The Start/Finish Line on the PIR track is located at Point #1, so Zoom In on that point and click directly on the track at the Point #1 position. A small red line will appear on the track at exactly the Start/Finish point. If you would like to reposition the Start/Finish Line, simply use the Start/Finish Tool again. Now that your track is complete, open the Track Editor Setup window again and enter a Track Name and Description in the fields at the top of the window. Then save the track file (.TK) one final time in the default track directory—TrackFiles (.TK). Then close the Track Editor and run a test vehicle on your “brand new” track.
The Track EditorChanging Corner Point Width
After placing the Start/Fin-ish line, close the Track
Editor and run a test ve-hicle on your “brand new” track. This �000hp Camaro
really delivers the action!

96—DeskTop FastLap5 & FastLapSim5 Vehicle Simulations
PRINTINGPRINTINGPRINTING VEHICLE DATA AND TRACK-PERFORMANCE CURVES
FastLapSim5 is capable of printing a complete list of vehicle components, exact test result values, and 2D graphic curves of speed, rpm, acceleration, and several other vehicle-test variables. Each of these data sets print on separate pages that comprise a complete multi-page, drag-test document of the currently-selected ve-hicle. You can determine which pages you would like to print, preview the pages before you print, and direct the output to any installed Windows printer.Note: ProPrinting™ is available in FastLapSim5 (see page 100 for more information on program features). This program feature produces comprehensive “presentation” reports of lap test results. ProPrinting™ includes special page graphics, a cover page with the name of your business (or you personal name), additional engine-data values, pressures, forces, and more.
There are three choices in the File menu (located on the Main Program Screen) that will help you setup your printer and print vehicle test data. The choices are:
Print—Opens a dialog box that allows the selection of a printer, access to printer Properties, and the Print Range of drag-test pages. Printing can be started from
Print Dialog BoxThe print dialog box, acces-sible from the File menu, al-
lows the selection of a printer, access to printer Properties, and you can enter the range
of lap-test report pages. Print-ing can be started from this
dialog box.
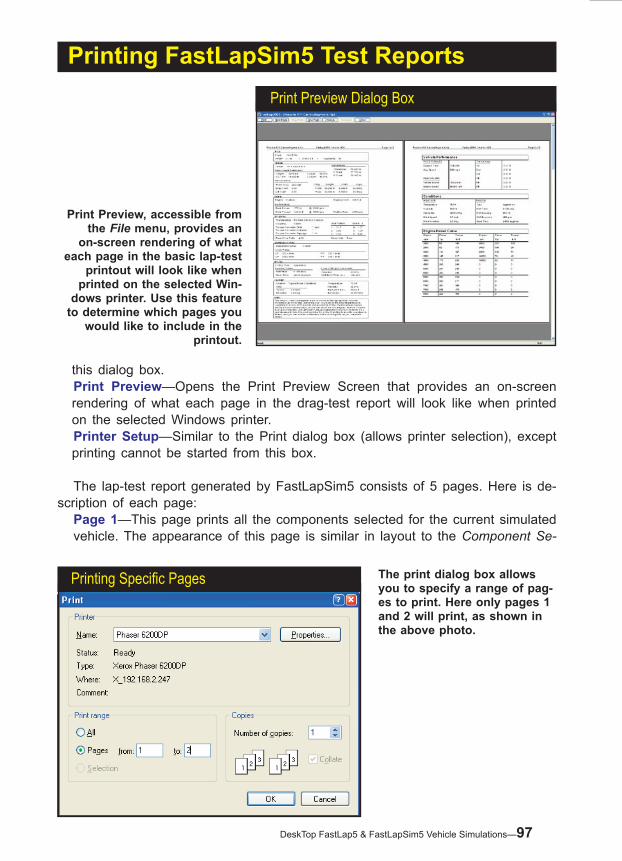
DeskTop FastLap5 & FastLapSim5 Vehicle Simulations—97
this dialog box. Print Preview—Opens the Print Preview Screen that provides an on-screen rendering of what each page in the drag-test report will look like when printed on the selected Windows printer. Printer Setup—Similar to the Print dialog box (allows printer selection), except printing cannot be started from this box.
The lap-test report generated by FastLapSim5 consists of 5 pages. Here is de-scription of each page:
Page �—This page prints all the components selected for the current simulated vehicle. The appearance of this page is similar in layout to the Component Se-
Printing FastLapSim5 Test ReportsPrint Preview Dialog Box
Print Preview, accessible from the File menu, provides an
on-screen rendering of what each page in the basic lap-test
printout will look like when printed on the selected Win-
dows printer. Use this feature to determine which pages you
would like to include in the printout.
Printing Specific Pages The print dialog box allows you to specify a range of pag-es to print. Here only pages � and 2 will print, as shown in the above photo.

98—DeskTop FastLap5 & FastLapSim5 Vehicle Simulations
Printing FastLapSim5 Test Reportslection Categories of the Main Program Screen.Page 2—Displays all calculated performance data in chart form. The chart is virtually identical to the Results Table shown on the top of page 65.Page 3—The vehicle-performance data graph is reproduced on this page (this is the graph located on the top, right side of the Main Program Screen. Full color printing is supported.Page 4—This page provides a rendering of the current Track and related data.Page 5—This page includes a data graph of all segments defined fort the cur-rent track, see photo on bottom of page 65.
ProPrinting Features
ProPrinting™ will generate a comprehensive “presentation” report of vehicle test data. ProPrinting™ features include special page graphics, a cover page with the name and address of your business (or your personal name and address) and logo, a table of contents, optional text printed at the bottom of each page (can be a disclaimer, copyright notice or any other text you wish), optional comprehen-sive or “mini” glossaries, and a complete listing of all test data and results. This full-color report is built within FastLapSim5 and delivered to your default Internet browser (e.g., Microsoft Internet Explorer™) for on-screen display and printing. To view a multiple-page print preview of this report, select ProPrint Preview from within FastLapSim, the select Print Preview from within your browser.Note: Some browsers, like recent versions of Internet Explorer) do not print “back-ground graphics” by default. This will prevent the printing of background colors in many of the data tables in the ProPrinting™ report. To enable full-function printing, open the Internet Options menu (often located at the bottom of the Tools menu within Internet Explorer), choose the Advanced tab, and click the box (to enable)
ProPrinting™, a ProTools™ feature, turns the results of any vehicle simula-tion into a professional test report. Use the Pro-Printing™ Setup dialog box, available from the File menu, to enable and customize Pro-Printing™ features. You can add your name, address, your company logo, specialized (copyright) text, a table of contents, and even a short or long glossary to your ProPrint report. Use the Default... button to save your preferences that will be applied by default to new vehicle simulations. The filesfortheDefaultLogo.bmpandtheDefaultCopyright.txt are located in the FastLapSim/Manuals & Videos/proprint subdirectoy.Youcanmodifythesefilesto suit your requirements.
Pro-Printing™ Setup

DeskTop FastLap5 & FastLapSim5 Vehicle Simulations—99
Print background colors and images. Use ProPrinting™ Setup, available from the File menu in FastLapSim, to en-able and configure ProPrinting™ features. If you activate Include Logo, the logo file must be a .BMP file (should be square with the size near 100 by 100 pixels). If you activate Include @ Bottom Of Page, the included text file must be non-formatted text only (for example, created in Notepad) and no longer than about 50 words. You will find these files located in the FastLapSim/Manuals & Videos/proprint directory.
ProTools™ Printing FeaturesA ProPrinting™ report in-cludes “presentation” graph-ics, a cover page with the name and address of your business (or your personal name and address) and logo, a table of contents, optional text printed at the bottom of each page, optional “full” or “mini” glossaries, and a complete listing of all test data and results. The report is delivered to your default web browser for printing (or print previewing as shown here).
Pro-Printing™ FastLapSim5 Test Report
Pro-Printing™ IE ConfigurationSome browsers, like recent versions of Internet Explorer) do not print “back-
ground graphics” by default. This will prevent the printing of data table back-ground colors in ProPrinting™ reports.
To enable full-function printing, open the Internet Explorer Options menu (typically located at the bottom of the Tools menu within Internet Explorer), choose the Ad-vanced tab, and click the box (to enable)
Print background colors and images.

�00—DeskTop FastLap5 & FastLapSim5 Vehicle Simulations
OTHER FEATURESOTHER FEATURESPROGRAM FEATURES
FastLapSim5 can start-up and run in three distinct modes: 1) Demo, 2) DeskTop, 3) Advanced and 3) ProTools™ Activated modes.
DeskTop FastLap5 Version—(Basic Version Of FastLap5) DeskTop Fast-Lap5 contains a rich and powerful set of features that most enthusiasts will find more than sufficient to allow them to test components and determine optimum combinations for just about any application. All essential simulation features are included in the “basic” DeskTop Mode, The Advanced and ProTools™ modes extend the existing features to allow a more technical and/or detail analysis of vehicle performance.
FastLapSim5 Version—(Most Advanced Version Of FastLapSim) If you are a serious enthusiast or racer you will find the additional tools and features supplied in FastLapSim5 a valuable addition to the DeskTop version. In ad-dition, the included ProTools Kit provides custom ProPrinting™, ProData™
DeskTop FastLap5 contains a rich and powerful set of fea-tures that most enthusiasts willfindmorethansufficientto allow them to test compo-nents and determine optimum combinations for just about any application. All essential simula-tion features are included in the “basic” DeskTop Mode
DeskTop FastLap5 Main Program Screen

DeskTop FastLap5 & FastLapSim5 Vehicle Simulations—�0�
Other Program Features
tables and more. With FastLapSim5 you can run multiple, simultaneous simula-tions and perform on-graph comparisons of up to four vehicles. A SimData™ Window—keyed to the on-graph reticle—allows you to scroll through telemetry data and extract exact values, a Real-Time Simulation screen lets you view the simulation process in realtime, review an extensive data display, watch the simulation zero-in on the best braking points and corner speeds, see suspen-sion movement, G-forces, and more!Here is an abbreviated list of FastLapSim5 With ProTools™ Kit features:
• Simulation Optimization: This feature includes optimization routines that perform a more in-depth analysis of every corner, braking points, all suspension movement and forces applied to the test vehicle. This calculation-intensive analysis, when activated by the user, predicts lap times and vehicle performance data with the highest possible accuracy. If you need the most accurate analysis possible, the ProTools™ Optimization will help you achieve your goals.
• The Spring/Damper QuickCalculator™: A powerful tool for serious performance seekers. This tool will help pick the most appropriate shock absorber for any spring rate. The Calculator tests dampers with the current spring, performing a spring/shock dyno simulation and selecting a combination that effectively dampens the spring (without overdamping). The Spring/Damper QuickCalculator™ is an indispensable tool for zeroing-in on the best shock combinations for virtually any vehicle or track.
• The Optimum Gear Iterator™: This advanced tool performs a quick iteration using the current vehicle setup and simulation test data to find the best transmis-sion and rear-axle ratios for the test vehicle.
If you are a serious enthusiast orraceryouwillfindthead-ditional tools and features sup-plied in FastLapSim5 a valuable addition to the DeskTop ver-sion. In addition, the included ProTools Kit provides custom ProPrinting™, ProData™ tables and more.
FastLapSim5 Main Program Screen

�02—DeskTop FastLap5 & FastLapSim5 Vehicle Simulations
Other Program Features
• Track Segments defines portions of the track as “segments.” Segments begin and end at Corner Points, and once defined, segments can be used to analyze vehicle entrance and exit speeds, average speeds, and other vehicle “acquisi-tion” data. Optionally, choose unique colors for each segment, making visual identification a snap. Up to 30 segments can be defined for each track.
• Graph DataZones™: Set colored ranges on any simulation results graph to mark target times, distances, accelerations, speeds, or any other race variables. DataZones also can be used to graphically indicate gear ratios overlaid on speed, acceleration, and other distance-based data-sets. DataZones produce profes-sional-looking graphs, isolate vehicle characteristics, help detect excess speeds or loads, and add color to graphic displays.
• ProTools also includes track-segment ProData™ that is calculated and displayed in an additional table of test results (available by selecting the ProData tab at
If you are a serious enthusiast, racer, or professional engine builder,youwillfindthe additional tools and features sup-plied in FastLapSim5 a valuable addition to the DeskTop program version. Many features in the Sim version have been enhanced with extended func-tionality. In addition, there are new fea-tures aimed directly at the professional, like the ProIterator™ and ProPrinting™ that generates a “presenta-tion-quality” dyno test report including the name and logo of your company.
ProRacing FastLapClosed-Course Simulations
FastLapSim5 SimulationProgram Features
DeskTop Series Sim Series
DeskTopFastLap
FastLapSim With ProTools™
Multi-Page FastLap5 Test Reports Yes Yes
Load Engine Simulation Files Yes Yes
Front- And Rear-Wheel Drive Yes Yes
LapTime Slip™ Yes YesGraph Reticle Synchronized
With Vehicle Position Yes Yes
DirectClick™ Menus Yes YesComprehensive Suspension Mods Yes Yes
C.G. Calculator Yes YesU.S./Metric Units Yes Yes
Track Editor™ Create Your Own Custom Track Yes Yes
SimData™ Telemetry WindowSynchronized With Graph Reticle No Yes
Real-Time Simulation Screen No YesTest Multiple Vehicles No Yes
On-Graph ComparisonsUp To Four Vehicles No Yes
Extended Color Display/Interface No YesHigh-Resolution Testing No Yes
ProTools™ Data Displays No YesProPrinting™ Extended Reports No Yes
Graph DataZones™ Display No YesIterative Spring/Damper Testing No Yes
Track-Segment Data Analysis No Yes

DeskTop FastLap5 & FastLapSim5 Vehicle Simulations—�03
the bottom of the graph screen). Up to 30 segments can be defined and uniquely colored. Each segment of the track can be used to record and analyze vehicle entrance and exit speeds, average times, and more.
• Pro-Printing™: Allows you to printout a comprehensive, presentation test report of any simulated vehicle on any track. This professional report includes a custom cover page with the name of your business and/or vehicle designer, vehicle data, all performance data tables, graphic performance data, and all extended data available with ProTools (as described above). Even include an optional Table of Contents and/or Glossary of Terms with your test reports. Use this eye-popping report to make the best presentation possible of your latest vehicle simulation designs.
DYNO FILE (.DYN) COMPATIBILITY
DynoSim5 allows you to simulate the building and dyno-testing of an engine, but in addition to this, you can install your simulated engine in a simulated drag-race vehicle using the DeskTop Drag5 or DragSim5. With these programs you can test your combination in 1/8- or 1/4-mile drag events. And using DeskTop FastLap5 or FastLapSim5 closed-course simulation, you can test any simulated engine on any track in any vehicle. To support this versatile testing “system,” all version-5 simula-tions have full compatibility to allow the easy interchange of engine data to both drag-racing and road-racing simulations. DeskTop Dyno5 and DynoSim5 engine files (xxxx.DYN files) can be directly loaded into the DeskTop Drag5, DragSim5, DeskTop FastLap5, and FastLapSim5; no file export or modification is required.
GENERAL SIMULATION ASSUMPTIONS
FastLapSim5 closely simulates the conditions that exist during an actual road race. The goal is to reliably predict the torque to the driving wheels, the weight transfer that occurs during acceleration, cornering, torque losses through the driveline, and a myriad of other factors to accurately predict vehicle performance throughout the course. Here are some of the assumptions within FastLapSim5 that establish a modeling baseline:
Engine: �) The engine power curve is assumed to be corrected to Standard Temperature
And Pressure, and the power delivered to the powertrain is corrected for the weather conditions established in the Weather Category.
2) Engine speed will never exceed the Redline Limit established in the Engine Category.
3) Full throttle engine power will be applied to the powertrain as much as pos-
Other Program Features
�04—DeskTop FastLap5 & FastLapSim5 Vehicle Simulations
sible throughout the duration of the race.
Environment: �) As engine inlet air gets colder and denser air, the higher horsepower the
engine will produce. For induction air at the standard temperature and pres-sure (STP) of 68-degrees(F), dry (0% humidity), with a barometric pressure of 29.92-in/Hg, engine power will not be corrected and will be used as entered in the Power Curve dialog box (power values entered in the Power Curve dialog or imported from a DynoSim engine (.DYN) file are assumed to be corrected to STP).
2) The engine, oil, and coolant have been warmed to operating temperature.
RaceLine: The calculation of the raceline is the most complex function within FastLapSim.
An ideal raceline will allow the car to accelerate as soon and as long as possible, brake as late as possible, and traverse a corner at the largest pos-sible radius. FastLapSim5 uses two techniques to derive this solution. First, a raceline is approximated by a series of points, at which the curvatures or corner radii are calculated and default lanes (several possible paths across the track) are assigned. The next step iterates lane assignments (performs multiple tests) modifying paths and recalculating the curvatures until the most linear (shortest) path through the track has been found. Once this path is computed, the theoretical maximum speed through each point is determined, assuming speed is limited by peak tire grip. When this step is complete, a new series of calculations analyze the computed speeds and radii to deter-mine where braking should begin. The last computation cycle uses a Gradient Descent technique to optimize the calculated path. As this is performed, the path is modified slightly, and the lap times are estimated. If the new path proves to be an improvement, its specifications are retained, if it is not the quickest path through the track, the entire process is repeated until there is a convergence upon an optimal path. Raceline calculation requires millions of mathematical operations, however, it only requires about two seconds of calculation time on 1GHz or faster processors.
Transmission and Differentials: The simulation uses a unique system to simulate the gearbox-and-differential
system. It is defined as a system of connections that have both outputs and inputs and can feedback or pass-through forces and speeds to various com-ponents. For example, on a rear-wheel drive car, the engine transfers power into the gearbox which feeds the rear differential which feeds the wheels and tires. During engine braking, the tires feed back into the differential which feeds back to the gearbox which feeds back to the engine. At each point the system is modeled and outputs are calculated.
General Simulation Assumptions

DeskTop FastLap5 & FastLapSim5 Vehicle Simulations—�05
Aerodynamics: There are two types of aerodynamics modeled in FastLapSim: Body and
Wings. Body aerodynamics are simulated by analyzing the coefficient of drag (Cd), and frontal area. Cd ranges from 0.20 (very aerodynamic car) to 0.70 (a brick). The frontal area is the area covered by a “shadow” of the car as projected down the length of the vehicle. With these parameters a calcula-tion is performed to estimate vehicle drag. Wing aerodynamics simulate the downforce and drag produced by an airfoil wing. A wing is defined by surface area (length x width), chord angle (the curve of the wing), and the angle of attack (the angle that the wing is mounted onto the car). You can specify a front and rear wing. The force produced by the wing is applied at the front or rear axle, respectively.
General Simulation Assumptions

�06—DeskTop FastLap5 & FastLapSim5 Vehicle Simulations
HANDLING CLINICHANDLING CLINICFinding The CG Height Of A Real Car
Start by weighing the vehicle at all four wheels. Record the total weight and the weight over the front and rear wheels. Now raise one end of the vehicle up about 24 inches if possible. Use a heavy-duty hydraulic jack or an overhead hoist to do this. Keep the wheels at the other end on the scales. Record how much weight is now indicated on the scales. You will now need to know the wheelbase with the car raised as well as the wheelbase with all four wheels on the ground. To measure the “static” wheelbase, drop a plumb from the center of each wheel and make a mark on the ground. Use a tape to measure the distance. To measure the wheelbase when one end is raised, drop a plumb from the raised end and make a mark on the ground. Measure from the mark to the wheel center mark from before. We now have enough information to calculate the CG height (this height is from the ground).Note: You can also use the CG QuickCalculator (described on page 31) to perform this calculation.
CGV = (Level Wheelbase x Raised Wheelbase x Added Weight) (Distance Raised x Overall Weight)
There are a few things that can affect an accurate determination, like suspension droop (and compression at the end on the scales), fuel slosh, etc. The suspension can be locked in place by replacing the damper (shock) with a rigid bar and the fuel tank can be emptied to improve accuracy.
Chassis Setup—Introduction
Here are specific problems that can arise when tuning a car for a given racetrack. The list of problems discussed and the possible solutions are based on experience and research, however, they are by no means a complete list of all the possibili-ties. The suggested remedies are believed to be accurate, but there are always exceptions. The following material should be treated as solution guidelines, not fixed rules.

DeskTop FastLap5 & FastLapSim5 Vehicle Simulations—�07
The Handling Clinic It is necessary to make the distinction between changes that will always improve the performance of the car (make all of these first) and changes that tune or bal-ance the car (these have trade-offs). The first category includes things like more power and stickier tires; the second group includes small changes like spring rates or adjusting anti-roll bars. It takes good initial design and careful tuning to produce a successful car. One major cause of handling problems is suspension/component/chassis com-pliance (or flexibility). All materials are flexible to some degree. Loads on various parts of a vehicle can be surprisingly large, leading to unexpected distortions. With unknown and/or excessive compliance, it can be very difficult to predict any aspect of racecar performance. Cars that have large compliance (often unknown by the race team) are usually unresponsive to typical changes to which most race cars respond. FastLapSim5 does not model structural compliance and assumes a 100% rigid frame. Table 1 lists principal chassis adjustments that can be made on modern racecars. You can consult Table 2 if you have an existing problem, and it should point to changes that will have a significant influence. The most challenging part of deter-mining an optimum race setup is that any change affects virtually everything else. A change made to improve one aspect of performance can easily degrade overall lap times. The best lap times are achieved with a setup that is the best compromise for the circuit as a whole. Table 3 puts this into perspective by illustrating some of the effects that can occur when a particular modification is made to improve one problem area. Given the differences between cars, the set of tables in this chapter should only be considered a starting point in the setup process. Ideally, enough testing can be done to put numbers on the results of any given change. This test data will be invaluable at the track when time is short.
Setup
Racing is all about driving the vehicle at its limits, near the “g-limit” boundaries of tire traction. Finding a vehicle setup to accomplish this is referred to as the opti-mum setup or chassis tune. The task involves many compromises for each vehicle on each circuit. FastLapSim5 allows you to test many setups before taking them to the track. However, even the best simulation results may not suite a particular driver or track conditions, so final on-track evaluation is always necessary. Here are the principal objectives in setting up a car:
1 Cornering balance (neutral steer) under maximum lateral conditions.2 Compromise between cornering performance and drag on high-speed
tracks.3 Eliminating specific control and stability problems at any point on the cir-
cuit.4 Maximize acceleration out of corners and down the straits.

�08—DeskTop FastLap5 & FastLapSim5 Vehicle Simulations
The Handling ClinicTable �—Principal Chassis Tuning Items
Tires
a. Different designs, sizes and front/rear combinationsb. Tire pressures/tire temperaturesc. Stagger (different tire circumference) frequently used across an axled. Rim widths and offsets (possible track change)e. Static alignment (toe, camber, caster)
Static Wheel Loadsa. Longitudinal CG location (shifting ballastb. Lateral CG location (shifting ballast)c. Wedge, diagonal weight jerking, or warp (changes in spring preload)
Lateral Load TransferDistribution(LLTD)
a. Roll couple distribution front to rearb. Roll center heights (front and/or rear)c. Ride spring ratesd. Anti-roll bars or Z-barse. Progressive rate springs, linkages and bump stops (Notes: Couplingoccurs with ride height changes when progressive rate linkages areused. Cockpit adjustment of LLTD may be provided.)
Ride Height andBody Attitude (Roll
and Pitch
a. Wheel orientation changes via suspension geometry Camber curves Ride (bump)/roll steer Anti-dive/squat Steering geometry Wheel travelb. Aerodynamics (function of ride height and body attitude)
Aerodynamic Forcesand Moments
a. Lift/downforceb. Dragc. Pitching and yawing moments (Note: As affected by size, shape,angle of wings, car shape/underbody, internal air flow, etc.)
Brakes a. Distribution, front to rearb. Cooling
Driveline
a. Gearingb. Differential, type and functional behaviorc. Spoold. Engine performance characteristics
Dampers a. Type and curve shape.
Driver-VehicleInterface
a. Steering ratiob. Pedal forces and movementsc. Force feedbacks (kickback, oscillations)
Compliancesa. Chassis and suspension stiffness maximized by designb. Suspension compliances are not adjustable for tuning (as in roadcars)
Tables 1 covers the principal chassis tuning items. The first four items are directlyconcerned with the tires, desirable wheel orientations, and tire loads. The aerodynamic lift/downforce is an important component when aero devices are allowed. Brake distri-butionaffectscontrolandbalancethroughmodifications in tire loads.Drivelinechar-acteristicsacting through longitudinaland lateral tireslipandcansignificantlyaffectthe available lateral tire forces. Finally, dampers have some direct control on tire loads under rough road and transient conditions.
DeskTop FastLap5 & FastLapSim5 Vehicle Simulations—�09
The Handling Clinic
The traditional setup procedure involves making changes in vehicle adjustments based on subjective driver comments and lap/segment times. This feedback might be supplemented with remarks from observers stationed at various points around the track and tire temperature measurements taken in the pits. The professional racing approach to setup has become much more sophisticated in recent years. In the first place, the cars have become more adjustable. Second, electronic on-board and trackside instrumentation is being used by most well financed teams. With the advent of simulation like this it is now possible to experiment with various modifications before using valuable track time.
Chassis Adjustment
Table 1 covers the most important items that can be modified to optimize chas-sis tuning and handling. Since competition experience and ingenuity are continually producing new ideas, this table should not be viewed as complete. Rather use it as a guideline for your modifications. An examination of Table 1 indicates that a major part of chassis tuning is maxi-mizing the lateral tire forces while achieving proper balance. The first four items are directly connected with the tires, desirable wheel orientations, and tire loads. Aerodynamic lift/downforce is an important component of vertical tire loads when aero devices are allowed. Brake distribution also affects control and balance through modification on tire loads throughout the friction circle. Driveline characteristics act through the interaction of longitudinal and lateral tire slip and can significantly af-fect the lateral tire forces. Finally, dampers have some direct control on tire loads under rough-road and other transient conditions. Although it is desirable to make one configuration change at a time, there are major and subtle interactions between modifications that we’ll cover in the upcoming sections.
Using Table 2—Primary Setup Guide
Table 2 is a first cut at the major problem areas for high-performance / racing cars. Down the left side of the table is a list of different operating conditions and across the top is a list of items that can be changed. The numbers in the chart correspond to the numbered paragraphs in this section on Primary Setup. The choice of which relationships to discuss was made on the basis of “most likely to affect performance.” As an aid to understanding, we recommend that the reader stop and create a mental picture for each situation. The changes along the top of the table are ordered from left to right in ap-proximate mechanical difficulty. Changes on the left side of the table require a fair amount of effort and may need to be designed into the car; those on the right are items that can be changed relatively easily in tuning the car.

��0—DeskTop FastLap5 & FastLapSim5 Vehicle Simulations
The Handling Clinic
�. The Effect of CG Location on Straight Line Braking When the brakes are applied, load is transferred from the rear tires to the
front tires. The higher the CG, the more is transferred for any given decel-eration. Tires are load sensitive, thus theoretical best braking occurs with the tires evenly loaded (if the tires are the same on both ends of the car). For the typical RWD or FWD road car (with initial forward load bias) this says that to improve the absolute level of braking, the CG should be as low as possible and moved toward the rear of the car. Clearly this is not always feasible for FWD race cars but it should be taken into account when a car is being designed.
2. The Effect of Tires and Rim Sizes on Straight Line Braking To the extent that changing the tires/rims changes tire/road friction properties,
the braking performance will be affected. The end with the stickiest tires can generate relatively more braking force for a given load.
3. The Effect of Brake Balance on Straight Line Braking Brake balance is the name given to the proportioning of brake force (or
brake torque) to the front and rear tires. The brake balance to give “correct” proportions of braking to the front and rear (relative to their potential) varies with deceleration rate. The harder the stop, the more heavily loaded will be the front wheels and the more braking effort they can support. Likewise, the
Table 2—Primary Setup CGLocation
RollCenter Anti-pitch Steering
Geometry Camber Ride/RollSteer
Aero-dynamics Differential Tire & Rim
Size
RideSpringRates
RideHeight
BrakeBalance
RollStiffness
Distribution
Dampers
Low-Speed Steady-State:
Straight Line Braking � 2 3
Braking & Cornering 4 5 6 7
Cornering 8 9 �0 �� �2
Acceleration & Cornering �3 �4
Straight Line Acceleration �5 �6 �7
High-Speed Steady-State:
Straight Line Braking �8 �9
Braking & Cornering 20 2�
Cornering 22
Straight Line Acceleration 23
Transient Behavior:
Dropped Throttle in a Turn 24 25 26 27
Braking in a Turn 28 29
Poor Road 30 3� 32 33 34
Control Characteristics:
Steering Force & Ratio 35 36
Steering Kickback 37 38 39
DeskTop FastLap5 & FastLapSim5 Vehicle Simulations—���
The Handling Clinicrear tires are unloaded as the deceleration increases and they must have less braking force. This is accomplished in several ways: Either the brake balance is fixed and is biased heavily toward the front, which means the rears don’t do their share on relatively gentle stops, or various types of pro-portioning valves are used to limit hydraulic pressure to the rear brakes to prevent premature locking. Finally, an antilock system may be fitted. When the brakes are not correctly set up (for racing) one end will lock up before the other. If the rears lock first, the car will tend to spin, based on the de-stabilizing side force that the still-rolling front tires provide. If the fronts lock up first, steering control will be lost and the car will go straight or slide down the camber of the road. Because the desirable brake balance varies with the deceleration, different brake balances are required on different coefficient of friction surfaces. For example, snow gives little absolute braking capability and the best brake balance will be very close to the fore-aft static weight distribution. Where possible, it is desirable to fit some sort of brake balance adjustment to racecars to allow tuning of the brakes to different surfaces and conditions.
4. The Effect of CG Location when Braking and Cornering The result of combined braking and cornering on turn entry is to load the
outside front wheel very heavily (perhaps as much as one half the weight of the car). At the same time, the inside rear wheel is lightly loaded. The higher the CG, the more load will be transferred. This situation will be exaggerated if the CG is forward to begin with. The heavily loaded outside front tire will be operating at a relatively low coefficient because of load sensitivity. Assum-ing the car has been otherwise set up, a low and rearward CG position is going to keep the tires most evenly loaded on turn entry, and this will give the best performance.
5. The Effect of Roll Center Location when Braking and Cornering Roll center heights front and rear partially determine the way the roll moment
on the car from lateral force is distributed. Lowering the roll center on one end will lower the roll moment resisted by that end; the wheels on that end will be more evenly loaded in cornering compared to the other end of the car. For example, assume that the car is loose on turn entry; the idea is to sacrifice grip on the front to increase grip on the rear. The outside front is taking the largest share of the load and increasing the front roll resistance by raising the front roll center will further degrade it to help the rear stick proportionately better. Additional help can be obtained by lowering the rear roll center height as well. It should be noted that “too high” a roll center leads to jerking.
6. The Effect of Brake Balance on Combined Braking and Cornering The correct brake balance for straight line stopping may not be appropriate

��2—DeskTop FastLap5 & FastLapSim5 Vehicle Simulations
The Handling Clinicon turn entry. The outside front tire is very heavily loaded and generates relatively more lateral force than the rear leading to spin. This is true even though the front is operating at a lower coefficient (due to load sensitivity). Thus, too much rear brake bias may be described as “loose coming into the turn.” Some production cars have almost no rear brake bias (to prevent accidental spins) and the sometimes-used practice of trail braking (braking while on the throttle in a front-wheel drive) has a compensating effect. The engine power reduces the braking on the front wheels while the rears are still receiving a normal amount of braking force. The result is that the rear tires are saturated and the car begins to spin; carefully controlled, this can be used to get the tail out on entry to tight comers.
7. The Effect of Roll Stiffness Distribution when Braking and Cornering The roll stiffness distribution is the other way of changing the loads on the
wheels under lateral force. Roll stiffness can be raised by increasing anti-roll bar stiffness or increasing spring stiffness. Again, assuming the car is loose on turn entry, it is appropriate to resist more of the body roll moment on the front. Higher front roll stiffness will do this. If the car has a “rising rate” spring installation, the front roll stiffness increases when the vehicle pitches forward. For front-wheel drive the problem may be reversed, if the CG of the car is so high and/or forward that the inside rear wheel is off the ground, the rear of the car is already offering all the roll stiffness it can and further changes in rear roll stiffness will have no effect.
8. The Effect of CG Location on Steady-State Cornering A neutral car is best for steady-state cornering. By tuning, cars with a range
of CG positions near the center of the car (and same tires front and rear) can be made to be neutral. If the CG is forward, the lightly loaded rear end will stick better than the front (because of tire load sensitivity) and the rear end must be degraded to bring the car back to neutral (this ignores the fric-tion circle effect which can degrade the drive tires a great deal, even at road load power). The best use of equal-sized tires in steady-state cornering is made with the CG near the center of the car.
9. The Effect of Roll Center Location on Steady-State Cornering If the car is forward weight biased, a rear roll center higher than the front will
tend to make it neutral. If both roll centers are so low (i.e., on the ground) that the car has a large amount of body roll, absolute cornering performance may be affected through adverse tire camber. It is necessary to strike a compromise here because too high a roll center leads to jerking (and lateral tire scrub on bumps), an undesirable characteristic.
�0. The Effect of Camber on Steady-State Cornering It is desirable to have a small amount of negative camber (top of the tire

DeskTop FastLap5 & FastLapSim5 Vehicle Simulations—��3
The Handling Clinicleaning toward the center of the car) on the outside wheels. This produces the maximum lateral force from the two outside tires. Tire temperature taken across the tread width is commonly used to set static camber; the camber is changed until the temperature is roughly the same across the tread width. For race courses where the direction of turn is always (or mostly) the same, positive camber on the inside wheels will also help. Camber can also be used to balance the car.
��. The Effect of Tire and Rim Sizes in Cornering Cornering stiffness is often a function of tire/rim size, aspect ratio, and width.
As has been mentioned earlier, higher cornering stiffness tires require lower slip angles to produce a given amount of lateral force. Lower slip angles means lower “induced drag” or scrub and less speed loss in cornering. The optimum rim width may also play a part in maximizing the total grip available from a given tire.
�2. The Effect of Roll Stiffness Distribution on Steady-State Cornering For a symmetrical car (50% weight on the front wheels, 4WD, etc.), the roll
stiffness would ideally be the same on front and rear, if steady cornering were to be optimized. In 2WD cars, the drive degrades the lateral force capability at that end and the roll stiffness is biased toward the non-driven end. Many suspensions (especially rear) have an anti-roll bar “built-in” (twist axles). These double-duty suspensions require care in calculating the roll stiffness.
�3. The Effect of Differential Type on Acceleration Out of a Corner With an open differential the lightly loaded inside wheel is free to spin up
under power if enough torque is available. This limits the available accel-eration. Limited slip differentials have been used with varying success. It is unlikely that the simple addition of such a differential will be successful. As with any major change, a period of development must be gone through to make the new setup work. The type of limited slip differential chosen will be very important. Undesirable jerkiness occurs with many types and experience has shown this to be undesirable for combined acceleration and fuming.
The locked rear end or spool is another common solution to the problem of wheel spin. Because the locked axle has high resistance to yaw, more front cornering power may be required to keep the car neutral. If all the turns are the same direction, stagger (differential tire circumference) may be used to “split the difference” between low drag when straight running and when fum-ing.
�4. The Effect of Roll Stiffness Distribution on Acceleration Out of a Corner Roll stiffness is the easy way to change lateral load transfer distribution. For
rear-wheel drive the tendency is to spin the inside rear; more roll stiffness on the front (less on the rear) will help this. On the other hand, acceleration

��4—DeskTop FastLap5 & FastLapSim5 Vehicle Simulations
The Handling Clinicfrom low speed can reduce the front tire load so much that the car plows. For front-wheel drive, if the inside front wheel is spinning on acceleration out of a low-speed comer, more rear roll stiffness will help if the inside rear wheel isn’t in the air.
�5. The Effect of CG Location on Straight Line Acceleration The CG location determines the point of wheel spin. As the CG is moved
further rearward in a rear-drive car, the fraction available increases. CG further forward in a front drive car increases fraction available. Traction is a problem at low speeds (low gearing = high torque) with high-powered cars and on slippery surfaces. The need to move the CG to get fraction with a FWD is exaggerated when compared to a RWD because load is shifted off of the front tires on acceleration. The CG should be as low as possible to minimize this undesirable weight transfer. All of the other requirements for a good handling car suggest that the CG should be toward the center of the car; the fraction requirement of front-wheel drive forces a compromise in CG position. That is, put the CG as far back as you can and still get enough fraction.
�6. The Effect of Anti-Pitch Characteristics on Straight Line Acceleration Rear-drive cars, especially those for drag racing, may profit from rear lift (anti-
squat). This raises the CG and increases weight transfer to the rear wheels on acceleration. The lift effect is created by choosing the rear suspension attachment points to give a high pitch center; the torque reaction from the driving wheels lifts the car. On a FWD, such lift is detrimental to accelera-tion. Although anti-lift geometry is possible for the front suspension (namely, the wheel moves forward on bump) it leads to harshness and is generally avoided. Some FWD front suspensions have lift built in (as an aid to good ride); this may be removed for high-performance use. On acceleration, the rear of a FWD will squat; there is no torque reaction available to counteract this.
�7. The Effect of Differential Type on Straight Line Acceleration If both tires are on similar coefficient pavement at similar vertical load, the
differential type should not affect straight line acceleration capability (wheel spin limited). This is true of most independent suspensions and some torque tube solid axles. With solid rear axles this is not true because the wheel loads differ on acceleration. With the differential partially locked, small dif-ferences in tire size may cause the car to pull on acceleration (especially true on some front drives). This can be diagnosed by swapping the tires; if it pulls the other way, the wheels are being locked to the same rpm by the differential and the tires differ in circumference.
�8. The Effect of Aerodynamics on High-Speed Braking
DeskTop FastLap5 & FastLapSim5 Vehicle Simulations—��5
The Handling Clinic Aerodynamic drag helps the brakes at high speed. As an extreme example the
Formula One cars of a few years ago had enough aero drag to decelerate at two-thirds of a “g” at 170 mph with no brakes at all! The same ground-effects cars could brake at over five g’s because of aero down load. The aero down load distribution front to rear will partially determine the best brake balance and this may change with speed.
�9. The Effect of Brake Balance on High-Speed Braking Best brake balance at high speeds will be different than at low speeds be-
cause of aerodynamic forces. If the brake balance is biased toward the rear (relative to the balance required for four-wheel simultaneous lockup), the rear wheels may lock and the car will tend to swap ends (hard to control at high speed). Brakes heat up when slowing the car, especially if the stop is from high speed. If different brakes are used front and rear, the brake balance may change as the car slows down and the brakes heat up, if the brake linings change coefficient of friction.
20. The Effect of Aerodynamics on Combined Braking and Cornering at High Speed
Aerodynamic down load (or lift) affects the stability of the car at high speed. If down load is available at the rear, it will help keep the rear wheels stuck down and make the car stable. If down load is available at the front, it will tend to destabilize the car and aid turn-in. An appropriate balance between aero down (or lift) loads must be reached.
2�. The Effect of Brake Balance on Combined Braking and Cornering at High Speed
Best brake balance for high-speed turn entry is different than for straight brak-ing. Too much braking on the lightly loaded rear degrades already marginal amounts of lateral force; this may lead to spin. For front-heavy cars ideal brake balance puts more braking on the front as the car comers harder. At high speed it is unlikely that the driver will want to get the tail out very much; it is generally better to go into high-speed bends with the front tires limiting slightly.
22. The Effect of Aerodynamics on High-Speed Steady-State Cornering If there is down load available it will improve corner speeds. High-speed
comers are often power limited: at full throttle the car slows down due to tire induced drag (scrub). Aero down load will reduce tire slip angles (tire induced drag), but aero down load often adds aero drag. The question is: When is the reduction in tire drag more than the increase in aero drag?
At high speed the road load power (the power required to maintain constant speed) is much greater due to aerodynamic drag. Friction ellipse effects may limit the drive axle tire side force.

��6—DeskTop FastLap5 & FastLapSim5 Vehicle Simulations
The Handling Clinic Direct side force from vertical surfaces may also be used. This adds the aero
induced drag to the tire induced drag and it is likely that the aero induced drag will be higher. In other words, direct aero side force may not be very useful on low powered cars.
23. The Effect of Aerodynamics on High-Speed Straight Line Acceleration Aerodynamic drag (and to a much lesser extent other losses) limits the top
speed of cars. Lowering the drag will allow a higher terminal velocity. What is not so commonly realized is that at high speeds the available forward ac-celeration is a function of the air drag as well as the power. At high speed the air drag has a large effect on the available acceleration.
24. The Effect of CG Location on Dropped Throttle in a Turn When the throttle is lifted in a turn, several things happen at once. Load is
shifted onto the front wheels and off the rear wheels by engine braking. The CG height, wheelbase, and the motoring torque determine the amount of load shifted. The immediate effect of this load shift is to increase the front tire lateral force and decrease the rear lateral force. The key here is “immediate” because the load shift happens quickly enough that the tire slip angles stay the same. A careful look at tire data will show what is happening. The result is that the front end “tucks in” and/or the rear end comes out. In extreme cases the car will spin if the driver does not take corrective action. Lowering the CG reduces this effect.
25. The Effect of Ride and Roll Steer on Dropped Throttle in a Turn When the throttle is dropped, the car pitches forward. It is possible to arrange
the ride steer to change the wheel steer angles on pitch to reduce the effect of dropped throttle. Toe-out with bump travel on the front end will reduce the steer angle on the outside front wheel. This will reduce the front side force and lower the amount of tuck in. In moderate turns, some toe-in on rebound at the rear will reduce the effects of dropped throttle as well.
At high lateral accelerations it is not so easy to correct dropped throttle ef-fect with ride steer. The rear tire slip angles need to be increased to give more lateral force to make up for the decrease in load. The problem is that the tire is almost at its peak already and increasing the slip angle may not increase the side force available. The problem with ride/roll steer is that it is undesirable for much of the rest of operation. In general, geometric and compliance steer effects are ineffective at high lateral accelerations.
26. The Effect of Differential Type on Dropped Throttle in a Turn The differential type affects dropped throttle behavior. An open differential that
distributes the torque evenly from side to side will probably have the least effect on dropped throttle behavior. A differential that remains locked (possibly due to some preload) when throttle is dropped produces a stabilizing yawing

DeskTop FastLap5 & FastLapSim5 Vehicle Simulations—��7
The Handling Clinicmoment or “yaw damping” moment. Some limited slip differentials may put shock loads into the drivetrain when they lock and unlock. This can have effects that are hard to predict.
27. The Effect of Dampers on Dropped Throttle Behavior When the throttle is dropped in a turn the body of the car pitches forward
and the loads on the front and rear track change over a short period of time. Soft dampers will stretch out this transient and the dropped throttle response will not be so sudden. Overall, however, soft dampers can have an adverse effect on control.
28. The Effect of CG Location While Braking in a Turn When the brakes are first applied, a large amount of load shifts from the rear
to the front axle. This changes the tire operating loads and side forces and the car tucks in. Lowering the CG reduces the load change on braking.
29. The Effect of Brake Balance While Braking in a Turn The large transient effect of brake application is to transfer load forward and
change the loads on the tires. Brake balance also can affect this transient through the friction ellipse effect. If the rear of the car is “coming around” too much on brake application, shifting the brake balance forward will reduce the side force available from the front tires and effectively increase the side force at the rear. Lockout or proportioning valves can change this behavior but require adjustment for different track friction coefficients.
30. The Effect of Steering Axis Geometry on Poor Road Behavior Kingpin inclination and kingpin lateral position determine the scrub radius
measured at the ground. It has become popular to design FWDs (in particular) with “negative scrub radius.” This tends to stabilize the car in straight running when the two wheels are on different coefficient surfaces under braking or fraction. For poor road straight running this is probably a good thing.
Non-driven front axles ideally have a small scrub radius. This reduces steering mosques due to one-wheel bumps. Unfortunately, large brakes and suspen-sion links often conflict with centering the tire print on the kingpin. In this case the steering system must be designed to accept these shock loads.
The caster angle and longitudinal kingpin location determine the trail. The trail is commonly measured on smooth surfaces but on rough roads the tire contact patch can effectively move forward and the trail disappear or reverse. To avoid this, extra trail may be an appropriate modification for cars that have little to start with.
3�. The Effect of Ride or Roll Steer on Poor Road Behavior Ride steer is a geometric effect which results in the wheels steering with ride
motion. Ride/roll steer is often built into production cars to influence low lat-
��8—DeskTop FastLap5 & FastLapSim5 Vehicle Simulations
The Handling Cliniceral acceleration handling. Small changes in the wheel steer angles will have little effect on the limit handling because the tires are nearly saturated. What ride steer will do is steer the car with bump travel when traveling straight; this is why most racing cars have been bump steered, the name given to the process of adjusting the steering linkage to minimize bump steer. This is especially important if the ride height has been changed from stock or the suspension geometry modified.
Ride steer and roll steer are closely related but they load the steering sys-tem (and box/rack mounts) in different directions depending on the detailed geometry. If there were no compliance in the steering system or suspension, ride steer and roll steer would be just a function of the wheel ride position to the chassis. In reality this is not often true.
32. The Effect of Ride Rates on Poor Road Behavior The spring rates or ride rates must be chosen to match the terrain and the
wheel travel must be chosen at the same time. A reasonable ride rate will keep the suspension off of the bump stops most of the time but not be so stiff that the bump stops are never reached (except on very smooth tracks). In fact, progressive bump stops may be considered part of the spring rate a highly nonlinear part. Contact with a solid bump step is upsetting to the ear in any circumstance.
If nonlinear ride springing is used (often through “rising rate” geometry) it has the effect of a smoothly progressive bump stop.
33. The Effect of Ride Height on Poor Road Behavior If the car is lowered it is likely that there will be less suspension travel. To
keep from bottoming on rough roads, the spring rate must be raised or the dampers stiffened. This in turn will change the ride and handling. Changing the ride height (up or down) will often change the ride steer or ride camber characteristics.
34. The Effect of Dampers on Poor Road Behavior The best damper settings (adjustable dampers) for rough road will control the
body motion to keep the car fairly level but allow the suspension to follow the surface. Dampers adjustable in bump and rebound separately are best for this. It can be difficult to sort out the difference between dampers that are too stiff and springs that are too stiff.
35. The Effect of Steering Axis Geometry on Steering Wheel Force and Ra-tio
Steering forces (with manual steering) at the steering wheel come from the tire self-aligning torque, from the mechanical trail, and from steering gear friction. The forces at the wheels are divided by the steering ratio before they reach the driver; the forces can be very large at the front wheels in a turn.

DeskTop FastLap5 & FastLapSim5 Vehicle Simulations—��9
If any aspects of the steering geometry are changed it is likely to affect the steering force characteristics.
Some examples: If caster angle is increased the self-centering torque will increase. If kingpin inclination is changed the rise and fall of the front end with steering will change this may affect steering forces at low lateral accel-erations. The rise and fall of the wheels changes the diagonal wheel loading similar to “wedge.” If the scrub radius is changed the parking-lot-speed force levels will change. Simple changes like tire diameter, wheel offset, and ride height will affect the front-end geometry. If the steering ratio is not satisfac-tory, the steering arm(s) length can be changed. Bump steer may be changed by steering arm changes; in particular, changing outer ball joint height is a standard method of changing ride steer.
36. The Effect of Tire and Rim Sizes on Steering Wheel Force and Ratio Changes in tire cornering stiffness change the effective steering ratio. A tire
that has a steep cornering force curve needs less slip angle for a given lateral force than a softer tire. The steer angle required for a given comer is the sum of the Ackermann angle (depending on radius-of-turn and wheelbase) and the slip angle; reducing the slip angle required “speeds up” the steering. Simply changing the rim width can change the cornering stiffness; changing to larger size or wider tires will likely raise cornering stiffness. Steering wheel force will be affected if tires are fitted that have different aligning torque characteristics.
37. The Effect of Steering Axis Geometry on Steering Kickback In general, race cars with little scrub radius will track well over rough roads.
On smooth tracks, larger scrub radius (perhaps due to interference between wheel/knuckle/ brakes) can be tolerated.
For the special case of FWDs, a slight amount of negative scrub radius gives the steering a self-correcting feature in straight line operation. If one wheel has more fraction than the other while accelerating or braking, it would tend to yaw the car, but the difference in tractive force turns the front wheels slightly to compensate. This may result in small steering wheel motions on rough or slippery surfaces but the car will tend to keep tracking straight. For a front-drive race car with high power, negative scrub radius may not be so desirable because of combined cornering and braking/accelerating. The heavily loaded outside wheel will dominate the steering force and the driver may be fighting the wheel with power changes. Moving toward centerpoint steering will improve this.
38. The Effect of Differentials on Steering Kickback For FWD race cars. If any limited slip differential is fitted that locks-up or
unlocks suddenly, it will be reflected to the steering. If there is any scrub radius, the change in drive torque will produce a torque about the kingpin
The Handling Clinic

�20—DeskTop FastLap5 & FastLapSim5 Vehicle Simulations
which will be noticed at the steering wheel. Even with centerpoint steering a change in engine torque will change the tire self-aligning torque and this will change the steering force in a turn.
39. The Effect of Tire and Rim Sizes on Steering Kickback The early wide street tires had a tendency to “nibble”; that is, follow longi-
tudinal ridges in the road. While this has been improved, the current use of very wide tires has brought it back. If this is a problem, little can be done but play with tire pressures or change to narrower tires.
Using Table 3—Secondary Setup Guide
Table 3 refers to the numbered and lettered paragraphs that follow. This table shows some side effects that can occur from a change in setup. To use the table, enter on the left side with the proposed change and then refer to the lettered items to see the effect of this change on the various aspects of performance listed across the top of the chart. If nothing else, the wide variety of effects and consequences should highlight the fact that setup is all about compromise.
�. Moving the CG PositionA Straight line braking will be best when the tires are evenly loaded. This means
an aft CG is best for equal-sized tires. For a forward CG, larger front tires are needed for best braking. A lower CG will reduce weight transfer.
B Lowering the CG will reduce weight transfer (and improve performance) on turn entry (combined cornering and braking). The outside front tire will be the most heavily loaded. The best CG position is again aft for equal-sized
The Handling Clinic
Table 3—Secondary Setup Guide Key
Steady-State Characteristics Transient Characteristics Control CharacteristicsStraitLine
Braking
Braking &Cornering Cornering Acceleration &
CorneringStrait Line
AccelerationHigh-speed
Stability Turn-InDropped
Throttle ina Turn
Brakingin a Turn
RoughRoad
Tracking
RoughRoad
Cornering
SteeringForce
and Ratio
SteeringKickback
�. CG Position A B C D E F G H I J K L M
2. Roll Center Location A B C D E F G
3. Anti-Pitch Geometry A B C D E F
4. Steering Axis Germ A B C D E F G H
5. Camber Effects A B C D E F G
6. Ride/Roll Steer A B C D E F G H I J K
7. Differential A B C D E F G
8. Track Width A B C D E F
9. Tire & Rim Sizes A B C D E F G H I J
�0. Ride Spring Rates A B C D E F
��. Roll Stiffness and RollStiffness Distribution A B C D E F G H I

DeskTop FastLap5 & FastLapSim5 Vehicle Simulations—�2�
tires, and moves forward as the front tire size is increased.C The highest lateral acceleration (best steady-state cornering) will be had with
a neutral car. For equal-sized tires this is easiest with a CG near center.D For best acceleration out of a corner, wheel spin must be avoided. This implies
a rearward CG position for RWD and a forward CG position for FWD. The FWD has a conflict with A-C above; higher-powered FWDs will need more weight forward; the acceptable range seems to be 60% to 70% (or possibly more) load on the front wheels as the power-to-weight ratio goes up. The upper end is appropriate for cars with 10 lb./hp or less.
E Again, the CG must be toward the drive wheels for fraction.F High-speed straight line stability implies understeer in the low lateral ac-
celeration range. A CG forward of the neutral steer point is understeer and stable.
G Turn-in (transient response to step steer) will be improved as the CG is moved forward and the front tires do more of the cornering.
H Dropped throttle tuck-in will be reduced by lowering the CG.I Braking in a turn will result in tuck-in if the brakes are balanced aft. Lowering
the CG will reduce the load shift when the brakes are applied, and reduce the size of the transient.
J Rough road tracking calls for an understeering configuration forward CG location.
K Rough road cornering setup will depend on driver style. For those who are content to plow around comers, a forward CG is appropriate. If a tail-out attitude is desired a more central CG location is called for.
L Moving the CG forward will increase the steering force at low speeds (park-ing) and also in corners as there is more lateral force at the tire and thus more moment about the kingpin.
M If a front-drive car is lowered to lower the CG, the driveshaft angles will change. This means that different amounts of torque reaction (likely more) will be present at the hub and thus in the steering. If the driving torque var-ies from one side to the other, kickback in the steering will be present.
2. Moving the Roll Center PositionsA Lowering the front roll center or raising the rear will make the rear take more
roll couple and the rear will saturate sooner. Balancing the brakes to give more on the rear may have the same effect.
B As 2A but not confused with brake balance. The roll center locations will probably not be easy to change once the car is built; they need to be con-sidered at design stage.
C For best acceleration for a FWD car out of a comer the front wheels need to be evenly loaded. This will happen if the rear is taking as much roll couple as possible, when the inside rear wheel is off the ground. A rear roll center higher than the fort will help achieve this. The situation far the rear drive is just opposite.
The Handling Clinic

�22—DeskTop FastLap5 & FastLapSim5 Vehicle Simulations
D During turn-in, the roll center heights determine the proportion of lateral load transfer that is passed through the suspension linkage. The rest of the load transfer is passed through the springs and anti-roll bars as the vehicle rolls. Raising the roll centers gives an anti-roll effect and reduces body roll. High roll centers lead to jerking (the whole car rises when lateral force is applied) and lateral wheel travel on bump; these are undesirable.
E Dropped throttle tuck-in will be improved if the rear roll resistance is reduced or the front increased. This can be done by lowering the rear roll center or raising the front roll center. This will make the car more understeer; more of the total roll moment will be resisted on the front.
F Tuck-in under braking la a turn is similar to dropped throttle. The problem is always present in cars that are balanced near neutral steer at zero longi-tudinal force. In FWDs there are conflicting requirements for fraction out of the corner which call for even front wheel loads (low roll center height).
G Rough road tracking will be best when the suspension contributes the mini-mum disturbance to the vehicle. Roll centers near the ground give low lateral wheel motion with ride travel and minimize lateral “shake” on rough roads.
3. Changing the Anti-Pitch GeometryA Adding some anti-dive to the front will reduce the pitch down on braking;
likewise anti-lift will stop the rear from rising on braking. Anti-pitch is roughly analogous to the anti-roll effect that comes from raising the roll centers. The body attitude (pitch) will have little effect on the amount of braking available unless the car pitches so much that the suspension travel is used up and the wheels are against the bump stops; tire fraction decreases when the load is fluctuating. Some dive is desirable as a cue to braking level, according to competition drivers.
B Anti-dive geometry puts braking loads through the suspension and tends to add stiction to the suspension. This is usually not desirable.
C Anti-squat (RWD) and Anti-lift (FWD) geometry is similar; engine torque reac-tion changes the ride height. Some FWD sedans come with the opposite the suspension pickup points are such that the front wheels move back on bump travel. This is done to improve ride but has the side-effect that the front end rises on acceleration. Excessive pitch on turn exit is probably undesirable.
D Anti-pitch geometry affects the absolute amount of fraction available on a rear drive in two ways. By increasing the transient loading on the drive wheels it may help prevent wheel spin, and by raising the CG height it promotes rearward weight transfer. Tractive force “antics” work on engine torque reac-tion. On RWDs, the front end will rise on acceleration since no anti-effect can be incorporated. On FWDs, the rear end will lower on acceleration for the same reason.
E The transient when braking in a turn will be more sudden if anti-dive is added. With more anti-dive, more of the load shifted to the front wheels (from the rear wheels) will be carried in the suspension members and less in compres-
The Handling Clinic

DeskTop FastLap5 & FastLapSim5 Vehicle Simulations—�23
sion of the springs.F When anti-dive/lift is added to the front suspension, it may have the side-effect
of changing the trail and/or caster angle with bump travel. This will change the steering force with ride height not desirable.
4. Changing the Steering Axis GeometryA In combined braking and cornering the outside front wheel is heavily loaded
and it will dominate the steering torque. In conventional FWDs, negative scrub radius (kingpin axis intersects the road outside of the center of the tire patch) will tend to give steering in the oversteer direction. The opposite is true of positive steering offset, as used in most rear-wheel-drive cars.
B In steady cornering the trail and the pneumatic trail (aligning torque) deter-mine the steering force. More trail equals higher force level and more spin back. Too much trail will mask the aligning torque. The self-aligning torque is a valuable signal of front tire breakaway; it first increases with lateral force and then decreases or reverses as the tire reaches its limit. With a modest amount of trail the driver can sense this as a reduction in steering force.
Reverse-Ackermann geometry (usually obtained with the steering linkage in front of the front axle) will give more steer angle to the outside front wheel than the inside. This is appropriate for high-performance use because the outside wheel has more load on it and reaches its peak at a higher slip angle than the inside, lightly loaded wheel. With conventional Ackermann steering geometry the inside front tire is dragged around comers at a slip angle over its peak. Parallel steering may be a reasonable compromise for cars that will be street driven. Reverse-Ackermann results in high rolling resistance at low lateral accelerations.
C For FWDs, as in the braking case, negative scrub radius is not useful when accelerating out of a turn. In this case the outside wheel dominates and steers in the understeer direction the FWD is almost certainly understeering enough at this point already.
D For high-speed stability in the presence of road disturbances, zero or slight negative scrub radius is desirable.
E In tight turns, turn-in will be helped if the kingpin inclination (front view) and the caster angle (side view) are large. This gives negative camber with steer on the outside wheel which helps front adhesion. It is important to put this in perspective by finding out just how much steer the driver uses on the track; the effect is very small at small steer angles.
F Rough road tracking is good with negative scrub radius. A random longitudinal bump load on a front wheel will tend to yaw the car and at the same time the wheel will steer to counteract the yaw moment.
G Steering force goes up as trail is increased. Steering force at parking speeds goes up as scrub radius decreases highest at centerpoint steering. If the steering arm is changed in length, the steering ratio is changed and it is likely that the amount of Ackermann (or reverse Ackermann) is changed.
The Handling Clinic
�24—DeskTop FastLap5 & FastLapSim5 Vehicle Simulations
H As the scrub radius moves away from centerpoint steering the amount of steering kickback will increase.
5. Changing the Camber—Note: Camber effects are much less with radial tires than with bias tires.
A The camber on turn entry is affected by the roll camber, ride camber, lateral force compliance camber, steer-camber (on the front), and the static cam-ber. It is unlikely that the camber will be correct over the range of combined operation, from hard braking/light-cornering to hard cornering / light braking. It is common to use temperature across the tread as an indicator of a good camber setting but this is only an average of a range of conditions.
B Camber has been found to affect tire performance over the whole slip angle range. The correct negative camber will optimize the tire lateral force. For oval tracks or other circuits where the car turns one way, both wheels can be “leaned into the turn.”
C On turn exit, plow is often the problem. The actual camber is a function of those items mentioned in A. above. Ideally the camber would change from best camber for cornering at the apex to zero for acceleration once the turn is finished. In reality the tire is not often at “best camber.”
D Camber thrust increases with load. Consider a pair of negatively cambered front wheels: when a disturbance transfers some load to, say, the left wheel, the left tire camber thrust to the right increases and the car starts to turn right. This in turn increases the load transfer to the left and so on. To counter this tendency to wander, a little toe-out is often necessary (depending on the tire construction this might be on the order of 10% of the camber angle).
E For best turn-in the front tires probably want to be at best camber before the turn starts. This implies that static camber be set fairly high. If the turn is initiated under braking the ride camber from pitch down will add.
F If the suspension design gives much camber change with ride travel the camber thrust that results will give poor rough road tracking.
G If the suspension design gives camber change on bump travel the steering will kick back (or possibly tramp/shimmy) over bumps. This is because the wheels act as gyroscopes and the reaction torque to a camber change is around the kingpin. This is a problem with suspension designs that have rapid camber change with one wheel bump, like solid axles and swing axles; it is also possible to get short swing arm lengths with independent designs in the search for “camber compensation” to correct for camber `lost” due to body roll angle.
6. Changing the Ride/Roll Steer CharacteristicsA Under hard braking, ride steer will only disturb the car. If the wheels steer
(toe) with dive (on the front due to braking) they will be using up some of the friction circle fighting against each other.
B Roll and ride steer will change the attitude of the car in racing-turn entry
The Handling Clinic
DeskTop FastLap5 & FastLapSim5 Vehicle Simulations—�25
but the tire slip angles (except for effects that steer one side more than the other) will stay the same. This is not the case for maneuvering below the limit where the under/oversteer can be greatly modified by ride and roll steer.
C In limit cornering, steering the wheels with tell steer (front or rear wheels) will simply cause the car to corner at a different attitude angle to the path. In sublimed maneuvers, it is this reorientation of the car that drivers sense as roll understeer or roll oversteer.
D In turn exit (at the limit), the front tires will be saturated due to light load (un-less fraction is broken with excess power on the rear). Changing the angles of front or rear wheels will not change the fact that the rear tires still have margin left while the front tires are limiting.
E As in braking, it is important that the tires are pointing straight ahead for best traction. Any ride steer with pitch (due to longitudinal acceleration) will only hurt performance.
F If the front wheels steer on one wheel bump (ride steer) the car will not track well, especially if high cornering stiffness tires are fitted. With racing tires, small steer angles can give surprisingly large side forces.
G Roll steer can modify the amount of steering required for turn-in. To give an example, as a car with roll understeer is turned-in it begins to roll, the body-roll steers the wheels out of the turn, and the driver must add more steering to compensate.
H At lower lateral accelerations, ride/roll steer can influence dropped throttle behavior. When the throttle is dropped in a turn, the car pitches forward and roll understeer (front end) will correct for the tuck-in. At high lateral accelera-tions, steering on the rear will have little effect the rear tires are unloaded and will be at or near their limits. Roll understeer on the front may tend to alleviate tuck-in.
I Ride/roll steer can affect the car while braking in a turn if the tires are not saturated (low braking and lateral forces). The situation is similar to dropped throttle. In maneuvers near the friction circle limit, roll understeer will have some effect if used on the front of the car. Load and camber are the variables that affect the size of the friction ellipse, not steer angle.
J Ride or bump steer is very distracting when trying to negotiate a rough road, especially with tires that have high cornering stiffness.
K For rough road cornering some roll understeer may be desirable. As an outside tire hits a bump the load on it (and the side force it is producing) increases. If the front wheel steers out as it moves up it will tend to compensate and the car will tend to hold a smooth path. On the rear, toe-in with bump has a similar effect.
7. Different Types of DifferentialA When accelerating out of a comer the drive wheels are unevenly loaded
and traction on the inside wheel is limited to a lower value than the outside wheel. Different types of differentials are available which may help in this
The Handling Clinic

�26—DeskTop FastLap5 & FastLapSim5 Vehicle Simulations
situation. Ideally, both drive wheels would be fitted with an anti-spin device that would apply the maximum driving torque to each tire, given the load and slip angle of operation. The inside wheel wants to be at a lower rpm (less load and smaller radius of travel) than the outer but this seems to be beyond the computation ability of mechanical devices. The best that limited slip differentials will do in this situation is lock the two axles to the same speed. The worst type of differential for this situation is the standard “open” type; it will allow the inside wheel to spin up and limit the driving torque on each wheel to that of the spinning wheel.
B For independent suspensions the differential is less critical for straight line acceleration. Loads on the tires are even (independent suspension) and the same torque is applied to each axle. If the two wheels are locked together, small differences in tire size may steer the car. This acceleration-torque-steer is found primarily on FWDs due to compliance and asymmetry in the steering and suspension.
For solid axle suspension, the wheel loads are uneven on acceleration un-less some torque reaction device is used. A limited slip differential or spool certainly helps in this case.
C When the throttle is dropped in a turn, the front tires are loaded up and they produce more side force (destabilizing) than they did when the power was on. An open differential probably has the least effect in this situation; the driving torque (present before the throttle is dropped) and the motoring torque are split evenly between the drive wheels. If the drive wheels are locked (or partially locked) under power (by a limited slip differential, and they unlock when the power is removed (a characteristic of certain differentials), relatively more side force will suddenly be available. A differential that remains locked with the throttle dropped will add “yaw damping”
D While braking in a turn it is most desirable to have antilock. Barring that, a differential that keeps both wheels fuming at the same speed (regardless of braking) will help prevent lockup. This would be one of the fixed preload types of limited slip.
E For best rough road fraction (and probably directional control) some sort of antilock differential will keep an unloaded wheel from spinning up and then disturbing the car when it lands.
F For FWDs, a limited slip differential may be some help in rough cornering. On the minus side a differential that is locking and unlocking the front axle will make steering difficult. Ideally the limited slip differential would be smooth in operation.
G For FWDs, any type of differential that dynamically changes the torque on the two wheels will give a steering reaction. This reaction will add to any torque reaction caused by regularity of the driveshafts due to steer angle or other misalignment such as that caused by ride travel.
8. Changing the Track Width
The Handling Clinic

DeskTop FastLap5 & FastLapSim5 Vehicle Simulations—�27
A Increasing the track width reduces the load transfer on turn entry. With the tire loads more evenly distributed the tires can produce more force (load sensitivity).
B In steady-state cornering the track width and the CG height determine the total lateral load transfer. Increasing the track reduces the load transfer. This will improve lateral acceleration capability.
C If the track is increased the load transfer is decreased and this may allow more of the total roll resistance to be taken on the non-driving end of the car before wheel lift. This will give more equal loads on the drive wheels for acceleration on turn exit.
D Increasing the track will improve the braking in a turn performance by increas-ing the maximum lateral force available.
E Bumpy road tracking may not be improved by a track width increase. The yawing and rolling moment from hitting a one-wheel bump is increased and the car may tend to be re-aimed more severely than with a narrower track.
F Track width increase will help rough road cornering. More even wheel loads improve tire performance. Less lateral load transfer gives less body roll and this means there is more suspension travel available before hitting the bump stops.
9. Tires and RimsA-H Tires dominate racecar chassis setup. Small changes in tire performance
through tire (or rim) width, compound, pressure, camber, load, ambient and track temperature, stagger, etc., are always happening, even when not desired. In general, the end of the car that is limiting performance is the one that needs improved grip, and occasionally this can be found. If the car cannot be balanced by improving one end, it may be balanced by degrading the other end; this is commonly done by increasing roll stiffness, etc.
Improving the tire performance on the non-limiting end is less likely to im-prove overall performance, except on power-limited high-speed turns where any reduction in slip angles reduces the tire-induced drag.
I Steering torque at the kingpin (ignoring steering system losses) is a function of front end geometry and tire self-aligning torque. If the trail is not so large that it swamps out the self-aligning torque, changing tire size or construction will likely change the steering force characteristics. The effective steering ra-tio (at the steering wheel) includes the tire cornering stiffness. For example, radial tires usually have higher cornering stiffness than bias tires and they require less steering wheel motion for a given maneuver (at speed).
J Steering kickback can occur with very wide tires. This nibbling over ridges in the road was severe in the past but has been much improved by changes in tire design. Very wide (50 or wider series) tires may still nibble in certain situations.
Often, wide rims have different offset than stock rims and do not preserve the original scrub radius. If the center of the print is not near the kingpin
The Handling Clinic

�28—DeskTop FastLap5 & FastLapSim5 Vehicle Simulations
intersection with the ground, steering kickback can be expected on rough roads.
�0. Changing the Ride Spring RatesA-C Ride spring rates affect the lateral load transfer distribution. Lowering the
ride rates on one end will even out the loads on that end (assuming that both wheels are on the ground) and this will raise the lateral force available from that end of the car. Stiffer springs than fitted to production cars generally limit the amount of body motion in pitch and roll and this is desirable for racing. Race cars often wind up with the non-driven end very stiffly sprung relative to the driven end; this keeps drive wheels more evenly loaded for fraction.
D Stiffer springs will speed up the response in turn-in. With stiffer springs the car does not take as long to get to steady-state roll angle and this aspect of the transient is improved. For cars that have poor suspension geometry (excessive ride steer and ride camber), stiffening up the springs effectively removes some of the “disturbance” from these effects.
E For rough road operation spring rates are very important. It is necessary to take advantage of all of the suspension travel to keep the wheels on the ground as much as possible. If a flat ride (that is, the car lands flat after crossing a bump) is desired the spring rates must be adjusted to give slightly higher undamped natural frequency on the rear than on the front, i.e., ap-proximately 10% stiffer on the rear. This often is not possible because of the high front spring rates required for front roll stiffness.
F Rough road cornering is influenced by the smooth surface behavior (under/oversteer). However, if one end of the car is more stiffly sprung or has higher unsprung weight, the wheels on that end will spend less time on the ground and that end will limit performance. If the springs are not stiff enough the car may hit the bump stops with a combination of roll in a turn and one wheel bump.
��. Adjusting the Roll Stiffness and Roll Stiffness DistributionA If the car is loose on turn entry (and the driver cannot make use of this ef-
fect), more front roll stiffness (or less rear) will make the rear tire loads more equal and help the problem, if all four wheels are still on the ground.
B Adjusting the anti-roll bars is a common way to change the stability of a car in a steady turn. This works through the load sensitivity of the tires a pair of unevenly loaded tires has degraded lateral force performance compared to the same tires with the same total load split evenly between them. Thus, to degrade lateral force capability of the front end of a car the anti-roll bar is stiffened on that end. This works until the inside front wheel is off the ground and the front track can provide no additional roll moment.
C For best fraction on acceleration out of a comer the drive wheels need to be evenly loaded. Taking as little roll moment on the driven wheels as possible gives the desired affect- low roll stiffness on the drive axle. However, if the
The Handling Clinic

DeskTop FastLap5 & FastLapSim5 Vehicle Simulations—�29
roll resistance of the suspension is reduced too much, excessive body roll will become a problem.
D Anti-roll bars do not have much effect at low lateral accelerations (low amounts of lateral load shift to distribute between the front and rear tracks). If straight running is a problem, it is unlikely that changing the roll couple distribution will help.
E Stiffening the car in roll will improve turn-in by reducing the roll angle of the car (and the time to get the car set to a new roll angle).
F If the car has a large dropped throttle response, increasing its basic stability will give a greater margin before spin (by increasing the rear grip available). Higher front roll stiffness (or lower rear roll stiffness) will accomplish this. Higher total roll stiffness reduces transient response time by increasing the rate that load changes occur at the tires.
G Braking in a turn adds a large forward load shift to the lateral load shift due to cornering. This degradation of rear grip is sometimes used by drivers to get vehicle slip angle on turn entry. Roll stiffness tuning is effective in chang-ing the stability because it changes tire operating conditions, for example, increasing the roll stiffness will reduce the body roll angle and this in turn may give more favorable tire camber (and more grip).
H For best rough road tracking, little additional roll stiffness (beyond that from the ride springs) is desirable. Anti-roll bars attempt to force the wheels on an axle to move together; this reduces the independence of the suspension action and increases the one-wheel bump rate.
I The above is true for rough road cornering as well. Best grip is with the four wheels following the road. If the car rolls so much that suspension travel is used up on the outside wheels then the roll stiffness must be increased.
A CHECKLIST OF CAUSES AND EFFECTS
INSTABILITY Straight line instability— general
· Rear wheel toe-out - either static due to incorrect (or backwards) setting or dynamic due to bump steer and/or deflecting steer.
· Vast lack of rear downforce or overwhelming amount of front downforce.· Wild amount of front toe-in or toe-out.· Loose or broken chassis, suspension member or suspension link mounting
point.
Straight line instability under hard acceleration· Malfunctioning limited slip differential.· Insufficient rear toe-in.· Deflecting steer from rear chassis/ suspension member or mounting point.
Straight line instability—car darts over bumps (especially single wheel bumps)
The Handling Clinic

�30—DeskTop FastLap5 & FastLapSim5 Vehicle Simulations
· Excessive Ackermann steering geometry.· Excessive front toe-in or toe-out.· Uneven front castor/trail setting.· Uneven front shock forces, incorrectly adjusted bump rubbers/ packers.· Front anti-roll bar miles too stiff.· Insufficient rear wheel droop travel.Instability under the brakes—front end wanders· Too much front brake bias.· Excessive front damper rebound force.
Instability under the brakes—car wants to spin· Excessive rear brake bias. Unbalanced ride/ roll resistance - too much at the
rear.· Insufficient rear droop travel.· Excessive rear damper rebound force.· Insufficient rear negative camber (usually in combination with one or more
of the above).
RESPONSE Car feels generally heavy and unresponsive
· Tire pressures too low.· Excessive aerodynamic download (Note: If the car feels sluggish on accel-
eration at high speed, the culprit is often a rear wing Gurney lip that is too high).
Car feels sloppy; slow to take a set in corners; rolls a lot; resists changing direc-tion
· Insufficient damper forces.· Car too soft in ride and/ or roll.· Insufficient tire pressure.
Car responds too quickly—has little feel—slides at slightest provocation· Car too stiff for inexperienced driver.· Excessive ride or roll resistance.· Excessive tire pressure.· Excessive rear toe-in.· Excessive damper forces.· Insufficient downforce.
UNDERSTEER Corner entry understeer—car won’t point in and gets progressively worse
· Excessive front tire pressure.· Insufficient front track width (compared to rear).· Excessive front roll stiffness. Front roll center too high or too low.
The Handling Clinic

DeskTop FastLap5 & FastLapSim5 Vehicle Simulations—�3�
The Handling Clinic· Insufficient front damper bump force.· Insufficient front downforce. Excessive dynamic positive camber on laden
(outside) front tire.· Braking too hard and too late.· Insufficient front roll resistance — car may be falling over onto outside front
tire due to insufficient front track width or diagonal load transfer under trail braking. Understeer can often be cured by increasing front roll resistance even though doing so will increase the amount of lateral load transfer.
Corner entry understeer—car initially points in then washes out· Excessive front toe-in or toe-out.· Insufficient front wheel travel in droop (non droop limited cars only).· Insufficient front damper bump resistance.· Incorrectly adjusted packers (car rolls onto the packers). Nonlinear load transfer
due to the spring/ bar geometry, to roll center migration or to incorrect roll axis inclination.
Corner entry understeer—car points in and then darts· Incorrectly adjusted packers (see above).· Insufficient front wheel travel.· Nose being sucked down due to ground effect.· Excessive Ackermann steering geometry.
Corner exit understeer—slow corners· Big trouble! Often a function of excessive corner entry and mid-phase under-
steer followed by throttle application while maintaining the understeer steering lock. This causes the driving thrust on the inside rear tire to accentuate the understeer. The first step must be to cure the corner entry understeer.
· Can also be caused by unloading the front tires due to rearward load transfer on acceleration. Increasing the rear ride rate or anti-squat and/ or reducing the front damper low piston speed rebound force usually helps
OVERSTEER Corner entry oversteer
· Severe rearward ride rate/ roll resistance imbalance.· Diabolical lack of rear downforce.· Severely limited rear wheel droop travel.· Broken or non-functioning outside rear damper or front anti-roll bar.· Note: A slight feeling of rear tippy-toe type hunting on corner entry can be
due to excessive rear toe-in or to excessive rear damper rebound force.
Corner exit oversteer—gets progressively worse from the time that power is ap-plied
· Worn out limited slip differential.

�32—DeskTop FastLap5 & FastLapSim5 Vehicle Simulations
The Handling Clinic· Insufficient rear spring, bar or shock (low piston speed bump control) allowing
car to “fall over” onto outside rear tire.· Excessive rear roll stiffness.· Excessive rear negative camber.· Too little rear toe-in.· Insufficient rear download.· Note: If car feels as if it is sliding through the corner rather than rolling freely,
reduce the rear toe-in and see what happens.
Corner exit oversteer—sudden—car takes corner then breaks loose at exit· Insufficient rear suspension travel (lifting the inside tire due to droop limitation
or bottoming the outside wheel due to bump limitation.)· Dead rear damper.· Incorrectly adjusted packers.· Sudden change in outside rear tire camber.· Too much throttle applied after driver’s confidence level has been boosted
by car taking a set.
Does not put power down on the exit of smooth surface corners· Excessive low piston speed bump force on rear damper.· Excessive rear tire pressure.· Excessive rear roll resistance (probably from bar rather than springs).· Tires gone.· Excessive rear dynamic negative camber – either from download or from
camber change on squat.
Does not put the power down on the exit of bumpy corners· Any or all of the above.· Excessive rear low piston speed damper force.· Excessive rear rebound force jerking the car down and losing compliance.· Insufficient rear droop travel.
Understeer in, snap to oversteer on power application—the most important complaint of all!· Too little front roll resistance — falls over on turning then snaps.· Front anti roll bar plus front spring or (quick indication) front bump setting.
Stiffening front anti roll bar will transfer load back onto inside rear tire on corner exit.
· If above cures understeer but the car still snaps, it is almost certainly falling over at the rear on longitudinal/ diagonal transfer. Can add rear anti roll bar or rear spring. Rear anti roll bar will transfer load away from inside rear tire. Spring will not. Spring will decrease fraction over exit bumps, bar will not.
· Check for proper inflated shape of front tires.· Loose anti roll bar linkage/ blade sockets can have same effect.

DeskTop FastLap5 & FastLapSim5 Vehicle Simulations—�33
ROAD-RACE GLOSSARYROAD-RACE GLOSSARY2
2-cycle—The most common type of engine used in karting. 2-cycle engines need special fuel which contains oil in order to lube the internal components and bearings, since it does not have its own separate engine oil system like a 4-cycle engine.200 Mph Tape—Also known as “racer’s tape.” Duct tape so strong it will hold a banged-up race car together long enough to finish a race.
44-cycle—A type of engine used in most racing classes.
AAckerman—The Ackerman effect is the increase of toe-out on the front wheels as the wheels are turned in a curve. The toe-out increase is reverse-proportional to the turn radius, i.e. the steeper the curve, the more toe-out. Just optically the effect seems to be that the inside front wheels appears to turn ‘more’ than the outside front wheel, which is in line with the observation that the inside front wheel actually needs to traverse a tighter curve than the outside wheel. It depends on the track if you really need Ackerman steering or not. Adhesion—See stickiness. Aero Push—When following another car closely, a vehicle does not get as much downforce on the front of the car and thus it doesn’t turn in the corners well. Aerodynamic Drag—This indicates how well a car travels through the air and the resistance it offers.Aerodynamics—As applied to racing, the study of airflow and the forces of re-sistance and pressure that result from the flow of air over, under, and around a moving car.A-Frame—Either upper or lower connecting suspension piece (in the shape of an A) locking the frame to the spindle. Air Box—Housing for the air cleaner that connects the air intake at the base of the windshield to the carburetor. Air Cooled—An engine that radiates off excess heat to the surrounding air. These engines typically have fins to accomplish this. Air cooled engines are simpler than water cooled engines, but are typically louder as well and are overheating more easily.Air Filter—A device to filter the air before it enters the carburetor. There are foam

�34—DeskTop FastLap5 & FastLapSim5 Vehicle Simulations
Road-Racers Glossaryfilters, wire-mesh filters, and some people just have a sock over the carburetor. There are advantages and disadvantages to all of these means. The wire-mesh filters ap-pear to be most common these days. Paper gauze, or synthetic fiber element used to prevent dirt particles from entering the engine. Located in the air box. Air Dam—A metal strip that hangs beneath the front grill, often just inches from the ground. The air dam helps provide aerodynamic downforce at the front of the car. Alignment—The positioning of the front wheels relative to each other. There may either be toe-in or toe-out. Altered—A class of drag racer that starts with an automobile body and can then be modified.Alternator—A belt-driven device mounted on the front of the engine that recharges the battery while the engine is running. Apex—The inside portion of a curve where the vehicle should be closest to the curb in order to take the fastest way around the track. This is often, but not always, the geometric center of the turn. Hitting the apex just right will be an important art to learn for every new driver. Driving a late apex, i.e. hitting the inside curb after the geometric center of the turn, will often result in higher lap-times, while hitting the apex early will often result in disaster. Certain track characteristics might warrant a late apex or early apex, though. Strictly speaking, the apex is actually always the geometric center of the bend. But drivers tend to use this term to describe the clipping point, i.e. the point where the car is closest to the curb and travels the slowest.A-Post—The post extending from the roof line to the base of the windshield on either side of the car. Apron—The paved portion of a racetrack that separates the racing surface from the (usually unpaved) infield. Asphalt oval—As the name implies, racing on an oval track, made from asphalt. See speedway. Asphalt racing—Racing on a hard, smooth surface (asphalt, concrete) as compared to dirt racing. Slick tires are used.Autocross—A gymkhana: sometimes used to mean a gymkhana that allows greater speed than usual.Axle—Rotating shafts connecting the rear differential gears to the rear wheels. Can also refer to the front or rear mounting points of the wheels.
BBack Marker—A slower car that is running near the rear of the field. Back Off—To slow down; often said of a driver who is attempting to pass and realizes he can’t make it, so he “backs off” to try again later.Ballast—See weight. Banking—The sloping of a racetrack, particularly at a curve or corner, from the apron to the outside wall. Degree of banking refers to the height of a track’s slope at its outside edge. Banked turn—A turn that’s inclined so the outside area is higher than the inside area.Battery—Part that supplies electrical power to the engine.

DeskTop FastLap5 & FastLapSim5 Vehicle Simulations—�35
Road-Racers GlossaryBead breaker—A tool for dismounting tires from wheel rims. Bend—A shallow turn.To damage a car slightly.Bear grease—Slang term used to describe any patching material used to fill cracks and holes or smooth bumps on a track’s surface. Can also be used as a sealer on the track. “Be” housing—A cover, shaped like a bell, that surrounds the flywheel/ clutch that connects the engine to the transmission. Behind The Wall—When a car is behind the pit wall because of significant damage that can’t be fixed on pit road. Bias-ply—Layers of fabric within a tire that are woven in angles. Also used as a term to describe tires made in this manner.Big banger—A powerful engine; one with a large volume of displacement, usually more than 350 cubic inches.Big bore—See Big Banger.Binders—The brakes. Bite—This term has two different meanings, first, “Round Of Bite” describes the turning or adjusting of a car’s jacking screws found at each wheel. “Weight jacking” distributes the car’s weight at each wheel. Second, it can be the adhesion of a tire to the track surface. Black flagging—A black flag is show to a driver by race officials when he/she is disqualified, i.e. needs to end the race instantly. This typically happens as a result of a rules violation. See also flag man. Blades—Another term for torsion bars. Bleeder valve—A valve in the wheel used to reduce air pressure in tires.Blend—A racing fuel combining methanol and nitromethane.Blend line—Line painted on the track near the apron and extending from the pit road exit into the first turn. When leaving the pits, a driver must stay below it to safely “blend” back into traffic. Blip—To race an engine intermittently with repeated short bursts on the accelera-tor.Block—An engine’s cylinder block.To impede the progress of another racer.Blower—A supercharger.Blown motor—Major-league engine failure, for instance, when a connecting rod goes through the engine block, producing a lot of smoke and steam. Also refers to a turbo or supercharged engine.Blueprinting—What the engine builder does to a new, stock engine to make it competitive. It is a costly procedure (several hundred to more than a thousand dol-lars) in which the new engine is taken completely apart, and all parts are machined to the (hopefully allowable) limit, in order to get as much performance out of the engine as possible. Non-blue printed engines are often not competitive.Body work—Various pieces and panels attached to the vehicle. The amount and measurements of the body work may be regulated. The fabricated sheet metal that encloses the chassis. Bore—Pistons travel up and down within each cylinder, or bore, in the engine
�36—DeskTop FastLap5 & FastLapSim5 Vehicle Simulations
Road-Racers Glossaryblock. The diameter of the cylinder bore.Box—The transmission.B-Post—Post extending from the roofline to the base of window behind the driver’s head. Brake—The system to slow down a moving vehicle.Brake Caliper—The part of the braking system that, when applied by the driver, clamps the brake disk/rotor to slow or stop the car.Brake Disc—The brake disc is mounted on the wheel and rotates with the same speed. The disc is aligned to sit precisely between the two brake pads. The brake disc is also called the brake rotor. Brake Fade—Loss of braking effectiveness, usually caused by overheating.Brake Pads—There are typically two brake pads mounted to the calipers. When the brake is applied, the brake pads are pressed down by the calipers on the rotating surface of the brake disc. Through friction, the vehicle is slowed down.Brake Rotor—A different name for brake disc. Bubble—The last position on the starting while qualifying is going on; the driver in that position is said to be “on the bubble.”Bull ring—An oval track of a half-mile or less.Bump Drafting—The act of bumping the car in front of you while drafting. This gives the car in front extra speed that pulls along the entire draft.Buy the farm—To die in an accident.
CCalipers—The brake pads are mounted to them. The calipers are moved via hy-draulics which in turn presses the brake pads onto the rotating brake disc. Cam shaft—The opening and closing of the intake and exhaust valves is controlled by the cam shaft. The cam shaft rotates over the end of the valves, periodically pressing them close via eccentric lobes. Camber—Camber is the number of degrees that the top of the tire is tipped inward (negative camber) or outward (positive camber). It affects handling. The amount a tire is tilted in or out from vertical. Described in degrees, either positive or negative. Camshaft—A rotating shaft within the engine that opens and closes the intake and exhaust valves in the engine. Carb—Short for carburetor. Carburetor—A device connected directly to the gas pedal and mounted on top of the intake manifold that mixes the fuel with oxygen before it enters the cylinder in which it will eventually detonate. This mixing is necessary, since without oxygen there would be no explosion, or burning.Caster—Caster is the amount of degrees the top of the kingpin leans towards the rear of the kart. On some frames this is adjustable. It affects handling. Check out the description of kingpin for more information. CC—Cubic centimeters, the standard measure of displacement in Europe. A liter, 1000 cubic centimeters, is approximately 61 cubic inches.Chassis—See frame. Chassis Roll—As the car travels around corners at high speeds, the side of the

DeskTop FastLap5 & FastLapSim5 Vehicle Simulations—�37
Road-Racers Glossarycar facing the inside of the turn becomes lighter, causing it to rise up. The extra weight that shifts toward the outside of the car causes that side of the car to pitch downward. Checking Up—When a driver reacts quickly because of changing track conditions ahead such as a wreck. Checkered Flag—The flag of black and white squares that signals the end of a race.Chicane—A man-made corner set up to reduce speed at a certain point on a road track.CHT—The Cylinder Head Temperature.Chute—A racetrack straightaway. Cleaners —Various more or less poisonous substances which are used to remove dirt buildup, oil, grease and other stuff from parts and engine. Clutch—The clutch allows the engine and drive wheels to be disconnected (such as when idling at a stop) when disengaged, and the engine and rear wheels to be connected when fully engaged.Compound—Various types of tires will use different compounds, i.e. rubber mixtures. The compound determines the stickiness of the tire. A formula or “recipe” of rubber composing a particular tire. Different tracks require different tire compounds.Compression Gauge—A tool to measure the pressure in the cylinder at the top end of travel of the piston. Comparing this pressure to the baseline that was established for this kind of engine can give indications of the internal conditions of the engine. Low compression usually means poor performance. The tool is inserted in the slot for the spark plug after the plug was removed. Compression Ratio—Amount that the air-fuel mixture is compressed as the piston reaches the top of the bore. The higher the compression, the more the horse-power.Computer—These days more and more kart racers use computers to analyze their lap times and other data, just like the professional racing teams. Of course, the right software is needed. Computers are heavy equipment, so it is advantageous if the software runs on small and portable computers as well. Connecting Rod—A metal rod inside of the engine that connects the crankshaft to the piston. The purpose of the connecting rod is to translate the up-and-down motion of the piston into the rotational motion of the crankshaft.Contact Patch—The area with which a tire makes contact with the road surface. The larger the contact patch, the more grip the tire will develop. The load on the tire also determines the size of the contact patch. Cotter Pin—A pin made from a thick wire, folded such that one end of the pin will have two wire ends. The pin can then be used for the same purpose as safety wire, by bending the two wire ends apart, after the pin has been inserted into the hole, such that the pin can not slip out anymore. Cowl—A removable metal scoop at the base of the windshield and rear of the hood that directs air into the air box. C-Post—The post extending from the roofline of a racecar to the base of the rear window to the top of the deck lid.Crankcase—The part of the engine that houses the rotating crankshaft. On 2-cycle
�38—DeskTop FastLap5 & FastLapSim5 Vehicle Simulations
Road-Racers Glossaryengines which use the reed valve or rotary valve principle, it also contains the intake for the air-fuel mixture. The crankcase is located inside of the sump. The area of the engine block that houses the crankshaft.Crankshaft —The rotating shaft within the engine that delivers the power from the pistons to the flywheel, and from there to the transmission. Cross weight —In oval racing the weight is not evenly distributed across the frame since some wheels have to carry much more load than others. The percentage of weight on the right front vs. the left rear wheel is called the cross weight. Cubic-inch displacement—The size of the engine measured in cubic inches. The maximum size for a Nascar Busch Series, Grand National Divisions engine is 358.000 cubic inches. Cubes—Slang for Cubic inches of displacement, as in, “That car has 350 cubes.”Cylinder—Part of the engine in which the piston is moving up and down. The detonation of the air-fuel mixture takes place in the cylinder.Cylinder head—Made of aluminum, it is bolted to the top of each side of the en-gine block. Cylinder heads hold the valves and spark plugs. Passages through the heads make up the intake and exhaust ports.
DDeck lid—Slang for the trunk lid of a racecar. Dialed In—When a car is achieving optimum performance at a certain track. Dicing—Close, dangerous driving; from the notion that the driver is gambling with lives.Differential—The final link in the drive train, which transmits power to the wheels.Direct drive—When the crankshaft is directly connected to the rear axle.Dirt tires —Contrary to slicks, dirt tires have a profile which is useful when racing on mud, sand or dirt. See dirt oval. Dirt oval—As the name implies, dirt racing on an oval track, made from dirt or clay. See speedway. Dirt racing —Racing on dirt (sand, clay, mud) as compared to asphalt racing. Special dirt tires are used.Dirty air—Aerodynamic term for turbulent air currents caused by fast-moving cars that can cause a particular car to lose control.Displacement—A measure of an engine’s size. It’s the difference between the volume contained in the cylinders when the pistons are at the bottom of the stroke and the volume that remains when the pistons are at the top of the stroke. It can be calculated by multiplying bore times stroke times 0.785 times the number of cylinders.Display—Another name for the gauges which are typically attached to the steer-ing wheel.Donuts—Slang term for black, circular, dent-line marks on the side panels of stock cars, usually caused after rubbing against other cars at high speed.Downforce—A combination of aerodynamic and centrifugal forces. The more down-force, the more grip your car has. But more downforce also means more drag, which can rob a racecar of speed.
DeskTop FastLap5 & FastLapSim5 Vehicle Simulations—�39
Road-Racers GlossaryDownshift—Shifting from a higher to a lower gear, used in road racing to slow a car without any significant change in engine speed.Draft—Slang term for the aerodynamic effect that allows two or more cars traveling nose-to-tail to run faster than a single car. When one car follows another closely, the one in front cuts through the air, providing a cleaner path through the air; that is, less resistance, for the car in back.Drafting—When a vehicle takes advantage of another vehicle’s draft and thereby manages to either keep up with or even gain ground on the leading vehicle that is producing the draft. The second vehicle is said to be drafting. It is interesting that a drafting vehicle even increases the speed of the leading vehicle somewhat. The trailing vehicle’s presence in the relative vacuum produced by the first vehicle will straighten out the air turbulences behind the leading vehicle. These turbulences would otherwise have slowed down the leader.Drag—The resistance a car experiences when passing through air at high speeds. A resisting force exerted on a car parallel to its airstream and opposite in direction to its motion. Drift—A controlled, four-wheel slide through a turn, to get a car line up for a straightaway with a minimum of steering.Driveshaft—A steel tube that connects the transmission of a race car to the rear end housing.Drive train—The system that carries power from the engine to the driving wheels; it includes the crankshaft and the differential.Drivers meeting —The drivers’ meeting is where the participants on a race day are briefed about club rules and regulations. It is very important to attend this meeting since one might also receive information about schedule or rule changes.Duct tape —A commonly used type of sticky-tape which holds racing vehicles together in pretty much all forms of racing. Durometer—A device I used to test the stickiness of tires. It is usually applied during tech inspection right after the race has been completed, to see whether a competitor’s tire does not exceed the legal amount of grip. Dyno—Shortened term for “dynamometer,” a machine used to measure an engine’s horsepower. Dynamometer—Also called ‘Dyno’. A machine that allows the engine builder to measure the torque and horsepower of an engine.
EEGT—The Exhaust Gas Temperature. As the burned fuel-air mixture exits the engine, the temperature of the spent gases can be measured. The higher the temperature, the more efficiently the fuel-air is burning.Engine —The power plant that produces the energy necessary to accelerate the vehicle.Engine Block—An iron or aluminum casting from the manufacturer that envelops the crankshaft, connecting rods and pistons.Engine braking—The effect of slowing down a vehicle by keeping the clutch en-gaged while in high gear without opening the throttle enough to maintain speed. The engine will want to drop to lower Rpms since not enough fuel is supplied to

�40—DeskTop FastLap5 & FastLapSim5 Vehicle Simulations
Road-Racers Glossarymaintain the current RPM. But the vehicle is still going so fast that the engine would be forced to higher Rpms. Since the engine is difficult to turn over without supplying fuel, the energy of the moving vehicle will be transformed into the up-down motion of the moving piston inside of the engine. Essentially the opposite of what happens when fuel is supplied to the engine.Engine builder—An individual or company which specializes on engine blue print-ing and rebuilding.Engine mount —Heavy duty pieces or piece of metal with which the engine is mounted to the frame.Esses—Slang term for a series of acute left- and right-hand turns on a road course, one turn immediately following another.Exhaust —The system which allows the exhaust gases to escape from the cylinder. Sometimes the word ‘exhaust’ just refers to the exhaust gases.
FFabricator—A person who specializes in creating the sheet metal body of a car.Factory—A term designating the “Big Three” auto manufacturers: General Motors (GM), Ford, and Chrysler. The “factory days” refer to periods in the 1950s and ’60s when the manufacturers actively and openly provided sponsorship money and technical support to some race teams. Fairing—The body work in front of the car.Fan—An electrically or mechanically driven device that is used to pull air through a radiator or oil cooler. Heat is transferred from the hot oil or water in the radiator to the moving air.Fins—Air cooled engines are typically covered with cooling fins. These fins are increasing the surface of the cylinder and cylinder head, which increases the heat-transfer from the engine to the surrounding air. Fire Suit—Protective clothing the driver wears to shield against fire in the ve-hicle. Firewall—A solid metal plate that separates the engine compartment from the driver’s compartment of a race car. Fishtail—Movement of the rear end of a car from side to side. Also a verb, as in, “His car is really fishtailing as it comes out of the turn.”Flag man—The race official who is displaying the flags and who has the power to start and stop a race, thus controlling the race.Flags—The race officials will communicate with the drivers via flags. Every driver should be familiar with the flags and their meaning used at their track. Flags will be shown by the flag man. Flat-out—Slang term for racing a car as fast as possible under given weather and track conditions. Flywheel—A heavy metal rotating wheel that is part of the race car’s clutch system, used to keep elements such as the crankshaft turning steadily. Formula—A set of specifications that defines a class of racing cars; Formula One is the best known.Four-barrel—The type of carburetor used in NASCAR Busch Series, Grand National Division racing.

DeskTop FastLap5 & FastLapSim5 Vehicle Simulations—�4�
Road-Racers GlossaryFrame—The metal “skeleton” or structure of a racecar, on which the sheet metal of the car’s body is formed. Also referred to as a “chassis.” Front clip—Beginning at the firewall, the frontmost section of a racecar. Holds the engine and its associated electrical, lubricating, and cooling apparatus; and the braking, steering, and suspension mechanisms. Front steer—A race car in which the steering components are located ahead of the front axle. Front track—The distance between the two front wheels. Varying the front track changes the handling of the vehicle. Front track is part of the setup. Fuel—See gas. Also known as “gasoline.” Fuel Cell—A holding tank for a racecar’s supply of gasoline. Consists of a metal box that contains a flexible, tear-resistant bladder and foam baffling. A product of aerospace technology, it’s designed to eliminate or minimize fuel spillage. Fuel filter—The fuel filter is part of the fuel line. It is a clear piece of plastic, which contains a filtering material. The purpose is of course to prevent any impurities to enter the carburetor. Fuel line—The fuel line connects the tank to the engine.Fuel Pump—A device that pumps fuel from the fuel cell through the fuel line into the carburetor.
GGapping tool—A small tool that makes it very easy to measure the gap at the bottom of a spark plug. Gas—Fuel burned in a vehicle’s engine. It is possible to run ‘pump’ gas, but most people will use race gas, which has a higher octane level than pump gas. Gasket—A thin material, made of paper, metal, silicone, or other synthetic materi-als, used as a seal between two similar machined metal surfaces such as cylinder heads and the engine block. Gasser—A drag race vehicle that runs on gasoline.Gauge—An instrument, usually mounted on the dashboard, used to monitor engine conditions such as fuel pressure, oil pressure and temperature, water pressure and temperature, and RPM (revolutions per minute). These measurements are essential to proper driving and tuning of the car. Gauges are also referred to as displays. Gear—Circular, wheel-shaped parts with teeth along the edges. The interlocking of two of these mechanisms enables one to turn the other. Depending on the context, it may means the gear ratio or a specific driven sprocket. Gear ratio —The ratio between the sizes of the drive sprocket and the driven sprocket. Different ratios can quickly be set by changing the size of the driven sprocket.Gearbox—Refers to the “box” that contains all the gears and linkages. Sometimes referred to as the transmission.Go into the country—To mistakenly leave the racetrack.Grand Prix—A race that counts toward a World Drivers’ Championship.Greenhouse—The upper area of a race car that extends from the base of the windshield in the front, the tops of the doors on the sides, and the base of the rear window in the back. Includes all of the A, B and C pillars, the entire glass area, and the car’s roof.
�42—DeskTop FastLap5 & FastLapSim5 Vehicle Simulations
Road-Racers GlossaryGrid—Short for starting grid. The order in which the drivers line up for the race start. This order is usually determined through qualifying. The driver who managed to end up in the first position is in pole position. Grip—How much force a tire can produce. The stickier a tire, and the larger the contact patch, the more resistance against sliding the tire will have. This means higher cornering speed and acceleration/deceleration. Also called traction. Groove—Slang term for the best route around a racetrack. The most efficient or quickest way around the track for a particular driver. The “high groove” takes a car closer to the outside wall for most of a lap, while the “low groove” takes a car closer to the apron than the outside wall. Road racers use the term “line.” The groove sometimes changes depending on track and weather conditions.GT—Grand Touring; originally from the Italian Gran Turismo, meaning a sedan built in limited quantities and designed to provide fast, comfortable transportation over fairly long distances.Gymkhana—A competition in which cars are driven around a twisting course, ex-ecuting certain specified maneuvers, against the clock.
HHandling —The overall driving characteristics of a vehicle. Different handling charac-teristics may be favored by different drivers or may be necessary for different tracks or conditions. Handling is influenced by many, many factors; some of which are: frame, engine, clutch, tires, driver, weight distribution, front track, rear track, etc.Happy Hour—Slang term for the last official practice session held before a race. Usually takes place the day before the race and after all qualifying sessions and support races have been staged. Hairpin—A turn that goes through 180 degrees.Hairy—Frightening; originally short for “hair-raising.”Harmonic balancer—An element used to reduce vibration in the crankshaft.Head wrench—Slang term for a race team’s crew chief.Heel-and-toe—A driving technique in which the accelerator is operated with the right heel and the brake pedal with the toes of the right foot.Heating The Tires—During cautions the cars swerve back and forth to get heat in the tires and to clean debris off of them.Hopping—A nasty handling characteristic in corners where the rear tires alternately grip and slip. This causes the chassis to bounce up and down in the turns.Horsepower—A measurement of mechanical or engine power. A horsepower is the amount of power it takes to move 33,000 pounds one foot in a minute. Hub—The hub sits snugly on the axle, and has the wheel rim mounted to it. Es-sentially, it connects wheels and axle.
IIdle setting—The idle setting determines the RPM the engine will hold on its own, without depressing the throttle.Ignition—An electrical system used to ignite the air-fuel mixture in an internal combustion engine.Independent—Slang term for a driver or team owner who does not have financial

DeskTop FastLap5 & FastLapSim5 Vehicle Simulations—�43
Road-Racers Glossarybacking from a major sponsor and must make do with secondhand equipment such as parts and tires.Infield—The area enclosed by a course. Often used for spectator seating at major races.Intake Manifold—A housing that directs the air-fuel mixture through the port open-ings in the cylinder heads.Intake port—The opening in the engine casing through which the air-fuel mixture is drawn into the cylinder. Interval—The time/distance between two cars. Referred to roughly in car lengths, or precisely in seconds.
JJackman—Person who raises the car during the pit stops. Jet—When air is sent at a high velocity through the carburetor, jets direct the fuel into the airstream. Jets are made slightly larger to make a richer mixture or slightly smaller to make a more lean mixture, depending on track and weather conditions.Juice—Slang for a racing fuel blend.Jump—To start before the signal is given; usually in drag racing.
KKingpin—The joint that connects the spindle to the frame. The positioning of the kingpin in the frame affects caster and camber. Kingpin inclination—The amount of degrees the top of the kingpin leans towards the center of the vehicle.
LLap—One trip around the racing track. As a verb, when one driver gets so far in front of another that he passes him, thus putting the second driver more than a lap behind, he is said to have lapped him.Lap Down—When one vehicle has been lapped by the race leader.Lapped traffic—Cars that have completed at least one full lap less than the race leader.Lap time—The time it takes to complete one lap around a racetrack. The most important measure whether changes to the setup are successful is a decrease in lap time.Leadfoot—An aggressive driver who always goes for the lead.Lead lap—The lap that the race leader is currently on. Lean—When the air-fuel mixture is too rich, the driver may adjust the needles to lean out the mixture, i.e. increase the air to fuel ratio. If the engine runs too lean, it may get too hot which can severely damage the engine. Le Mans start—A type of start in which the drivers, at the starting signal, run to their cars, start the engines, and begin racing.Line—See groove. Liter—Used to measure displacement; a liter is 1000 cubic centimeters, about 61 cubic inches, a little more than a quart.

�44—DeskTop FastLap5 & FastLapSim5 Vehicle Simulations
Road-Racers GlossaryLoad—The tire load is a term for the weight placed on a tire. The larger the load, the more the increase the grip of the tire. It is important to understand that the load shifts and changes during a drive. In every corner the load is shifted to the side, during acceleration it is shifted to the back, under braking to the front.Loose—Also known as “oversteer.” When the rear tires of the car have trouble stick-ing in the corners. This causes the car to “fishtail” as the rear end swings outward during turns. A minor amount of this effect can be desirable on certain tracks.Loose stuff—Debris such as sand, pebbles, or small pieces of rubber that tend to collect on a track’s apron or near the outside wall during a race.Loud Pedal—The accelerator.Lug nuts—Large nuts applied with a high-pressure air wrench to wheels during a pit stop to secure the tires in place. All NASCAR Busch Series, Grand National Division cars use five lug nuts on each wheel, and penalties are assessed if a team fails to put all five on during a pit stop.
MMale Joint—A ball inside a socket that can turn and pivot in any direction. Used to allow the suspension to travel while the driver steers the car. Marbles—Excess rubber buildup above the upper groove on the racetrack. Also see Loose stuff. Master cylinder—The master cylinder converts the mechanical pressure applied by the driver on the brake pedal into hydraulic pressure, which is converted back by the slave cylinder into mechanical pressure, slowing down the vehicle.Matching Tires—Tires from the factory are broke up in different sets or series. A crew may exchange tires with other crews to get a certain set, thus getting a more consistent handle on the car.Mixture—A term for the air-fuel ratio that is adjusted via the needles on the car-buretor.
NNascar—The National Association For Stock Car Auto Racing. Needles—Screw adjusters to alter the air-fuel ratio in the carburetor. Typically there as a low speed needle and a high speed needle.Nerf—To bump lightly against another car, usually from behind and often on pur-pose as a warning.Nerf bars—A simple piece of metal tubing that is mounted to the frame between the wheels. It is used to prevent damage to the vehicle from casual contact during racing.Neutral—A term a driver uses to refer to a car that is neither loose nor pushing (tight).Nitro—Nitromethane, commonly in racing-fuel blends.Nomex—Nomex is a fire resistant material used for racing suits.Normally aspirated—An engine that isn’t supercharged. See supercharger.Nose cone—Another term for front nose.
O
DeskTop FastLap5 & FastLapSim5 Vehicle Simulations—�45
Road-Racers GlossaryOffset—Some vehicles have the right rear wheel larger and might be located further outside than the left rear wheel. The reason is that there is consistently more load placed on the right rear wheel in oval racing. These cars are said to be offset. Off Track Time—Time it takes for a driver to pit. This includes the time it takes to enter and leave the pit as well as the pit stop itself. Oil Pump—This device pumps oil to lubricate all moving engine parts. Oval—Describes a racetrack generally shaped as an oval. These may be dirt or asphalt ovals. An oval may be either banked or flat.Oversteer—When during cornering the rear tires loose grip before the front tires. The rear of the vehicle will slide towards the outside of the curve. The vehicle over-rotates what the steering input suggested. Another term for this condition is loose. See understeer, handling.
PP & G—A procedure for checking the cubic-inch displacement of an engine. The term comes from the manufacturer of the particular gauge used.Pace Car—Vehicle that leads the race cars around the track during cautions or before the start. Pacer—A driver who travels at close to the same speed throughout the race, con-serving the car in the hope that those traveling faster will be forced to drop out with mechanical problems.Pace Lap(s)—Lap(s) before the start of the race taken to warm up the vehicles. Panhard Bar—A lateral bar that keeps the rear tires centered within the body of the car. It connects to the frame on one side and the rear axle on the other. Also called a track bar. Piston—A round metal cylinder that is attached to the top end of the connecting rod, inside of the cylinder. The piston compresses the air-fuel mixture on the up-ward motion, and is pushed downward when the mixture explodes. This downward motion then drives the crankshaft. Piston ring—One or more rings around the circumference of the piston, used as a seal between the piston and the inside cylinder wall. Pit Crew—The crew that services the vehicle on pit stops.Pit Road—The area where the pit crew service the vehicle. Generally located along the front straightaway, but because of space limitations, some racetracks sport pit roads on both the front and back straights.Pit Stall—The area along pit road that is designated for a particular team’s use during pit stops. Each car stops in the team’s stall before being serviced.Pit steward—Race official that helps line up the races and keeps the show mov-ing.Pitman arm—Another term for spindle arm.Pits—The staging area in which racing teams are setting up shop on race day. Pit Stop—Point during the race in which a car pulls into its pit stall and the crew services the car. This includes tires, fuel, window and grill cleaning, and damage repair.Pole position—The driver who starts from the top of the grid is said to be on pole position. This preferred position is usually earned through qualifying.

�46—DeskTop FastLap5 & FastLapSim5 Vehicle Simulations
Road-Racers GlossaryPolish Victory Lap—When the winner of a race takes a backwards slowdown or victory lap. Pop—Slang to any exotic fuel blend.Pre tech—Some clubs and organizations require a tech inspection even before the race starts. This usually is mostly concerned with safety of driver and vehicle. Production—A production engine or car is one that is made in quantity, usually on an assembly line.Prototype—A sports car that is not in production; either an experimental model or a car made in very limited quantities, solely for racing.Provisional—Starting positions at the rear of the field that are reserved for special use. Pulling A Number—When a team is disqualified, their number is “pulled” from scoring, which means that they are not earning any points for the remainder of the race. Pushing—Another term for Understeer or Tight. Pyrometer—An electronic device used to measure tire temperatures.
QQualifying—The positions on the starting grid are determined through qualifying. The format may differ from series to series or even club to club. It usually involves either timed runs around the track or heat races. Some clubs may use the pea pick. See pole position.Quarter Panel—The sheet metal on both sides of the car from the C-post to the rear bumper below the deck lid and above the wheel well.
RRace director—The person with overall responsibility for conducting a safe race. The final word in rules violations.Racing line—Not necessarily the shortest, but the fastest course around the track. When driving the racing line, the vehicle is taking the curves with the largest pos-sible radius, allowing higher cornering speed that will also carry more speed along the straights. Radiator—A device necessary for water-cooled engines to cool down the water.Rear Clip—The section of a race car that begins at the base of the rear windshield and extends to the rear bumper. Contains the car’s fuel cell and rear-suspension components.Rear-Steer—A car in which the steering components are located behind the front axle.Rear track—The distance between the two rear wheels. It can be varied by moving the wheel hubs inward or outward on the rear axle. Varying the rear track changes the handling of the vehicle. Rear track is part of the setup. Reduction ratio—Other term for gear ratio. Restart—The waving of the green flag following a caution period. Restrictor Plate—A thin metal plate with four holes that restrict airflow from the carburetor into the engine. Used to reduce horsepower and keep speeds down. The restrictor plates are currently used at Daytona International Speedway and Talladega

DeskTop FastLap5 & FastLapSim5 Vehicle Simulations—�47
Road-Racers GlossarySuperspeedway, the two biggest and fastest tracks raced on by NASCAR Busch Series, Grand National Division teams.Rev—To gun an engine. As a noun, “revs” is short for “revolutions per minute.”Rev Limiter—A device which is wired into the cars ignition system to prevent the engine from exceeding maximum RPMs. It controls the engines ignition so that it cannot exceed a specific setting.Rich—When the air-fuel mixture is too lean, the driver may adjust the needles to richen the mixture, i.e. decrease the air to fuel ratio. If the engine runs too rich, you may notice a loss in power. The engine doesn’t pull as good anymore, since there is not enough oxygen in the cylinder for an effective combustion. Ride Height—The distance between the car’s frame rails and the ground.Riding the rails—Taking the outside line around a turn.Roll bar—A frame of tubular steel that protects the driver if the car rolls over.Rims—What the tires are mounted on. Generally, there are one-piece rims and two-piece rims. Two-piece rims consist of two cup-like halves, which are screwed together, while one-piece rims look like a spindle and consist of only one part. Road Course—A track containing numerous combinations of left and right turns and straight sections.Roll Cage—The steel tubing inside the race car’s interior. Designed to protect the driver from impacts or rollovers, the roll cage must meet strict safety guidelines and are inspected regularly.Roof Flaps—Flaps put on the roof of the car that keep the car from becoming airborne. They disrupt airflow around the car to try to keep it on the ground.Rookie—A new racer.Round—Slang term for a way of making chassis adjustments utilizing the racecar’s springs. A wrench is inserted in a jack bolt attached to the springs, and is used to tighten or loosen the amount of play in the spring. This in turn can loosen or tighten up the handling of a racecar. RPM—Rotations Per Minute. How many times the piston goes through one up-down motion per minute. The higher, the faster. Every engine has an optimum RPM range. The RPMs are displayed on the tach. Rubber (aka Spring Rubber)—A single rubber disc inserted between the coils of the four springs. They can be put in or taken out to adjust the vehicle’s spring rate. Rubbin’—Also know as trading sheet metal or trading paint. It is the act of hitting another car during race conditions. This can leave a donut on the car that was hit.
SSafety wire—A stiff wire that is used to secure screws and pins on the kart, so that they will not fall off during the race. Typically, a screw would have a thin hole drilled through it at the end, which extends past the nut. The safety wire would be threaded through this hole, so that the nut could not come off anymore. An alterna-tive to the safety wire can be a cotter pin.Sandbag—To hold back on a car’s performance, during trial runs and qualifying, to mislead other drivers as to its potential.Save—When a driver saves his car from wrecking after he lost control.

�48—DeskTop FastLap5 & FastLapSim5 Vehicle Simulations
Road-Racers GlossarySawing On The Wheel—When a driver turns the wheel violently to keep control of the car. Scales—Used to measure the weight of the vehicle. With several scales, or one scale and more effort, the proper weight distribution of the vehicle can be measured.Scrub—Term to describe a tire sliding over the track surface. When the vehicle is understeering the front wheels are ‘scrubbing off speed’.Scuffs—Used tires. During practice, teams put new tires on the car and run a few laps on them. After a few laps, the tires are removed and placed aside for use during qualifying or the race. Some race setups may favor used tires, that is, the car’s performance improves as the tires are “broken in.” Scuffs are typically used during the final pit stop of a race, to give the driver a slight advantage.Seat Time—This term describes the amount of time or experience a driver has behind the wheel.Self-Cleaning Track—A self-cleaning track has a high degree of banking in the turns and because of this, fluids, wrecked cars, and debris slides to the bottom of the track.Setup—A vehicle’s setup is the set of all variables of the system, i.e. the setting of all those things that can be modified on the vehicle. A different setup may induce different handling characteristics, or may be suitable for different track conditions. The setup may also be different for different drivers. Some of the things which make up a specific setup are: rear- and front track, weight distribution, spring/dampers, tires, etc. Shoes—Slag for Tires.Short Track—A Speedway under one mile in distance.Shunt—A British term for a collision.Shut the gate—To block a competitor who’s attempting to pass.Shut-off—A point at which a driver has to begin slowing down in order to negoti-ate a turn.Silly Season—Slang for the period that begins during the latter part of the current season, wherein some teams announce driver, crew, and/or sponsor changes for the following year. Slalom—A type of gymkhana in which drivers maneuver through a course marked by pylons.Slave cylinder—The slave cylinder is mounted ‘around’ the brake disc and contains the calipers with the brake pads mounted to them. The slave cylinder is connected to the master cylinder via the brake hoses. It converts the hydraulic pressure trans-mitted through the hoses by the brake fluid into mechanical pressure, by forcing the brake pads down onto the rotating surface of the brake disc.Slick—A track condition where, for a number of reasons, it’s hard for a car’s tires to adhere to the surface or get a good “bite.” A slick racetrack is not necessar-ily wet or slippery because of oil, water, etc. A racing tire with no tread pattern. Slingshot—A maneuver in which a car following the leader in a draft suddenly steers around it, breaking the vacuum; this provides an extra burst of speed that allows the second car to take the lead. A type of drag racing car in which the driver sits behind the rear wheels.Slipping —When the clutch in a clutch kart is disengaged because the RPM are

DeskTop FastLap5 & FastLapSim5 Vehicle Simulations—�49
Road-Racers Glossarybelow the stall speed, the clutch is said to be ‘slipping’. Smoking The Tires—Occurs when the tires are sliding across the road surface and because of the heat generated, the tires will smoke. The term is usually associated to tires under hard acceleration.Spark plug—A little device sitting in the middle of the cylinder head, which gener-ates an electric spark when the piston has reached the top point, and the air-fuel mixture is compressed. The spark will ignite the mixture that will rapidly burn. This in turn will drive the piston down again.Speed trap—An area at the end of a drag strip where electric eyes are used to measure a vehicle’s speed at the end of its run.Speedy Dry—Similar to car litter, is used to soak up fluids from the racetrack. Speedway—A high-speed racetrack. This term is usually associated with an oval track.Spin—To lose control so that the car revolves around its vertical axis. Also “spin out.”Spindles—The ‘axles’ of the front wheels. They are connected to the steering column through the tie rods. The front wheels are mounted on the spindles. The spindles themselves are mounted to the frame via the kingpin. The part of the spindles to which the tie rods are connected is called the spindle arm or pitman arm. Spindle arm—Part of the spindle. The tie rod is connected to the end of the spindle arm. The spindle arm sticks out backwards in a steep angle from the actual front ‘axle’. Also called pitman arm. Splash ’n Go—A quick pit stop that involves nothing more than refueling the racecar with the amount of fuel necessary to finish the race. Spoiler—A metal blade attached to the rear deck lid of the car. It helps restrict airflow over the rear of the car, providing downforce and traction.Spoiler Angle—The angle at which the spoiler is mounted on the rear of the car. The angle is expressed in degrees.Sponsor—An individual or business that financially supports a race driver, team, race, or series of races in return for advertising and marketing benefits. Usually, the sponsor’s name, colors, and corporate or product logo are adorned on the racecar for high visibility and product identification.Spotter—Member of the crew that sees the action from high above and tells drivers about other cars relative to the driver and wrecks.Sports car—Generally, any car that handles better, brakes better, and is more maneuverable than an ordinary passenger car.Sportsman—A type of stock car with a light body and engine modified in certain limited ways.Stagger— The size difference between two opposite tires, i.e. between the two rear tires or the two front tires. Stagger is only used for oval racing. Stagger causes the vehicle to automatically turn in a particular direction.Stall speed—The engine RPM where a torque converter matches engine speed. Starter—Person in the flag-stand who controls the race with flags. An electrical motor used to turn an engine over until it can run by itself.Starting grid—See grid. Stick—Slang term for tire traction, as in “the car’s sticking to the track.”

�50—DeskTop FastLap5 & FastLapSim5 Vehicle Simulations
Road-Racers GlossaryStickers—Slang term for new tires. The name is derived from the manufacturer’s stickers that are affixed to each new tire’s contact surface. Stickiness—The stickiness of a tire is determined by its compound. See tires. Stock—An unmodified car, almost exactly as produced by the manufacturer.Stock block—An unmodified engine.Stop ’n Go—A penalty, usually assessed for speeding on pit road or for unsafe driving. The car must be brought onto pit road at the appropriate speed and stopped for one full second in the team’s pit stall before returning to the track.Stroke—The distance the piston travels within the cylinder.Stroking—Said of a driver who allegedly “lays back” in a race so as not to punish or wear out equipment before the end of an event. Superspeedway—A racetrack of a mile or more in distance. Road courses are included. Racers refer to three types of oval tracks. Short tracks are under a mile, intermediate tracks are at least a mile but under two miles, and speedways are two miles and longer.Sump—The bottom portion of the engine that houses the crankcase. Towards the top, the cylinder extends from it. Recessed area in the bottom of the fuel tank to improve consistency of fuel flow when the fuel level is low.Supercharger—A high-powered fan that forces air into the engine, increasing power.Sway Bar—Sometimes called an “anti rollbar.” Bar used to resist or counteract the rolling force of the car body through the turns. Switchback—A hairpin turn.
TTach—The tachometer. One of the gauges which displays the current RPM. A sensor is attached to the spark plug cable, close to the plug. It detects the electric pulses to the spark plug.Tachometer—See Tach.T-bone—To hit another vehicle broadside.Tear offs—Thin layers of transparent plastic that are layered over the face shield of the helmet or windshield. Once the top layer gets dirty, the driver or crewmember can tear it off (hence the name), exposing a new, still clean layer underneath.Teeth—The size of the driven gear is measured in the teeth around the circumfer-ence of this sprocket. Changing gears therefore requires to ‘run more/less teeth’, i.e. use a driven gear of different size. Ten-tenths—Driving at the car’s absolute limit.Temperature gauge—One of the gauges that displays the current engine tem-perature.Template—A device used to check the body shape and size, to ensure compliance with the rules. The template closely resembles the shape of the factory version of the car. Testing—When cars visit a track before that race to make the car better for when the race comes. Threshold braking—Applying the brakes without any safety margin left. During nor-mal racing, brakes will be applied to some 98% of their maximum braking capacity,
DeskTop FastLap5 & FastLapSim5 Vehicle Simulations—�5�
Road-Racers Glossaryor so. Under threshold braking, the driver reaches and occasionally exceeds 100% of the brakes’ capabilities. The tires may lock up. Threshold braking is obviously not recommended for every curve during normal racing, since it is very risky and the driver is bound to make a mistake, sooner or later. Threshold braking is therefore usually only used in qualifying or during high-risk passing maneuvers. Throttle—The pedal that is typically located on the right side of the kart. Press it down and hopefully the kart will accelerate. It is connected to the carburetor via the throttle cable. Tie rods—Two tie rods are typically connecting the steering column to the spindle arms of the spindles. The tie rods are adjustable in length. Also see brake tie rod.Tight—Also known as “understeer.” A car is said to be tight if the front wheels lose traction before the rear wheels do. A tight racecar doesn’t seem able to steer sharply enough through the turns. Instead, the front end continues out toward the wall. Tire Profile—A term that describes the shape of a tire. Under-inflated tires tend to sag, while over-inflated tires have a very upright profile.Tires—Many different types of tires are used, depending on the class or the area in which you are running. Manufacturer and tire stickiness are typically mandated by the governing body of your race. Harder tires do not provide as much grip as stickier tires, but they will last longer (several races), compared to a really soft tire (one race). Harder tires are typically used in the novice classes. A tire is mounted on the wheel rim.Tire Wear Indicator—A small indentation in a tire used to indicate how much a tire is worn in a specific spot. Indicators are placed in rows across the tread of the tire. Toe-in—Toe-in means that the front of the front wheels are closer together than the rear-end of the front wheels. Essentially, it looks like the two front wheels want to drive towards each other. A small amount of toe-in improves the response during corner entry. See alignment and toe-out. Toe-out—Toe-out means that the front of the front wheels are further apart than the rear-end of the front wheels. Essentially, it looks like the two front wheels want to drive away from each other. Toe-out will make the vehicle dart rapidly into a corner when the steering wheel is turned. Toe-out is usually not recommended. See alignment and toe-in. Torsion bars—Steel bars that usually have a spline or square mounting area at each end. When the bar is twisted, it produces a spring rate.Traction—A different name for grip.Track Bar—See “Panhard Bar”Trading Paint—Slang term used to describe aggressive driving involving a lot of bumping and rubbing. Trailing Arm—A rear suspension piece holding the rear axle firmly fore and aft yet allowing it to travel up and down.Trail braking—When the brake is applied during and after steering into a curve. Traditionally in racing, brakes are applied while the front wheels are still steering straight. Trail braking may allow deeper braking into a corner, but if not done prop-erly can very quickly result in massive oversteer, since the rear wheels are not only unloaded, but also have to perform braking duty.

�52—DeskTop FastLap5 & FastLapSim5 Vehicle Simulations
Road-Racers GlossaryTransponder—An electronic device mounted to the vehicle, which triggers an ex-ternal (track side) mechanism each time you cross a certain point on the racetrack. Some organizations use transponders to automate their timing and scoring systems, enabling them to accurately determine the starting grid in qualifying. Personal sys-tems are also available. Tri-Oval—A racetrack that has a “hump” or “fifth turn” in addition to the standard four corners. Not to be confused with a triangle-shaped speedway, which has only three distinct corners. Turbocharger—A supercharger driven by a turbine that, in turn, is driven by the car’s exhaust gases.Tweak—To fine-tune an engine or make any minor modification that will result in a slight power increase.
UUndersteer—When during cornering the front tires loose grip before the rear tires, the front of the vehicle will slide towards the outside of the curve. The vehicle is slowed down, since the front tires are effectively scrubbing off speed. This condition is also referred to as pushing. See also oversteer, handling.
VValance—Also known as the front air dam. It is below the front bumper of the car.Valves—Typically the devices on the top of the cylinder of a 4-cycle engine that allow the air-fuel mixture to enter the cylinder above the piston and the exhaust gases to exit the cylinder after the combustion. On a 4-cycle engine the valves are operated by the cam shaft. 2-cycle engines do not require valves, but may have similar devices to reduce backflow of the fuel - air mix into the carburetor on the down stroke of the piston.Valve Stem—The point on a tire where it is filled with air. Vented—Describes the fact that the brake disc was designed in such a way that heat and gases produced when applying the brake are more easily dissipated. This helps to obtain a steady and predictable braking performance. Victory lane—Sometimes called the “Winner’s Circle.” The spot on each racetrack’s infield where the race winner parks for the celebration.
WWaiver—A form that you sign when entering the track, waiving the right to sue the race operators for liability, as you acknowledge that racing is a dangerous activity and are doing it anyway. War Wagon—Also known as a pit wagon. Teams keep tools in there as well as electronic equipment.Water cooled —Describes an engine that relies on water circulating around the engine as a means to dispose of excess heat. The water is then cooled in a radia-tor which adds to the complexity of these engines, as compared to the air cooled ones. Water cooled engines are typically quitter and do not overheat as easily. Wedge—Term that refers to the cross weight adjustment on a racecar. Adjusting

DeskTop FastLap5 & FastLapSim5 Vehicle Simulations—�53
Road-Racers Glossarythe handling of the car by altering pressure on the rear springs. These adjustments are made by turning the weight jacking screws with a ratchet. This alters the rela-tionship of the weight of each corner of the car.Weight Jacking—All cars must weigh the same amount. That weight can be un-evenly distributed, however, to provide maximum grip at the wheels that need it most. “Weight Jacking” is the art of shifting the car’s weight to favor certain wheels. Wheel—Typically the combination of rim and tire. The wheel is mounted to the axle via the wheel hub. Wheelbase—The distance between a car’s front and rear axles.Windmill—Slang for a supercharger.Window Net—A woven mesh that hangs across the driver’s side window, to prevent the driver’s head and limbs from being exposed during an accident.Wind Tunnel—A place that race teams go to test the aerodynamic qualities of their cars. Wing—An aerodynamic device that provides downforce to aid in tire traction.Wires—Wire wheels.Wrench—Slang for racing mechanic.
XX-car—An experimental car.
YYellowtail—A rookie NASCAR driver, so called because cars driven by rookies have yellow rear bumpers.Yellow flag—A flag used to signal caution because of dangerous conditions. A driver is not allowed to improve his position under the yellow.

�54—DeskTop FastLap5 & FastLapSim5 Vehicle Simulations
COMMON QUESTIONSCOMMON QUESTIONSCOMMONLY ASKED QUESTIONS
The following information may help answer questions and solve problems that you encounter when installing and using FastLapSim. If you don’t find an answer to your problem here, send an email to: [email protected] (Motion Soft-ware, Inc., and ProRacing Sim, LLC., provide technical support to registered users only—register your software today). We will review your problem and return an answer to you as soon as possible.
INSTALLATION/BASIC-OPERATION QUESTIONS
Question: Received an “Error Reading Drive D” (or another drive) message when attempting to run or install FastLapSim. What does this mean?
Answer: This indicates that your computer cannot read FastLapSim5 CD-ROM installation disk. The disk may not be properly seated in your drive, the drive may be defective, or the disk may be damaged. If you can properly read other CD-ROM disks, but FastLapSim5 distribution disk produces er-ror messages, try requesting a directory of a known-good disk by entering DIR X: or CHKDSK X: (where X is the drive letter of your CD-ROM drive) and then perform those same operations with FastLapSim5 disk. If you receive an error message only when using FastLapSim5 disk, the disk is defective. Return the disk to Motion Software, Inc., for a free replacement (address at bottom of Tech Support Form).
Question: Encountered “Could not locate FastLapSim5 CD-ROM disk” error mes-sage when trying to run the program. Why?
Answer: Please insert FastLapSim5 disk in your CD-ROM drive. FastLapSim5 may need to periodically access the CD. Please keep FastLapSim5 disk handy.
Question: FastLapSim5 produced an Assertion Failure error. What should I do?Answer: Please note down all of the information presented in the message box,
provide a quick synopsis of what lead up to the error, then send this in-formation to Motion Software ([email protected]). Thank you for your assistance in helping us improve FastLapSim.

DeskTop FastLap5 & FastLapSim5 Vehicle Simulations—�55
QUESTIONS ABOUT RUNNING A SIMULATION
Question: When I run a simulation, part of the graphic curves don’t appear on my screen. What can I do to correct the display?
Answer: Open the Graph Options menu (right-click on the graph) and select Auto Range for the Y� or Y2 variable. See pages 61 to 63 for more information about graph scaling and plotting variables.
Question: What are the Frontal Area and Aero Drag?Answer: As a vehicle moves forward, it displaces the air around it. The larger the
vehicle, the more air it must push aside. At its most basic, a vehicle can be thought of as a “brick wall,” equivalent in size to the height and width of the vehicle. When the square-foot area of the brick wall is equal to the “head-on” area of the vehicle, they both displace the same amount of air as they move forward and, therefore, have the same frontal area. But a brick wall has much more wind resistance than most vehicles. The differ-ence is a measure of the efficiency an object posses as it moves through the air (i.e., how much energy is consumed at a specific speed relative to a moving flat “brick-wall” surface); this ratio is called the aerodynamic drag. The brick wall has an Aero Drag equal to 1.0. However, a well designed vehicle of the same frontal area may consume only one-half of the energy required as it “slices” its way through the air. In this case, the Aero drag would be equal to 0.5, or 50% of the flat surface. Review the list of vehicles in the Vehicle Menu to determine how the aerodynamic drag changes with vehicle design. Aero Drag can be reduced anywhere from 0.01 to as much as 0.1 by lowering the front of the vehicle to provide a better “angle of attack” and through the addition of aerodynamic “dams” that redirect air around the vehicle rather than allowing it pass underneath. FastLapSim5 uses both Frontal Area and Aero Drag to calculate the energy required to move the vehicle through the air at any speed.
Question: Why do the progress bars occasionally move backwards during a simu-lation run?
Answer: The calculation of an ideal raceline, corner speeds, and braking points
Common Questions
The calculation of an ideal raceline, corner speeds, and braking points and much more is
an iterative process. The simulation attempts to push the vehicle through turns at high speeds.
When it encounters handling problems, it slows down and tries the turn again. You can watch
this process on the Progress Bar display.

�56—DeskTop FastLap5 & FastLapSim5 Vehicle Simulations
Common Questions(plus brake loads, brake balance, engine speeds, gears, throttle, and much more) is an iterative process. In other words, the simulation attempts to push the vehicle through turns at high speeds. When it encounters handling problems, it slows down and tries the turn again. At times the simulation must back up a considerable distance to establish the optimum turn entrance speeds, brake loads, etc. You can watch this process on the Progress Bar display.

DeskTop FastLap5 & FastLapSim5 Vehicle Simulations—�57
FastLapSim5 Testing Notes
_______________________________________________________________________
_______________________________________________________________________
_______________________________________________________________________
_______________________________________________________________________
_______________________________________________________________________
_______________________________________________________________________
_______________________________________________________________________
_______________________________________________________________________
_______________________________________________________________________
_______________________________________________________________________
_______________________________________________________________________
_______________________________________________________________________
_______________________________________________________________________
_______________________________________________________________________
_______________________________________________________________________
_______________________________________________________________________
_______________________________________________________________________
_______________________________________________________________________
_______________________________________________________________________
_______________________________________________________________________
_______________________________________________________________________
_______________________________________________________________________
_______________________________________________________________________
_______________________________________________________________________
_______________________________________________________________________
_______________________________________________________________________

�58—DeskTop FastLap5 & FastLapSim5 Vehicle Simulations
FastLapSim5 Testing Notes
_______________________________________________________________________
_______________________________________________________________________
_______________________________________________________________________
_______________________________________________________________________
_______________________________________________________________________
_______________________________________________________________________
_______________________________________________________________________
_______________________________________________________________________
_______________________________________________________________________
_______________________________________________________________________
_______________________________________________________________________
_______________________________________________________________________
_______________________________________________________________________
_______________________________________________________________________
_______________________________________________________________________
_______________________________________________________________________
_______________________________________________________________________
_______________________________________________________________________
_______________________________________________________________________
_______________________________________________________________________
_______________________________________________________________________
_______________________________________________________________________
_______________________________________________________________________
_______________________________________________________________________
_______________________________________________________________________
_______________________________________________________________________

DeskTop FastLap5 & FastLapSim5 Vehicle Simulations—�59
FastLapSim5 Testing Notes
_______________________________________________________________________
_______________________________________________________________________
_______________________________________________________________________
_______________________________________________________________________
_______________________________________________________________________
_______________________________________________________________________
_______________________________________________________________________
_______________________________________________________________________
_______________________________________________________________________
_______________________________________________________________________
_______________________________________________________________________
_______________________________________________________________________
_______________________________________________________________________
_______________________________________________________________________
_______________________________________________________________________
_______________________________________________________________________
_______________________________________________________________________
_______________________________________________________________________
_______________________________________________________________________
_______________________________________________________________________
_______________________________________________________________________
_______________________________________________________________________
_______________________________________________________________________
_______________________________________________________________________
_______________________________________________________________________
_______________________________________________________________________

�60—DeskTop FastLap5 & FastLapSim5 Vehicle Simulations
FastLapSim5 Testing Notes
_______________________________________________________________________
_______________________________________________________________________
_______________________________________________________________________
_______________________________________________________________________
_______________________________________________________________________
_______________________________________________________________________
_______________________________________________________________________
_______________________________________________________________________
_______________________________________________________________________
_______________________________________________________________________
_______________________________________________________________________
_______________________________________________________________________
_______________________________________________________________________
_______________________________________________________________________
_______________________________________________________________________
_______________________________________________________________________
_______________________________________________________________________
_______________________________________________________________________
_______________________________________________________________________
_______________________________________________________________________
_______________________________________________________________________
_______________________________________________________________________
_______________________________________________________________________
_______________________________________________________________________
_______________________________________________________________________
_______________________________________________________________________

DeskTop FastLap5 & FastLapSim5 Vehicle Simulations—�6�
ProRacing Sim, LLC.3400 Democrat Road, Suite 207
Memphis, TN 38��8
For Tech Support Contact: 90�-259-2355Web: www.ProRacingSim.com
Email: [email protected]
PRS Software Developed byMotion Software, Inc.
Web: www.MotionSoftware.com