prospective evaluation of gpe [s country-level support to ......trcn teachers registration council...
TRANSCRIPT

Prospective evaluation of GPE’s country-level support to education
FINAL REPORT - YEAR 2 | JANUARY 2020
Country Level Evaluation: Nigeria Dr Rachel Outhred and Fergal Turner

DRAFT REPORT (VX) – COUNTRYNIGERIA i
© UNIVERSALIA
Acronyms
AESPR Annual Education Sector Performance Review
ASC Annual School Census
BESDA Better Education Service Delivery for All
CA Coordinating Agency
CBMC Centre Based Management Committee
CEQ Core Evaluation Question
CL Secretariat Country Lead
CLE Country Level Evaluation
CRF Consolidated Revenue Fund
CRS Creditor Reporting Standard
CSACEFA Civil Society Action Coalition on Education for All
CSEF Civil Society Education Fund
CSO Civil Society Organization
DAC Development Assistance Committee
DEEPEN Developing Effective Private Education Nigeria
DFID Department for International Development (United Kingdom)
DLI Disbursement Linked Indicator
DP Development Partner
ECD Early Childhood Development
ECE Early Childhood Education
EDOREN Education, Data, Research and Evaluation in Nigeria

DRAFT REPORT (VX) – COUNTRYNIGERIA ii
© UNIVERSALIA
EFA/FTI Education For All/Fast Track Initiative
EGRA Early Grade Reading Assessment
EMIS Education Management Information System
ESA Education Sector Analysis
ESP Education Sector Plan
ESPDG Education Sector Plan Development Grant
ESPIG Education Sector Plan Implementation Grant
ESSPIN Education Sector Support Program in Nigeria
FAAC Federal Account Allocation Committee
FCT Federal Capital Territory
FMoE Federal Ministry of Education
GA Grant Agent
GDP Gross Domestic Product
GEP(1-3) Girls Education Project (one, two and three)
GER Gross Enrollment Ratio
GNI Gross National Income
GPE Global Partnership for Education
GPI Gender Parity Index
GRA Global and Regional Activities
HDI Human Development Index
HGSF Home Grown School Feeding
IDPG International Development Partners Group
IIEP International Institute for Educational Planning
IQS Islamiyya and Quranic Schools

DRAFT REPORT (VX) – COUNTRYNIGERIA iii
© UNIVERSALIA
ISCED International Standard Classification of Education
ISR Implementation Status and Results
JICA Japanese International Cooperation Agency
JSR Joint Sector Review
KII Key Informant Interview
LAS Learning Assessment System
LEG Local Education Group
LGA Local Government Authority
LGEA Local Government Education Authority
M&E Monitoring and Evaluation
MICS Multiple Indicator Cluster Survey
MSP Ministerial Strategic Plan
MTR Mid-term Review
MTSS Medium Term Sector Strategy
NALABE National Assessment of Learning in Basic Education
NAR Net Attendance Ratio
NBS National Bureau of Statistics
NCE National Council for Education
NEG National Education Group
NEI (+) Northern Education Initiative (Plus)
NEMIS National Education Management Information System
NER Net Enrollment Ratio
NERDC Nigerian Education Research and Development Council
NGN Nigerian Naira

DRAFT REPORT (VX) – COUNTRYNIGERIA iv
© UNIVERSALIA
NIPEP Nigeria Partnership for Education Project
NPC National Population Commission
NPSC National Project Steering Committee
NPTC National Project Technical Committee
ODA Official Development Assistance
OECD Organization for Economic Cooperation and Development
OOS Out of School
OOSA Out of School Adolescents
OOSC Out of School Children
PAD Project Appraisal Document
PCR Primary Completion Rate
PDG Program Design Grant
PDO Project Development Objectives
PFM Public Finance Management
PLANE Partnership for Learning for All in Nigeria
PP Percentage Point
PS Permanent Secretary
PTR Pupil-teacher Ratio
RF Results Framework (GPE)
SABER Systems Approach to Better Education Results
SBMC School Based Management Committee
SESOP State Education Operational Plan
SESP State Education Sector Plan
SESSPIN State Education Sector Support Program in Nigeria
DRAFT REPORT (VX) – COUNTRYNIGERIA v
© UNIVERSALIA
SIG School Improvement Grant
SMoBP State Ministry of Budgets and Planning
SMoE State Ministry of Education
SPSC State Project Steering Committee
SPTC State Project Technical Committee
SSO School Support Officer
SUBEB State Universal Basic Education Board
TDP Teacher Development Program
TMIS Teacher Management Information System
ToC Theory of Change
ToR Terms of Reference
TRCN Teachers Registration Council of Nigeria
UBE Act Universal Basic Education Act
UBEC Universal Basic Education Commission
UBE-IF Universal Basic Education – Intervention Fund
UIS UNESCO Institute for Statistics
UNESCO United Nations Educational, Scientific and Cultural Organization
UNHCR United Nations High Commissioner for Refugees
UNICEF United Nations Children’s Fund
USAID United States Agency for International Development
USD United States Dollar
VSO Volunteer Service Overseas
VT Variable Tranche
WAEC West African Examinations Council

DRAFT REPORT (VX) – COUNTRYNIGERIA vi
© UNIVERSALIA

DRAFT REPORT (VX) – COUNTRYNIGERIA vii
© UNIVERSALIA
Terminology
Alignment Basing support on partner countries’ national development strategies, institutions and procedures.1
Basic
education
Pre-primary (i.e. education before Grade 1), primary (Grades 1-6), lower secondary (Grades 7-9), and adult literacy education, in formal and non-formal settings. This corresponds to International Standard Classification of Education (ISCED) 2011 levels 0-2.
Capacity In the context of this evaluation we understand capacity as the foundation for behavior change in individuals, groups or institutions. Capacity encompasses the three interrelated dimensions of motivation (political will, social norms, habitual processes), opportunity (factors outside of individuals e.g. resources, enabling environment) and capabilities (knowledge, skills).2
Education
systems
Collections of institutions, actions and processes that affect the educational status of citizens in the short and long run.3 Education systems are made up of a large number of actors (teachers, parents, politicians, bureaucrats, civil society organizations) interacting with each other in different institutions (schools, ministry departments) for different reasons (developing curriculums, monitoring school performance, managing teachers). All these interactions are governed by rules, beliefs, and behavioral norms that affect how actors react and adapt to changes in the system.4
Equity In the context of education, equity refers to securing all children’s rights to education, and their rights within and through education to realize their potential and aspirations. It requires implementing and institutionalizing arrangements that help ensure all children can achieve these aims. 5
1 OECD, Glossary of Aid Effectiveness Terms. http://www.oecd.org/dac/effectiveness/aideffectivenessglossary.htm GPE understands ‘country systems’ to relate to a set of seven dimensions: Plan, Budget, Treasury, Procurement, Accounting, Audit and Report. Source: Methodology Sheet for Global Partnership for Education (GPE) Indicators. Indicator (29) Proportion of GPE grants aligned to national systems. 2 Mayne, John. The COM-B Theory of Change Model. Working paper. February 2017. 3 Moore, Mark. 2015. Creating Efficient, Effective, and Just Educational Systems through Multi-Sector Strategies of Reform. RISE Working Paper 15/004, Research on Improving Systems of Education, Blavatnik School of Government, Oxford University, Oxford, U.K. 4 World Bank. 2003. World Development Report 2004: Making Services Work for Poor People. Washington, DC: World Bank; New York: Oxford University Press. 5 Equity and Inclusion in Education. A guide to support education sector plan preparation, revision and appraisal. GPE 2010; p.3. Available at: https://www.globalpartnership.org/content/equity-and-inclusion-education-guide-support-education-sector-plan-preparation-revision-and

DRAFT REPORT (VX) – COUNTRYNIGERIA viii
© UNIVERSALIA
Financial
additionality
This incorporates two not mutually exclusive components: (a) an increase in the total amount of funds available for a given educational purpose, without the substitution or redistribution of existing resources; and (b) positive change in the quality of funding (e.g., predictability of aid, use of pooled funding mechanisms, co-financing, non-traditional financing sources, alignment with national priorities).
Gender
equality
The equal rights, responsibilities, and opportunities of women, men, girls, and boys, and equal power to shape their own lives and to contribute to society. It encompasses the narrower concept of gender equity, which primarily concerns fairness and justice regarding benefits and needs.6
Harmonization The degree of coordination between technical and financial partners in how they structure their external assistance (e.g. pooled funds, shared financial or procurement processes), to present a common and simplified interface for developing country partners. The aim of harmonization is to reduce transaction costs and increase the effectiveness of the assistance provided by reducing demands on recipient countries to meet with different donors’ reporting processes and procedures, along with uncoordinated country analytic work and missions.7
Inclusion Adequately responding to the diversity of needs among all learners, through increasing participation in learning, cultures, and communities, and reducing exclusion from and within education.8
6 GPE Gender Equality Policy and Strategy 2016-2020. GPE 2016, p. 5f. Available at: http://www.globalpartnership.org/sites/default/files/2016-06-gpe-gender-equality-policy-strategy.pdf 7 Adapted from OECD, Glossary of Aid Effectiveness Terms http://www.oecd.org/dac/effectiveness/aideffectivenessglossary.htm, and from Methodology Sheet for Global Partnership for Education (GPE) Indicators. Indicator (30) Proportion of GPE grants using: (a) co-financed project or (b) sector pooled funding mechanisms. 8 GPE 2010, p.3.

FINAL REPORT – NIGERIA ix
© UNIVERSALIA
Contents
EXECUTIVE SUMMARY ............................................................................................... XVI
1 INTRODUCTION ...................................................................................................... 1
1.1 Background and purpose of the prospective evaluation ............................................................... 1
1.2 Methodology overview ................................................................................................................... 2
1.3 Structure of the report ................................................................................................................... 5
2 CONTEXT ................................................................................................................ 6
2.1 Overview of Nigeria ........................................................................................................................ 6
2.2 GPE in Nigeria ............................................................................................................................... 13
3 GPE CONTRIBUTIONS TO SECTOR PLANNING, DIALOGUE/MONITORING, FINANCING AND IMPLEMENTATION ....................................................................................... 17
3.1 Introduction .................................................................................................................................. 17
3.2 GPE contributions to sector planning ........................................................................................... 17
3.3 GPE contributions to mutual accountability through sector dialogue and monitoring ............... 28
3.4 GPE contributions to sector financing .......................................................................................... 38
3.5 GPE contributions to sector plan implementation ....................................................................... 51
4 PROGRESS TOWARDS A STRONGER EDUCATION SYSTEM ..................................... 59
4.1 Introduction .................................................................................................................................. 59
4.2 Progress towards a stronger education system ........................................................................... 59
5 PROGRESS TOWARDS STRONGER LEARNING OUTCOMES AND EQUITY ................. 70
5.1 Introduction .................................................................................................................................. 70
5.2 Progress towards impact-level outcomes .................................................................................... 71
6 CHANGES OVER TIME AND KEY INFLUENCING FACTORS ....................................... 78
6.1 Introduction .................................................................................................................................. 78
7 CONCLUSIONS AND STRATEGIC QUESTIONS/ISSUES ............................................. 81
7.1 Conclusions ................................................................................................................................... 81
7.2 Strategic Directions for GPE in Nigeria ......................................................................................... 83
ANNEXES .................................................................................................................... 84
Revised Evaluation Matrix .................................................................................................... 1

FINAL REPORT – NIGERIA x
© UNIVERSALIA
GPE ToC .............................................................................................................................. 21
Explanatory mechanisms and (implicit) contribution claims ............................................. 23
Interview protocols ............................................................................................................ 27
i. Approach to interviews ...................................................................................................... 27
ii. Focus group discussions ..................................................................................................... 28
Risks to the Evaluation and Ethics ...................................................................................... 29
i . Risks to the evaluat ion ............................................................................................... 29
i i . Ethics ................................................................................................................................ 31
Confirming and refuting evidence methodology ............................................................... 32
Mapping Major Donor Funded Projects in NIPEP States ................................................... 36
List of consulted individuals ............................................................................................... 37
Education Financing Implications from the Universal Basic Education Act (2004) ............ 43
Overview of priorities and strategies from 2015-2017 Medium Term Sector Strategies .. 44
Selected MTSS implementation data (2016/17) ................................................................ 46
Appraisal of 2013-2015 medium term sector strategies ................................................... 52
Updated Strategies for Emergent MTSSs/SESPs ................................................... 53
Nigeria sector financing data ............................................................................................. 54
OECD-DAC Tables for Nigeria (National) ............................................................................ 56
Selected system-level country data ................................................................................... 58
Selected impact-level country data.................................................................................... 62
Impact Level Data Tables ................................................................................................... 67

FINAL REPORT – NIGERIA xi
© UNIVERSALIA
Figures
Figure 1 - The evaluation presents findings on key evaluation questions and contribution claims .............. 3
Figure 2 - Map showing five NIPEP states and FCT ........................................................................................ 6
Figure 3 - Balance of registered state, private and IQS in five NIPEP states (World Bank, 2014) ................ 12
Figure 4 - Comparison of state budgets and expenditure 2015-2016 ......................................................... 43
Figure 5 - GPI on National Key Performance Indicators (MICS 2017) .......................................................... 74
Tables
Table 1 - Overview of Key Players in Nigerian Education System .................................................................. 8
Table 2 - Population of Enrolled Students and estimates of total school aged population ........................... 9
Table 3 - Numbers of Registered Schools (including Private, Islamiyya and Quranic Schools) in five NIPEP
states (UBEC, 2014)) ................................................................................................................ 10
Table 4 - Teacher Statistics at Primary and Secondary School Level (NEMIS, 2016) ................................... 11
Table 5 - GPE grants to Nigeria (Disbursements as of July 2019) ................................................................. 13
Table 6 - Division of NIPEP funds between States and Federal Activities (US$ 000s) .................................. 15
Table 7 - Timeline of key events in the education sector in Nigeria ............................................................ 16
Table 8 - Overview – CLE findings on sector planning and related GPE contributions ................................ 18
Table 9 - Education sector plans across Nigeria ........................................................................................... 19
Table 10 - Comparison of quality of state level plans across planning cycles in NIPEP states ..................... 22
Table 11 - Summary of GPE contributions to sector planning in Nigeria ..................................................... 24
Table 12 - Summary of progress and GPE contributions to mutual accountability through sector dialogue
and monitoring ........................................................................................................................ 28
Table 13 Selected Education Sector Dialogue Mechanisms .................................................................. 29
Table 14 - GPE contributions to mutual accountability during the 2013-2019 review period .................... 34
Table 15 - Progress made and GPE contributions to sector financing ......................................................... 38
Table 16 - Overview of available financial data for basic education at national and state level ................. 39

FINAL REPORT – NIGERIA xii
© UNIVERSALIA
Table 17 - Sources of education funding ...................................................................................................... 41
Table 18 - Allocation of UBE-IF funding by grant category (2019) ............................................................... 41
Table 19 - Summary of Official Development Assistance to Nigeria ............................................................ 45
Table 20 -Summary of GPE contributions to domestic and international financing .................................... 46
Table 21 - Comparison of NIPEP financial inputs and estimated costs of state MTSSs (2015-2019) (US$
000s) ........................................................................................................................................ 47
Table 22 - Summary of Major Donor-Funded Projects in NIPEP states ....................................................... 49
Table 23 - Progress made and GPE contributions to sector plan implementation ...................................... 51
Table 24 - GPE contributions to sector plan implementation ...................................................................... 52
Table 25 - Summary of NIPEP progress against State MTSS Focus Areas .................................................... 54
Table 26 - Assessment of the contribution of ESP implementation to system level change ....................... 60
Table 27 - Assessment of Nigeria EMIS ........................................................................................................ 64
Table 28 - Summary of system level changes, their links to education sector planning, and the level of
donor support .......................................................................................................................... 66
Table 29 - Assessment of contribution of system level changes to improved student outcomes .............. 71
Table 30 - Summary of changes in student outcome indicators at national and in NIPEP states (2011-2017)
................................................................................................................................................. 72
Table 31 - Collation of Results of Project Level Learning Assessments ........................................................ 74
Table 32 - Plausible links between system level changes and student outcomes ....................................... 76
Table 33 - Assessment of the plausibility of each Contribution Claim at Year 1 and Endline ...................... 78
Table 34 - Summary of Assessment of Assumptions ................................................................................... 79
Boxes
Box 1 – Scope of this prospective evaluation ................................................................................................. 1
Box 2 – Colour ratings in the CLEs .................................................................................................................. 4
Box 3 - Testing Assumptions and Assessing Strength of Evidence ............................................................... 27
Box 4 - Testing Assumptions and Assessing Strength of Evidence ............................................................... 36
Box 5 -Oil Prices and Vulnerability of Funding for Education in Nigeria ...................................................... 44
Box 6 - Testing Assumptions and Assessing Strength of Evidence ............................................................... 50

FINAL REPORT – NIGERIA xiii
© UNIVERSALIA
Box 7 - Testing Assumptions and Assessing Strength of Evidence ............................................................... 58
Box 8 - Testing Assumptions and Assessing Strength of Evidence ............................................................... 69
Box 9 - Testing Assumptions and Assessing Strength of Evidence ............................................................... 77

FINAL REPORT – NIGERIA xiv
© UNIVERSALIA
Annexes
Annex Figure 1 - Overview of Structure of education sector financing in Nigeria (From World Bank Public
Expenditure Review) ............................................................................................................... 43
Annex Figure 2 - Key influencing actors in sector financing (taken from ESSPIN review of basic education
financing) ................................................................................................................................. 43
Annex Table 1 - Key anticipated risks and limitations, and proposed mitigation mechanisms ................... 29
Annex Table 2 - Strength of evidence assessment example – documents ................................................. 32
Annex Table 3 - Strength of evidence assessment - interviews .................................................................. 33
Annex Table 4 - Example of weighing of evidence to support contribution claim plausibility and
identification of influencing factors ........................................................................................ 34
Annex Table 5 - Stakeholders Consulted during 2019 Country Visit ............................................................ 37
Annex Table 6 - Stakeholders consulted during 2018 country visit ............................................................. 39
Annex Table 7 - Breakdown of Planned Expenditure for Kaduna MTSS 2018-2020 .................................... 57
Annex Table 8 - Education Indicators from UNICEF Multiple Indicator Cluster Survey (2011 & 2017) ....... 67

FINAL REPORT – NIGERIA xv
© UNIVERSALIA
Acknowledgements
The evaluation team hereby wishes to express its gratitude to all stakeholders who have been involved in and supported this evaluation. In particular we would like to extend our gratitude to the education teams at USAID, DFID and the World Bank in Nigeria for their support in facilitating the country visits, and for their effort in coordinating feedback and contributions to this report. Of note are the contributions of Pius Elumeze, Adebayo Solomon, and Olatunde Adekola for their review of the document. In addition, we would like to thank the GPE Nigeria Country team, the Results and Performance team, the Independent Technical Review Panel, and our colleagues at Results for Development and Universalia for their inputs at every stage of the process. Finally, we would like to thank Dr Olatunde Akogun, and Garba Gombe for their work with us in Nigeria.

FINAL REPORT – NIGERIA xvi
© UNIVERSALIA
Executive summary
A) Overview
This is the last annual report to be submitted during the three-year prospective evaluation of the Global Partnership for Education (GPE) in Nigeria – one of eight country prospective evaluations that will be complemented by a total of 20 summative country evaluations, to be carried out between 2018 and 2020. It follows a baseline report on Nigeria that was submitted in May 2018 and a first annual report delivered in December 2018. This report presents the findings of the final prospective evaluation mission to the country, which took place in July 2019. The report offers conclusions on the basis of the data collection, monitoring and assessment undertaken throughout the evaluation period and is written as a standalone report for the prospective evaluation 2017 – 2020.
B) Purpose and objectives
The purpose of the prospective evaluations is to assess whether GPE’s inputs and influence are orienting education sector planning, implementation, monitoring, and financing toward the intermediary outcomes outlined in its theory of change (ToC). In the first two years of the evaluation, the prospective evaluations have been forward-looking, and explore what happens while it happens. They have closely observed initial decisions, documented the perspectives of decision-makers and focused on the activities and involvement of key stakeholders early in the period under review in order to understand whether progress is being made and whether, and to what extent, GPE is making a contribution. This report finalizes the evaluation for Nigeria with a summative view of the 2017-2020 period.
The objective of the prospective evaluations is to assess the relevance, efficiency and effectiveness of GPE’s inputs at the country level, as well as the validity of GPE’s ToC in light of the GPE Strategic Plan 2016–2020. The prospective evaluations seek to establish if and how GPE inputs and activities contribute to outcomes and potential impact at country level. They are designed to assess GPE’s progress on its goals and objectives.
C) Education in Nigeria
Responsibility for Education Policy in Nigeria is shared between Federal, State and Local Government authorities, with concurrent education authorities existing at state and federal levels. While state and federal ministries of education hold the core policy mandate for education, the Universal Basic Education Commission (UBEC), and State Universal Education Boards (SUBEBs) administer basic (primary and lower secondary) education. The education budget in Nigeria is also split between authorities, with the primary sources of funding being; households, direct federal transfers to local government authorities, the Universal basic education intervention fund, and state budgets (both from federal transfers and locally generated revenues). Schools operate a 1-6-3-3-4 system, with one year of pre-primary, six years of primary, three years of lower and upper secondary, and four years of tertiary education.
GPE funding in Nigeria between 2013 and 2019 has focused on five states in the north-west. The northern states of Nigeria are characterized by a paucity of reliable data on access, equity and learning outcomes, as well as on financing. Overall Nigeria has the largest population of out of school children in the world (13.7 million) and many of these are in Northern states. Among those counted as being out of school, a significant

FINAL REPORT – NIGERIA xvii
© UNIVERSALIA
proportion attend un-registered Islamiyya and Quranic Schools, which in some cases outnumber registered schools. Where learning outcomes have been measured, it has been demonstrated that the majority of students in these northern states are failing to meet basic minimum standards in literacy and numeracy.
D) GPE in Nigeria
Nigeria became a GPE member in 2013 and between then and 2019 US$ 101,342,420 has been awarded in grants, of which US$ 81,153,663 has been disbursed at the time of writing. This comprises of two grants to the Civil Society Action Coalition for Education for All (CSACEFA), an Education Sector Plan Development Grant (ESPDG), a Program Development Grant (PDG) and an Education Sector Plan Implementation Grant (ESPIG). The ESPDG granted in 2013 supported improvements to the Medium-Term Sector Strategies (MTSSs) of Jigawa, Kaduna, Kano, Katsina, and Sokoto (the five NIPEP focal states), while the PDG funded the design of the Nigeria Partnership for Education Project (NIPEP), funded by the US$ 100,000,000 of ESPIG funding.
NIPEP began implementation in 2015 and is due to close in June 2020. Its focus has been on:
1) Promoting School Effectiveness and Improved Learning Outcomes (US$ 42,000,000)
2) Increasing Access to Basic Education for Out-of-School Girls (US$ 40,000,000)
3) Strengthening Planning and Management Systems, Including Learning Assessment and Capacity Development (US$ 18,000,000)
NIPEP funding has been split between the five aforementioned states, as well as the federal government. While NIPEP has been primarily implemented by state ministries of education (with support from other state level agencies) with the World Bank acting as the Grant Agent (GA). In 2019 a second ESPDG was granted to Nigeria to support the development of a national Education Sector Analysis (ESA), and the development of a National Education Sector Plan (NESP) based on the Ministerial Sector Strategy.
GPE’s work in Nigeria has been supported by USAID who acted as the coordinating agency until 2019, at which point DFID took over the role. At the state level, USAID (Sokoto), DFID (Jigawa, Kaduna, Kano) and UNICEF (Katsina) have supported the implementation of ESPDG and NIPEP funding, as well as providing support to grant applications.
E) GPE contributions to sector planning
State of sector planning in Nigeria
There is a long history of the release of funding being linked to the production of state level education
sector plans (ESPs) in Nigeria. This has included both development agencies (including GPE) and
government departments and units (UBEC). Interviews confirmed that in previous years plans were used
predominantly for NIPEP (the ESPIG funded project in Nigeria), occasionally by Development Partners (DPs)
but not by states. This incentivized plan development, rather than plan implementation and resulted in
plans being built for funding requirements rather than alignment to a sector-wide strategy at state level or
a national strategic framework. Over the years, this has resulted in a plethora of plans, not aligned with
each other or with the actions required to achieve the goals of the plan.

FINAL REPORT – NIGERIA xviii
© UNIVERSALIA
Improvements or stagnation in the quality and use of plans is predominately driven by individuals in key
roles at the national and state levels and the relationships between them. However, between 2013 and
2019 modest improvements have taken place in both the planning process and in plan alignment and
content, due to the increased focus on planning at the national level. A renewed focus on planning globally
(through both the GPE and UNESCO International Institute of Education Planning) stimulated DP focus on
planning in Nigeria, and during the evaluation period several DPs provided support to plan development,
monitoring and utilization at the state level.
Between the first and second annual missions, there was a stronger focus on education planning and it
became the central issue in education sector dialogue. With support from UNICEF, recently developed
ESPs and Mid Term Sector Strategies (MTSS) aligned with the previous overarching priorities of the state
plans and show improvements in quality and ownership.
The plans endorsed by GPE were found to not be credible, however this evaluation finds that the decision
to endorse the plans has likely increased government ownership of the plans and provided opportunities
to re-focus on education sector planning in sector dialogue in Nigeria. In 2013, GPE provided an ESPDG to
fund the appraisal of the three-year state level Education Sector Plans that were already in place. This
appraisal resulted in the conclusion that there was ‘room for improvement’ across all of the appraisal
criteria. The lack of credible baseline data, targets and performance indicators, and serious concerns
regarding tracking expenditure were raised as major concerns. The three-year plans were revised at the
request of GPE and were resubmitted with the grant application in 2014. In August 2014 the plans were
again appraised.9 It was found that while the documents were better organized, the same weaknesses
identified in the original plans remained. Key Informant Interview (KIIs) from the 2018 country mission
confirmed that no action had been taken to development monitoring or expenditure tracking strategies as
has been suggested.
As the country approaches the next planning stage, there is genuine recognition across actors that sector-wide improvements cannot take place until there is better planning and alignment across plans. It essential that during the next policy cycle, cohesive planning with state level strategic and operational places and the alignment of the Ministerial Strategic Plan (MSP), State Education Sector Plans (SESPs), Medium Term Sector Strategies (MTSSs), state basic education plans, DP plans, annual workplans and local government plans takes place.
GPE contributions
Contributions from several partners in Nigeria have modestly improved education planning in Nigeria.
GPE’s funding, as well as its application of standards and advocacy for focused education sector planning,
has focused DPs on planning and have ensured that these contributions are greater than the sum of their
parts. DFID, UNICEF and USAID have sharpened the focus on education sector planning in Nigeria
throughout the previous policy cycle, and this was predominantly catalyzed by incentives provided through
GPE grants, GPE provision of technical support to planning and GPE global advocacy on the importance of
9 Addendum of the August 2013 Appraisal of Education Sector Plans of Five States of the North West Region of July 2013. Report prepared for the Global Partnership for Education and Nigeria Development Partner Group. August 2014.

FINAL REPORT – NIGERIA xix
© UNIVERSALIA
planning. DFID and USAID programs have provided state support for planning historically in the states they
support, and UNICEF has always had a stronger state presence than other DPs in Nigeria.
While NIPEP has not provided the support for planning as originally intended, the combination of financial
support through the ESPDG, technical support provision and GPE global advocacy for education sector
planning has begun to change the focus of education sector dialogue in Nigeria towards improving
government ownership, alignment, quality and utility of sector plans.
F) GPE contributions to sector dialogue and monitoring
State of sector dialogue and monitoring in Nigeria
Dialogue in Nigeria predominantly consists of project-based bilateral discussions that occur on an ad-hoc basis. Various mechanisms exist to support education dialogue in Nigeria; however, they remain unused. The National Education Group (NEG) has been revitalized as a result of the upcoming ESPIG application and an enthusiastic Permanent Secretary (PS). Sustaining this progress will rely on increasing and maintaining buy in across ministry leadership.
Dialogue in Nigeria needs to both take place at the Federal level (where policy direction is set) and the state level (where sector plans are formed). Therefore, the GPE assumption that the ESP is the framework within which national stakeholders and DPs have sector dialogue does not hold in Nigeria. The introduction of a national sector plan may change this, however there is a lot of work that would need to be undertaken to create a unified framework to link national and state plans. The limited authority of the federal government over state ministries of education may constrain this work.
While there is a renewed discourse on the need to revitalize dialogue, there is little evidence of routine dialogue at national or state levels in Nigeria. The lack of sector dialogue extends to dialogue between key Nigerian stakeholders. The concurrent system in Nigeria, in which multiple state actors fund capital interventions, are not supported by a meaningful forum for dialogue and there is no mechanism to build mutual accountability between them.
Education monitoring is predominantly undertaken at the project level. There remains very few realistic monitoring systems, strategies and data production at the state and national levels, as reflected in the GPE appraisal and reappraisal of the state ESPs. In addition, there has not been a credible joint sector review in any state in Nigeria or at the federal level. A series of state reports produced using NIPEP funds, carried out by a consultant (the annual education sector performance reviews) form the only progress in monitoring progress against the MTSSs in the five NIPEP states. However, UNICEF is currently committed to supporting greater accountability by promoting JSRs in the states in which it is supporting planning. The first of these will be carried out in 2020.
The complex institutional mandates for monitoring and the projectization of education implementation in Nigeria frustrates systemic monitoring. Both federal and state governments have the institutional mandate to monitor and support to states to improve monitoring is provided through development programs that do not work across all states. There is a lack of outcome data across all national and state systems and data produced by DPs often represent project level geographies or sampling frames and where monitoring documents are produced, there is little appetite to disseminate and discuss progress. The 2017 Annual Education Sector Performance Reviews (AESPRs) highlighted the poor data quality and data unavailability, minimizing AESPR value in truly assessing education sector performance and system

FINAL REPORT – NIGERIA xx
© UNIVERSALIA
efficiency. Three years on, the issues with availability and quality of data for monitoring remain. The key monitoring documents produced in the policy cycle were the AESPRs, which were produced in all five states in 2017. These reports were developed by a third-party contractor. While there is consultation with a broad range of stakeholders, informants confirmed that once the reports were produced, there was little appetite to review or discuss the findings across stakeholder groups.
There is currently an effort to introduce a national learning assessment. The World Bank is working with the federal government to develop a national learning assessment tool. There remains very little evidence that the current strategy will result in nationally representative data on learning levels for technical, logistical and capacity reasons.
GPE contributions
The complexity of dialogue mechanisms in Nigeria limits monitoring and little progress has been made
over the period of this evaluation. Both the frequency and quality of sector dialogue has constrained
progress in mutual accountability over the last policy cycle. Multiple dialogue structures exist at the federal
level, but none of them fulfil a meaningful function in supporting mutual accountability, and all struggle to
meaningfully involve actors at state level. At the state level dialogue structures are inconsistent and
sporadic.
GPE support to monitoring and dialogue has included NIPEP technical support, financial support for
monitoring and dialogue through NIPEP (support for AESPRs and Component 3 of NIPEP), financial support
for the CSACEFA and global advocacy for dialogue and monitoring. GPE support was also instrumental in
the formation of the federal LEG in 2015, however this support has not extended to maintaining or
sustaining its membership or focus.
There are some indications that dialogue and monitoring will improve over the upcoming policy cycle in
Nigeria, however for improvements to lead to mutual accountability, serious efforts to improve dialogue
and monitoring at the state level are needed. The greatest potential GPE contribution to dialogue and
monitoring in Nigeria could be through the Coordinating Agency (CA) role as a new set of circumstances
unfold. Funding for a coordination position with DFID, as they take on the CA role, and the large World Bank
BESDA program, provide new opportunities to shift projectized dialogue and monitoring towards a sectoral
focus exist.
G) GPE contributions to sector financing
State of sector financing in Nigeria
Domestic spending on education is complex and opaque in Nigeria. Due to overall economic development,
domestic spending on education is declining and the total spending devoted to education is around 10
percent. However, this figure is reasonably unreliable as state budgets and direct local government
transfers remain elusive. Before 2004, primary responsibility for education funding lay with state
governments. However, since the universal basic education act this has not been entirely the case.
Teachers’ salaries are ringfenced from federal revenues and paid directly through Local Government

FINAL REPORT – NIGERIA xxi
© UNIVERSALIA
Authorities10 by the Federal Account Allocation Committee (FAAC). In addition to this two percent of the
federal consolidated revenue fund is ringfenced for UBEC and distributed through the UBEC intervention
fund – split equally among states. The rest of funding for education – administered through the SMoEs and
LGAs – comes from federal transfers to state governments through the FAAC,11 and locally generated
revenues (both at state and local government level).
The introduction of earmarked funding for education through national resource revenue has tied funding
to oil process and combined with complex and inefficient budgeting systems has led to unreliable and
unpredictable funding. In addition, the variety of funding sources, low release rates and issues of reliability
and allocation of resources has led to the severe underfunding of non-salary projects. The unpredictability
of income for schools has led to a growing reliance on donor funding, and revenues raised from
communities by the School Based Management Committees (SBMCs). ESSPIN reporting12 on the multiplier
effects of supporting SBMCs with resource mobilization efforts found that funding was leveraged at a ratio
of 5:1
Ultimately, the lack of clarity in funding means that planning and accountability in the sector are almost impossible and these issues cannot be solved separately from institutional reform.
The absolute amount of ODA being directed to education has increased since 2011. However, the proportion of ODA going to education has fallen slightly and remains low, at 5%. The share of education ODA being spent on basic education has increased over the same period. However, what is not shown in these figures is the geographic spread of ODA. While no state level data is available through the Creditor Reporting System (CRS), due to the limited geographical range of major donors (e.g. USAID in Sokoto and Bauchi, and DFID in Jigawa, Kaduna and Kano) it is likely that there is significant imbalance in the contribution of ODA for education between states and geopolitical zones.
International financing in Nigeria performs very poorly on measures of alignment and accountability – with most projects being off-budget and not aligned with government planning.13 However, programs such as NIPEP and the World Bank’s Better Education Service Delivery for All (BESDA) program which use government fiduciary systems, and the revitalization of the NEG point to potential improvements in the quality of international financing.
10 The funding comes to LGEAs through the FAAC – but in many states the portion for teachers’ salaries is transferred upwards to SUBEBs who have the administrative capacity for managing salary payments. 11 Total FAAC funds are split between Federal Government (52.68%), States (26.72%) and local governments (20.60%). FAAC shares resources for state governments based on five criteria: equally for all states (40%), population (30%), landmass and terrain (10%), social development (10%), and internal revenue generation effort (10%). 12 From the 2015 SBMC resource mobilization validation study http://www.esspin.org/reports/download/442-file-SBMC-Validation-Joint-Report-final-Oct16.pdf 13 The best proxy available for this is the amount of funding reported to the CRS as being contributions to pooled funds or budget support. For 2017, no money was disbursed as sector budget support for education, and 15 percent was to funds managed by NGOs – i.e. off-budget pooled funds. The rest was a combination of project interventions (66 percent) and technical support and scholarships (21 percent).
FINAL REPORT – NIGERIA xxii
© UNIVERSALIA
GPE contributions
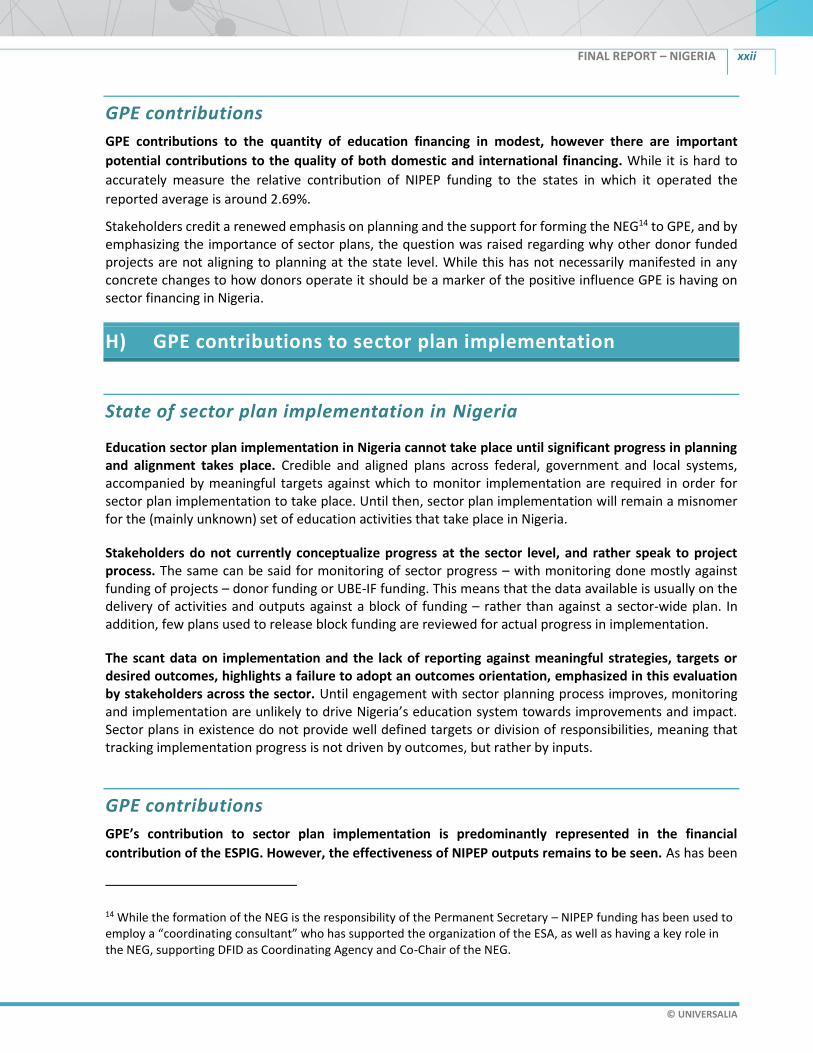
GPE contributions to the quantity of education financing in modest, however there are important
potential contributions to the quality of both domestic and international financing. While it is hard to
accurately measure the relative contribution of NIPEP funding to the states in which it operated the
reported average is around 2.69%.
Stakeholders credit a renewed emphasis on planning and the support for forming the NEG14 to GPE, and by emphasizing the importance of sector plans, the question was raised regarding why other donor funded projects are not aligning to planning at the state level. While this has not necessarily manifested in any concrete changes to how donors operate it should be a marker of the positive influence GPE is having on sector financing in Nigeria.
H) GPE contributions to sector plan implementation
State of sector plan implementation in Nigeria
Education sector plan implementation in Nigeria cannot take place until significant progress in planning and alignment takes place. Credible and aligned plans across federal, government and local systems, accompanied by meaningful targets against which to monitor implementation are required in order for sector plan implementation to take place. Until then, sector plan implementation will remain a misnomer for the (mainly unknown) set of education activities that take place in Nigeria.
Stakeholders do not currently conceptualize progress at the sector level, and rather speak to project process. The same can be said for monitoring of sector progress – with monitoring done mostly against funding of projects – donor funding or UBE-IF funding. This means that the data available is usually on the delivery of activities and outputs against a block of funding – rather than against a sector-wide plan. In addition, few plans used to release block funding are reviewed for actual progress in implementation.
The scant data on implementation and the lack of reporting against meaningful strategies, targets or desired outcomes, highlights a failure to adopt an outcomes orientation, emphasized in this evaluation by stakeholders across the sector. Until engagement with sector planning process improves, monitoring and implementation are unlikely to drive Nigeria’s education system towards improvements and impact. Sector plans in existence do not provide well defined targets or division of responsibilities, meaning that tracking implementation progress is not driven by outcomes, but rather by inputs.
GPE contributions
GPE’s contribution to sector plan implementation is predominantly represented in the financial
contribution of the ESPIG. However, the effectiveness of NIPEP outputs remains to be seen. As has been
14 While the formation of the NEG is the responsibility of the Permanent Secretary – NIPEP funding has been used to employ a “coordinating consultant” who has supported the organization of the ESA, as well as having a key role in the NEG, supporting DFID as Coordinating Agency and Co-Chair of the NEG.

FINAL REPORT – NIGERIA xxiii
© UNIVERSALIA
noted under financial contributions, GPE support in Nigeria is split between five states and is relatively small
compared to the total education sector budget. However, ESPIG funding is strategic, in that support for
greater harmonization between donor programs and scaling up and pushing for the institutionalization of
key initiatives (such as a girl child scholarship program) have been a key area of support.
Technical support from the Secretariat and through GPE global level advocacy do not reach the state level in Nigeria, where responsibility for implementation resides. In addition, capacity building is limited because the planning and direction of NIPEP is located federally and engagement with actors in the SMoEs is not evidence. While these issues reflect the larger context of governance in education in Nigeria, a conscious recognition of this should be accounted for in planning for the next ESPIG funded project.
GPE direct support for implementation is predominantly represented in the disbursement of grants and scholarships and the number of SBMC members who received training. However, the effectiveness of NIPEP outputs on impacting progress towards statewide improvement remains to be seen. At least one state government (Kano) has institutionalized a project introduced by NIPEP to households to encourage the enrollment of female children. According to informants training for SBMCs has also now become funded by state governments across NIPEP states. In addition, our analysis finds that it is likely that the design of NIPEP has informed the design of larger programs in Nigeria, however that NIPEP has also been informed by past projects (like DFID’s Education Sector Support Program in Nigeria).
I) Education System Strengthening
System level change
Several interventions have sought to address the issue of access and equity in Nigeria, but the extent to which they have been successful cannot be ascertained in the absence of data. In addition, while state governments have been involved in institutionalizing and scaling up interventions to improve education quality, the key push for improving quality and relevance of education has come from DPs. Each State Ministry of Education (SMoE) contains a monitoring and evaluation unit, which is the responsible body for collating EMIS data. However, Nigeria remains a weak environment for data use. Nationally the GPE results framework (indicator 14) confirms that Nigeria has not reported any data on any of the 14 key UIS indicators in the last three years. In addition, there is currently no functional system-level learning assessment in place. The closest Nigeria has to a unified learning assessment is the National Assessment of Learning in Basic Education (NALABE). It is however widely agreed that NALABE is not reliable (in terms of consistency over time) or comprehensive enough (covering a wide enough range of demographic characteristics) to provide the necessary data for policymakers.
Very few improvements to the curriculum have taken place over the past ten years due to funding constraints. Starting with ESSPIN, School Based Management Committees (SBMC) have been established and have improved community-level accountability15 and the strengthening the function of school support officers has taken place to oversee the quality and professional development of teachers. Progress has been
15 See ESSPIN’s evaluation of SBMC contributions to community engagement in education: http://www.esspin.org/esspin-documentation/experience-papers/SBMC-engaging-communities-in-school-improvement.pdf

FINAL REPORT – NIGERIA xxiv
© UNIVERSALIA
made in the registration of Islamiyya and Quranic Schools (IQS), but challenges remain. Attempts to integrate them into the main-stream education system have in the past been met with suspicion. Efforts are also hampered by the lack of data on the number, quality, enrollment and ownership of IQS. In the last five years, UNICEF through the DFID-funded Girls Education Project (GEP) has been working with a range of government bodies. In 2019, GEP3 work in Kano state has resulted in the integration of 412 unregistered IQS – out of a total of 12,500.
Likely links between sector plan implementation and system level change
During the review period none of the five focus states had a credible sector plan that acted as a core guiding document for policymaking or implementation. This means that looking to tie system level changes to sector plan implementation is not the best way of linking them to government impetus or direction. In the absence of a common sector plan, either at state level or federal level – it is enormously difficult to create system level changes that become institutionalized and reliable. Decades of disjointed donor programming has led to a system that is built around short-term interventions. When speaking to stakeholders, it is a commonly shared narrative that system changes come and go – arriving with new projects and mostly disappearing when funding runs out and the focus shifts to something else.
This highlights the importance of planning and mutual accountability. There are several system changes that probably have a positive impact on a small scale (such as the strengthening of the SBMCs or the registration of IQS), which would have the potential for much greater success if they could be linked to a detailed sector plan against which their implementation could be monitored. This would make change much less reliant on individual political will, and the drive and support of donors.
J) Learning outcomes and equity
Changes in learning outcomes, equity and gender equality
The analysis of student outcomes in Nigeria is challenging as data available from the annual school census at state level is unreliable and inconsistent in the indicators reported on across states. However, a valuable development since the publication of the first annual report of this prospective evaluation has been the publication of the full results of UNICEF’s 2017 multiple indicator cluster survey (MICS) for Nigeria in late 2018. This data gives an insight into changes in student outcomes. The story nationally is not good, with deterioration visible in many key indicators. The picture in the NIPEP states is also not good, but is marginally better, with improvements visible in gender equity of attendance rates, and in engagement in Early Childhood Education (ECE).
What can be seen from the limited data available -and taking into account the limited range of sources and potential unreliability in the data – is that the NIPEP states have fared in general better than the country as a whole with several key indicators improving at state level but not nationally. Overall improvements are not significant, but any improvements should be seen as a positive development.

FINAL REPORT – NIGERIA xxv
© UNIVERSALIA
There is currently no nationally representative learning assessment in Nigeria. The closest is the National Assessment of Learning in Basic Education – administered by UBEC. The most recent NALABE was carried about in 2017, but the results have not yet been published. While there is no state or national level data on learning outcomes, project level data available shows that learning outcomes for children in school are low. In project samples learning outcomes have remained low but stable, but this is likely due to the interventions – outcomes for non-intervention samples have likely fallen in recent years. These limited results show that there is a crisis in learning in northern Nigeria with no sign of improvements. More disaggregated data would help further define what individual or social characteristics shape learning, but this data is not readily available.
Likely links to observed system level changes
The Nigeria case highlights the difficulty of reforming decision making when there is very little data
available. The link between ESP implementation, systematic change and student outcome indicators
cannot be definitely established. Data on outcome indicators is neither consistent nor comprehensive
enough and reporting on system level changes is not detailed enough for concrete conclusions about the
causality of changes to be drawn. Therefore, the conclusion is that in a system as complex as Nigeria, causal
links are naturally more difficult to attribute at the student level, and this is compounded by the fractured
nature of implementation (which would require equally granular student data), and the lack of reliable data
either on system level changes or student outcomes. Furthermore, in complex systems, change is a more
incremental process, and results may take longer to become apparent.
K) Conclusions and Strategic Questions
Conclusions
The following conclusions can be drawn regarding GPE support to Nigeria:
1. The fact that so few of the assumptions underlying the theory of change in Nigeria were found to be plausible makes the question of the value of GPE’s model in the Nigerian context unavoidable. The fundamental pre-requisites for success (as represented by the assumptions that underpin the GPE ToC) are not present in Nigeria, and therefore, there is a clear imperative to look outside the standard theory of change and operating model. An approach more in line with the needs of a large, complex federal state such as Nigeria must be considered.
2. Progress in Nigeria is slow, incremental and politically complex. The multi-layered system, the size of the country and the system, and the almost complete lack of reliable data on enrollment, learning and financing makes Nigeria unlike any other GPE member country. Given the number of OOS children in Nigeria and the current learning crisis improvements in education service delivery is a “must win” battle. On the other hand, the recognition that progress in Nigeria is incremental should not become a reason for setting low expectations or demands for the government and other GPE partners. Future efforts should focus on setting achievable, explicit targets for funding. If performance-based funding were to be introduced, serious consideration should be given to what targets can be realistically achieved, and whether they can be credibly measured.

FINAL REPORT – NIGERIA xxvi
© UNIVERSALIA
3. The issues in developing credible sector plans in Nigeria demonstrate that effectively the GPE theory of change is not appropriate for Nigeria. As demonstrated throughout this report – the country level ToC that GPE uses does not work in Nigeria. For that reason, it is necessary for GPE and its partners to consider what a more effective model for Nigeria would look like. One option is to place the primary focus not on strengthening implementation through planning, but instead focusing purely on dialogue, data production and accountability – as a precursor or support mechanism for state governments to begin to engage in their own planning processes (with support from actors such as UNICEF).
4. The plethora of plans that do not align are the result of a complex system and a history of funding incentives driving planning rather than driving action against developed plans. The approach taken by GPE, of incentivizing better planning through conditionality for ESPIG applications, may not be the best one to take in Nigeria, as it runs the risk of creating incentive systems that link the creation of plans to external funding rather than to system strengthening. GPE should be wary of how its funding supports reform in institutional norms around external funding for education.
5. At the beginning of this policy cycle, the Secretariat decided to endorse plans that were not credible. This decision has (partially) paid off and small, incremental improvements in planning have taken place. However, the cost of non-credible plans being in place has been very little progress in dialogue, monitoring or implementation. Beyond this there is a question of what a credible plan in the case of Nigeria would look like, and what the structure of planning between different state and federal actors would look like. In light of the deficiencies in data production and financial forecasting, it is doubtful that states could produce useful statewide operational plans at this point. If in retrospect it is to be considered that the decision to endorse the Medium-Term Sector Strategies in 2015 was the correct one – how will the plans for the new states be appraised, particularly considering that they may not have received any external support in developing plans. If the strategy in Nigeria is to give softer endorsements than in other countries, then this should be done explicitly, and a new set of success criteria (or adapted standards) should be developed for Nigeria.
6. In rethinking the theory of change for Nigeria, actors should consider timescale, with incremental change across funding cycles. For example, the contribution claim that GPE support and influence contribute to the development of government-owned, credible and evidence-based sector plans may hold true over two or three policy cycles rather than one policy cycle. The extent to which the Secretariat is comfortable with such a long lag time to improve one step in the ToC is worth consideration. The evaluation team views that the consideration of a long-term strategy (that may require larger investments than other countries) would suit the challenges in Nigeria’s education service delivery and the sheer number of learners in the country. This discussion should however, also consider how much influence GPE (and other partners) have in pushing for change in institutional norms and practices. Considering the relatively minor financial input that GPE has, focus should be placed on strategic inputs – such as focusing on improving dialogue or monitoring.
7. The operating model of supporting dialogue through the CA and LEG is severely challenged by the size and complexity of the sector in Nigeria. While there are positive signs of improved dialogue and coordination in Nigeria, they exist only at the federal level, and have been somewhat limited in scope. For these improvements to move beyond the federal level, and become truly inclusive and far reaching, huge coordination and investment is needed. If GPE aims to effectively support better sector dialogue, the question of how this can be supported and funded should be asked. The

FINAL REPORT – NIGERIA xxvii
© UNIVERSALIA
CA role cannot be undertaken in at the sector wide level in a complex decentralized country as large as Nigeria, without significant increases in the resources provided. The ToC is not well aligned to large decentralized states. It is worth considering if financing for the CA should be provided and if resources should increase with the size of the country. The use of ESPIG funding to support the role of the CA is a positive development and should be institutionalized in the next grant.
8. GPE should reflect on the understanding of alignment of funding. In the results framework, alignment is measured on nine criteria.16 Using these criteria, the funding in Nigeria performs well – however in reality this assessment does not capture the situation in Nigeria. While GPE funding in Nigeria is closely aligned to SMoE systems, it has no alignment with UBEC/SUBEB, which are the primary channels for basic education funding. While this does not mean that the RF assessment is inaccurate, it does miss a deeper examination of the implications of how funding is delivered.
Strategic questions
The findings of this evaluation necessitate several strategic questions regarding GPE support to Nigeria:
1. Partners should consider a re-prioritized approach to the GPE theory of change. It is clear that the country level theory of change here evaluated does not function in Nigeria as it does in other countries. When looking at the long term of GPE support to Nigeria, more thought should go into what a theory of change for achieving GPE higher level outcomes (stronger education systems, and better access, equity and learning outcomes) in Nigeria would look like. This means taking a bottom up approach – starting with Nigeria’s specificity, rather than a top-down approach, starting with GPE global theory of change and grant-making and partnership structures.
2. A long-term vision for states is needed, to bridge across GPE funding cycles. The next ESPIG is unlikely to target the five states targeted by NIPEP, and the 2019 ESPDG is focused on FMoE planning, rather than on the states previously supported. If the strategy is to be rotating support for states, then a clear exit strategy is needed to ensure that progress made in states is maintained and built upon.
3. More analysis is needed on planning and use of plans between levels of government to create a meta-framework for planning. The decision to support the development of national education sector plans is one with some merits, but also one that relies on significant assumptions about how the NESP will be used to inspire improvements in state level planning. Considering the number and complexity of plans being created currently, a worthy intervention for GPE to focus on would be looking in more detail at how plans are used, and the relationship between plans at different levels of government.
4. A revised approach to coordinating dialogue and the role of the CA is needed. The use of NIPEP funding to support a coordinating consultant, along with the provision of dedicated resources by DFID to the role of coordination is an important step in improving dialogue at the federal level in
16 Alignment is defined on RF indicator 29 by 10 questions across 7 criteria – with a grant being considered aligned if it meets at least 7 out of 10 questions. Nigeria scores 8 out of 10 in the latest RF assessments.

FINAL REPORT – NIGERIA xxviii
© UNIVERSALIA
Nigeria. This should be built upon, again by looking to take a bottom up approach to structuring GPE support to dialogue and coordination.
5. If results-based financing (RBF) is to be considered, a thoughtful approach which considers monitoring limitations will be required. The issue of results-based financing is made difficult by the absence of reliable data against which to monitor progress towards targets. However, this does not mean that RBF should not be considered. If RBF is to be considered by GPE, specific focus should be placed on setting targets that can be measured, and will provide motivation in the right areas. This would potentially mean focusing on high level process indicators – such as releasing funding based on the continued function of the NEG, or on progress towards establishing state level JSRs (or any number of other similar indicators).

FINAL REPORT – NIGERIA 1
© UNIVERSALIA
1 Introduction
1.1 Background and purpose of the prospective evaluation
1. The Global Partnership for Education (GPE) is a multilateral global partnership and funding platform established in 2002 as the Education for All Fast Track Initiative (EFA/FTI) and renamed GPE in 2011. GPE aims to strengthen education systems in developing countries, in order to ensure improved and more equitable student learning outcomes, as well as improved equity, gender equality and inclusion in education.17 GPE brings together developing countries, donor countries, international organizations, civil society, teacher organizations, foundations and the private sector.18
2. This evaluation is part of a larger GPE study that comprises a total of eight prospective and 20
summative country level evaluations (CLE). The overall study is part of GPE monitoring and evaluation
(M&E) strategy 2016-2020, which calls for a linked set of evaluation studies to explore how well GPE
outputs and activities contribute to outcomes and impact19 at the country level.
3. The objective of each prospective CLE is to assess if GPE inputs and influence are orienting
education sector planning, implementation, financing and dialogue/monitoring toward the
intermediary outcomes as outlined in the Theory of Change20 (ToC). The prospective evaluations are
forward-looking and explore what happens while it happens. They closely observe initial decisions,
document the perspectives of decision-makers and focus on the activities and involvement of key
stakeholders early in the period under review in order to understand whether progress is being made
and whether GPE is making a contribution.
4. In this context, GPE support is defined as both financial inputs from GPE grants and related funding requirements, and non-financial inputs from the work of the Secretariat, the grant agent and the coordinating agency, and from GPE’s global-level engagement (e.g. technical assistance, advocacy, knowledge exchange, quality standards and funding requirements).
Box 1 – Scope of this prospective evaluation
This prospective country evaluation is focused on eliciting insights that can help GPE assess and, if needed,
improve its overall approach to supporting developing country partners. It does not set out to evaluate the
performance of the government of Nigeria, other in-country stakeholders, or of specific GPE grants.
The core review period for the evaluation is 2012-2019. This period is covered by a baseline report and two
annual reports, which aim to track changes resulting from GPE activities. This report presents a stand-alone
17 Global Partnership for Education (2016): GPE 2020. Improving learning and equity through stronger education systems. 18 Information on GPE partners can be found at https://www.globalpartnership.org/about-us 19 In the context of this assignment, the term ‘impact’ is aligned with the terminology used by GPE to refer to sector level changes in the areas of learning, equity, gender equality and inclusion (reflected in GPE Strategic Goals 1 and 2 described in the GPE 2016-2020 Strategic Plan). While the country evaluations examine progress towards impact in this sense, they do not constitute formal impact evaluations, which usually entail counterfactual analysis based on randomized control trials. 20 The GPE theory of change is shown in Annex B.

FINAL REPORT – NIGERIA 2
© UNIVERSALIA
summative perspective at the end of the evaluation period, and in Section 6, addresses changes between
reporting periods.
1.2 Methodology overview
5. The methodology for the prospective evaluations is a theory-based contribution analysis approach, and the guiding framework is provided in an evaluation matrix and a generic country-level ToC, developed according to the existing overall ToC for the GPE Strategic Plan 2016–2020. The evaluation methodology envisages a seven-stage process. The first four stages focus on establishing a solid baseline for each country and the subsequent three stages constitute iterative annual country-level reporting. This is further described in Annex C and in the inception report.
6. There are three key evaluation questions for the GPE country-level evaluations (both the
prospective and summative evaluation streams), which are presented below. The full details of the
evaluation questions are presented in an evaluation matrix (included in Annex A). Figure 1 represents
how these key evaluation questions relate to the contribution claims21 investigated in the evaluation:
▪ Key Evaluation Question I: Has GPE support to Nigeria contributed to achieving country-level objectives related to sector planning, sector plan implementation, sector dialogue and monitoring, and more/better financing for education?22 If so, how?
▪ Key Evaluation Question II: Has the achievement of country-level objectives23 contributed to making the overall education system in Nigeria more effective and efficient?
▪ Key Evaluation Question III: Have changes at education system level contributed to progress toward impact?
7. The guiding frameworks for the evaluation are the evaluation matrix (Annex A) and the country-
level theory of change for Nigeria (Annex B). A brief summary of the country evaluation methodology
is provided in Annex D of this report. For further details, please refer to the Inception Report for the
overall assignment (January 2018), and the revised approach for Years 2 and 3, published November
2018.24
8. This approach is consistent with that of the summative evaluations and thus contributes to their final combination in a 2020 synthesis report. In the application of contribution analysis, the prospective evaluations in Year 1 of the evaluation were forward-looking and assessed if inputs and influence in the education sector planning were conducive to intermediary outcomes, as per the ToC. Conversely, the summative evaluations trace the ToC ex-post the contribution of inputs to intermediate outcomes, outcomes and impact. These final prospective evaluations combine the forward-looking prospective evaluations from previous evaluation years with a final ex-post
21 The contribution claims are the theoretical mechanisms for change through GPE inputs. These are explained in more detail in Annex C 22 Organization for Economic Co-operation and Development (OECD) Development Assistance Committee (DAC) evaluation criteria of relevance, effectiveness, and efficiency. 23 GPE country-level objectives related to sector planning, plan implementation, and mutual accountability through sector dialogue and monitoring. 24 https://www.globalpartnership.org/content/modified-approach-country-level-evaluations-fy-ii-2019-and-fy-iii-2020

FINAL REPORT – NIGERIA 3
© UNIVERSALIA
evaluation of what has taken place since the previous annual report. The methodology for weighing, confirming and refuting evidence is presented in Annex F.
Figure 1 - The evaluation presents findings on key evaluation questions and contribution claims
9. The focus for data collection and analysis is relevant to the key indicators in GPE results framework and additional indicators described in the respective countries’ ESPs. The evaluation team has not collected primary quantitative data but instead has drawn upon secondary data to base the evaluation findings on a solid quantitative basis. In addition, two rounds of qualitative data collection were conducted in 2018 and 2019. Each of these contributes to this final report.
10. Key informant interviews (KIIs) were conducted twice during the present evaluation in Nigeria (in 2018 and in 2019) and gather information on the following main lines of inquiry:
▪ Education planning.
▪ The implementation of the Education Sector Plan (ESP) (including the stage of implementation against plans and implementation challenges).
▪ Sector dialogue.
▪ Monitoring (including the strengths and weaknesses of monitoring systems, both in terms of data production and transparency).
▪ Education financing.
▪ GPE financial and non-financial support in relation to the above topics.
▪ Donor partner activities.

FINAL REPORT – NIGERIA 4
© UNIVERSALIA
Box 2 – Color ratings in the CLEs
Throughout the report, we use tables to provide broad overviews of key CLE findings on the respective issue. To facilitate quick orientation, we use a simple color-coding scheme that is based on a three-category scale in which green equals ‘strong/high/achieved’, amber equals ‘moderate/medium/partly achieved’, red signifies ‘low/weak/not achieved’, and grey indicates a lack of data. In each table, the respective meaning of the chosen color coding is clarified. The color coding is intended as a qualitative orientation tool to readers rather than as a quantifiable measure.
11. For this Year 2 evaluation report, the evaluation team consulted a total of 49 stakeholders from
state and federal government, DPs and civil society (see Annex H for a list of stakeholders), and
reviewed a wide range of relevant documents, databases, websites as well as selected literature. This
is in addition to 62 stakeholders consulted in 2018 for the Year 1 report. Due to the federalization of
Nigeria, state level interviews were required. Three of five states were visited over the course of the
two years, while federal level interviews were conducted in both visits. In Year 1 the evaluation team
visited Sokoto and Kaduna states while in 2019, for the second year’s visit, the focus was placed on
Kano. In addition to the KIIs, the evaluation country team also carried out a number of focus groups
with teachers and school-based management committee members, as well as visiting a number of
schools to add nuance to findings on system changes and challenges faced by schools. Logistical
challenges made it impossible to visit all the states twice.
Purpose of Year 2 Evaluation
12. The value of prospective reporting is the room allowed for investigation of unexpected changes
and the examination of trends between years. This report is designed to read as a standalone final
evaluation of GPE contribution to education in Nigeria but will also include reflections on changes over
time between the baseline and this final report. The report also builds on the first-year report by
looking in more detail at the strength of evidence for claims made in Year 1, as well as a deeper testing
of the assumptions underlying GPE theory of change.
Limitations and Mitigation Strategies
13. The two major limiting factors in Nigeria were (a) the size and scope of GPE involvement – which encompasses the federal government and five focus states, raising logistical challenges for the evaluation team, and (b) issues with the availability and quality of secondary data on the education system.
14. Mitigation strategies for issue (a) involved spreading visits to key states over the course of two evaluation missions. In the first year, the evaluation team spent time in Kaduna and Sokoto state and in Abuja (the federal capital), while in the second-year focus was placed on Kano state and Abuja. While this did not cover all of the five NIPEP states – it gives an indication of trends across states, with the other states being covered through secondary data and remote interviews where necessary. For limitation (b) there was a less obvious remedy. The team worked to build up as much secondary data as possible, and then to filter the data for quality and reliability – focusing in Year 2, on using data from a limited range of reliable sources. By limiting the range of sources used, internal consistency was improved – allowing for better time-series comparisons – even if there were gaps in the data. Ultimately there are still blank spaces in the detail that this report can give at the outcome level and on financing. While this report gives important insights into the contribution of GPE to the education sector in Nigeria – there are areas, particularly in relation to financing and system changes in which conclusions cannot be reliably drawn.

FINAL REPORT – NIGERIA 5
© UNIVERSALIA
1.3 Structure of the report
15. Following this introduction, Section 2 presents the country context in which GPE support takes place. It documents: the broad political and geographical context of Nigeria; an overview of the education sector in Nigeria; and an outline of GPE financial and non-financial support to Nigeria.
16. Section 3 presents the evaluation findings related to GPE contributions to sector planning; mutual accountability through inclusive policy dialogue and sector monitoring; sector financing; and sector plan implementation.
17. Section 4 discusses education system-level changes in Nigeria during the period under review (2012–2019) and likely links between these changes and progress made towards the country-level objectives.
18. Section 5 presents an overview of the impact-level changes observable in Nigeria.
19. Section 6 presents the changes observed over time in Nigeria.
20. Finally, Section 7 presents overall conclusions of the evaluation and outlines several strategic questions to GPE.

FINAL REPORT – NIGERIA 6
© UNIVERSALIA
2 Context
2.1 Overview of Nigeria
21. Nigeria is the most populous country in Africa, with a population of 186 million people. It is also rapidly growing and registers an annual population growth rate of 3%.25 It is governed through a democratic federation and the constitution confers significant powers, resources, responsibilities and autonomy on the sub-national levels of government. Government is split between the federal government, the Federal Capital Territory26 (FCT) administration, 36 state governments, and 774 local government councils. The country is divided into six geo-political zones: South West, South, South East, North West, North East, and North Central.
22. With a GDP per capita in 2018 of
US$2,028,27 Nigeria is a lower middle-income country,
ranked 152 of 188 on the United Nations
Development Program’s 2016 Human Development Index. In 2018, the country emerged from an
economic recession (with GDP per capita falling from US$3,222 in 2014 to US$1,968 in 2017 before
beginning to rise again in 2018), which started in the second quarter of 2016, caused by an oil price
shock as well as shortages in domestic supply due to sabotage of oil export terminals by militants in
the Niger Delta. The recession was characterized by a shortage of foreign exchange earnings which led
to a depreciation of the national currency – the Naira – and hence a reduction in government’s ability
to fund critical interventions, as well as a rise in general prices.28
23. In response to the recession the federal government initiated the New Nigeria Economic Recovery and Growth Plan for the period 2017–2020 with a vision for sustained inclusive growth, and an emphasis on improving both public and private sector efficiency. The plan aims to increase national productivity and achieve sustainable diversification to significantly grow the economy and achieve maximum welfare for the citizens. It also encourages the use of science, technology and innovation to drive growth and focuses on building the capabilities of the youth of Nigeria to be able to take the country into the future.
25 National Population Commission (2017, May 14). Http://population.gov.ng/ (Publication). Retrieved February 19, 2019, from website of the Director General of the National Population Commission: http://population.gov.ng/nigerias-population-now-182-million-npc/ 26 The territory in which the capital, Abuja is situated. 27 This and subsequent figures for GDP per capita are taken from https://data.worldbank.org/indicator/NY.GDP.PCAP.CD?locations=NG and shown in current US$. 28 PricewaterhouseCoopers (2017) Nigeria's economic recovery Defining the path for economic growth. Retrieved February 26, 2018, from https://www.pwc.com/ng/en/assets/pdf/nigerias-economic-recovery.pdf
Figure 2 - Map showing five NIPEP states and FCT

FINAL REPORT – NIGERIA 7
© UNIVERSALIA
24. In recent years, the north-eastern region of Nigeria suffered from continued attacks by Boko Haram, a terrorist group. Their activities led to over 3 million internally displaced people, disrupted agricultural production and decimated educational infrastructure and activities in the North East zone.29 Furthermore, terrorist activities exacerbated the socio-economic disparities between northern and southern Nigeria. Even prior to the terrorist insurgency, approximately 34 percent30 of school-aged children in northern Nigeria did not have access to basic education and the region usually ranked lowest on most socio-economic and educational indices.31 Despite encountering fewer direct effects of the insurgency than the North East, the North Western Zone (in which GPE activities are focused) has seen substantial disruption of services caused by migration from the North East. Research undertaken by the World Bank found that out-of-school rates for 6–11-year-olds in the North West were 53 percent and 43 percent, for girls and boys respectively (compared with 31 percent and 25 percent nationally).32 In the North West, 20–33 percent attend non-integrated Qur’anic schools and are therefore considered out of school (they do not cover the mainstream curriculum, see section 2.1) while the rest of those counted as being “out of school” (i.e. the remaining 20–33 percent) have never attended any form of school.33
Education sector in Nigeria
25. The Nigerian education system can be described as a ‘1-6-3-3-4’ system: one pre-primary year (recently introduced) and six years of primary, followed by three years of junior secondary education—which together comprise basic education; the next three years are senior secondary education, followed by four years of tertiary education. Basic and senior secondary education remain mostly under the jurisdiction of the state and local governments, while the federal government is responsible for the administration of federally owned universities and Federal Unity Colleges that were set up to serve as model secondary schools. The Federal Ministry of Education (FMoE) has a policy formulation and coordination mandate, the National Council for Education (NCE) coordinates policymaking across the different tiers of government, and the Universal Basic Education Commission (UBEC) is the executive agency of the federal government responsible for basic education policy implementation.
26. Education in Nigeria is on the concurrent list, which means that the responsibility for education administration is divided among the federal, state and local governments, each with different remits and areas of responsibility. Immediately post-independence three parallel education systems existed – in the North, South-West and South-East. After federalization in 1970 these systems became further fragmented, with states beginning to take different approaches to administering their education systems. The Universal Basic Education (UBE) Act in 2004 was enacted in order to harmonize systems and ensure equitable funding for education. At the federal level the minister of education is the highest authority, supported by the commissioner for education – another political appointee chosen by the president – and the permanent secretary for education who is promoted from within the civil service. At the state level, the commissioner for education is appointed by the governor while the permanent secretary for education is promoted from within the ministry of education. While UBEC, and the State Universal Basic Education Board (SUBEB) at state level, is a parastatal, under the
29 UNICEF (2016) North East Nigeria: education sector year in review, 2016 (Issue brief). Retrieved February 19, 2018, from the website of Dr. Judith Giwa-Amu: https://www.humanitarianresponse.info/system/files/documents/files/education_sector_2016_year_in_review_factsheet2.pdf 30 The national rate of out-of-school children in Nigeria has not been reported to UIS since 2010. In 2010 the percentage of children out of school nationally was 34.3 percent. 31 UNICEF (2005) Education(Rep.). Retrieved from https://www.unicef.org/nigeria/children_1937.html 32 Nigeria Partnership for Education Project (NIPEP), Project Appraisal Document (PAD), 2015 33 NIPEP PAD (2015).

FINAL REPORT – NIGERIA 8
© UNIVERSALIA
jurisdiction of the Federal and State Ministries of Education – the UBEC/SUBEB chairs have executive chair status, meaning that they can make decisions without the approval of their respective permanent secretaries for education (both at the federal and state level).
27. The UBE Act created UBEC at the Federal level, SUBEBs and FCT UBEB at the State and FCT levels and LGEAs at local government (LGA) level. It also created the UBE-Intervention Fund which is 2% of Consolidated Revenue Fund (CRF) to be disbursed through UBEC to SUBEBs and FCT UBEB for improving access and quality of basic education. This is done through the Universal Basic Education Intervention Fund (UBE-IF), allocated through the SUBEBs. After the UBE Act, SUBEBs became primarily responsible for administering basic education at the state level, along with newly created local government education authorities (LGEAs) who are responsible for paying teachers and who own schools. LGEAs provide direct supervision of primary schools in their LGA areas of jurisdiction. Primary school teachers’ salaries are paid from the federally-collected revenue allocations of LGAs.
28. This restructuring has been widely assessed as creating poorly delineated and overlapping responsibilities, leading to inefficiency.34 At state level, the creation of the LGEAs and the SUBEBs means that schools and teachers that deliver both junior and senior secondary programs are administered by two separate bodies. In 2014, the World Bank reported that in many cases, this directive was simply ignored and schools had continued to operate as before.35 Along with the separate emergence of numerous state and parastatal bodies working in education (e.g. the National Commission for Nomadic Education and the National Council for Mass Literacy, Adult and Non-Formal Education) the UBE Act is viewed as having negatively impacted the communication and organization of basic education.36The amount of funding ring-fenced for SUBEBs has meant that at state level, the chair of the SUBEB is often seen by the state governor as a more powerful figure than the state Education Ministers, the state Commissioners and the state permanent secretaries. As the SUBEB chairs are executive positions, they are entitled to make decisions regarding basic education without consultation with the permanent secretary or the education commissioner. This causes tense relationships and the politicization of education management at both state and federal levels (a theme that will be explored throughout this report).
29. Positively, the UBE act enshrined payment of teachers in basic education. As part of the UBE Act, federal tax revenues are directed through the Federal Account Allocation Committee (FAAC) to Local Government Authorities (LGAs) to pay all teachers in basic education. This limits misallocation and ensures payment of teachers. This is in addition to the Universal Basic Education Intervention Fund (UBE-IF), which is also directly funded from federal revenue and evenly allocated across all states to deliver education infrastructure projects (50 percent of total UBE-IF funds are allocated as a state matching grant for infrastructure), as well as for various interventions to improve education access and quality. An outline of the funding implications of the UBE act is shown in Annex I. Table 1 gives an overview of the role and function of key education authorities outlined in this section.
Table 1 - Overview of Key Players in Nigerian Education System
Body Remit
Federal Level
Federal Ministry of Education Direction on National Level Policy Quality Assurance Administration of NEMIS
Universal Basic Education Commission
Disbursement of UBEC-IF and matching grants (2% of CRF funds) Quality assurance for ECD, Primary and Junior Secondary Schools and teachers
34 https://www.centreforpublicimpact.org/case-study/universal-basic-education-nigeria/#evidence 35 World Bank (2014). Public Expenditure Review for Basic Education in Nigeria. 36 http://jespnet.com/journals/Vol_2_No_5_December_2015/8.pdf

FINAL REPORT – NIGERIA 9
© UNIVERSALIA
Body Remit
State Level
State Ministry of Education Education Sector Planning Quality Assurance Collection and Compilation of Annual School Census Data
State Universal Basic Education Board
Administration of ECD, Primary and Junior Secondary Schools Monitoring and planning (overseen by SMoE)
State Senior Secondary Schools Board
Administration of Senior Secondary Schools
State Islamiyya and Quranic Schools Board
Administration of integrated Islamiyya schools Integration of non-integrated IQS
State Nomadic Education Board Care for schooling in nomadic communities
Local Government/School Level
Local Government Authorities Responsible for paying teachers Implementation of SUBEB programs
Source: Authors’ elaboration
30. At both national and state level there is a scarcity of reliable data on the number and enrollment status of school aged children. For all five states that take part in the Nigeria Partnership for Education Project (NIPEP), the Annual School Census (ASC) regularly reports NER figures of above 100 percent (which is impossible).37 Table 2 shows the reported enrolled populations from the UBEC national school census,38 compared with school aged (3-18) population estimated (population data not disaggregated by age range, so comparison only possible by state) and that the supposed enrollment, given these figures, is less than 50 percent. This aligns more with the findings from the KIIs for this evaluation.39 This disconnect between the data produced at state level and reality is a major barrier to evidence-informed and relevant policymaking. The 2015 estimate of the number of out-of-school children (OOSC) in Nigeria is 13.5 million – making Nigeria the country with the highest number of OOSC.40
Table 2 - Population of Enrolled Students and estimates of total school aged population
LEVEL AGE GROUP (YEARS)
SCHOOL AGED POPULATION (‘000s) ENROLLED STUDENTS (‘000s)
Jig41 Kad Kan Kat Sok Jig Kad Kan Kat Sok
Pre-Primary (ECD)
3-5 - - - - - 59 159 269 63 32
Primary 6-11 - - - - - 648 1,536 2,819 1,529 676
37 http://uis.unesco.org/en/glossary-term/net-enrollment-rate 38 While more recent data has been collected by state Annual School Censuses, these were not available for all states for the evaluation team – therefore the UBEC census has been chosen as an indicative substitute. It is recognized that states, under the NEMIS policy are best placed to collect data about the full spectrum of education, including TVET and non-formal education, as UBEC only has remit over basic education. 39 For example, in Kano – the GEP III study which looks at unregistered IQS estimated that there are at least 2 million OOSC in Kano state, but no census has verified or reported these figures yet. 40 Demographic and Health Survey 2015. According to UIS data, Pakistan, which is home to the second largest cohort of OOS children had 5.97 million OOS children in 2018, while India had 2.89 million OOS children in 2013. 41 Jigawa, Kaduna, Kano, Katsina and Sokoto – for practicality in tables throughout this report where the five states are referenced together, they will be displayed as such.

FINAL REPORT – NIGERIA 10
© UNIVERSALIA
LEVEL AGE GROUP (YEARS)
SCHOOL AGED POPULATION (‘000s) ENROLLED STUDENTS (‘000s)
Junior Secondary
12-15 - - - - - 145 305 441 266 200
Senior Secondary
16-18 - - - - - 86 166 272 169 78
Total42 3-18 2,099 2,971 4,708 4,518 1,799 938 2,166 3,801 2,027 986
Source: UBEC Statistical Yearbook 2014. http://ubeconline.com/data.php
31. Infrastructure is generally well funded through the UBE-IF and matching grants which are not needs assessed. This means that there is generally enough school infrastructure for students. The major issue with this model is that the UBE-IF grants are given at a flat rate to states, who invest the money in building schools without having accurate data to assess the needs of communities. As 50 percent of the UBE-IF grants, as well as the matching grants, go to infrastructure – there is clearly an imbalance between support for infrastructure and support for the quality of education.
Table 3 - Numbers of Registered Schools (including Private, Islamiyya and Quranic Schools) in five NIPEP states (UBEC, 2014))
LEVEL SCHOOLS
Jigawa Kaduna Kano Katsina Sokoto
Preschool / Pre-primary 605 1,533 1,765 467 333
Primary 1,998 4,225 5,732 2,217 1,990
Junior Secondary 424 411 875 246 177
Senior Secondary43 - - - - -
Source: UBEC Statistical Yearbook 2014. http://ubeconline.com/data.php
32. Teachers in Nigeria are certified by the Teacher Registration Council of Nigeria (TRCN) after attaining at least a National Certificate in Education (NCE) – which sets the threshold for being registered as a qualified teacher. In Kano and Kaduna states (and presumably in others, at least in the North-West) the distribution and quality of teachers44 flagged issues – with government officials reporting pupil-teacher ratios (PTRs) of up to 240:1 in some schools and 9:1 in other schools.45 School
42 This is an estimation based on the national population pyramid, and state population estimates. 43 As this data is collected by UBEC and not NEMIS – it does not include data on the number of Senior Secondary schools – though it can be assumed to be similar to the number of Junior secondary schools as in most cases they share facilities. 44 In 2018, Kaduna removed 20,000 teachers from service in response to problems with teacher quality – an incident which is explained in detail in section 4 of this report. 45 This data was presented by a key SMoE stakeholder but there is no accurate reportable data to substantiate the claims.

FINAL REPORT – NIGERIA 11
© UNIVERSALIA
Based Management committees work to ameliorate this by hiring community teachers, often at low pay, with no recognized qualification. This has led to very low standards of education in the north.
Table 4 - Teacher Statistics at Primary and Secondary School Level (NEMIS, 2016)
LEVEL PUBLIC/PRIVATE TEACHERS (REGISTERED SCHOOLS)46
Jigawa Kaduna Kano Katsina Sokoto National
Primary47 12,408 34,004 45,802 19,435 14,066 542,533
% Female 14% 48% 24% 23% 16% 48%
% Qualified 54% 72% 52% 70% 51% 86%
Secondary48 3,960 25,503 9,107 3,516 3,434 292,080
% Female 9% 49% 23% 21% 24% 36%
% Qualified 80% 84% 77% 83% 87% 69%
Source: https://www.nemis.gov.ng/downloads_fold/Nigeria%20Education%20Indicators%202016.pdf
33. In the northern states of Nigeria, Islamic education plays a central role in the basic education system. Schools can generally be divided into three categories: purely Quranic schools, which only teach the reading of the Quran; Islamiyya schools, which integrate reading of the Quran with other Islamic studies; and Integrated Islamiyya schools which combine Islamiyya education with the mainstream curriculum, and are eligible for state funding and support (as well as being tracked in the Annual School Census). Each state has organizations responsible for setting policy directions in Islamic education, such as the sharia commission. In some northern states a majority of students attend Islamiyya primary schools (52 percent of schools in Kano State were classed as Islamiyya in 2014)49 and many students classed as out of school attend unregistered Qur’anic schools. Unpublished 2018 census data from the Girls Education Project (GEP3) in Kano 2018 found 13,250 unregistered IQS in the state (far more than the 7,000 registered primary schools recorded by in the annual school census).50 Data from Katsina and Zamfara51 for GEP3 found that the pupil-teacher ratio was lower in IQS, but teacher training, competency and motivation were also significantly lower.52
34. Private education also forms a significant proportion of the basic education sector in the five NIPEP focus states, much more significant than formal data show. In Kano and Kaduna states, private schools officially account for 13 percent and 26 percent respectively, of all primary schools.53 Private schools are entirely funded by the fees paid by parents, and generally have lower pupil–teacher ratios. All private schools must be registered with the SUBEB and their enrollment figures are recorded
46 This is taken from the most recent NEMIS Nigeria Education Indicators (2016) source: https://www.nemis.gov.ng/downloads_fold/Nigeria%20Education%20Indicators%202016.pdf 47 This includes ECD teachers who are officially registered as primary school teachers 48 This includes both Junior and Senior Secondary schools – despite those teachers being administered by two separate bodies (UBEC and the MoE) they are recorded together by NEMIS. 49 Taken from the 2013/14 ASC reports for Kano and Kaduna. Source: https://www.esspin.org/resources/reports/asc 50 The EMIS department in the SMoE collects data from all officially registered public, private and religious schools – supported by the EMIS departments in the related parastatals. This means that students attending registered IQS and private schools are captured in EMIS data, while those in unregistered IQS and private school are not (though will be captured in household surveys such as MICS and Demographic and Health Survey). 51 While Zamfara is not one of the GPE focal states, it is a north west state and comparable on many indicators to the GPE sample schools. Considering that most data available for this report is taken from project samples, the assumption is that findings from one state are to a degree, indicative of the conditions across the north west. This is necessary in the absence of standardized data collection across the states. 52 For full GEP3 midline findings on teacher performance across program sample see: http://www.nigeria-education.org/edoren/wp-content/uploads/2019/03/OPM-GEP3-Midline-Evaluation-Technical-Report.pdf 53 Ibid.

FINAL REPORT – NIGERIA 12
© UNIVERSALIA
alongside those of public schools. Figure 3 gives an overview of the enrollment in state, private and religious schools in the five GPE focal states and nationally. These figures only show the balance between IQS, private and state schools for those registered with government authorities, contributing data to state EMIS, and exclude the vast majority of IQS which are not registered with SUBEBs whose students would be counted in official records as being out of school.
Figure 3 - Balance of registered state, private and IQS in five NIPEP states (World Bank, 2014)
35. Currently there is no national learning assessment system from which to draw data on student outcomes. The federal government operates the National Assessment of Learning and Achievement in Basic Education (NALABE), which informs policymaking. However, data from NALABE is currently produced with a two-year lag between testing and delivery of results – reducing its potential impact on policymakers. Supplementary to this, a number of small-scale learning assessments have been externally funded, mostly related to testing the effectiveness of project interventions – rather than providing a national assessment of learning.
36. Examinations in Nigeria are administered by the West African Examinations Council (WAEC). WAEC administers examinations in five West African anglophone countries (Ghana, Liberia, Nigeria, Gambia and Sierra Leone). The West African Senior Secondary Completion Exam (WASSCE) is taken by students in all five WAEC member countries, while a number of different basic education completion exams are administered by WAEC members, including the Junior Secondary School Certificate (JSSC) which is taken in Nigeria and Gambia. While the WASSCE is seen as a standardized format, administered by a council of 34 members from the five member countries – the content of the exams varies between countries depending on their curriculum.
Recent Developments
37. Between the 2018 and 2019 annual country visits for this evaluation, an election took place in Nigeria. The incumbent president Muhammadu Buhari was re-elected on a pledge to continue to fight state corruption. While there were several delays to elections, they passed without any significant violence. Though the results were disputed in some quarters, they were accepted peacefully.54 There is no official block to legislation during a transition period – but the uncertainty caused by the potential of a new minister, commissioner for education and permanent secretary, all of whom bring a new legislative agenda means that new projects and legislation tend not to be engaged with. In August
54 https://www.bbc.co.uk/news/topics/crx60q1k8ldt/nigerian-general-election-2019 for more details on the timeline of the 2019 general Election
0% 10% 20% 30% 40% 50% 60% 70% 80% 90% 100%
Jigawa
Kaduna
Kano
Katsina
Sokoto
National
State Private Religious

FINAL REPORT – NIGERIA 13
© UNIVERSALIA
2019 (after the data collection for this report was completed), the incumbent minister, Adama Adamu was re-instated, meaning that it is likely that his political appointees (permanent secretary and commissioner) are likely to remain in post, avoiding further disruption.
2.2 GPE in Nigeria
GPE support in Nigeria
38. Nigeria became a GPE partner in 2012.55 From the inception of the GPE process in Nigeria, there has been collaboration between the federal and state governments and the local donor group (International Development Partners Group, or IDPG). As co-chair of the IDPG, USAID assisted the Federal Ministry of Education (FMoE) in drafting a letter requesting GPE membership. Once Nigeria had been accepted as a GPE partner, the IDPG met regularly to discuss strategies and a plan of action to meet the deadline for submission of the program implementation grant (ESPIG). The IDPG and the FMoE nominated USAID as coordinating agency, and the World Bank as grant agent. In 2018, DFID assumed the coordinating agency role.
39. During the evaluation period (2018–2020) most GPE support was channeled through the Nigeria Partnership for Education Project (NIPEP) which implemented the ESPIG in five states. Alongside this funding, GPE provided technical support to the development of monitoring and dialogue structures, including the establishment of a federal National Education Group56 (NEG), and support to UNICEF in using International Institute for Educational Planning (IIEP) guidelines for strengthening sector planning across states in Nigeria. In 2019, a second Education Sector Plan Development Grant (ESPDG) was approved to support the creation of a National Education Sector Plan (NESP) by the Federal Ministry of Education (FMoE). This ESPDG consists of funding for an Education Sector Analysis (ESA) and for the development of the NESP. An outline of all GPE financial contributions to education in Nigeria – both to the government and to civil society through the Civil Society Education Fund (CSEF) is shown in Table 5.
Table 5 - GPE grants to Nigeria (Disbursements as of July 2019)
GRANT TYPE YEARS ALLOCATIONS DISBURSEMENTS GRANT AGENT
Program Implementation (ESPIG)
2015-202057 US$ 100,000,000 US$ 80,232,857 International Bank for Reconstruction and Development (IBRD)
Sector Plan Development (ESPDG)
2019 US$ 401,667
US$ 250,000 – ESA
US$ 151,667 - ESP
No Reports IBRD
2013 US$ 249,900 US$ 232,961 IBRD
Program Development (PDG)
2013 US$ 480,000 US$ 476,992 IBRD
Civil Society Education Fund (CSEF I)
2016 US$ 95,943 US$ 95,943 Civil Society Coalition on Education for All (CSACEFA)
55 USAID supported the Nigerian government in drafting the application letter for GPE membership. 56 This is the current equivalent of the Local Education Group at federal level in Nigeria. 57 Originally 2015–2019 but given a no-cost extension until June 2020.

FINAL REPORT – NIGERIA 14
© UNIVERSALIA
GRANT TYPE YEARS ALLOCATIONS DISBURSEMENTS GRANT AGENT
CSEF II 2017 US$ 114,910 US$ 114,910 CSACEFA
TOTAL US$ 101,342,420 US$ 81,153,663
40. The size of the education sector in the country, the federal nature of education administration, and the decentralization of education policy in Nigeria present significant challenges for the channeling of GPE support to effectively impact educational outcomes. As a result, the decision was taken that funds be focused in specific states, based on the following selection criteria: (i) strong government ownership and commitment to the project at national and state levels, as evidenced by the Education Sector Plan (ESP) and Medium Term Sector Strategy58 (MTSS); (ii) a focus on states with weak basic education indicators; (iii) willingness on the part of beneficiary states to access and efficiently use UBEC funds to achieve tangible results; and (iv) commitment on the part of the FMoE through UBEC, to sustain and scale up the project activities in participating states following project completion.
41. Drawing on these criteria, the final selection of five states was mutually agreed by the Education Development Partners Group59 – a consortium of federal and state education decision makers and development partners with a mandate to bring stakeholders together to discuss and decide education programs in Nigeria. The federal government initially identified three states as potential beneficiaries of the grant, but subsequently during the preparation phase a further two states were added. All five states are located in the North West region: Jigawa, Kaduna, Kano, Katsina and Sokoto. Two states of this region do not benefit directly from the grant: Kebbi and Zamfara were excluded largely because they lack an international DP presence to support them in the education sector. The components of NIPEP are shown below, and the state by state division of funding is shown in Table 6.
▪ Component 1: Promoting School Effectiveness and Improved Learning Outcomes
(estimated total cost: US$42 million). Project activities envisioned under Component 1 include
the provision of school grants for student and school materials, and teacher development in
primary and pre-primary schools. The objective of this component is to improve the
effectiveness of schools, and in so doing, to encourage pupils to enroll and stay in school.
These ends will be achieved by promoting school-level resourcing and decision-making, with
measures to promote increased accountability. The provision of resources to primary and pre-
primary education will focus on interventions that target improved teaching and learning in
reading, literacy and numeracy.
▪ Component 2: Increasing Access to Basic Education for Out-of-School Girls (estimated total
cost: US$40 million). The objective of this component is to expand access to basic education
for female students, and to promote gender equality.
▪ Component 3: Strengthening Planning and Management Systems, Including Learning
Assessment and Capacity Development (estimated total cost: US$18 million). The objective
of this component is to ensure the effective coordination, monitoring and supervision of
project activities, and the provision of technical support and capacity building through the
provision of funds to support operating costs and short- and long-term consultancy services
for state and federal governments. Component 3 provides resources for technical assistance,
58 While the terminology used varies between states – for the purpose of this text, ESP refers to 10-year strategic plans, while MTSSs are three-year operational plans, intended to compliment the ESPs 59 While a LEG has been functioning as a development partner group for many years in Nigeria, the Minister of Education launched it formally at the time of the GPE country lead’s visit to Nigeria in December 2012.
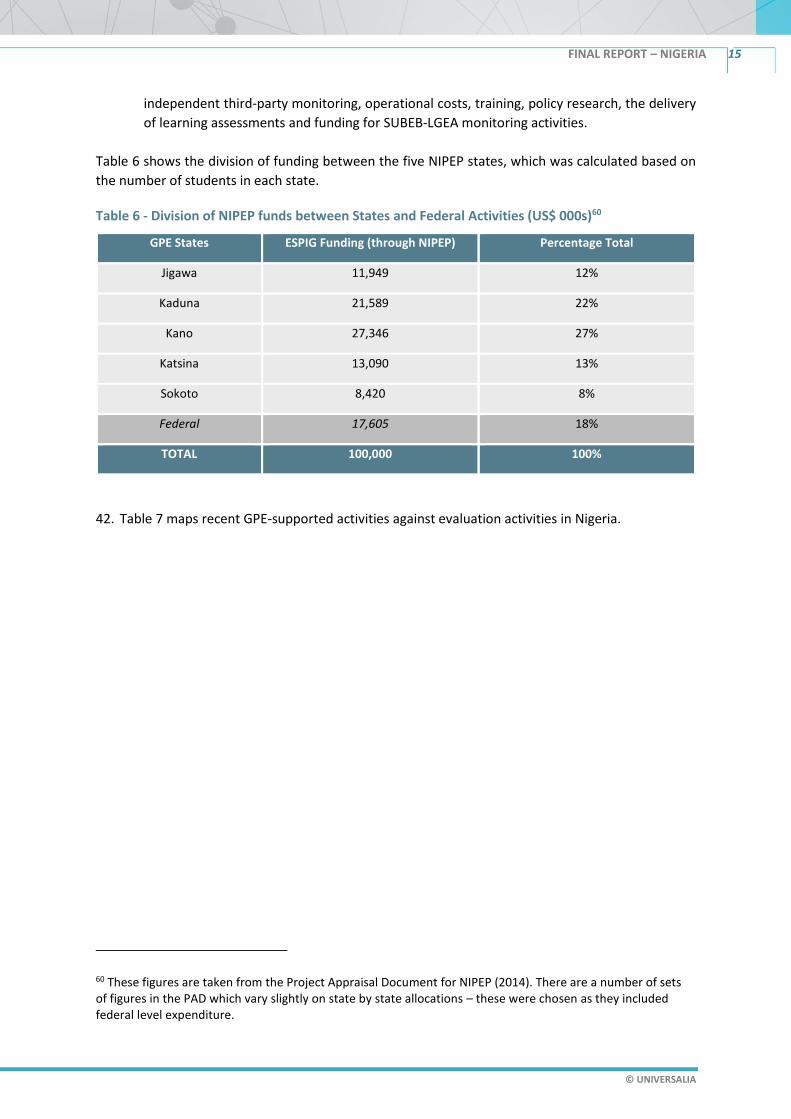
FINAL REPORT – NIGERIA 15
© UNIVERSALIA
independent third-party monitoring, operational costs, training, policy research, the delivery
of learning assessments and funding for SUBEB-LGEA monitoring activities.
Table 6 shows the division of funding between the five NIPEP states, which was calculated based on
the number of students in each state.
Table 6 - Division of NIPEP funds between States and Federal Activities (US$ 000s)60
GPE States ESPIG Funding (through NIPEP) Percentage Total
Jigawa 11,949 12%
Kaduna 21,589 22%
Kano 27,346 27%
Katsina 13,090 13%
Sokoto 8,420 8%
Federal 17,605 18%
TOTAL 100,000 100%
42. Table 7 maps recent GPE-supported activities against evaluation activities in Nigeria.
60 These figures are taken from the Project Appraisal Document for NIPEP (2014). There are a number of sets of figures in the PAD which vary slightly on state by state allocations – these were chosen as they included federal level expenditure.

16
© UNIVERSALIA
Table 7 - Timeline of key events in the education sector in Nigeria Category 2012 2013 2014 2015 2016 2017 2018 2019 2020
Legislation and
national policy
National education policy
updated
Education
Sector Analysis
Revision of
Ministerial Strategic
Plan
Ministerial Sector Plan (MSP) 2016-2020
State level plans Kaduna Kaduna State ESP (2005–2016)
MTSS 2013–2015 Revised MTSS 2015–2017 MTSS 2018–2020
Kano Kano State ESP (2009–2018) Kano State ESP (2018-2027)
MTSS 2013–2015 Revised MTSS 2015–2017 MTSS 2018–2020
Jigawa Jigawa State ESP (2013–2022)
MTSS 2013–2015 Revised MTSS 2015–2017 MTSS 2018–2020
Katsina Katsina State ESP (2011–2020)
MTSS 2014–
2016
Revised MTSS 2015–2017 MTSS 2018–2020
Sokoto Sokoto State ESP (2011–2020)
MTSS 2014-
2016
Revised MTSS 2015–2017 MTSS 2018 - 2020
GPE
appraisal
Appraisal of ESPs and MTSSs. Shift to focus on
three-year plans beginning in 2015
State level
reviews (AESPRs)
Sokoto,
Kano
Jigawa, Kaduna,
Kano, Katsina,
Sokoto
GPE events,
grants
Nigeria
joins GPE
Program development
grant
ESPDG ESPDG (2019)
ESPIG (2015–2019) ESPIG Extension

DRAFT REPORT (VX) – COUNTRY
17
© UNIVERSALIA
3 GPE contributions to sector planning, dialogue/monitoring, financing and implementation
3.1 Introduction
43. This section summarizes findings related to Key Evaluation Question I: “Has GPE support to Nigeria contributed to achieving country-level objectives related to sector planning, sector plan implementation, sector dialogue and monitoring, and more/better financing for education? If so, how?”61
44. The GPE country-level ToC, developed in the inception report and adapted to the Nigeria context, outlines four contribution claims related to GPE influence on progress towards achieving country-level objectives (one claim per objective). Each contribution claim is based on several underlying assumptions (see Annex C).
45. Structured around the four contribution claims, each sub-section assesses the contribution claim by answering two sub-questions. Firstly, during the period under review, what changed in sector planning, mutual accountability, sector financing or ESP implementation respectively? And secondly, has GPE support contributed to observed changes in (and across) these areas? The section then ends with an assessment of the assumptions underlying the theory of change, and a weighing of the strength of the supporting and the refuting evidence.
3.2 GPE contributions to sector planning62
46. A high-level overview of evaluation findings on sector planning is provided in Table 8. These observations are elaborated on through the findings and supporting evidence presented below.
61 Improved planning, dialogue/monitoring, financing, and plan implementation correspond to Country-Level Objectives (CLOs) 1, 2, 3 and 4 of GPE’s 2016-2020 Strategic Plan. 62 This section addresses evaluation questions CEQ 1.1 a and 1.2 a, as well as (cross-cutting) CEQs 3.1 and 3.2.

DRAFT REPORT (VX) – COUNTRY
18
© UNIVERSALIA
Table 8 - Overview – CLE findings on sector planning and related GPE contributions
PROGRESS TOWARDS A GOVERNMENT-OWNED, CREDIBLE AND EVIDENCE-BASED
SECTOR PLAN FOCUSED ON EQUITY, EFFICIENCY AND LEARNING63
DEGREE OF GPE CONTRIBUTION64
DEGREE TO WHICH UNDERLYING ASSUMPTIONS
HOLD65
Modest: There have been incremental but important advances in education sector planning in Nigeria since GPE membership (2013-2019). The focus on planning and support at the state levels has taken place recently and improvements in both the process and products of planning have taken place.
Modest: The GPE focus on planning has catalyzed DP focus on planning and enabled the changes that have taken place. However, the changes are modest.
1 2 3 4 5
STRENGTH OF THE CONFIRMING/REFUTING
EVIDENCE
1 2 3 4 5
Characteristics of sector planning during the review period
Finding 1: Previously, planning at the state level was linked to the release of funding for different projects or from different agencies (GPE, DPs or UBEC) rather than to a cohesive sector strategy. As a result, multiple plans exist, and are only used to the extent that project planning requires. There is however, a move to more cohesive planning with state level strategic and operational plans linking to a national education sector plan.
47. Nigeria has no National Education Sector Plan (ESP). A Ministerial Strategic Plan exists at the federal level; however, it is more of a strategic vision than a plan. Until recently, ESP development has been done at state level, with support from the federal government. The FMoE and its partners propose that a National Education Sector Plan be created, expanding upon the MSP and acting as a template for sector planning at the state level. The UBE Program channels funds through UBEC and sets objectives at national level. At the state level, 10-year State Sector Strategic Plans articulate the vision for each state, three-year operational plans exist and workplans need to be produced annually to release funding. Sub-nationally, donor project plans have historically been perceived as synonymous with the ‘state plan’ in sector dialogue. Local governments develop plans to deliver all of the social services for which they are responsible, including education. In Year 1 and Year 2 of this evaluation, stakeholder interviews confirmed that in previous years plans were used predominantly for NIPEP, occasionally by Development Partners (DPs) but not by the states.
63 In this case, the objective is considered ‘achieved’ if a sector plan underwent a rigorous appraisal process, as per GPE/IIEP guidelines, and was endorsed by in-country development partners. 64 This assessment is based on whether the CLE found evidence of (i) GPE support having influenced (parts of) sector planning; (ii) stakeholder perceptions on the relevance (relative influence) of GPE support (iii) existence or absence of additional or alternative factors beyond GPE support that were equally or more likely to explain (part of) the noted progress. 65 For sector planning, the five underlying assumptions in the country level ToC were: (1) country level stakeholders having the capabilities to jointly improve sector analysis and planning; (2) stakeholders having the opportunities (resources, time, conducive environment) to do so; (3) stakeholders having the motivation (incentives) to do so; (4) GPE having sufficient leverage within the country to influence sector planning, and (5) EMIS and LAS producing relevant and reliable data to inform sector planning.

DRAFT REPORT (VX) – COUNTRY
19
© UNIVERSALIA
Table 9 - Education sector plans across Nigeria
PLAN DESCRIPTION
Ministerial Strategic Plan
The MSP is a strategy document that defines activities to be implemented by various federal and state level actors and programs, including the Universal Basic Education program regarding basic education reforms. It was adopted by the National Council on Education.
Proposed National Education Sector Plan
An NESP is being introduced to better align federal and state-level plans and action. This will build on the MSP and is supported by a GPE funded Education Sector Plan Development Grant.
UBE Program 5-year (2015-2020) Road Map
The UBE Intervention Fund, channeled through UBEC, sets objectives for the funding of education in Nigeria.
State Education Sector Strategic Plans
The SESPs articulate the vision of the state governments and aim to provide tangible and concrete directions to address the challenges of education sector service delivery.66
Mid-term Sector Strategies
A three-year rolling operational plan derived from the ESP including a set of principles and processes to inform how to operate. These were developed with the aim of subsequently developing annual budgets based on the plans.67
SUBEB Workplans In order for funds to be released to states, workplans must be submitted to UBEC for funds to be released.
Donor Project Plans DPs, government stakeholders and CSOs referred to DP project plans as state plans so while not officially state plans, historically they have been perceived and used as state level plans.
Local Government Plans
Local authorities are responsible for delivery of pre-school, primary and adult education in Nigeria, in addition to other services. Therefore, local governments also develop plans that cut across different service delivery functions.
48. Previously, incentives have driven action to develop plans, rather than driving action to implement plans. Plans are therefore built to the funding requirements rather than being aligned to a sector-wide strategy at state level (or a national strategic framework). Stakeholders discussed the incentives provided to state-level actors to develop plans to release funds (including GPE funding). There were no incentives to utilize the plans creating a plethora of plans that were not aligned with each other or with the actions that followed the planning stage. For example, stakeholders widely report that the financing projections included in the Medium-Term Sector Strategies (created to access ESPIG funding) were mainly based on broad estimations rather than actual data, and were included as a necessity for the grant application rather than as a useful part of state-level planning or implementation. Similarly, the SUBEB workplans are aimed specifically at the implementation of UBEC funds, functioning more as a spending “wish list” not linked to any broader sector-wide strategy.
Finding 2: Over the evaluation period (2013-2019), modest improvements have taken place in the planning process, plan alignment and content; driven by the increased focus on planning at the federal level.
49. The 2018 country mission reported no improvements in planning and no action related to the recommendations of the appraisers who found the original plans (both the ESPs that predated GPE
66 Federal Republic of Nigeria, Jigawa State SESP 2013-2022. 67 Medium Term Sector Strategy. ESSPIN 002. December 2008.

DRAFT REPORT (VX) – COUNTRY
20
© UNIVERSALIA
membership and the MTSSs developed with ESPDG support) to be weak. However incremental improvements have taken place since the previous reporting period and planning is improving. Ten-year ESPs68 were already in place when Nigeria joined GPE in 2012. These plans had been developed with support from development partners working in the individual states, principally through the Education Sector Support Program in Nigeria (ESSPIN, funded by DFID), the Northern Education Initiative (NEI, and its follow-on activity, NEI Plus, funded by USAID), and the Girls’ Education Project (funded by DFID and implemented by UNICEF). Operationalization of the 10-year plans was supposed to be through rolling three-year operational plans. Assessments of the quality of either the 10-year strategic or three-year operational plans were not available at the time of joining the GPE.
50. In 2013, GPE provided an ESPDG to fund the appraisal of the three-year state ESPs already in place, which concluded that there was ‘room for improvement’ across all criteria for all states.69 Its ratings were satisfactory for the plan preparation process (in Jigawa, Kaduna, Kano and Katsina), stakeholder’s engagement (in Jigawa and Kaduna) and education sector analysis (in Jigawa and Katsina). The two central criticisms of the original plans were the lack of credible baseline data, targets and performance indicators, as well as serious issues with tracking expenditure. GPE requested the Nigerian federal government to revise the three-year plans and resubmit the grant application in 2014. These plans were revised by small working groups within state education offices, with the financial support of the ESPDG70.
51. In August 2014, a reappraisal71 process took place and while it found that the documents were better organized, many of the weaknesses identified in the original version remained. The plans were also appraised against the GPE results framework criteria – in which two, Jigawa and Kaduna were deemed to have met the requisite number of standards (at least five) out of the seven quality standards while others met four or less (Katsina met four, while Sokoto and Kano met three standards each). While weaknesses remained, the recommendation was that states should be “given the benefit of the doubt”72 and the plans should be judged as satisfactory by the Nigerian Development Partners Group who carried out the appraisal. Over time, these three-year operational plans became central planning documents, as several of the ten-year plans expired (Kaduna 2005-2016 and Kano 2009-2018).
52. In terms of priority objectives, the five states focus on common areas including (1) improving the quality and relevance of basic, secondary and tertiary education, (2) expanding basic education coverage, especially for disadvantaged groups, (3) providing appropriate non-formal learning opportunities, particularly for illiterate and hard-to-reach children and youth (in Kano only) and (4) strengthening government’s capacity to manage, plan and monitor the delivery of education services more effectively and efficiently (see Annex J for more details on MTSS priorities). The 2015-2017 state level operational plans have subsequently been extended to cover the 2018-2020 period.
68 Kaduna 2005-2016, Kano 2009-2018, Jigawa 2013-2022, Katsina 2011-2020 and Sokoto 2011-2020. 69 Education plan preparation process, stakeholders’ engagement, education sector analysis, plan design (priorities, program design and prioritization of strategies, plan financing, M&E, development and financing of an action plan) system capacity, government and accountability and risks to implementation and mitigation. 70 These state task forces were led by development partners, and funded by the ESPDG. More detail on this process is given in the year one report of this evaluation. Source: https://www.globalpartnership.org/sites/default/files/2019-07-gpe-2020-_country-level-prospective-evaluations-_nigeria_0.pdf 71 Addendum of the August 2013 Appraisal of Education Sector Plans of Five States of the North West Region of July 2013. Report prepared for the Global Partnership for Education and Nigeria Development Partner Group. August 2014. 72 ibid.

DRAFT REPORT (VX) – COUNTRY
21
© UNIVERSALIA
53. Key informant interviews from the 2018 country mission confirmed that no action was taken to develop monitoring and expenditure tracking strategies as had been suggested in the reappraisal of the state level MTSSs. When NIPEP was implemented, state level LEGs were not created, and federal-level NEG ceased to be active. At the end of the funding period, task forces were encouraged to continue helping to coordinate planning on an ongoing basis. However, NIPEP did not act on recommendations and funding was not made available to build state planning capacity, though listed as a part of NIPEP Component 3 (the funding focused on the improvement of data availability, which has an indirect benefit to planning). Stakeholder interviews confirmed that plans informed NIPEP and were mainly used for DPs, helping them align to, and meet government education priorities.
54. Between the first and second annual missions, there was a stronger focus on education planning and it became the central issue in education sector dialogue. As the country approaches the next planning stage, there is genuine recognition across actors that sector-wide improvements cannot take place until there is better planning and alignment across plans. The LEG has been reinvigorated in preparation for the next planning period and as previously stated, a NESP is being developed with ESPDG funding to support better alignment across the different governmental structures. NIPEP funding was used to employ a coordinating consultant to support planning at the national level, a new Education Sector Analysis (ESA) is being procured with the ESPDG funding and there is also support for improvements to the MSP at the national level. At the state level, UNICEF has provided support to all states (not just GPE or UNICEF supported states) on sector planning, with technical support from GPE on International Institute for Educational Planning (IIEP) guidelines.
55. New ESPs and MTSSs developed since the first annual report remain aligned with the previous overarching priorities of the state plans,73 and show improvements in quality and ownership. With support from UNICEF, Kano, Katsina and Kaduna developed new state plans (all three states developed new 10-year ESPs while Kano has also developed a three-year MTSS). When comparing the plans for these states from the previous policy cycle and the current policy cycle, we find improvements in:
1. The harmonization of presentation of plans across the three states, supporting comparability of progress across states and utility for the federal government and partners to asses and support planning and monitoring against the plans.
2. Government ownership as the first round of MTSSs (2015-2017) was heavily supported by consultants and DPs; the current tranche of SESPs and MTSSs/SESOPs are the product of state level ministry processes.
56. Table 10 compares the quality of state level plans across planning cycles in NIPEP states. This compares GPE appraisal of the MTSS made in 2013, to a qualitative judgement of the three most recent sector plans, carried out by the evaluation team. This comparison shows mixed results, with improvement in some domains and deterioration in others. Overall, the qualitative assessment of the two rounds of plans shows a general improvement in the quality of plans.74 This improvement is not only visible in the plans individually, but in the harmonization of structure and presentation across plans. With UNICEF providing technical support to 17 states in creating their new plans, it is much easier to “read across” and compare plans. This is important not only in assessing the quality of plans, but also encourages accountability and dialogue between states. It also supports the alignment of state plans with the nascent National Education Sector Plan.
73 See Annex M for details on priorities in new state level plans 74 This improvement is perhaps not visible in the comparisons shown in table 10 due to differences in appraisal approach.

DRAFT REPORT (VX) – COUNTRY
22
© UNIVERSALIA
Table 10 - Comparison of quality of state level plans across planning cycles in NIPEP states GPE Criterion Previous
Cycle75 Current Cycle76
Met Not
Met
Kano
(SESP 2018-
202720272/MTSS 2018-
2020)
Katsina
(SESP 2018-2027)
Kaduna
(SESP 2019-2028)
Guided by an
overall vision
JG,
KD,
KN,
SK
KT Plan clearly sets out
statewide vision for
progress
Plan clearly sets out
statewide vision for
progress
Plan clearly sets out
statewide vision for
progress
Strategic KT JG,
KD,
KN,
SK
Improvement in both
SESP and MTSS on how
goals and strategies are
laid out – with clear
targets for each
education subsector
(though some targets
lack clear indicators).
Does not include any
outcome indicators, or
any vision of what is
being planned by UBEC.
Plans focused mostly
on infrastructure and
learning materials –
and very little on
teacher quality or
improving demand for
education
SESP begins with a
detailed problem
analysis, and then
directly links
strategies to these
problems – with
indicators and clear
targets being given
in most cases.
Holistic JG,
KD
KN,
KT,
SK
Plan adequately covers
all learning areas – with
targets and strategies
across sub-sectors.
Purely focused on
SMoE budget and
inputs – no mention of
UBEC planning or
budgets.
Purely SMoE
focused, with no
details on SUBEB or
other parastatals
and their fields of
education.
Evidence
Based77
JG,
KD,
KN,
KT,
SK
While figures are
presented, it is
highlighted in the
document that much of
the data is incomplete or
inaccurate
Similarly – while the
presentation of
evidence is better than
in previous plans –
there is no
improvement in the
reliability of data.
The SESP contains
projections for key
indicators over the
next 10 years – but
with no details on
how these
projections were
reached.
75 These ratings refer to the 2013 appraisal of the five state education sector plans – all of which covered different periods, and preceded Nigeria’s membership of GPE. 76 This is based on the authors’ assessment of the new plans. It is also based on an agglomeration of assessments of different planning activities currently being undertaken – i.e. where both an ESP and MTSS have been produced, the assessment spans the two documents. 77 Unclear how this judgement was reached – as original tranche of plans was considered to be wholly inadequate in their presentation of evidence by the DP appraisal.

DRAFT REPORT (VX) – COUNTRY
23
© UNIVERSALIA
Problem analysis is
detailed and useful,
but gives no
concrete figures to
validate problem
assessments78
Achievable JG,
KD,
KN,
KT,
SK
Costings for strategies
are not clear. ESP
provides clear strategies
– but MTSS only lists a
series of actions per sub-
sector with no vision as
to what the desired
outcomes are. No
meaningful path to
achieving overall vision.
With no outline of
UBEC contributions, or
meaningful outcome
targets there is no clear
pathway between the
short-term targets and
the overall vision.
SESP only covers
SMoE funding, with
no detail on UBEC
funding.
No costings for any
activities (though
this may be the
remit of the MTSS).
No spending
projections
included.
Sensitive to
Context
JG,
KD,
KT
KN,
SK
Context is considered –
though there is a lack of
detailed data underlying
statements about
context.
Narrative description of
context included in
SESP, but not directly
linked to strategies
outlined.
Narrative
description of
context included in
SESP, but not
directly linked to
strategies outlined.
Attentive to
Disparities
JG,
KD,
KN,
KT,
SK
Some focus on out-of-
school children, but no
focus on children with
disabilities.
Policies relating to out-
of-school children and
girls – but no in-depth
strategy for improving
outcomes
No strong policy
coverage on gender
equity, children with
disabilities, or out-
of-school children.
Source: GPE Plan Appraisal (Old Cycle) and Authors’ elaboration based on GPE Criteria (2018/19 Plans)
57. While improvements in sector dialogue regarding planning (including state planning) have been seen recently, more work is needed in aligning plans, as well in improving the evidence base and achievability of individual plans. There is still significant work needed to align the Ministerial Strategic Plan (MSP), State Education Sector Plans (SESPs), Medium Term Sector Strategies (MTSSs), state basic education plans, DP plans, annual workplans and local government plans. More work is needed to continue building capacity to plan, but the focus on incremental improvements at the state level have yielded some initial positive results. The question is whether the focus should be on aligning multiple sets of plans, or emphasizing the need to improve the evidence base and achievability of plans. There is logic behind the move to support a national education sector plan, however, the work that was started in the five NIPEP states has not yet been completed. While some improvements have been seen, they are not necessarily sustainable at this point. State level interviews show that SMoE stakeholders did not know whether or not they would be receiving further support to planning, and it appears no strategy was developed to address what would happen once states no longer received GPE support in planning. It is not clear that moving on to support federal planning will have more significant long-term effects than building on what has been done in the five states, by providing
78 For example, when it lists “dilapidated and inadequate infrastructure” it does not give any figures on how many schools are in need of repairs, or how this conclusion was reached.
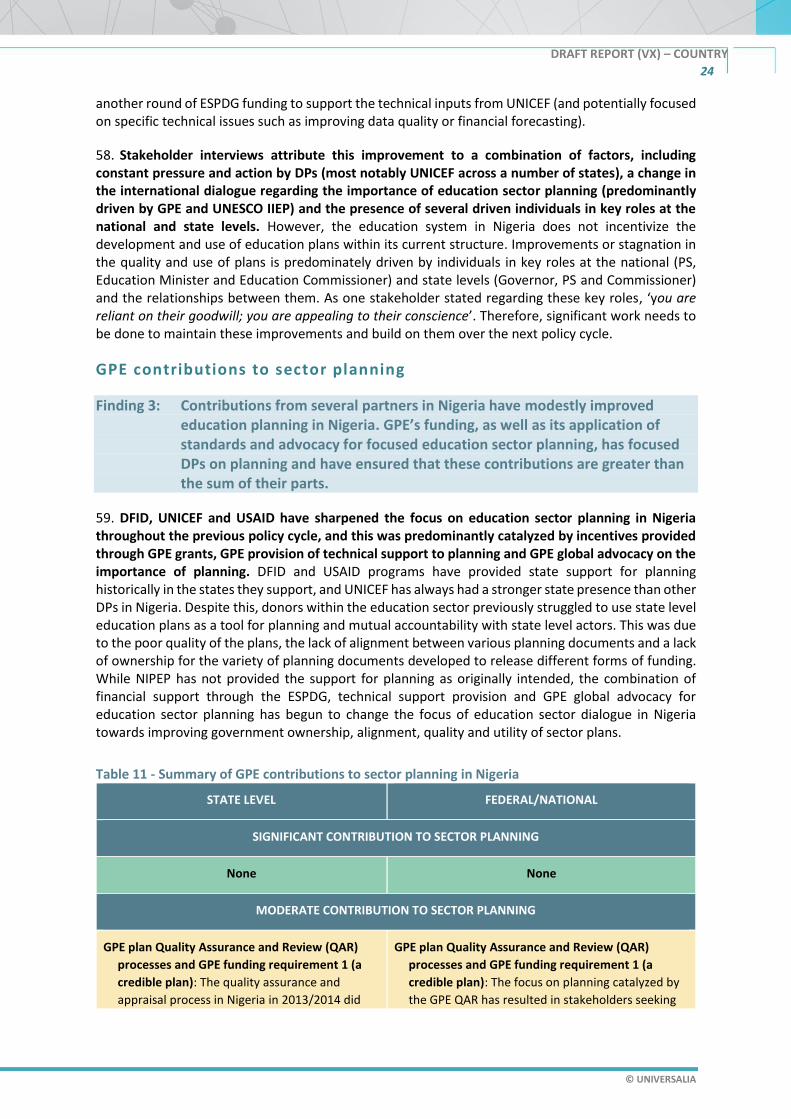
DRAFT REPORT (VX) – COUNTRY
24
© UNIVERSALIA
another round of ESPDG funding to support the technical inputs from UNICEF (and potentially focused on specific technical issues such as improving data quality or financial forecasting).
58. Stakeholder interviews attribute this improvement to a combination of factors, including constant pressure and action by DPs (most notably UNICEF across a number of states), a change in the international dialogue regarding the importance of education sector planning (predominantly driven by GPE and UNESCO IIEP) and the presence of several driven individuals in key roles at the national and state levels. However, the education system in Nigeria does not incentivize the development and use of education plans within its current structure. Improvements or stagnation in the quality and use of plans is predominately driven by individuals in key roles at the national (PS, Education Minister and Education Commissioner) and state levels (Governor, PS and Commissioner) and the relationships between them. As one stakeholder stated regarding these key roles, ‘you are reliant on their goodwill; you are appealing to their conscience’. Therefore, significant work needs to be done to maintain these improvements and build on them over the next policy cycle.
GPE contributions to sector planning
Finding 3: Contributions from several partners in Nigeria have modestly improved education planning in Nigeria. GPE’s funding, as well as its application of standards and advocacy for focused education sector planning, has focused DPs on planning and have ensured that these contributions are greater than the sum of their parts.
59. DFID, UNICEF and USAID have sharpened the focus on education sector planning in Nigeria throughout the previous policy cycle, and this was predominantly catalyzed by incentives provided through GPE grants, GPE provision of technical support to planning and GPE global advocacy on the importance of planning. DFID and USAID programs have provided state support for planning historically in the states they support, and UNICEF has always had a stronger state presence than other DPs in Nigeria. Despite this, donors within the education sector previously struggled to use state level education plans as a tool for planning and mutual accountability with state level actors. This was due to the poor quality of the plans, the lack of alignment between various planning documents and a lack of ownership for the variety of planning documents developed to release different forms of funding. While NIPEP has not provided the support for planning as originally intended, the combination of financial support through the ESPDG, technical support provision and GPE global advocacy for education sector planning has begun to change the focus of education sector dialogue in Nigeria towards improving government ownership, alignment, quality and utility of sector plans.
Table 11 - Summary of GPE contributions to sector planning in Nigeria
STATE LEVEL FEDERAL/NATIONAL
SIGNIFICANT CONTRIBUTION TO SECTOR PLANNING
None None
MODERATE CONTRIBUTION TO SECTOR PLANNING
GPE plan Quality Assurance and Review (QAR)
processes and GPE funding requirement 1 (a
credible plan): The quality assurance and
appraisal process in Nigeria in 2013/2014 did
GPE plan Quality Assurance and Review (QAR)
processes and GPE funding requirement 1 (a
credible plan): The focus on planning catalyzed by
the GPE QAR has resulted in stakeholders seeking

DRAFT REPORT (VX) – COUNTRY
25
© UNIVERSALIA
STATE LEVEL FEDERAL/NATIONAL
not result in quality plans at that time.
However, the process catalyzed a focus on
planning over the subsequent five years (leading
up to the current generation of new state level
plans). This focus has recently resulted in
improvements in the quality of several recent
sector plans.
ESPDG Funding: ESPDG funding (both in 2013 and
in 2019) has been crucial in creating the focus
on planning, which (in the case of the 2013
ESPDG) resulted in progress in planning much
later in the policy cycle.
The application of GPE standards and
endorsement: The MTSS was endorsed despite
failing to meet several crucial criteria. Valid
concerns regarding the validity of that decision
were made in this evaluation’s Year 1 Annual
report. However, time has shown that by
relaxing the standards for Nigeria (endorsing in
the absence of a credible plan), engaging state
government stakeholders to improve the
credibility of the plans for the next planning
cycle was possible. Had the Secretariat
requested another round of changes to the
plans, state government engagement in the
planning process would have waned.
Technical support from DPs: Technical support
from UNICEF and DFID has been essential not
only in supporting the development and
adjustments to the MTSSs, but also in
supporting the development of a planning
mindset over the policy cycle. UNICEF capacity
building at the state level has improved the
quality of more recent state plans. This was
catalyzed by GPE and UNESCO IIEP global
advocacy for planning and GPE activities in
Nigeria.
to develop a national sector plan in Nigeria. While a
national plan cannot result in better
implementation alone, the national plan has the
potential to align with state plans and drive action
towards dialogue and monitoring at the state and
national levels, and implementation at the state
level.
LIMITED/NO CONTRIBUTION TO SECTOR PLANNING
CSEF Funding for CSACEFA: Given the complexities
of the education system in Nigeria, CSEF funding
has not contributed to sector planning as
planning takes place at the state level.
CSEF Funding for CSACEFA: Until recently, planning
had not taken place at the national level.
Therefore, the involvement of a national CSO in the
planning process has not taken place in a
meaningful way.
NOT APPLICABLE / TOO EARLY TO TELL
DRAFT REPORT (VX) – COUNTRY
26
© UNIVERSALIA
STATE LEVEL FEDERAL/NATIONAL
None
Additional factors beyond GPE support
60. All DPs in Nigeria have supported planning at the state level. However, GPE has catalyzed the focus on planning and enabled partners to build government ownership of the plans towards better quality planning products and processes. Considering that GPE specifically chose to operate in states that had been receiving external support, it is difficult to discern how much progress is tied to pre-existing trends. In particular, the states that had been supported through ESSPIN (Kano, Kaduna and Jigawa) had previously received extensive support for planning. Similarly, the current trends seen now are partly attributable to the work being done by UNICEF across Nigeria (though this work receives technical support on IIEP guidelines from GPE, and is perhaps being driven by GPE support for and focus on improving planning).
Unintended negative/unplanned positive effects of GPE support
61. At the beginning of the policy cycle, GPE endorsement of plans which were not credible initially reinforced a lax approach to planning. However, over time this changed as GPE partners in Nigeria improved their focus on planning and engaged in capacity building for planning.
Implications for GPE ToC and country level operational model
62. When plans were being developed and revised as part of the GPE ESPIG application in Nigeria, there was a quality/ownership trade off. The first plans were neither high quality nor government owned. However, building on ownership (approving plans that did not meet the quality criteria) has proven to be the right decision. According to GPE, the plans based on the ESPIG were approved and had been revised yet were still not credible. The Year 1 annual report did not find evidence to support the Secretariat’s decision to approve the ESPIG in Nigeria on this basis. However, a year on, the incremental improvements in planning can be traced back to the fact that plans were approved despite their flaws. While government ownership for the plans at that stage was low, requesting another round of revisions may well have improved the quality of the plans but would have jeopardized any government ownership. Building government ownership was the main reason for the modest improvements in both the processes and products of planning in Nigeria over the last year. Government ownership was facilitated by improvements in dialogue at the federal level, and the work done by a consultant who works with the NEG.
63. There is an important question to be answered about what sector planning should look like in a complex federal state such as Nigeria. Currently there are discussions happening around how to align plans from different levels of government and different agencies across Nigeria. The counter argument to this push would be that a simplified approach is needed, with each state having one short to medium term plan, owned by the SMoE – with the FMoE setting broad sector priorities. This is closer to the model in other comparable states (such as Pakistan). Taking this bottom up approach means looking critically at the flow of the GPE ToC. The development of credible sector plans in Nigeria can only happen once the building blocks (sector data, financial data, clarity in institutional mandates, and inclusive dialogue) are in place. This would reverse the theory of change used by GPE - that the development of sector plans is the basis for developing these other system elements. This feeds into the discussion around whether a modified ToC is appropriate for Nigeria (this is discussed in detail in Section 7). As noted in the previous sub-section – there is an important question of what the multi-phase support plan for improving planning should be – whether GPE should support a larger number

DRAFT REPORT (VX) – COUNTRY
27
© UNIVERSALIA
of states, or focus funding on the same states across multiple grant cycles, building on incremental improvements.
The assumptions in the country level ToC for sector planning are assessed in Box 3.
Box 3 - Testing Assumptions and Assessing Strength of Evidence
For sector planning, the five underlying assumptions in the country level ToC were: (1) country level stakeholders having the capabilities to jointly improve sector analysis and planning; (2) stakeholders having the opportunities (resources, time, conducive environment) to do so; (3) stakeholders having the motivation (incentives) to do so; (4) GPE having sufficient leverage within the country to influence sector planning, and (5) EMIS and LAS producing relevant and reliable data to inform sector planning.
Four of five assumptions underlying sector planning in the GPE ToC in Nigeria hold. However, additional assumptions not previously identified require further examination.
Assumption 1 holds. In Nigeria, we find recent small improvements in sector planning indicate that country level stakeholders do have the capacity to jointly improve sector analysis and planning, however this requires a focus on planning at the state level and significant inputs from DPs and sufficient political will and buy-in from key state level actors.
Assumption 2 holds tenuously. Stakeholders have not always had opportunities to improve sector analysis and planning, however limited state capacity was highlighted through the GPE ESPIG application process, which catalyzed DP focus on sector planning later in the policy cycle.
Assumption 3 holds, with a caveat. Stakeholders in Nigeria do have incentives to improve sector planning as funders increase the demand to align funding to plans. However, the complexities of planning in Nigeria need to be better understood for improvements to follow from capabilities, opportunities and incentives.
Assumption 4 holds. The Secretariat does not have sufficient leverage within the country to influence sector planning, however the GPE partnership does have the required leverage. Up until recently, as the focus was on state level planning, this leverage was difficult to build on, as the Secretariat has a weaker presence (as do most NEG members) at the state level. With the shift towards federal planning, this leverage can be better utilized.
Assumption 5 does not hold. Finally, the assumptions that EMIS and LAS produce relevant and reliable data to inform sector planning does not hold in Nigeria.
The evidence for assessing changes in the education system in Nigeria is moderate. Not all stakeholders saw incremental improvements in the planning process, however these stakeholders were further away from the state level planning activities that have taken place recently. Between the two evaluation rounds a significant amount of interview data was collected, along with the appraisal documents and responses related to the development of sector plans. Changes in the way planning was discussed by key stakeholders between the first and second annual missions were observable.

DRAFT REPORT (VX) – COUNTRY
28
© UNIVERSALIA
3.3 GPE contributions to mutual accountability through sector dialogue and monitoring79
64. A high-level overview of evaluation findings on mutual accountability for education sector progress and on related GPE contributions during the review period is provided in Table 12. These observations are elaborated on through the findings and supporting evidence presented below. No report was made for indicator 18 in the GPE results framework in the last three years. Table 12 - Summary of progress and GPE contributions to mutual accountability through sector
dialogue and monitoring
PROGRESS MADE TOWARDS MUTUAL
ACCOUNTABILITY (SECTOR
DIALOGUE)
DEGREE OF GPE
CONTRIBUTION (SECTOR
DIALOGUE)
PROGRESS MADE TOWARDS MUTUAL
ACCOUNTABILITY (SECTOR
MONITORING)
DEGREE OF GPE
CONTRIBUTION (SECTOR
MONITORING)
DEGREE TO WHICH UNDERLYING ASSUMPTIONS
HOLD 80
Weak:
Sector dialogue has not taken place beyond bilateral conversations between various stakeholders, predominantly on a project basis.
Weak:
Any GPE contributions to sector dialogue are specifically related to dialogue regarding NIPEP. Therefore, the contribution to dialogue is no greater than any other project in Nigeria.
Weak:
Sector reviews have not taken place regularly. Where they have taken place, they are constrained by the lack of credible plans (and credible evidence with which to monitor plans). Dissemination has been weak as stakeholder appetite for monitoring has been low.
Weak:
While GPE funded the Annual Education Sector Performance Reviews (AESPRs) – these were carried out by consultants and not taken up by states – having no impact on long term monitoring.
1 2 3 4
STRENGTH OF UNDERLYING EVIDENCE
1 2 3 4
79 This section addresses evaluation questions CEQ 2.1, 2.2 and 2.3, as well as (cross-cutting) CEQs 3.1 and 3.2. 80 For sector dialogue and monitoring, the four underlying assumptions in the country level ToC were: (1) GPE has sufficient leverage at global and country levels to influence LEG existence and functioning; (2) country level stakeholders having the capabilities to work together to solve education sector issues. (3) Stakeholders have the opportunities (resources, time, conducive environment) to do so; (4) stakeholders have the motivation (incentives) to do so.

DRAFT REPORT (VX) – COUNTRY
29
© UNIVERSALIA
Characteristics of sector dialogue
Finding 4: While various mechanisms exist to support education sector dialogue, these are not in use. Dialogue consists of project based bilateral discussions that occur on an ad-hoc basis. Until sector planning in Nigeria is improved, this is unlikely to change.
65. While various mechanisms exist to support education dialogue in Nigeria, these are not in use. Dialogue consists of project based bilateral discussions that occur on an ad-hoc basis. Table 13 outlines the range of education dialogue mechanisms in Nigeria. At the federal level, the size, complexity and structure of the education system results in the most important strategic mechanisms being so large that they lose functionality. Informants stated that the federal meetings were highly formalized and difficult to use as decision-making forums due to the sheer number of people in the room. The vast majority of stakeholders reported bilateral meetings on specific issues or projects as the current structure of education sector dialogue.
Table 13 Selected Education Sector Dialogue Mechanisms81 BODIES MANDATE AND
ACTIVITY MEMBERSHIP AND
INCLUSIVITY CONTRIBUTION TO MUTUAL
ACCOUNTABILITY
Federal/National
National Council for Education (NCE)
High Level Policy Decisions through Yearly Meetings.
Representatives from state/federal ministries and parastatals. Up to 800 participants
Weak: more of a conference than a forum for dialogue.
National Education Group (NEG)
Regular meetings with policymakers at the state and federal levels, DPs and CSOs.
The combination of the size and structure of the education system in Nigeria, the NEG is very large, with at least 2 representatives from each state being present. Up to 100 participants.
Moderate: Revitalized since 2018. While the NEG has potential to improve accountability – its existence is fragile, and the feeling among stakeholders is that it may not continue regularly in the long term
International Development Partners Group (IDPG)
Sporadic meetings of major DPs working in education, without involvement from government.
Representatives from major donor partners in the education sector. Variable participation.
Moderate: While the DP group is useful for harmonizing donor activities, it has no active contribution to mutual accountability across the sector.
NIPEP states
NIPEP State Project Technical Committee/ Steering Committee (SPTC/SPSC)
Technical and Steering committee meet annually to discuss the future direction of NIPEP funded activities.
A range of stakeholders from government bodies, DPs and Civil Society. Approximately 50 participating members.
Weak: While membership is inclusive, the meetings are too sporadic, and too focused on NIPEP activities to meaningfully strengthen mutual accountability.
66. Currently most education sector dialogue is either focused on planning or is driven by projects. Until sector planning processes are stronger, sector dialogue will likely remain at the project level.
81 While there are a huge range of thematic working groups and program committees both inside the government and among donors – there is not enough data available to include an assessment of them here – though the general conclusion that can be drawn is that they meet too infrequently and have too narrow a focus to contribute usefully to mutual accountability.

DRAFT REPORT (VX) – COUNTRY
30
© UNIVERSALIA
DFID has embedded regular state level “stock take” sessions into its upcoming sector program, signaling a second attempt to establish state level LEGs. However, as most DPs are focused on a small number of states in Nigeria, this is only likely to be implemented in DFID supported states. There is a plan to establish a JSR mechanism against the new state level plans (being advocated for by UNICEF in collaboration with state governments), but there is no concerted, state owned effort to establish state level dialogue mechanisms.
67. The National Education Group (NEG) has been revitalized as a result of the combination of an
upcoming ESPIG application and an enthusiastic Permanent Secretary (PS). Before Nigeria joined
GPE, there was no LEG at the federal level. In 2013 and 2014, in the context of Nigeria having joined
the partnership, there was discussion as to whether individual LEGs should be convened at the state
level, or whether there should be one LEG at the level of the federal government. It was decided to
have one LEG, at federal level (NEG). Key informants stated that this LEG was active in 2013–2014 but
discontinued meeting regularly in 2015. In the last year there has been a focus on “revitalizing” the
NEG but the sustainability of this forum is questionable. Stakeholders report that the personal focus
on the NEG from the current political leadership in the FMoE is key to the NEG’s operation, and this is
seen as fragile with subsequent leadership likely not to have the same focus on dialogue. The
revitalization of the NEG has focused on the ESA and NESP development, which is seen as having given
the group a clear focus – it is possible that monitoring progress against this plan may serve the same
purpose in maintaining focus on dialogue.
68. In Nigeria, sector plans are formed at the state level but policy direction is set at the federal level, therefore dialogue needs to happen at both federal and state levels. There is a GPE assumption that the ESP is the framework within which national stakeholders and DPs have sector dialogue, drawing on evidence of sector performance. This assumption does not hold in Nigeria. While this may change with the introduction of a national sector plan – there is a lot of work that will need to be done to create a unified framework to link national and state plans, which may be confounded by the limited authority the federal government has over state ministries of education (due to the concurrent listing of education). A successful framework for dialogue in Nigeria would be technically and logistically complex – and requires a concerted effort from stakeholders across the sector to develop the necessary systems and agreements. While the creation of the NESP and the revitalization of the NEG is a first step towards this, there has not yet been any focus on next steps towards creating such a system.
69. While new and improved plans have been developed in several states, this has not yet pushed dialogue towards mutual accountability. There is little evidence of routine dialogue at the national or state levels. At national level, the most notable change over the course of the evaluation period is a renewed discourse on the need to revitalize dialogue. At the state level, there is little evidence of routine dialogue and existing dialogue is at project level. Communication on strategy and best practice between state and federal actors is weak – this means that while improvements may be seen at federal level, they do not translate to improvements at the state level, and improvements in one state do not translate to changes in other states. Stakeholders from key development partners report that state level actors do not necessarily lack the motivation to improve dialogue and accountability, but instead lack technical support and strategic direction – particularly in those states without a strong DP presence.
70. As highlighted in the first annual report, the lack of sector dialogue also extends to dialogue between the key Nigerian stakeholders. Fifty percent of the UBE-IF is in direct interventions, where UBEC allocates and administers the funds and interventions at state level, and equally across states. The other 50 percent of the UBE-IF is used for infrastructure matching grants, again allocated equally across states, except where different states have accessed the matching grant to different degrees

DRAFT REPORT (VX) – COUNTRY
31
© UNIVERSALIA
because of the counterpart funding requirement and other state-specific considerations. These funds are disbursed to SUBEBs (or directly to LGEAs), and are not necessarily targeted at interventions included in the state ESPs, which are developed by the SMoEs. This is symptomatic of the difficulties in communication caused by the concurrent system in Nigeria, in which multiple state actors fund capital interventions, without any meaningful forum for dialogue and mutual accountability between them. The lack of state level monitoring data on the impact of the UBE-IF matching grant, results in key federal and state actors not being held accountable for results thus having little incentive to coordinate efforts and interventions. Furthermore, state level ESPs are not seen as a tool for dialogue between the federal and state levels.
Characteristics of sector monitoring
Finding 5: There remains a lack of realistic monitoring systems, strategies and data at the state and national levels. This is primarily due to the complex institutional mandates for monitoring and the projectization of education implementation in Nigeria. In addition, a lack of credible operational planning means that there is no shared framework for what needs to be achieved – fundamentally undermining any efforts to monitor progress.
71. There remains a lack of realistic monitoring systems, strategies and data at the state and
national levels. This is highlighted through the GPE-funded appraisal and reappraisal of the state
ESPs, the lack of data in the sector and where data exists, the proliferation of conflicting figures. The
GPE-funded appraisal and reappraisal of the state ESPs/MTSSs highlighted a lack of realistic
monitoring strategies at the state level. The documents point out that plan prioritization was poor
across all five states, while monitoring focused on input and activity levels, neglecting outputs and
outcomes, resulting in a few meaningful outcome targets. The lack of clear agreement on what needs
to be achieved by when and a lack of data available to monitor progress point to the weaknesses in
monitoring and in implementation in Nigeria.
72. In line with the development of a new round of state sector plans the intention is to hold
annual reviews of progress. There has never been a credible joint sector review in any state or at
federal level in Nigeria. The only monitoring of progress against the MTSSs in the five NIPEP states was
a series of state level reports produced using NIPEP funds and carried out by a consultant (the annual
education sector performance reviews – detailed later in this section). UNICEF is currently committed
to supporting greater accountability by promoting JSRs in the states in which it is supporting planning.
The first of these will be carried out in 2020.
73. The lack of progress in monitoring in Nigeria is primarily driven by complex institutional mandates for monitoring and the projectization of education implementation. Both federal and state governments have the institutional mandate to monitor. The federal government has a monitoring mandate, described by one government official as a “responsibility to hold the mirror to the states”. UBEC has a monitoring mandate over its funds, yet primarily focuses on planned outputs, rather than actual outputs. State education ministries have a monitoring mandate, however support to states to improve monitoring is provided through development programs that do not work across all states. Started by ESSPIN and now undertaken by NIPEP, SBMCs and SSOs support community level monitoring and accountability with positive results on improving community engagement and accountability at the school level. It is, however difficult to know how effective these approaches could

DRAFT REPORT (VX) – COUNTRY
32
© UNIVERSALIA
be in supporting mutual accountability at sector level,82 and whether the systematic changes (i.e. in decentralizing funding to schools) needed to facilitate this model are feasible solutions in the short/medium term.
74. The lack of outcome data is reflected across national and state systems. The responsibility of
monitoring UBEC funding lies with UBEC and the SUBEBs. Interviews with key informants and
documents83 reviewed indicate that: (a) information on key outputs and outcomes to monitor and
evaluate are not available: UBEC only records states’ planned outputs (projects) in the form of annual
action plans, it has no records of actual state level outputs; and (b) UBEC has no clear set of agreed
output and outcome indicators. The MTSSs, which are produced by the SMoEs, do not make it clear
whether they are addressing all capital expenditure in the state, or whether UBEC actions are being
operated within the budget. More investigation is needed to ascertain how UBEC actions are being
monitored through the MTSSs by the SMoE.
75. Despite data quality and availability issues being identified through the AESPRs, the situation
persists. The 2016 AESPRs (for each of the five NIPEP states and a combined synthesis) highlighted the
poor data quality and data unavailability, minimizing AESPR value in truly assessing education sector
performance and system efficiency. Three years on, the issues with availability and quality of data for
monitoring remain. The AESPR was funded through NIPEP and carried out by a consultant, but it was
not institutionalized by state governments, making little long-term impact on the quality of monitoring
at state level. While data are available for enrollment and attendance through the annual school
census, collected by the SMoE EMIS departments, there are no comprehensive state level data on
student retention, completion, or learning. Examinations are only undertaken at the end of Senior
Secondary school and are not comparable year on year. This is reflected in sector plans that focus
heavily on student enrollment and the construction and upkeep of school facilities, rather than
addressing learning issues.
76. Where monitoring documents are produced, there is little appetite to disseminate and discuss
progress. The key monitoring documents produced in the policy cycle were the AESPRs, which were
produced in all five states in 2017. These reports were developed by a third-party contractor. While
there is consultation with a broad range of stakeholders, informants confirmed that once the reports
were produced, there was little appetite to review or discuss the findings across stakeholder groups.
In addition, no budget was made available through NIPEP to support dissemination activities or events.
Therefore, the process of developing the AESPRs did not result in the promotion of mutual
accountability beyond providing data on the education sector. The limitations of the AESPRs are that
the data reported mostly relates to attendance, enrollment and expenditure, with a lack of data on
82 ESSPIN carried out a study on SBMC effectiveness in promoting community level accountability, and found them to have had a positive impact – however, the study notes that to continue the momentum built, a shift would be needed to further decentralize funding to school level, requiring significant systematic change, and also not necessarily doing anything to improve mutual accountability beyond the school/community level. Source: http://www.esspin.org/esspin-documentation/experience-papers/SBMC-engaging-communities-in-school-improvement.pdf 83 For example: World Bank (2017) Better Education Service Delivery For All Operation – Program Appraisal Document. Report No: 115391-NG. May 30, 2017. http://documents.worldbank.org/curated/en/839251498183393835/pdf/BESDA-PAD-May-30-2017-06012017.pdf

DRAFT REPORT (VX) – COUNTRY
33
© UNIVERSALIA
learning outcomes. As monitoring strategies are not embedded in the MTSSs, the data do not allow
for meaningful monitoring of the performance of the MTSSs.
77. There is currently an effort to introduce a national learning assessment. The World Bank
is working with the federal government to develop a national learning assessment tool. There
remains very little evidence that the current strategy will result in nationally representative data on
learning levels for technical, logistical and capacity reasons. DFID EDOREN project and ESSPIN
monitoring component collectively conducted assessments in 10 states across Nigeria. The variation
in learning levels across the states required a highly technical process of developing multiple test
booklets (at different levels of difficulty) linked through anchor items.84 In addition, while UNICEF has
undertaken a great deal of work in developing lists of integrated Qur’anic schools in GEP3 states, the
number and location of Qur’anic schools is growing and the list will likely never be complete. This
makes the development of a useable sample frame very difficult. The logistical challenges of
conducting assessments are reflected in the more than two-year gap between test administration and
reporting of results for NALABE, a national assessment with the purpose of informing policy.85 Some
cross-national assessment programs (such as the Program for International Student Assessment) take
more than two years between data collection and reporting.
78. Long gaps between data collection and reporting significantly reduce the utility of assessments. In addition, the complexity of mandates between federal and state levels, reduces the already weak capacity to implement. While some federal government officials were sure that if states are told to implement an assessment they would, this is not reflected in a range of other implementation activities. The capacity to collect, manage and analyze learning assessment data is also not evident. None of the five states has currently implemented standardized tests for its education sector. One state (Katsina) carried out an early grade reading assessment (EGRA) in 2016, but this was a one-off assessment of a small random sample of primary students, rather than a comprehensive assessment exercise. For a national learning assessment to be effectively implemented by government and embedded within government systems, a large investment in technical assistance would be required. Technical assistance does not only refer to capacity to develop assessment tools (as is often reflected in education sector dialogue) but assistance to carry out all of the stages across 14 key areas of a robust assessment program).86
GPE contributions to sector dialogue and monitoring
Finding 6: While there are a number of positive developments that signal improvements in mutual accountability may occur during the upcoming policy cycle, GPE contributions to sector dialogue and monitoring outside of NIPEP have not taken place in the current policy cycle.
79. There are a number of positive developments that signal that improvements in mutual
accountability may occur during the upcoming policy cycle. However, the complexity of dialogue
84 Outhred, Lipcan and Binci, 2016. Public and Private School Study. EDOREN. 85 Basic Education Commission. Final Report. National Assessment of Learning Achievement in Basic Education (NALABE). 86 Policy goals and issues, project team and infrastructure, technical standards, assessment framework, high quality cognitive instruments, high quality contextual instruments, linguistic quality control, test design, sample design, standardised field operations, data management, scaling methodology, data analysis and reporting and dissemination. ACER. https://www.acer.org/au/gem/about/approach/robust-assessment-program

DRAFT REPORT (VX) – COUNTRY
34
© UNIVERSALIA
mechanisms limited monitoring. Moreover, inconsistency in support from senior government officials
to ensure frequent and quality sector dialogue constrained improvements in mutual accountability
over the last policy cycle. Table 14 gives a summary of GPE contributions defined by how significant
they were for improving mutual accountability through dialogue or monitoring.
Table 14 - GPE contributions to mutual accountability during the 2013-2019 review period
STATE LEVEL FEDERAL/NATIONAL
SIGNIFICANT CONTRIBUTION TO MUTUAL ACCOUNTABILITY
None None
MODERATE CONTRIBUTION TO MUTUAL ACCOUNTABILITY
None None
LIMITED/NO CONTRIBUTION TO MUTUAL ACCOUNTABILITY
Grant Agent support to dialogue and monitoring through NIPEP. Sector dialogue and monitoring has not taken place at the state level. Therefore, the GA contribution is similar to any other project in Nigeria.
GPE guidelines for ESP development. The development of the MTSSs had the potential to provide a strong framework for monitoring and mutual accountability. However, the five MTSSs appraised by GPE were not linked to outcome targets to allow for monitoring.
Coordinating agency support to dialogue and monitoring. Sector dialogue and monitoring has not taken place at the state level. Given the size and the complexity of Nigeria, it is unreasonable to expect the CA to coordinate dialogue and monitoring across Nigerian states.
CSEF funding. The national CSO Association conducted monitoring activities, however these activities have been specifically related to NIPEP implementation. The contribution of monitoring is limited to the monitoring of the ESPIG.
Coordinating agency support to dialogue and monitoring. In Nigeria the CA is responsible for coordinating around NIPEP, not at the sector level. Therefore, the CA role has not been able to push progress towards mutual accountability outside of NIPEP.
GPE Secretariat advocacy and guidance on conducting JSRs. Reviews of sector progress were not undertaken regularly and the few reviews done were not driven or owned by state governments, hence the results were not widely disseminated and used in policymaking.
NOT APPLICABLE / TOO EARLY TO TELL
GPE support for the NESP development. It is possible that the establishment of a unified national strategic framework for education will support the strengthening of dialogue and monitoring at the state/federal level, nevertheless it is too early to tell how this will manifest.
UNICEF support to planning and monitoring. While it is a positive development that UNICEF is committed to working with states to hold annual reviews against the newly developed SESPs – it is too early to say whether this commitment will translate into meaningful action.
80. For improvements in mutual accountability to take place, serious efforts to improve dialogue
and monitoring at the state level are needed. NIPEP is governed by the National Project Steering
Committee (NPSC). The NPSC includes participation from the FMoE, UBEC, CSACEFA, the World Bank
and the three international DPs which provide support to the NIPEP states (DFID, USAID and UNICEF).
International DPs represented states’ interests during regular meetings which took place, with no
participation from state government officials. This did not necessarily promote state level sector
dialogue as the implementation or priorities of the state level ESPs are not discussed; rather NIPEP’s
activities at state level. After the grant application process, the National Project Steering Committee

DRAFT REPORT (VX) – COUNTRY
35
© UNIVERSALIA
has met less frequently than it did before.87 A subset of key informants at both federal and state levels
maintained that the effectiveness of the steering committees at both the national and state levels is
impeded by the frequent absence of high-level ministry officials who delegate attendance to
subordinates who do not have the power to make commitments and decisions.
81. GPE provided inputs to improve dialogue and monitoring towards mutual accountability in the
NIPEP context. GPE inputs to dialogue and monitoring have included technical support, financial
support for monitoring and dialogue through NIPEP (support for AESPRs and Competent 3 of NIPEP),
financial support for the CSO association and global advocacy for dialogue and monitoring. GPE
support was instrumental in the formation of the federal LEG in 2015, but this support has not
extended to maintaining its membership or focus. There appears to be a pattern in which a LEG comes
together around the application period for an ESPIG, but has no support or incentivization (from GPE
or elsewhere) to continue operating once funding has been approved. In light of this, only time will
tell if the recent revitalization of the NEG will be sustained. GPE financial support for Component 3 of
NIPEP included support for the ASC in NIPEP states. This resulted in improvements in ASC data
production in NIPEP states and therefore, is a GPE contribution. However, as stakeholders consistently
stated, “if it wasn’t NIPEP, it would be another project”. Support for the AESPRs did not result in
improvements in monitoring as the appetite to read or disseminate the reports was weak. The
association of CSOs in Nigeria undertook a range of activities to monitor implementation and verify
school level grant utility. This has primarily been to support monitoring of NIPEP and is therefore, not
providing sector-wide information.
82. The greatest potential GPE contribution to dialogue and monitoring in Nigeria could take place
in the future through the CA role as a new set of circumstances unfold. At present, stakeholders
rarely conceptualize the role of the CA as originally intended – convener for dialogue across the
education sector. However, with funding for a coordination position, with DFID taking over the role of
CA, and as the large World Bank BESDA program starts, there is potential for this narrow focus to shift
to the sectoral focus, if sufficient resources are provided for the CA role. Previously, with no financial
support for USAID in their role as CA they struggled to provide the capacity to fully take on the role of
coordinating dialogue and grant applications (even at the federal level, let alone in the five states). It
will be important for actors in the sector to find a way to make sure that the CA is supported
adequately in the future, with the possibility of expanding the role further to support dialogue in
individual states.
Additional factors beyond GPE support
83. A range of projects have taken place in the states now supported by NIPEP. DFID’s ESSPIN project provided support for data quality in Jigawa, Kano and Kaduna. The Teacher Development Program included support for data on teachers in Jigawa, Kaduna, Kano and Katsina. DFID’s EDOREN project provided significant technical assistance to EMIS across the northern states. UNICEF has played a strong role in providing support for monitoring at the state level through the Girl’s Education Program. USAID works in Bauchi and Sokoto to strengthen effective education management systems.
87 The evaluators received minutes of meetings the FPSU held with DPs on July 12, 2016, and January 31 and April 10, 2017.

DRAFT REPORT (VX) – COUNTRY
36
© UNIVERSALIA
Unintended negative/unplanned positive effects of GP E support
84. Relationships between institutions and levels of government in Nigeria are complex and sometimes tense. The support provided by GPE to the state ministries of education, as well as its support to the development of the NEG may have unintended consequences for how these institutions view each other or relate to each other. For example, by focusing support on state ministries of education, the SUBEBs may feel that they are being overlooked (as the natural home for basic education funding). While there is no conclusive evidence that GPE funding is negatively affecting working relationships at the state level – it is a plausible adverse effect of external support.
Implications for GPE’s ToC and country level operational model
85. It is extremely difficult to consider how one organization could take on the CA role as intended in an education system that is as large and complex as Nigeria’s. The resourcing concerns regarding the CA role are even more pronounced in Nigeria. Notwithstanding the constrained conceptualization of the CA role, a full-time position to coordinate NIPEP needed to be created as DFID take over the CA role from USAID. This was negotiated between the GA and DFID who agreed that NIPEP funds would be used to support the CA role which is moving from USAID to DFID. In 2019, NIPEP funding was used to employ a “coordinating consultant” who has been instrumental in supporting DFID in their role as co-chair of the NEG and coordinating the Education Sector Analysis. This has provided support to the CA role which is not technically mandated through GPE conception of that role – and shows how the provision of funding for the role of the CA could make a significant difference in large and complex countries such as Nigeria.
86. Most stakeholders do not see the CA role as relating to broader coordination across government and DPs towards mutual accountability, but rather as the coordinator of NIPEP to improve mutual accountability for NIPEP implementation. Stakeholders spoke of NIPEP funds ‘being everyone’s funds’ and spoke of the CA role in terms of coordinating DPs and government around NIPEP implementation and ensuring the broad group of DPs are involved in decision-making processes for NIPEP. GPE provided clear terms of reference (ToR) for the coordinating agency but it is difficult to operationalize them in Nigeria’s complex federal system. Considering the unique context, a more participatory process for developing a ToR and mandate for the CA could be worked on in the NEG with support from the Secretariat. Having a shared understanding of what the role of the CA in Nigeria entails would then allow for funding for this role (as is currently being provided through NIPEP) to be specifically included in the next ESPIG.
87. The CL could bridge this gap, by facilitating conversations around the role of the GA and the CA
and being more involved in what takes place between grant applications. Stakeholders varied in their
views regarding the extent to which the CL should be involved in national level discussions and
decision-making processes. Some stakeholders felt the CL could add great value by being closer to
national processes, while others felt national partners should be left to make decisions for the national
context. Certainly, the lack of conceptualization of the role of the CA as related to coordination at the
sector level, indicates that closer communication between the CL and national partners is required.
Potentially, the CL could add value by communicating the GPE ToC and providing examples of good
practice from other countries, while leaving national partners to decide what will work in the national
context. The CL’s role could strengthen the impact of the partnership by facilitating conversations
around the role of GA and the CA and being more present and involved in what takes place between
grant applications.
Box 4 assesses the assumptions that underpin sector dialogue and monitoring in the GPE ToC.
Box 4 - Testing Assumptions and Assessing Strength of Evidence

DRAFT REPORT (VX) – COUNTRY
37
© UNIVERSALIA
For sector dialogue and monitoring, the four underlying assumptions in the country level ToC were: (1) GPE has sufficient leverage at global and country levels to influence LEG existence and functioning; (2) country level stakeholders having the capabilities to work together to solve education sector issues. (3) Stakeholders have the opportunities (resources, time, conducive environment) to do so; (4) stakeholders have the motivation (incentives) to do so. The final assessment at the end of the final year of this evaluation is:
Assumption 1 does not hold. The LEG has not existed and functioned over the policy cycle in Nigeria. The size of the national LEG (NEG) is too large to be a functional decision-making mechanism. In addition, without the political buy-in of senior education government officials, the NEG cannot meet regularly. At the state level it is well evidenced that GPE has not had sufficient leverage to influence LEG existence.
Assumption 2 holds. There is capability both in the government and in partner organizations to coordinate around sector issues, however this involves developing innovative strategies for coordination in a complex and multilayered education system.
Assumption 3 is mixed. While many stakeholders have the opportunities to work together to solve education sector issues, in circumstances where the political will of education commissioners, Permanent Secretaries, Governors and Ministers is not present, such opportunities are significantly constrained.
Assumption 4 is mixed. The stakeholder groups responsible for solving education sector issues in Nigeria are diverse and solving sector issues needs to take place at multiple levels. Where there is a breakdown in incentives, all stakeholders are constrained.
The evidence for assessing changes in mutual accountability through dialogue and monitoring in Nigeria is reasonably strong. Dialogue and monitoring do not take place as part of the usual practice of education sector actors. Both documentary evidence and stakeholder interviews confirm that dialogue is most commonly bilateral, dialogue mechanisms have not existed consistently over the policy cycle and there is little data to evidence that monitoring activities have taken place.

DRAFT REPORT (VX) – COUNTRY
38
© UNIVERSALIA
3.4 GPE contributions to sector financing88
88. A high-level overview of evaluation findings on sector financing and related GPE contributions is provided in Table 15. These observations are elaborated on through the findings and supporting evidence presented below.
Table 15 - Progress made and GPE contributions to sector financing
PROGRESS MADE TOWARDS MORE/BETTER EDUCATION SECTOR FINANCING
LIKELIHOOD OF GPE CONTRIBUTIONS TO89:
Total domestic educ. ex-penditure
Education share of domestic budget
Met 20% Goal?90
Total intl. education financing to country
Quality of intl. financing
Amount of domestic financing
Amount of intl. financing
Quality of intl. sector financing
Decrease Total federal budget allocations have fallen in real terms since 2011
Decrease
This has fallen from over 10 percent in 2014 to 7% in 2017
Uncertain
While federal allocations are well below 20 percent, there is no clear data on total spending. FMoE budget allocations are falling and stood at 7% of the total federal budget in 2018.
Increased
Donor funding for education has increased to US$172 million or 11 percent of FMoE allocation.
Mixed
Traditionally harmonization of donor funding has been poor – but there are signs of improvement in recent years.
Low Low Moderate
DEGREE TO WHICH UNDERLYING ASSUMPTIONS HOLD
1 2 3
STRENGTH OF THE EVIDENCE CONFIRMING/REFUTING THE GPE CONTRIBUTION91
1 2 3
Characteristics of sector financing during review period
Public expenditure on education
88 This section addresses evaluation questions CEQ 1.5 and 1.6, as well as (cross cutting) CEQs 3.1 and 3.2. 89 Assessment is based on (i) existence/absence of positive change in respective area; (ii) stakeholder views on likelihood of GPE support/funding criteria having influenced domestic or international funding decisions; (iii) absence or existence of additional factors that are as/more likely than GPE support to explain noted trends. 90 One of GPE’s ESPIG funding requirements is that 20 percent of government expenditure be invested in education, or that government expenditure on education show an increase toward the 20 percent threshold. 91 For sector financing, the two underlying assumptions in the country level ToC were: (1) GPE has sufficient leverage to influence the amount and quality of domestic education sector financing, and (2) External (contextual) factors permit national and international stakeholders to increase/improve the quality of sector financing.

DRAFT REPORT (VX) – COUNTRY
39
© UNIVERSALIA
Finding 7: Domestic spending on education is declining as a result of overall economic developments. It is not possible to estimate the share of total spending devoted to education compared to the GPE recommended 20 percent though estimates place it around 10 percent. State budgets and direct local government transfers remain elusive, making it difficult to get an accurate picture of total domestic education financing.
89. The state of domestic financing in Nigeria is deteriorating. Decreases in oil revenues, rising debt servicing obligations have reduced the share of the government budget being allocated to education since its peak in 2015. This shift was partly precipitated by a recession caused by falling oil prices in 2015, which also led to a rapid devaluation of the Naira against the US dollar. It is difficult to discern the exact amount of domestic funding being allocated to education, with FMoE, SMoE, UBEC, SUBEBs and LGAs all presiding over different budgets with income for education being generated at the federal, state, local government and school level.92 Estimates from various sources place it around 10 percent.93 While underfunding of the system is an issue it is not the only issue. How funding for education is measured, reported, and delivered causes significant challenges for the education sector.
Table 16 - Overview of available financial data for basic education at national and state level94
CATEGORY 2012 2013 2014 2015 2016 2017 2018 TREND95
National Level
92 For more information on the complexities of domestic education financing in Nigeria, see the work done by ESSPIN (https://www.esspin.org/reports/download/410-file-ESSPIN%20Basic%20Education%20and%20School%20Improvement%20%20Programme%20Financing%20Report.pdf), the Education Commission (http://report.educationcommission.org/wp-content/uploads/2017/01/Financing-Basic-Education-in-Nigeria.pdf) and the World Bank (http://documents.worldbank.org/curated/en/123131468195000690/Governance-and-finance-analysis-of-the-basic-education-sector-in-Nigeria 93 This is based on figures in Ubogu and Veronica (2018) – synthesised from federal budget documentation. This is backed up by the World Bank PER for basic education (2015) which places the total government expenditure on education at 12 percent of total expenditure. 94 Figures in this table come from a variety of sources (listed in the table), the reliability of some of which can be questioned, particularly on the estimates of state expenditure, which are taken from available state budget documentation. 95 Considering the widely reported difficulties with reliability of financial data, and the significant portions of financial data not reported (i.e. salary expenditure, local government expenditure, expenditure by non-SUBEB federally funded parastatals) mean that the trends reported in this table should be taken as indicative rather than absolute.

DRAFT REPORT (VX) – COUNTRY
40
© UNIVERSALIA
CATEGORY 2012 2013 2014 2015 2016 2017 2018 TREND95
Total domestic
education expenditure,
all levels, current US$
(millions)96
Source: Federal Budget
Documentation
2,928.66 2,504.75 2,592.39 2,690.35 2,251.39 1,835.02 1,682.77 Falling97
Education expenditure
as share of total Federal
budget
9.86 10.15 10.54 10.28 7.92 7.40 7.04 Rising then
Falling
Total UBEC Funding
Released
All states, current US$
(millions)
Source: UBEC annual
reports
- 534.60 797.63 889.99 521.92 120.06 - Rising then
Falling
NIPEP States
SMoE Budget
Total
expenditures,
current US$
(millions)
Source: State
budget
documents
Jig - - - 162.36 156.39 - -
Kad - - - 140.86 153.04 49.88 -
Kan - - - 131.36 151.52 140 -
Kat - - - 121.11 126.92
- 47.6
Sok - - -
92.45 69.26
- -
SMoE Budget as
share of total
state budget
Source: Most
recent State
Education Sector
plans98
Jig - - - - - - -
Kad - - - 17% 23% 16% -
Kan - - - 15% 11% 23% -
Kat - - - - - - -
Sok - - - - - - -
96 No concrete value is available for this amount from any source – What is given here is based entirely on the federal allocations for education, which covers FMoE and UBEC – but doesn’t include state expenditure, or local government expenditure on education (which includes salary expenditure for education). 97 While the absolute figures are falling, the steep decline between 2015 and 2017 was exacerbated by a devaluation of the Naira against the US Dollar between those years, while the general decline is in part attributable to the 2015 oil crisis (as is the currency devaluation). 98 This data only accounts for the SMoE budget, and doesn’t take into account actual release rates, which, while not openly reported – are anecdotally reported as being very low for state ministry budgets (though much higher for UBEC funding).

DRAFT REPORT (VX) – COUNTRY
41
© UNIVERSALIA
CATEGORY 2012 2013 2014 2015 2016 2017 2018 TREND95
UBEC
Contribution
Total accessed
amounts, current
US$ (millions)
Source: UBEC
disbursement
amounts99
Jig - 14.81 21.57 24.79 19.19 8.58 - Fluctuating
Kad - 14.81 21.57 24.79 19.19 - - Fluctuating
Kan - 14.81 21.57 24.79 19.19 - - Fluctuating
Kat - 14.81 21.57 24.79 19.19 - - Fluctuating
Sok - 14.81 21.57 24.79 19.19 8.58 - Fluctuating
Source: Authors’ Elaboration from various sources
90. Domestic financing for education in Nigeria is complex and opaque. Before 2004, primary responsibility for education funding lay with state governments. However, since the universal basic education act this has not been entirely the case. Teachers’ salaries are ringfenced from federal revenues and paid directly through Local Government Authorities100 by the Federal Account Allocation Committee (FAAC). In addition to this two percent of the federal consolidated revenue fund is ringfenced for UBEC and distributed through the UBEC intervention fund – split equally among states (a breakdown of how the UBEC-IF is distributed is shown in Table 18). The rest of funding for education – administered through the SMoEs and LGAs – comes from federal transfers to state governments through the FAAC,101 and locally generated revenues (both at state and local government level).
Table 17 - Sources of education funding
Source of Funding Proportion of Total
Federal Government 18 percent
State 13 percent
UBEC 3 percent
LGEA 25 percent
Household 40 percent
Source: World Bank Public Expenditure Review (2015)
Table 18 - Allocation of UBE-IF funding by grant category (2019)
Grant Type Proportion of Total
Matching Grants 50 percent
Education Imbalance 14 percent
Instructional Materials 15 percent
Teacher Professional Development 10 percent
Good Performance 5 percent
Special Education 2 percent
99 This was provided for the UBE-IF, and calculations were done to give a reference for the total UBEC contribution to basic education per state. Itemized disbursements for UBEC funds were not made available to the evaluation team, and are not publicly published, or recorded in SMoE planning documents. 100 The funding comes to LGEAs through the FAAC – but in many states the portion for teachers’ salaries is transferred upwards to SUBEBs who have the administrative capacity for managing salary payments. 101 Total FAAC funds are split between Federal Government (52.68%), States (26.72%) and local governments (20.60%). FAAC shares resources for state governments based on five criteria: equally for all states (40%), population (30%), landmass and terrain (10%), social development (10%), and internal revenue generation effort (10%).

DRAFT REPORT (VX) – COUNTRY
42
© UNIVERSALIA
UBE monitoring 2 percent
UBE implementation 2 percent
Source: Federal Ministry of Education Documents (2019)
Finding 8: While the introduction of earmarked funding for education through the UBE act has increased the reliability of paying teachers’ salaries – the tying of funding to oil prices (combined with complex and inefficient budgeting systems) has led to unreliable and unpredictable funding flows.
91. The 2018 report described a movement towards digitalization and harmonization of budgeting and accounting practices at state level – but this years’ country visit found that this had not taken place. The poor quality of data available on funding for education is a major barrier to planning, coordination and accountability at state and federal level. For example, in the new SESPS/MTSSs the financial models for the states include only the budgets of the State Ministries of Education – excluding all of the federally transferred funds for teachers/SUBEBs. When discussing sector planning with DPs, state budgeting practices were perceived to be a barrier to more robust planning (a point made by the World Bank’s 2015 PER for basic education) – with a lack of communication and structural alignment102 between state ministries of planning and budgets (SMoPB) and the SMoEs planning and funding models. There is a push to reform this by strengthening inter-ministerial communication in planning over the next policy cycle – but it is too early to say how successful this will be.
92. Given the wide variety of sources of domestic education spending, issues of reliability and allocation of resources are significant – with low release rates leaving non-salary projects severely underfunded. The available data on expenditures at the state level shows that release rates for state budgets are low, as is the proportion of released funding going to non-salary expenditure. A comparison of education budgets and actual expenditure is shown in Figure 4, showing release rates between 28 percent (Sokoto) and 76 percent (Katsina). In addition to this, reports from interviews show that within these rates, release rates vary hugely by source, with UBEC funding being much more reliable that state budget funding.103 Work by the Education Commission in Kaduna showed that teachers’ salaries accounted for 98.9 percent of expenditure in years that UBE-IF funds were not accessed (for example in 2012), while in years in which Kaduna could access UBE-IF funding salary expenditure accounted for 87.9 percent of expenditure.104 This shows that beyond UBE-IF funding there is almost no funding made available to schools for non-salary expenditure. The same study found that in both Lagos and Kaduna – there was confusion about who was accountable for non-salary contributions to school budgets – with most interviewed parties seeing the LGAs as responsible for non-recurrent funding – despite them spending 99 percent of their budgets on teachers’ salaries. The combination of unpredictable federal revenue, and diffusion of responsibility has left schools fundamentally under-funded.
102 “lack of structural alignment” here refers to how state budget lines are arranged – budget lines in state budgets do not allow for federal funds to be recorded and tracked in state budgets, structures which SMoEs have to echo their budgeting – meaning that recording of actual funding for education is very difficult – as well as modelling forward for sector plans. 103 One stakeholder reported that the science and technical schools board in Kano state had in 2018/19 received none of allocated annual budget, by July. 104 For more details on the effectiveness and accountability of funding in Kaduna and Lagos see: http://report.educationcommission.org/wp-content/uploads/2017/01/Improving-Basic-Education-Outcomes-in-Nigeria.pdf

DRAFT REPORT (VX) – COUNTRY
43
© UNIVERSALIA
Figure 4 - Comparison of state budgets and expenditure 2015-2016
93. Unpredictability of income for schools has led to a growing reliance on donor funding, and revenues raised from communities by the SBMCs. When looking at school development plans in schools in the NIPEP states, most described the activities for 2018–19 to be funded by NIPEP funds, or through revenues generated by the SBMC. SBMC members report this is a response to the lack of non-salary funding reaching schools from the state government.105 ESSPIN reporting106 on the multiplier effects of supporting SBMCs with resource mobilization efforts found that funding was leveraged at a ratio of 5:1 (when compared to the inputs from ESSPIN in supporting 1,120 SBMCs with resource mobilization) with an average of approximately US$6,000 raised per school over a three-year period. There is no more recent data on how well SBMCs continue to raise money – or whether those supported by state governments (or NIPEP) are as effective at raising money as the original ESSPIN supported cohort. While this funding is incredibly valuable, both in demonstrating community buy-in, but also in providing agile, direct funding for key school level issues, it draws attention to the deficits in government funding for education. SBMC funding for education is a valuable interim, or additional measure. However, these funds are unmonitored, and accountability can only take place at the community level. This makes improving PFM in education more difficult and exacerbates inequalities between poorer and richer communities (the ESSPIN study found that much more was mobilized in southern states than in northern states). Box 5 gives an overview of how revenue vulnerability is caused by an over-reliance on oil revenues for education funding.
94. Ultimately, the lack of clarity in funding means that planning and accountability in the sector are almost impossible – but these issues cannot be solved separately from institutional reform. There are deep and ongoing issues both with the amount and the quality of domestic financing for education in Nigeria. These problems are not only problems of political will to fund education – the institution of the UBE act in 2004 enshrined a government commitment to fund education. When reviewing the amount and quality of funding for education, two key findings emerge 1) the direct linkage between education funding and oil prices, in the absence of significant locally generated
105 This means from SUBEB – which is mostly funded by UBEC but also receives state budget funding. It is again difficult to assess how much funding reaches schools from SUBEB – as SUBEBs do not publish any reports. 106 From the 2015 SBMC resource mobilization validation study http://www.esspin.org/reports/download/442-file-SBMC-Validation-Joint-Report-final-Oct16.pdf
0
10,000
20,000
30,000
40,000
50,000
60,000
Jigawa Kaduna Kano Katsina Sokoto
2015 Allocation 2015 Release 2016 Allocation 2016 Release

DRAFT REPORT (VX) – COUNTRY
44
© UNIVERSALIA
revenues at state level, is problematic, and 2) the number of funding streams and accountable bodies involved in funding education has caused a diffusion of responsibilities which hinders the quality of funding, as well as the ability to plan and monitor the sector effectively.
Amount and quality of international financing
Finding 9: The amount of international financing has increased steadily in recent years. In absolute terms ODA plays a small role compared to domestic funding (equivalent to between 6 and 12 percent of FMoE funding) – but it plays an important role in system strengthening and innovation.
95. The absolute amount of ODA being directed to education has increased since 2011. However, the proportion of ODA going to education has fallen slightly and remains low, at 5%. The share of education ODA being spent on basic education has increased over the same period – to 32 percent in 2017 (all figures shown in Table 19). What is not shown in these figures is the geographic spread of ODA. While no state level data is available through the Creditor Reporting System (CRS), due to the limited geographical range of major donors (e.g. USAID in Sokoto and Bauchi, and DFID in Jigawa, Kaduna and Kano) it is likely that there is significant imbalance in the contribution of ODA for education between states and geopolitical zones.
107 https://www.oxfordmartin.ox.ac.uk/downloads/academic/Nigeria_Oil_WP_final_130819.pdf 108 Data on FAAC reliance, and oil price vulnerability from https://www.esspin.org/reports/download/38-file-1253289922-esspin_203_lg_s.pdf as well as from https://openknowledge.worldbank.org/bitstream/handle/10986/23683/Governance0and0on0sector0in0Nigeria.pdf?sequence=1&isAllowed=y
Box 5 -Oil Prices and Vulnerability of Funding for Education in Nigeria
Most public funding for education in Nigeria is reliant on federal revenues, 47 percent of which comes from oil.107 The price of oil peaked in 2012, dropped slightly in 2013-2014 and plummeted in 2015; it has risen somewhat in 2018-2019 to about two-thirds of its 2012 level. Similarly, public spending on education increased substantially from 2009 to 2013 (source: PER 2015). Basic education salaries mainly come from the federal allocation, which varies by state; at the state level, internally generated revenue ranges from 1% of education finance to 40%, with over half of the states generating less than 10% of education sector finance; thus states are highly vulnerable to fluctuations in oil prices that affect federal revenue. Federal funding for education is allocated through the Federal Account Allocation Committee (FAAC). This means that the amount of funding for education is effectively decided as a proportion of available revenue, rather than based on the sector needs. This means that the sector is vulnerable to fluctuations in oil prices. The proportion of state budgets coming from internally generated revenues is much lower in northern states then in coastal states (2.4% in Jigawa compared to 40.8 percent in Lagos),108 adding to the vulnerability. When oil prices drop – as they did in 2015 – states that are more reliant on FAAC revenues suffer more. This is compounded by UBE-IF matching grants which are reliant on states providing matched funding for infrastructure. It is reported that in 2014 and 2015, as oil prices dropped, states that had lower IGRs were less likely to access UBE-IF matching grants. This trend was, however, not consistent, with some states (like Kano) continuing to access the funding despite having a 97 percent reliance on FAAC funds – showing that it is perhaps also an issue of political will at the state level.

DRAFT REPORT (VX) – COUNTRY
45
© UNIVERSALIA
Table 19 - Summary of Official Development Assistance to Nigeria109
FLOW 2011 2012 2013 2014 2015 2016 2017 TREND
Total ODA, all sectors,
2017 constant US$
(millions)
1,778.22 1,887.38 2,482.48 2,399.57 2,509.65 2,699.01 3,471.57 Rising
Total education ODA
2017 constant US$
(millions)
127.23 135.88 138.78 131.50 143.32 156.79 172.98 Rising
Education ODA as % of
FMoE Budget 6% 6% 5% 5% 8% 12% 11% Rising110
Education ODA as % of
total ODA 7% 7% 6% 5% 6% 6% 5% Falling
Basic education ODA
2017 constant US$
(millions)
23.53 24.78 35.44 12.13 22.44 38.05 55.31 Rising
Basic education ODA as
% of total education
ODA
18% 18% 26% 9% 16% 24% 32% Rising
Source: stats.oecd.org
Finding 10: International financing in Nigeria performs very poorly on measures of alignment and accountability – with most projects being off-budget and not aligned with government planning.111 However, programs such as NIPEP and BESDA which use government fiduciary systems, and the revitalization of the NEG point to potential improvements in the quality of international financing.
96. While funding is effective in the short term – a lack of alignment112 with government planning and systems, as well as a lack of harmonization between donors erodes its long-term value. While donors are focused on ensuring the effectiveness of their funding over the project cycle – the projectized nature of funding in education has created confusion and a projectized mentality in government. When speaking to government stakeholders – answers to questions about sector
109 All figures taken from OECD Creditor Reporting Standards (stats.oecd.org) showing total ODA from all donors (DAC, Non-DAC, Private Sector), for gross disbursements in 2017 constant US$. 110 This rise is partly facilitated by the devaluation of the Naira, making ODA in foreign currency comparatively more valuable. 111 The best proxy available for this is the amount of funding reported to the CRS as being contributions to pooled funds or budget support. For 2017, no money was disbursed as sector budget support for education, and 15 percent was to funds managed by NGOs – i.e. off-budget pooled funds. The rest was a combination of project interventions (66 percent) and technical support and scholarships (21 percent). 112 Alignment here is defined by the GPE results framework as alignment on eight measures: planning, budgeting, treasury accounts, procurement procedures, accounting, auditing, and reporting

DRAFT REPORT (VX) – COUNTRY
46
© UNIVERSALIA
planning were often met with a confusion about which plan. The idea of planning at state level has become tied to the idea of accessing donor funding – being seen as a pre-requisite for the establishment of the next donor funded project - which may use government bodies for implementation (or second government officials to its project offices). In the states with a consistent donor presence, this cycle of projects has become an assumed norm, which erodes consistency or long term thinking in planning – and ultimately the long-term effectiveness of donor funding.
97. Some improvements can be seen in the quality of ODA for education – with the World Bank increasingly pushing for alignment and performance-based funding through the Better Education Service Delivery for All (BESDA) program. There is a movement among donors to reflect more deeply on how they align their funding with planning, budgeting and accounting systems in states. BESDA, which is being implemented across sixteen northern states, is implementing its funding through UBEC, with the intention of improving monitoring and accountability in UBEC, by tying the release of funding to reporting-based process indicators. This is a positive development in terms of pushing for true alignment of funding.113 Similarly, in interviews with other donors it is clear that it is becoming commonly understood that donor funding should be better harmonized and aligned, especially in the states where multiple donors operate. This trend, emergent since the first country visit of this evaluation, is a positive development.
GPE contributions to sector financing
Finding 11: It is hard to accurately measure the relative contribution of NIPEP funding to the states in which it operated – but it is small (with a reported average of 2.69%). However, GPE advocacy inputs are potentially leading to improving the quality of both domestic and international financing for education.
98. GPE contributions to sector financing in Nigeria can be divided between their financial contributions to MTSS funding, and non-financial contributions through advocacy, the imposition of standards as part of grant applications, and technical support from the Secretariat, Grant Agent and Coordinating Agency.
Table 20 -Summary of GPE contributions to domestic and international financing SIGNIFICANT CONTRIBUTION TO DOMESTIC
FINANCING SIGNIFICANT CONTRIBUTION TO INTERNATIONAL
FINANCING
None None
MODERATE CONTRIBUTION TO DOMESTIC FINANCING
MODERATE CONTRIBUTION TO INTERNATIONAL FINANCING
None ESPIG funds. A small portion of the overall budget, ESPIG funding has contributed to education activities in 5 states. However, this contribution is currently no greater than any other project and has not leveraged additional international or domestic funding.
113 More detail on this in the next section – but “true alignment” is used here because there are other funds that are aligned technically to government fiduciary systems (like NIPEP) but use the accounting structures of a non-UBEC body (like SMoEs) in which, due to the lower volumes of funding, are more transparent/accountable. If the aim of alignment is to strengthen mutual accountability, then the most valuable way of doing it is through either UBEC, or through the higher levels of state governments (i.e. the department of planning and budgets).

DRAFT REPORT (VX) – COUNTRY
47
© UNIVERSALIA
GPE Advocacy for Harmonization and Alignment. There are positive indications that the work done by GPE actors on coordinating the sector and advocating for better alignment and harmonization of funding has the potential to change thinking. However, at the time of writing there was no evident indication that this advocacy has led to any practical changes in the quality of international finance.
LIMITED/NO CONTRIBUTION TO DOMESTIC FINANCING
LIMITED/NO CONTRIBUTION TO INTERNATIONAL FINANCING
ESPIG funding requirement. It is not clear that this advocacy has any effect on motivation in government. Predominantly ESPIG funding has been pursued by DPs, rather than government actors.
ESPIG modality. The ESPIG has attempted to align to some extent with government financial systems. However, this has not been successful and reform is required in order for the ESPIG modality to make a contribution to PFM.
GPE support for sector planning. The MTSSs do not currently cost education implementation to achieve specific targets in the sector. Therefore, GPE support for sector planning has not yet contributed to more or better financing in Nigeria.
None
Source: Authors’ Elaboration
99. The relative contribution of NIPEP to sector plan financing is difficult to accurately measure as the ESPIG application figures lack practical basis. Stakeholders involved in the initial grant application process, stated in interviews that there were huge difficulties in coordinating the collection of ESP costing data from across the five states. Data was either not available, inconsistently presented across states, or simply unreliable. Estimations were used in order to satisfy requirements. It is widely agreed that these figures do not represent any kind of accurate depiction of the cost of funding education in the five states. The figures presented on the ESPIG application are shown in Table 21.
Table 21 - Comparison of NIPEP financial inputs and estimated costs of state MTSSs (2015-2019) (US$ 000s)114
GPE States Total MTSS Costs NIPEP Input % Contribution of NIPEP to MTSSs
Jigawa 311,300 11,949 3.84%
Kaduna 753,200 21,589 2.87%
Kano 793,900 27,346 3.44%
Katsina 997,000 13,090 1.31%
114 These figures should be taken as indicative. As state MTSSs and budgets does not include all contributions to or costs of education, and the methods of accounting vary significantly between states, it is not possible to say how accurate these estimates are.

DRAFT REPORT (VX) – COUNTRY
48
© UNIVERSALIA
Sokoto 410,400 8,420 2.05%
Federal 454,400 17,605 3.87%
Total 3,720,200 99,999 2.69%
Source: NIPEP Project Appraisal Document (2014)
100. The importance of GPE focus on planning and alignment has begun to emerge in the thinking of other donors. Ideas of alignment and harmonization have become more present in discourse in the education sector in Nigeria. Stakeholders credited this to the emphasis placed by GPE on planning and the support for forming the NEG.115 By emphasizing the importance of sector plans, the question is inevitably raised of why other donor funded projects are not aligning to planning at the state level. While this has not necessarily manifested in any concrete changes to how donors operate it should be a marker of the positive influence GPE is having on sector financing in Nigeria.
101. NIPEP funding was informally intended to advocate for improved financial accountability in UBEC, which was to be solidified by BESDA investment. A major point of note from the 2018 annual report was the decision for NIPEP funding to be delivered through the SMoEs rather than through UBEC or SUBEBs as domestic funds for basic education are. The decision was justified on the basis that issues with accountability of funding in UBEC made using the SMoEs a much safer option. BESDA then pushed to change this by using UBEC to disburse its funding to the states. It is interesting to note that both decisions were made by the World Bank, showing a crucial evolution in thinking around funding and accountability over the last five years.
102. Further discussions around this thinking in the 2019 country visit showed that the decision for the NIPEP funding to avoid UBEC was made on the basis that it could be used as a halfway house between projectized funding and fully aligned funding116 for basic education – providing incentive for UBEC/SUBEBs to become more transparent in order to attract future funding. Unfortunately, it seems that this has not been entirely successful. BESDA funding is being allocated through UBEC, with the intention that funds should be directed from UBEC to SUBEBs and other state level bodies. However, there are initial reports that funding is not being released from UBEC to the states,117 and interviewed stakeholders reported frustration with the lack of transparency in UBEC processes. GPE funding has been important in Nigeria in pushing the needle towards better alignment of funding, as well as in creating a more unified, cross-project approach to system strengthening. The future direction funders should take remains unclear – while NIPEP funding has been more effective than BESDA funding,118 it misses potential opportunities to directly leverage greater accountability within UBEC.
115 While the formation of the NEG is the responsibility of the Permanent Secretary – NIPEP funding has been used to employ a “coordinating consultant” who has supported the organization of the ESA, as well as having a key role in the NEG, supporting DFID as Coordinating Agency and Co-Chair of the NEG. 116 Technically NIPEP counts as closely aligned funding as it uses SMoE fiduciary and procurement systems, but the reality is that it is not perceived as such, because other federal funding does not use direct disbursements to the SMoE (state budget allocations are the only source of SMoE funding). 117 While the evaluation team does not have access to internal BESDA documentation – what can be seen from the latest Implementation Status and Results Report (ISR. 4) is that money has been disbursed (i.e. from the World Bank to UBEC) but that there has been no progress made on any of the indicators (process or outcome) – implying that there is either a significant lag in monitoring or in implementation, which would triangulate the data from interviewed stakeholders. 118 This is demonstrated by the difference in fiduciary risk assessment between NIPEP (moderate) and BESDA (High Risk) – from the ISR risk assessments

DRAFT REPORT (VX) – COUNTRY
49
© UNIVERSALIA
Additional factors beyond GPE support
103. The international financing directed to the north western states in Nigeria has been significant in recent years, countering the disparities in education outcomes between the coastal and northern zones. Between the World Bank, DFID and USAID – over US$1 billion has been allocated to education in northern Nigeria since 2008. This funding has been significant in itself, and in addition some of the activities funded have helped improve quality of domestic financing. In particular, both ESSPIN and EDOREN have produced research materials (referenced in this report) related to improving funding for education in Nigeria. Additionally, ESSPIN was instrumental in building SBMC capacity to mobilize funding at the community level – an effort which has been crucial for supporting education in the north-west – and continued with state and NIPEP funding. Looking forward, both BESDA and PLANE contain significant system strengthening components which will look to improve accountability in the sector – which ultimately supports better funding for education.
Table 22 - Summary of Major Donor-Funded Projects in NIPEP states119
Project Timeframe Jigawa Kaduna Kano Katsina Sokoto Total (US$)
PLANE (DFID)120 2019-2027 x x x 123,500,000
BESDA (WB)121 2018-2022 x x x x x 611,000,000
NEI+ (USAID)122 2015-2020 x 16,669,403
EDOREN (DFID)123 2015-2018 -124 - - - - 9,078,749
GEP3 (DFID)125 2012-2020 x x 114,789,995
TDP (DFID)126 2012-2019 x x x 41,239,631
ESSPIN (DFID)127 2008-2017 x x x 168,269,302
Total 1,084,547,080
Source: Various Project Documents
119 While it would be useful to see exactly how funding was divided between states, this data is not consistently available across projects. It must also be noted that some projects funded education outside of the North-West region (for example, ESSPIN also included Lagos, Enugu and Kwara states – and BESDA includes a total of 16 states. 120 Source: https://devtracker.dfid.gov.uk/projects/GB-GOV-1-300416 121 Taken from the Project Appraisal Document (PAD) for BESDA. Source: http://documents.worldbank.org/curated/en/839251498183393835/pdf/BESDA-PAD-May-30-2017-06012017.pdf 122 Data taken from USAID’s data tracker. Source: https://explorer.usaid.gov 123 Source: https://devtracker.dfid.gov.uk/projects/GB-1-205066 124 EDOREN technically had a national focus – as it was driven by improving the quality of data and research nationally. However, the evaluation portion of the project focused heavily on the three DFID focal states: Jigawa, Kaduna and Kano. 125 Source: https://devtracker.dfid.gov.uk/projects/GB-1-202643 126 Source: https://devtracker.dfid.gov.uk/projects/GB-1-202942 127 Source: https://devtracker.dfid.gov.uk/projects/GB-1-104200

DRAFT REPORT (VX) – COUNTRY
50
© UNIVERSALIA
Implications for GPE ToC and country level operational model
104. Nigeria presents a significant challenge for GPE theory of change. In the GPE results framework for Nigeria no data on indicator 10 (measuring whether domestic funding for education reaches 20 percent of total government spending) is presented, due to the difficulty in ascertaining accurate figures. This leads to the question of how the GPE model (i.e. supporting a chain through planning, mutual accountability and better financing to support plan implementation) can work in the absence of transparency in financing, which is deeply linked to a lack of transparency in data across the sector. For example, how can a credible sector plan be produced when there is no way to model funding for education over the ESP’s lifespan? Similarly, the complexities in funding for education are illustrative of the institutional complexities in education in Nigeria – complexities which make mutual accountability (through inclusive dialogue and monitoring) incredibly challenging.
105. What has emerged over the course of this evaluation is that while it seems that the quality of domestic and international financing is not improving in Nigeria, the reality is that change is incremental and gradual. As shown in other sections in this report there are signs that GPE advocacy is beginning to show returns – just at a pace reflective of a large complex system. For improving the amount, and particularly the quality going forward, an explicit strategy for improving transparency in sector funding needs to be developed. GPE should dedicate a significant portion of its funding and advocacy towards a harmonized system for accounting and reporting across states, and levels of governance (i.e. school level, LGA, State and Federal).128 While this is not an easy task, it is an important first step in having a system that can produce credible sector plans and transparent monitoring. Without this work, the ability of GPE funding to function as laid out in its theory of change will continue to be impaired.
106. Box 6 assesses the assumptions underpinning sector financing in the GPE ToC.
128 It will be of interest to track the impact of the much larger BESDA program, which is also focused on reforming government education funding.
Box 6 - Testing Assumptions and Assessing Strength of Evidence
For sector financings, the three underlying assumptions in the country level ToC were: 1) GPE has sufficient leverage to influence the amount and quality of domestic education sector financing, (2) External (contextual) factors permit national and international stakeholders to increase/improve the quality of sector financing, (3) stakeholders have the opportunities (resources, time, conducive environment) to do so.
The final assessment at the end of the final year of this evaluation is:
Assumption 1 does not hold. Domestic education sector financing in Nigeria remains opaque. The relative size of the ESPIG is not large enough to influence domestic financing.
Assumption 2 does not hold. The complexity of education financing in Nigeria, the unpredictability of oil prices and the need for institutional reform in PFM significantly constrain national and international stakeholders in improving the quality of sector financing.
Assumption 3 is mixed. A range of stakeholders are involved in domestic and international sector financing and the political will of a handful of important government officials significantly influences the extent to which other stakeholders have the opportunities to improve the quality of sector financing.
The evidence for assessing changes in the education system in Nigeria is strong. The absence of data on sector financing points to disjointed and opaque funding flows in Nigeria.

DRAFT REPORT (VX) – COUNTRY
51
© UNIVERSALIA
3.5 GPE contributions to sector plan implementation129
107. A high-level overview of evaluation findings on sector plan implementation and on related GPE contributions during the review period is provided in Table 23. These observations are elaborated on through the findings and supporting evidence presented below.
Table 23 - Progress made and GPE contributions to sector plan implementation
PROGRESS MADE TOWARDS SECTOR PLAN IMPLEMENTATIONIMPLEMENTATIONIMPLEMENTATION
DEGREE OF GPE CONTRIBUTION
DEGREE TO WHICH UNDERLYING
ASSUMPTIONS HOLD 130
Weak: There is currently little evidence that the range of (mainly unknown) set of education activities that take place in Nigeria are aligned to sector plans.
Modest: GPE contribution to implementation is primarily through ESPIG implementation.
1 2 3 4 5
STRENGTH OF THE CONFIRMING/REFUTING
EVIDENCE
1 2 3 4 5
Characteristics of sector plan implementation
Finding 12: Until credible plans with meaningful targets exist in Nigeria, sector plan implementation will remain a misnomer for the (mainly unknown) set of education activities that take place in Nigeria.
108. For sector plan implementation in Nigeria, significantly more progress in planning is required. Until credible plans, with meaningful targets exist and are used at the state and national levels, sector plan implementation will remain a misnomer for the (mainly unknown) set of education activities that take place in Nigeria. What has been recorded in the annual education sector performance reviews (last carried out in 2017, for the 2015/16 school year) is not linked to the implementation of a unified sector strategy, but just the record of ad hoc activities carried out during the year of review. These activities may have been mandated in budgets, or in the yearly UBEC action plans – but there is no sense of a “plan being implemented” at the sector level – as such a sector-wide plan has not existed.
129 This section addresses evaluation questions 1.3 and 1.4, as well as (cross cutting) CEQs 3.1 and 3.2. 130 For sector plan implementation, the five underlying assumptions in the country level ToC were: (1) Relevant country-level actors have the technical capabilities, motivation (political will, incentives) and opportunity (funding, conducive environment) to implement all elements of the sector plan; (2) Available domestic and international funding is sufficient in quantity and adequate in quality to implement all elements of the sector plan; (3) Country-level development partners have the motivation and opportunity (e.g. directive from respective donor government) to align their own activities with the priorities of the sector plan and to work through the LEG as a consultative and advisory forum; (4) Country-level stakeholders take part in regular, evidence-based joint sector reviews and apply recommendations deriving from these reviews to enhance equitable and evidence-based sector plan implementation; and (5) The sector plan includes provisions for strengthening EMIS and LAS to produce timely, relevant and reliable data.

DRAFT REPORT (VX) – COUNTRY
52
© UNIVERSALIA
109. As reported after year one, stakeholders do not currently conceptualize progress at the sector level, and rather speak to project process. Education sector actors at the state and national levels often do not speak in terms of how projects relate to a broad sector plan and often are unsure of which plan is under discussion, given the plethora of plans in Nigeria. The same can be said for monitoring of sector progress – with monitoring done mostly against funding of projects – donor funding or UBE-IF funding. This means that the data available is usually on the delivery of activities and outputs against a block of funding – rather than against a sector-wide plan.
110. Given the lack of credible, prioritized and aligned plans, with meaningful targets available for the majority of the policy cycle, implementation data to monitor progress against plans is almost non-existent. Evidence available regarding progress made at the state towards the four priority objectives shared across the five ESPs is outlined in Annex P. The table highlights the lack of data on implementation. The data in this annex was reported in the year one report of this evaluation and is taken from the 2017 Annual Education Sector Performance Review of the five NIPEP states. The AESPRs reported data from the 2016 school year, compiled by a consultant in a process that was never repeated. This means that there has been no reporting of sector-wide implementation since the 2016/17 school year. Plans exist to hold annual monitoring events on progress against the new tranche of UNICEF supported plans at the state level, but what is not clear is how this will be reported upon and aligned to reporting on progress against the NESP. A key issue is that UBEC funding is not needs based. Accessing UBEC funding then becomes about fitting needs to available funding rather than the other way around. While there has been no in-depth study done on the effects of this, it is possible that this has an impact on the motivation and political will for needs-based planning, implementation and monitoring.
111. The scant data on implementation and the lack of reporting against meaningful strategies, targets or desired outcomes, highlights a failure to adopt an outcomes orientation, emphasized in this evaluation by stakeholders across the sector. Until political engagement with sector planning improves, monitoring and implementation are unlikely to drive Nigeria’s education system towards improvements and impact. As stated above, the Annexed table on implementation serves to indicate the lack of evidence on ESP implementation available at the state level and the reality that even when assessments such as the AESPRs are carried out, copies may be impossible to obtain, especially in the absence of dissemination activities. An important issue with AESPR reporting is the lack of feedback between targets and outputs. As there are no concrete targets set out in the ESPs used for the majority of this policy cycle, it is very difficult to assess the success of state governments in implementing their ESPs. What is clear is that there is a lack of coherency in actions taken. With no meaningful strategies set out in the MTSSs, there is no guiding direction for actions undertaken, with the AESPRs giving a summary of actions undertaken with no ability to explain why these actions were undertaken, and what the intention or desired outcomes were.
GPE contributions to sector plan implementation
Finding 13: GPE’s contribution to sector plan implementation is predominantly represented in the financial contribution of the ESPIG. However, the effectiveness of NIPEP outputs remains to be seen.
Table 24 - GPE contributions to sector plan implementation
SIGNIFICANT CONTRIBUTION TO SECTOR PLAN IMPLEMENTATION
None
MODERATE CONTRIBUTION TO SECTOR PLAN IMPLEMENTATION

DRAFT REPORT (VX) – COUNTRY
53
© UNIVERSALIA
GPE Funding of NIPEP. While the amount of funding contributed by NIPEP to the five focal states is ultimately small131 – it has been used reasonably effectively to support the scale up and continuation of other donor funded initiative (such as scholarships, training stipends and SBMC training).
LIMITED/NO CONTRIBUTION TO SECTOR PLAN IMPLEMENTATION
GPE support for sector dialogue and monitoring, contributing to better implementation. There has been no effective advocacy for better dialogue at the state level, and the advocacy for inclusive monitoring (through the AESPR) was short-lived and never institutionalized. This means that GPE advocacy did not lead to an improvement in mutual accountability that could improve sector plan implementation at the state level.
GPE support for sector planning. The deficiencies both in the design and in the usage of sector plans at the state level have meant that there has effectively been no implementation of a sector plan.
CSEF funding for CSACEFA. While CSACEFA do have a role in advocating for better education systems in Nigeria – their reach is too small to affect significant, system wide change in how government implements its education agendas. CSEF funding has been crucial in supporting the growth of CSACEFA, but ultimately not significant enough to make them a true force for pushing for better sector plan implementation.
112. GPE financial support in Nigeria is split between five states and is relatively small compared to the total education sector budget – as far as it is possible to determine state spending. The proportion of funds provided by the ESPIG over the four-year term, as a percentage of those provided through the federal UBE-IF grants, ranges from 4 percent in Sokoto state to 14 percent in Kano state. The figures available for total contribution of the ESPIG to sector plan implementation – as outlined in the ESPIG application are not based on any rigorous evidence – and should only be taken as being broadly indicative (this is explained in more detail in Section 3.4). These figures broadly show the ESPIG contribution to education funding as being low – but no precise figures are available. What can be said about ESPIG funding is that it is strategic – aiming not to begin new programs, but to support greater harmonization between other donor programs as well as scaling up and pushing for institutionalization of key initiatives (such as the girl child scholarships).
113. Technical support from the Secretariat and GPE global advocacy do not reach the state level, where responsibility for implementation resides. In addition, capacity building in implementation is limited because the planning and direction of NIPEP is located federally. While the ESPIG is directed to state level projects by NIPEP, the engagement of actors in the SMoEs is not evident. School grants are transferred directly to SBMCs, rather than through LGEAs or SMoEs, and while this arrangement may be effective for management purposes, it misses opportunities for capacity building in implementation at the state level. It is important to note that these issues are larger issues of governance in education in Nigeria, and not necessarily within the scope of NIPEP to remedy – however, this should be consciously recognized and accounted for in planning for the next ESPIG funded project.
114. At least one state government (Kano) has institutionalized the cash transfer to households to encourage the enrollment of female children, continuing on from NIPEP and according to informants training for SBMCs has also now become funded by state governments across NIPEP states. A variety of programs have undertaken cash transfers for girl children to attend school and supported training for SBMCs. While GPE may have contributed to these interventions being supported by state governments, it is not clear that this would not have happened without NIPEP.
131 the exact proportion is difficult to determine due to the issues noted as regards to state budgets. Those involved in the initial application process note that the figures used in the ESPIG application were largely a rough estimation of the proportion that would be contributed by GPE.

DRAFT REPORT (VX) – COUNTRY
54
© UNIVERSALIA
115. It is likely that the design of NIPEP has informed the design of larger programs in Nigeria, however NIPEP has also been informed by past projects (like ESSPIN). The new World Bank program-for-results BESDA, is budgeted at US$615 million and focuses on out-of-school children. It is viewed by stakeholders as a successor to NIPEP. According to stakeholders the program will be implemented in 13 states, including all five NIPEP states and six north-eastern states in Nigeria. Annex S provides an outline of NIPEP sub-components, interventions and progress against targets against MTSS focus areas.
116. GPE direct support for implementation is predominantly represented in the disbursement of grants and scholarships and the number of SBMC members who received training. However, the effectiveness of NIPEP outputs on impacting progress towards statewide improvement remains to be seen. The 2017 NIPEP mid-term review132 found that in schools that had received SIGs there was a perception among parents and community members that the quality of instruction, and of teaching and learning materials had improved. The MTR also reports that from “pre-primary to primary 2, enrollment has more than doubled and learning outcomes [have] improved”133 – though no evidence is provided as to how the improvement in learning outcomes was measured (or whether this was a perceived improvement). Component 1 of NIPEP aims for the “promotion of school effectiveness and improved learning outcomes” and its impact on learning outcomes (as measured through Hausa and English reading ability) will be measured at endline (now in 2020). It is difficult to find state level outcome data on NIPEP inputs as their coverage is not wide enough for changes to be reflected in ASC or MICS data – it is important that an evaluation is carried out to verify the actual impact of NIPEP outputs – beyond what is being tracked by the grant agent. This should also examine how NIPEP implementation impacted the sector, beyond the direct beneficiary LGAs.
117. Informants views on contribution consistently reported on inputs and activities, rather than outcomes and impact. Federal government stakeholders spoke of NIPEP as being a “game changer” and as having “a huge amount of impact”. Representatives from the Teacher Services Commission indicated that GPE support has facilitated the deployment of trained field officers, who measure teacher performance, and teacher training has informed teacher development policies. The January 2019 progress report indicates that as of December 2018, 73,808 teachers had been trained. However, there remains no data available on teacher performance or the impact that monitoring has had on teacher competency (or evidence that monitoring of teacher quality actually takes place). This reflects the broader sector in that the language of education sector progress does not reflect the logical chain of inputs, activities, outputs, outcomes and impact. Table 25 summarizes progress towards NIPEP core Project Development Objectives (PDOs) according to the implementation status and results reports (ISRs) for June 2018 and June 2019.
Table 25 - Summary of NIPEP progress against State MTSS Focus Areas
Sub-component Intervention 2018
(ISR 7)
2019
(ISR 9)
Target
(June
2020)
MTSS focus area
1. Promoting School Effectiveness and Improved Learning Outcomes
132 Not publicly available 133 NIPEP Mid-term review (2017) pp. 30

DRAFT REPORT (VX) – COUNTRY
55
© UNIVERSALIA
Sub-component Intervention 2018
(ISR 7)
2019
(ISR 9)
Target
(June
2020)
MTSS focus area
Sub-component 1(a) – school improvement grants to primary schools
Schools
receiving
school
improvement
grants
N/A134 15,221 16,220 Improve the quality and relevance
of basic, secondary and tertiary
education
Sub-component
1(b) – school
improvement
grants to pre-
primary schools
Schools
awarded
grants
5,581 7,516 11,000
Sub-component
1(c) – support
to teachers’
professional
development
NIPEP funds
for early
grade
teachers to
complete
training
73,808 73,808 96,954
2. Increasing Access to Basic Education for Out-of-School Girls
Sub-component
2(a) – girls’
access to
primary
education
Girls
receiving
scholarships
299,629 299,629 300,000 Expand basic education coverage,
especially for disadvantaged
groups
Sub-component
2(b) –
scholarships for
female teachers
Percentage of
NIPEP
supported
female
teachers
receiving NCE
scholarship135
38.54 38.54 50
Sub-component
2(c) –
community
mobilization
and SBMC
training
SBMC
members
given training
8,635 8,635 12,130 Strengthen government’s capacity
to manage, plan, and monitor the
delivery of education services
more effectively and efficiently
134 No Figure was given in ISR 7 for this indicator 135 The numerator is the number of teachers who receive the NIPEP scholarship who either continue with or complete the NCE course in the following year (year “n+1”). The denominator is the total number of female teachers in that year.

DRAFT REPORT (VX) – COUNTRY
56
© UNIVERSALIA
Sub-component Intervention 2018
(ISR 7)
2019
(ISR 9)
Target
(June
2020)
MTSS focus area
3. Strengthening Planning and Management Systems including Learning Assessment and Capacity
Development
Sub-
Component
3(a) –
management
and
implementation
support
State level
education
actors
engaged in
capacity
building
programs
555 (13
events)
- - Strengthen government’s capacity
to manage, plan, and monitor the
delivery of education services
more effectively and efficiently
Sub-component
3(b) –
monitoring,
evaluation and
learning
assessment
AESPRs
completed
EMISs in
place
Standardized
tests being
run
5
5
2
5136
5
2
5
5
2
Source: NIPEP ISR 7. (June. 2018) and ISR 9. (June 2019)137
118. Program implementation challenges have limited the potential impact of NIPEP, including the
disengagement of over 20,000 teachers in Kaduna State, challenges with cash transfers to financially
excluded beneficiaries, and limited progress on the introduction of standardized assessments. In
Kaduna State, an education system restructuring has led to the disengagement of over 20,000
teachers138 and an unknown number of local education monitoring staff. Consequently, some teachers
that have been part of NIPEP are no longer in the classroom and any expected impact of either the
training or higher qualification they have received through NIPEP on learning outcomes is lost. Another
consequence of the restructuring is a lack of continuity of staff responsible for implementing SIP at
the school level. In all the states, a common non-program challenge impeding program
implementation has been the lack of financial inclusion for some selected beneficiaries of the
conditional cash transfers. This led to unsuccessful transfer of funds to some selected beneficiaries of
grants and cash transfers in the first year of the program. Some of these issues have been resolved
through assistance with bank registration. While informants indicate data on learning outcomes will
136 It seems that this indicator only measures whether the states have completed the exercise once, not whether they regularly complete it – as none of the five NIPEP states have completed an AESPR since 2017. 137 Figures marked with * are taken from the 2017 NIPEP mid-term review, as no figures were given in the latest ISR. 138 This disengagement was premised on the fact that the teachers allegedly failed a competency assessment designed at Primary 2 level. Replacement teacher recruitment is currently ongoing on a rolling basis. https://www.bbc.co.uk/news/world-africa-41576869

DRAFT REPORT (VX) – COUNTRY
57
© UNIVERSALIA
be available soon, there remains little information on learning outcomes across the five NIPEP states
(and none reported thus far by NIPEP).
Additional factors beyond GPE support
119. The possibility to identify alternative explanations in Nigeria is limited. Firstly, because the
secondary evidence available does not adequately describe progress against objectives of the ESPs.
Secondly, because the secondary evidence does not cover and differentiate what support has been
provided by various stakeholders, in terms of support from other international DPs or funds disbursed
by the federal government. Significant improvements in planning and monitoring of implementation
across stakeholder groups would need to take place in order to (1) ascertain what activities took place
with the objective of making progress towards ESP goals (2) ascertain if these activities led to changes
progress towards ESP goals and (3) conduct a credible review of alternative explanations for any
observed changes. In the absence of this information, we include a summary of the most significant
non-ESPIG funded projects that address different aspects of the education sector in Error! Reference
source not found. and a summary of financial contributions by donors is shown in Table 22.
Unintended negative/unplanned positive effects of GPE support
120. No evidence of unintended consequences was identified in either the documents reviewed or
during interviews carried out during the first and second mission or subsequently.
Implications for GPE ToC and country level operational model
121. There are several implications for GPE ToC and country level operating model. Firstly, the extent to which the GPE model works without significant adaptation in a complex, multilayered country like Nigeria needs to be explored. Secondly, the balance of achieving a credible plan and maintaining government ownership at the planning stage has implications for other areas of the ToC. In the case of Nigeria, it has taken a full policy cycle for very modest planning improvements to take place. During that time, improvements in dialogue, monitoring, finance and implementation are unlikely to follow. This implies that change in one area of the ToC may take a significant number of years and points to the crucial role of the planning stage for the entire ToC causal chain. Lastly, as has been noted in other prospective evaluations, the role of political will is not currently explicitly tackled in the operational model, despite its centrality to progress.
122. Box 7 assesses the sector plan implementation assumptions in the country level ToC.

DRAFT REPORT (VX) – COUNTRY
58
© UNIVERSALIA
Box 7 - Testing Assumptions and Assessing Strength of Evidence
For sector plan implementation, the five underlying assumptions in the country level ToC were: (1) Relevant country-level actors have the technical capabilities, motivation (political will, incentives) and opportunity (funding, conducive environment) to implement all elements of the sector plan; (2) Available domestic and international funding is sufficient in quantity and adequate in quality to implement all elements of the sector plan; (3) Country-level development partners have the motivation and opportunity (e.g. directive from respective donor government) to align their own activities with the priorities of the sector plan and to work through the LEG as a consultative and advisory forum; (4) Country-level stakeholders take part in regular, evidence-based joint sector reviews and apply recommendations deriving from these reviews to enhance equitable and evidence-based sector plan implementation; and (5) The sector plan includes provisions for strengthening EMIS and LAS to produce timely, relevant and reliable data.
Given the complete lack of data available on sector plan implementation and financing flows Assumptions 1 and 2 are impossible to assess.
Assumption 3 does not hold. In the absence of a LEG, alignment across national, state, local and DP implementation does not take place. Until better plans are in place, they cannot be used as a yardstick for alignment.
Assumption 4 does not hold. Joint Sector Reviews have not taken place regularly and where they have taken place they have not been disseminated. The lack of appetite for sector implementation reviews points to the lack of coordination across stakeholder groups and a lack of motivation to produce evidence on sector progress and apply recommendations derived from the reviews.
Assumption 5 partly holds. What sector planning as is available outlines, in broad terms, the need to improve EMIS and LAS data.
The evidence for assessing changes in the education system in Nigeria is moderately strong. The lack of monitoring and funding flow data, the lack of knowledge on the content of the MTSSs by most stakeholder groups and the focus on project implementation provides a moderately strong evidence base that progress in plan implementation is lacking.

DRAFT REPORT (VX) – COUNTRY
59
© UNIVERSALIA
4 Progress towards a stronger education system139
4.1 Introduction
123. This section summarizes evaluation findings related to Key Question II from the evaluation matrix: “Has sector plan implementation contributed to making the overall education system in Nigeria more effective and efficient?”
124. Progress towards a stronger education system is measured by drawing on evidence of achievements in the three broad priority areas: access and equity, relevance and quality, and sector management. These align broadly to the priorities found across most sector planning in Nigeria (including the five NIPEP focal states). The analysis focuses on changes that go beyond specific activities or outputs, and, instead, constitute changes in the existence and functioning of relevant institutions (e.g., schools, ministry), as well as changes in relevant rules, norms and frameworks (e.g., standards, curricula, teaching and learning materials) that influence how actors in the education sector interact with each other.140
4.2 Progress towards a stronger education system
125. Table 26 provides an overview of system-level improvements observed in selected key aspects, whether the respective issue had been addressed in the ESP, and whether ESP implementation likely contributed to the observed changes.141
139 This section triangulates findings against RF indicators 11, 12, 13, 15 140 Please see definition of ‘education systems’ in the terminology table of this report. The GPE 2020 corporate results framework indicators defines six indicators for measuring system-level change: (a) increased public expenditure on education (RF10, covered in section 3.3 on education financing); (b) equitable allocation of teachers (RF11, covered here under Access and Equity); (c) improved ratios of pupils to trained teachers at the primary level (RF12, covered below under Quality and Relevance); (d) reduced student dropout and repetition rates (RF13, covered in section 5; (e) the proportion of key education indicators the country reports to UIS (RF14, covered here under Sector Management), and (f) the existence of a learning assessment system for basic education that meets quality standards (RF15, covered below under Quality and Relevance). 141 The fact that a certain issue had been addressed in the ESP does not guarantee that related changes occurred because of ESP implementation.

DRAFT REPORT (VX) – COUNTRY
60
© UNIVERSALIA
Table 26 - Assessment of the contribution of ESP implementation to system level change
PROGRESS/IMPROVEMENTS MADE DURING REVIEW
PERIOD142
HAD AREA BEEN ADDRESED IN THE
ESP143?
LIKELIHOOD OF ESP/MTSS
IMPLEMENTATION HAVING
CONTRIBUTED TO NOTED
IMPROVEMENTS
DEGREE TO WHICH UNDERLYING
ASSUMPTIONS HOLD 144
Access and Equity: Some promising developments in terms of providing a national home-grown school feeding program, and an increase in scholarship programs for girl children. Nothing systematic or nationwide.
While access and equity are broadly mentioned across ESPs/MTSSs – they lack concrete strategies to address shortcomings
Unlikely. Most changes piloted by DPs and scaled up by governments – outside of what is in the ESP/MTSS
1
2 3 4
Relevance and Quality: A number of developments have been seen in NIPEP states, including the institutionalization of scholarships for female teachers, and school improvement grants paid to SBMCs. Nothing systematic or nationwide.
Similarly, relevance and quality are mentioned in ESPs/MTSSs but without concrete strategies for improvement
Unlikely. Most changes piloted by DPs and scaled up by governments – outside of what is in the ESP/MTSS
STRENGTH OF THE CONFIRMING/REFUTING
EVIDENCE
Sector management. Sector management remains a key challenge in Nigeria – and while there have been positive developments in school/community level management, nothing significant is happening at the state or federal level to improve sector management.
There is little or no mention of meaningful improvements in ESPs/MTSSs
Unlikely. Most changes piloted by DPs and scaled up by governments – outside of what is in the ESP/MTSS
1 2 3 4
Progress towards a stronger education system during 2011 -2019 period
Access and Equity
142 This table only covers changes for which there was credible evidence. There are many aspects of system strengthening which are not covered here – which may imply that changes are not happening, or that there was no data available for the evaluation team to assess change. 143 This includes any relevant ESP or MTSS, whether from the previous tranche, or from those states which have new sector strategies (Kaduna, Kano, Katsina). 144 The four underlying assumptions for this contribution claim were 1) sector plan implementation leads to improvements of previous shortcomings in relation to sector management; (2) there is sufficient national capacity (technical capabilities, political will, resources) to analyze, report on and use available data and maintain EMIS and LAS; (3) ESP implementation leads to improvements of previous shortcomings in relation to learning and (4) it leads to improvements in relation to equity.

DRAFT REPORT (VX) – COUNTRY
61
© UNIVERSALIA
Finding 14: While UBEC funds supply side interventions for improving access to education, there have been relatively few interventions developed in recent years aimed at improving demand for education. Among these, Girl Child Scholarships and the Homegrown school feeding policy are the most promising if state governments can provide long term funding.
126. While there have been a range of programs implemented in NIPEP states, credible data on access and equity are not readily available. Education, equity and inclusion imply equal opportunities to access basic, upper secondary and tertiary education for both male and female children. Generally, in Nigeria, overall enrollment rates in basic and secondary education are low, especially in the northern regions. The Nigeria Digest of Education Statistics (2006–2010) revealed 54,434 public primary schools in Nigeria, with enrollment of 24.4 million, of which females accounted for 11.1 million (45.5 percent), indicating a GPI of 83.6. The 7,129 public Junior Secondary Schools (JSSs) recorded total enrollment of about 3.3 million (with about 45 percent females). The secondary net attendance rate was only 44 percent. More recent data reveal that the primary education GER was 87 percent in 2015, while the NER was 67 percent. Also, the GER and NER for JSS were 67 percent and 40 percent respectively.145
127. Several interventions have sought to address the issue of access and equity, but the extent to which they have been successful cannot be ascertained in the absence of data. Interventions include:
▪ Girl Child Scholarships. Enrollment of girl children is a key challenge in northern Nigeria, where economic issues, and social beliefs about the value of education have meant that female enrollment has fallen significantly behind male enrollment. Scholarships for girl children were first introduced in Katsina and Jigawa by the Girls Education Project, funded by DFID and implemented by UNICEF.146 Scholarships are unconditional and supported by community mobilization efforts led by SBMCs. While initially these scholarships were rolled out to 720 school communities in six LGAs – the program was expanded by NIPEP to over five states and an extra 300,000 students. Government has committed to taking over the program – including both scholarships and community mobilization activities, using the increased capacity of SBMCs. Currently, it is not clear how many scholarships are being provided from state funding. The efficacy of the program will be evaluated in the endline evaluation of NIPEP in 2020, but represents a positive direction, if scaled up, for government to support demand side system changes.
▪ The Home-Grown School Feeding program was started by a cross ministerial panel, with technical support from the Partnership for Child Development. This program provides a budget (from state treasuries) for schools to provide food for students, while also boosting the local economy by buying and cooking from local market sources. This is government funded and managed by the SBMC or PTA commission (depending on the school). Currently the HGSF does not produce much data on the coverage or impact of its programs, but it is an intervention that has been shown to improve access in many other contexts, and so should continue to be supported in Nigeria.147
145 Nigeria Education Data Survey 2015 National Population Commission (2015) 2015 Nigeria Education Data Survey (NEDS). 146 For full results of GEP3 including institutionalization and scale up see: https://assets.publishing.service.gov.uk/government/uploads/system/uploads/attachment_data/file/678838/Baseline-Evaluation-of-the-Girls-Education-Project-3-GEP_3-Nigeria-Synthesis-Report.pdf 147 https://docs.wfp.org/api/documents/WFP-0000102338/download/

DRAFT REPORT (VX) – COUNTRY
62
© UNIVERSALIA
Quality and Relevance
Finding 15: There is increasing recognition in Nigeria that teacher quality is substandard. While so far, the response to this has mostly been projectized and donor funded – some key interventions such as improving teacher training and the provision of training stipends for female teachers have been funded by government.
128. Interventions aimed at improving education quality include female teacher stipends, school improvement grants and improvements to teacher training and oversight. While state governments have been involved in institutionalizing and scaling up interventions – the key push for improving quality and relevance of education has come from donor funded projects. Although data on changes in the number and distribution of teachers in Nigeria is not available (no data was available to assess indicator 12 of the GPE results framework relating to PTTR in the last three years), this sub-section outlines a number of key activities implemented to improve the supply and quality of teachers.
▪ Female Teacher Stipends. Another intervention started by GEP, scaled up by NIPEP and institutionalized by state governments, this program provides allowances to female teachers to allow them to engage in extra training and gain new qualifications.148 This program was started by GEP as a way of increasing the relevance of education for girls. While there is evidence to show how many teachers received scholarships and how many completed training (both under GEP and NIPEP) it is not clear what impact this had on their competency as teachers, or to what extent this initiative has been taken on by state budgets. While there is a clear commitment by some state governments to support this program, there is no transparency in how this goal is being achieved.
▪ School Improvement Grants. NIPEP first used school improvement grants as a way to incentivize and empower School Based Management Committees to plan for and manage school budgets, including funds from the SIGs as well as other income streams generated at school level. These grants are given against the school improvement plans and paid directly into school accounts to be administered by the SBMCs who report back to NIPEP on the spending. Theoretically a portion of these grants is to be provided by the state government, but there is little evidence of this currently happening. However, the commitment by states to fund SBMCs to improve schools is a positive development, but one that needs to be followed by a practical commitment to provide funding.
▪ Improvements to teacher training/registration/oversight. Since the 2018 evaluation report was published there have been a number of dramatic developments in teacher management in the NIPEP states. Teacher competency has long been an issue in northern Nigeria – and in 2017 and 2018 two of the NIPEP states (Kaduna and Kano) tested teachers on basic fourth grade competencies and found huge gaps in ability. From this point the two states took different approaches: Kano provided part time training opportunities to allow teachers to complete their NCE’s,149 while Kaduna insisted on replacing the 20,000 teachers who had failed to meet proficiency levels.150 Kaduna’s approach was not been widely backed, though the Teacher Registration Council of Nigeria, when interviewed for this evaluation, saw the development as
148 Specifically, the program aimed to help female teachers with the National Certificate in Education to upgrade their qualifications to the revised NCE, which would help them specialize as primary or pre-primary teachers. 149 https://thenationonlineng.net/kano-retrains-30000-teachers/ 150 https://www.bbc.co.uk/news/world-africa-41576869

DRAFT REPORT (VX) – COUNTRY
63
© UNIVERSALIA
being positive in that it showed that teacher education was being taken seriously. Beyond the case of Kaduna – there are no systematic attempts to improve the training and recruitment of teachers.
129. Very few improvements to the curriculum have taken place over the past ten years due to funding constraints. The National Education Research Development Council (NERDC) were tasked with making improvements to the curriculum, and conducting research to ensure the relevance of the curriculum. Currently the NERDC is under-funded and has carried out very little curriculum development in the last number of years. With support from UNICEF they have developed an early-childhood education curriculum, which has been distributed to a number of schools. It seems that beyond this there are no significant changes to the national curriculum underway.
Sector Management
Finding 16: At the local level there are positive developments in how the education sector is managed – the strengthening of School Based Management Committees and School Support Officers have the potential to improve school/community level accountability. However, weak EMIS and LAS hinders the potential for these changes to improve State/Federal level management and the inefficiencies between UBEC and FMoE.
130. Starting with ESSPIN, School Based Management Committees (SBMC) have been established and have improved community-level accountability.151 The UBE act in 2004 laid the framework for establishing SBMC that would comprise of local community figures, including parents, religious leadership, traditional leadership and representatives of business and the private sector. At inception there was not much progress in establishing, training or funding these committees. The push was taken on by ESSPIN in 2008 in six states,152 with a common approach to recruitment and training being adopted together with an expanded mandate which included mobilizing funding from communities, as well as liaising with students, teachers and communities on the development of school improvement plans (also used to access funding from school improvement grants). Currently SBMC training is being supported by NIPEP in NIPEP states and by state government in other states. Coverage of SBMCs is high in NIPEP states, but there is no conclusive data available on what proportion of schools have SBMCs (either in NIPEP states or other states). NIPEP funding has also supported the development of Center Based Management Committees (CBMCs) in integrated Islamiyya and Quranic Schools (IQS).
131. Strengthening the function of school support officers has taken place to oversee the quality and professional development of teachers. School Support Officers (SSOs) provide a liaison between LGEAs and Schools to oversee the quality and professional development of teachers. This was a role that had existed in some LGEAs, but was grown and institutionalized by the DFID-funded teacher development program (TDP). This push was supported by state government in order to improve the training and accountability of teachers in northern states.153 UBEC funded and lead training of trainers to support continued professional development of SSOs across many LGEAs.
151 See ESSPIN’s evaluation of SBMC contributions to community engagement in education: http://www.esspin.org/esspin-documentation/experience-papers/SBMC-engaging-communities-in-school-improvement.pdf 152 Enugu, Lagos, Kwara, Jigawa, Kaduna and Kano. 153 https://www.tdpnigeria.org/new/wp-content/uploads/2019/08/Strengthening-systems.pdf

DRAFT REPORT (VX) – COUNTRY
64
© UNIVERSALIA
132. Each State Ministry of Education (SMoE) contains a monitoring and evaluation unit, which is the responsible body for collating EMIS data. However, Nigeria remains a weak environment for data use – does not reflect system soundness, data is of a low quality and is not utilized to make decisions. Nationally the GPE results framework (indicator 14) confirms that Nigeria has not reported any data on any of the 14 key UIS indicators in the last three years. Currently in the five NIPEP states an annual school census is produced which acts as the main embodiment of the EMIS. The Federal Ministry of Education administer the National Education Management Information System – which does not collect data directly from schools, but is rather mandated with building the capacity of state EMIS departments, and creating synthesis reports of state ASC data. Table 27 gives an overview assessment of the strength of the Nigerian EMIS system, broadly using the World Banks System Approach to Better Education Results (SABER) framework for analysis.
Table 27 - Assessment of Nigeria EMIS
Assessment using World Bank SABER154 criteria
Enabling Environment155:
Institutional complexity means that the development of an EMIS system is challenging. Each parastatal and government body (at both federal and state level) has an EMIS function (either in Planning, Research and Statistics; Quality Assurance; or Monitoring and Evaluation) – with no central coordinating body to govern data collection. This has often led to concurrent data being collected and published at state and federal level156 – sometimes with contradictory findings157.
System Soundness158:
There is no digitalization of data collection and analysis in Nigeria. Data is hand collated from schools to SMoEs for the annual school census. A lack of capacity and resources for data collection in school administrations and LGEA EMIS officers is widely cited as holding back EMIS effectiveness.
Quality data159: The data produced by schools for the annual school census (along with other sources of data) is fundamentally unreliable – producing contradictory or impossible figures (e.g. annual school census figures regularly report NER above 100 percent). It is not clear where these data quality issues stem from, whether from a lack of technical capacity, or attempts by schools to present more favorable statistics. For enrollment statistics the reporting of accurate data is made impossible by the systematic lack of population census data.
154 The assessment does not rigorously apply all SABER criteria, but uses them as a guide for assessing EMIS function. 155 Defined by: Legal frameworks, organizational structure and institutionalized processes, human resources, infrastructural capacity, budget and a data driven culture. 156 While State Ministries of Education hold primary data collection responsibility, each parastatal has its own EMIS unit, a structure that is similarly replicated at the Federal Level. While this should mean that SMoE and FMoE coordinate and provide direction for data collection, in practice it means that different bodies produce different data sets – with NEMIS producing its own data, SMoEs producing ASC data, and other UBEC/SUBEB sporadically producing data on basic education. In addition to this non-education bodies such as the National Bureau of Statistics produce statistical booklets which include education data. 157 Most notably, there have been a number of conflicts in figures produced by state governments and the National Bureau of Statistics – leading to retractions https://www.icirnigeria.org/nbs-pulls-down-misleading-education-statistics-after-fact-check-by-icir/ 158 Defined by: Data architecture, data coverage, data analytics, dynamic system, and serviceability. 159 Defined by: Methodological soundness, accuracy and reliability, integrity, and periodicity and timeliness.

DRAFT REPORT (VX) – COUNTRY
65
© UNIVERSALIA
Utilization in decision making160:
It was a core goal of EDOREN to improve the use of data in policymaking in education – and while incremental change was noted by EDOREN on how data is considered, challenges still remain. The lack of data credibility undermines efforts to encourage its use in policymaking, creating a cycle in which policymakers do not use data as it is considered unreliable, and data reliability is not improved as it is not being used centrally by policymakers.
Source: Authors’ Elaboration
133. There is currently no functional system-level learning assessment in place. The closest Nigeria has to a unified learning assessment is the National Assessment of Learning in Basic Education (NALABE). It is however widely agreed that NALABE is not reliable (in terms of consistency over time) or comprehensive enough (covering a wide enough range of demographic characteristics) to provide the necessary data for policymakers. In recent years there has been a push among government and DPs to establish a national learning assessment system to be administered to a nationally representative sample (by age group, geography and social indicators) by UBEC. Currently the World Bank and other donor partners are supporting the development of this system (see Paragraph 77 for more details on learning assessments).
134. Progress has been made in the registration of Islamiyya and Quranic Schools (IQS), but challenges remain. Northern Nigeria is home to a significant number of Islamiyya and Quranic Schools (IQS)which long pre-date the unified Nigerian state (with the pre-independence agglomeration of a number of political entities by the British colonial government). Attempts to integrate them into the main-stream education system have in the past been met with suspicion. Efforts are also hampered by the lack of data on the number, quality, enrollment and ownership of IQS. In the last five years, UNICEF through the DFID-funded Girls Education Project has been working with a range of government bodies including the MoE, SUBEB and IQS management board to support and integrate unregistered IQS. The challenges faced by this effort are a) collecting reliable data on IQS, and b) providing improved services to registered schools.161 In 2019, GEP3 is working in Kano state to integrate 412 unregistered IQS – out of a total of 12,500 recorded in a recent survey.
Did ESP implementation contribute to system -level changes?
Finding 17: While there are some small positive developments aimed at strengthening the education system (both at state and federal level) the lack of shared policy frameworks, both within and between states, means that positive developments tend to be limited in reach, and hard to scale and institutionalize.
135. During the review period none of the five focus states had a credible sector plan that acted as a core guiding document for policymaking or implementation. This means that looking to tie system level changes to sector plan implementation is not the best way of linking them to government impetus or direction. Instead Table 28 outlines key system level changes at state level,162 the degree
160 Defined by: openness to EMIS users, operational use, accessibility and effectiveness in disseminating findings and results 161 There are reports of a feeling among IQS owners that the expectations of registering with the state aren’t met, with no extra funding for new teachers or improved facilities/learning materials being provided by SUBEB. 162 As with the previous section, these changes are representative of what is happening in the North Western states – but do not imply that these changes are occurring in all states – or even in all Local Government

DRAFT REPORT (VX) – COUNTRY
66
© UNIVERSALIA
to which these changes are being spearheaded or supported by government, and the degree to which they are being supported by donors. This is intended to outline what changes are gathering momentum and how well donor driven programs are aligning with all forms of state planning/policy. The core finding is that while positive trends are emerging, either from government or donor programs, the gaps in planning and dialogue makes it difficult for these trends to be institutionalized, scaled up across states, or to receive reliable funding beyond donor funds.
Table 28 - Summary of system level changes, their links to education sector planning, and the level of donor support
SYSTEM-LEVEL
IMPROVEMENT
DEGREE OF COVERAGE
(LOCAL, STATE,
NATIONAL)
DEGREE OF
GOVERNMENT
SUPPORT163?
IMPROVEMENT RELIED
ON DONOR FUNDS?
ACCESS AND EQUITY
Girl Child Scholarships Only a feature of north
western states, having
been introduced by GEP,
and spread across the
northwest by NIPEP,
before being
institutionalized by state
governments.
While the program has
been led by donors, all
five NIPEP states have
begun to implement a
state funded girl child
education scholarship
program.
These scholarships were
originally funded by DFID
GEP (1, 2 & 3). Since
then they have been
taken on partially by
government and partially
by GPE NIPEP.
Home Grown School
Feeding
National program, but
limited number of
schools included.
Home Grown School
Feeding is entirely
funded by UBEC, and
implemented by school-
based management
committees and
SUBEBs164
While HGSF received
some technical support
from the Partnership for
Child Development (PCD)
– it is a primarily
government led
initiative.
Education Areas (LGEAs) within each state. Instead they should be seen as prototypical of the kinds of changes which are gaining a foothold in these states – and which, through more cohesive planning, dialogue and financing could be scaled up across the states. 163 For this column – green is given if the action is at least jointly co-implemented by government, or is an initiative that was pioneered by government and later taken up by donors. Amber implies that the action is largely implemented without government involvement, but is in some way supported by government (i.e. implemented by government). Red implies that there is no government ownership/involvement of activity. 164 See https://www.nhgsfp.gov.ng/about-us/ for more details. While the home grown school feeding program received technical support from the Partnership for Child Development – it is a government founded and run program.

DRAFT REPORT (VX) – COUNTRY
67
© UNIVERSALIA
SYSTEM-LEVEL
IMPROVEMENT
DEGREE OF COVERAGE
(LOCAL, STATE,
NATIONAL)
DEGREE OF
GOVERNMENT
SUPPORT163?
IMPROVEMENT RELIED
ON DONOR FUNDS?
QUALITY AND RELEVANCE
Training Stipends for
Female Teachers
Present in all five NIPEP
states, but no national
program for supporting
female teachers.
Numbers per state
limited.
Unclear whether states
are supporting female
teacher scholarships
This program is currently
supported financially by
GPE NIPEP.
Improvements to
teacher training,
recruitment and
registration.
There are numerous
initiatives aimed at
improving teacher
quality, recruitment and
registration across
Nigeria, and particularly
in the northern states,
where teacher quality is
much lower than other
regions.
Political will in certain
states has been key in
tackling issues of teacher
quality165 - supported by
the Teacher Registration
Council of Nigeria (TRCN)
at the federal level.
Teacher training and
supervision receives key
support from DFID’s TDP
in Kano, Kaduna and
Jigawa, while USAID’s
NEI+ is providing support
for improving teacher
quality in Sokoto and
Bauchi.
Improvements to the
curriculum
Improvements to the
curriculum are taking
place at the federal level,
but are held back by the
lack of capacity and
resourcing, meaning
they are not having a
widespread impact.
The National Education
Research and
Development Council
(NERDC) is responsible
for curriculum reform –
but is severely limited by
funding and capacity
gaps.
The NERDC has received
support (financial and
technical) from UNICEF
to development a
number of new curricula
on specific issues (ECD
and HIV/AIDS among
others)
School improvement
grants
This is only a feature of
north-western states,
being introduced by
ESSPIN and scaled up by
NIPEP and state
governments
It is reported that states
will be taking over
responsibility for school
improvement grants –
but in interviews with
SBMC chairs it seems
that this is not
happening
SIGs were pioneered by
DFID’s ESSPIN, and
scaled up across five
states by GPE NIPEP.
SECTOR MANAGEMENT
165 This is particularly notable in Kaduna and Kano, where the governor requested re-testing of teachers, with the aim of replacing those who didn’t meet minimum standards. In Kaduna this led to 20,000 teachers being replaced, while in Kano teachers were given support to re-qualify through part time study.

DRAFT REPORT (VX) – COUNTRY
68
© UNIVERSALIA
SYSTEM-LEVEL
IMPROVEMENT
DEGREE OF COVERAGE
(LOCAL, STATE,
NATIONAL)
DEGREE OF
GOVERNMENT
SUPPORT163?
IMPROVEMENT RELIED
ON DONOR FUNDS?
Training and support
for SBMCS
SBMCs were legislated
for in the UBE act in
2004 – before being first
implemented by ESSPIN
in 2007. As a federally
mandated provision,
they are nationally
supported by UBEC.
The FMoE originally
legislated for the
creation of SBMCs, and
has taken on funding
them in a number of
states, but not
universally.
After the original
legislation, the
framework for
establishing and
strengthening SBMCs
was created through
DFID’s ESSPIN.
Strengthening of role of
School Support Officers
The role of the School
Support Officer is
controlled by UBEC and
therefore is,
theoretically, a national
provision.
While it is not clear what
financial support states
will provide for SSOs –
the system is being
widely supported by
state governments.
Support for
strengthening the role of
the SSOs has been
heavily reliant on
technical and financial
support from DFID’s
TDP.
Integration of
unregistered IQS
While registration of IQS
is a primary target of
certain states (though
not always mentioned
specifically in planning
documents) – at this
stage the number of IQS,
and the difficulties in
registering them means
it is unlikely that
significant progress will
be made in the coming
cycle.
The state IQS boards are
the key agency involved
in registering schools –
however support is
limited by the ability of
states to provide IQS
with improved facilities,
teachers and learning
materials – limiting the
ability of states to gather
momentum on
registration.
Registration of IQS is
being funded and
supported by DFID’s
GEP3 in its focal states.
Source: Authors’ Elaboration from various sources (documentary and interview)
136. In the absence of a common sector plan, either at state level or federal level – it is enormously difficult to create system level changes that become institutionalized and reliable. Decades of disjointed donor programming has led to a system that is built around short-term interventions. When speaking to stakeholders, it is a commonly shared narrative that system changes come and go – arriving with new projects and mostly disappearing when funding runs out and the focus shifts to something else. This is compounded by the institutional complexity in the education sector in Nigeria. The diffusion of responsibility and accountability across levels of the system (local, state, federal) and between institution (MoE and parastatals) means that it is difficult for emergent trends to spread between states, or improvements in capacity or ways of working to move between implementing bodies. This has created a paradigm in which it is an enormous challenge for policymakers to enact meaningful system wide improvements, either at state or federal level.

DRAFT REPORT (VX) – COUNTRY
69
© UNIVERSALIA
Implications for GPE ToC and country -level operational model
137. The absence of meaningful planning means that it is difficult to verify this link in the GPE ToC in Nigeria. Nigeria education highlights the importance of planning and mutual accountability. There are several system changes that probably have a positive impact on a small scale (such as the strengthening of the SBMCs or the registration of IQS), which would have the potential for much greater success if they could be linked to a detailed sector plan against which their implementation could be monitored. This would make change much less reliant on individual political will, and the drive and support of donors. Similarly, consolidating disparate system changes into cohesive planning would make the transfer of knowledge on best practice between states. The same could be said about having inclusive and transparent monitoring structures (like a JSR).
138. In the next cycle it will be interesting to see what impact the strengthening of the MSP will have, alongside the development of an Education Sector Analysis. While this has the potential to galvanize and harmonize agendas between states – in the absence of robust planning, dialogue and monitoring mechanisms at the state level – there is a danger that the federal plan will have little impact at the state level, and more importantly that the Education Sector Analysis will not be able to gather detailed enough data to fully support better planning and system strengthening.
139. Finally, GPE succeeded, in the five NIPEP states, in consolidating different donor programs. By focusing on continuing or scaling previous donor programs (e.g. support from SBMCs taken over from ESSPIN and TDP, girl child scholarships taken over from GEP) it has achieved a degree of success in widening these programs to cover more states, as well as pushing the idea of more joined up thinking between donors, and between states and donors.
140. Box 8 assesses the assumptions that underpin systems in the ToC.
Box 8 - Testing Assumptions and Assessing Strength of Evidence
The four underlying assumptions for this contribution claim were 1) sector plan implementation leads to improvements of previous shortcomings in relation to sector management; (2) there is sufficient national capacity (technical capabilities, political will, resources) to analyze, report on and use available data and maintain EMIS and LAS; (3) ESP implementation leads to improvements of previous shortcomings in relation to learning and (4) it leads to improvements in relation to equity.
Assumption 1 does not hold. There is no evidence that in Nigeria the use of state level sector plans has led to any concrete improvements in sector management.
Assumption 2 does not hold. While the resources and technical capabilities exist to create and analyze data, the political will and systematic coherency necessary to manage EMIS and LAS are not currently visible.
Assumption 3 does not hold. There is currently no evidence to say that the use of an ESP improves systematic shortcomings related to learning.
Assumption 4 does not hold. There is currently no evidence to say that the use of an ESP improves systematic shortcomings related to access and equity.
The evidence for assessing changes in the education system in Nigeria is weak. The data presented in this section is synthesized from a combination of project reports, interviews with stakeholders and some limited government documentation – it does not present a full or accurate picture of how the system is changing in Nigeria. To rigorously assess systematic change in the five states covered by NIPEP – far more data is needed, which currently does not exist.

DRAFT REPORT (VX) – COUNTRY
70
© UNIVERSALIA
5 Progress towards stronger learning outcomes and equity166
5.1 Introduction
52. This section provides a brief overview of medium-term trends in relation to basic education learning outcomes, equity, gender equality and inclusion that occurred in Nigeria up to and during the review period (Key Evaluation Question III from the evaluation matrix: “Have improvements at education system level contributed to progress towards impact?”) Key sub-questions are:
▪ During the 2012-2018 period under review, what changes have occurred in relation to (a) learning outcomes in basic education, (b) equity, gender equality and inclusion in education? (CEQ 6)
▪ Is there evidence to link changes in learning outcomes, equity, gender equality, and inclusion to system-level changes identified under CEQ 4? (CEQ 6)
▪ What other factors can explain changes in learning outcomes, equity, etc.? (CEQ 6)
▪ What are implications of evaluation findings for GPE support to Nigeria? (KEQ IV)
53. CLEs conducted during FY 2018 showed that trying to establish verifiable links between specific system-level improvements during the review period on the one side and impact-level trends on the other side is not feasible given (i) the relatively short timeframe explored during CLEs and (ii) the time lag that typically exists between specific innovations and their reflection in impact-level trends. As such, section 5 illustrates trends in learning outcomes, equity, gender equality and inclusion, but does not attempt to directly link them to changes observed during the review period
166 This section triangulates findings against RF indicators 1 - 9

DRAFT REPORT (VX) – COUNTRY
71
© UNIVERSALIA
5.2 Progress towards impact-level outcomes
Table 29 - Assessment of contribution of system level changes to improved student outcomes
IMPROVEMENTS MADE DURING THE 2012-2019 REVIEW PERIOD?
LIKELIHOOD THAT TRENDS WERE INFLUENCED BY
SYSTEM-LEVEL CHANGES DURING REVIEW PERIOD
DEGREE TO WHICH UNDERLYING
ASSUMPTIONS LIKELY HELD TRUE167
Equity, Gender Equality and Inclusion: Weak
There are some improvements visible both at national and state level – but overall the picture is one of stagnation or deterioration – with both enrollment and completion rates for primary school falling in recent years. It is notable that greater improvements were seen at state level (in the five NIPEP states) than at national level.
Unknown 1 2
Learning: weak.
There is no learning assessment in Nigeria that can give a time series view of learning outcomes. What data as is available from individual projects shows stagnation or decline in learning outcomes.
Unknown
Trends in learning outcomes, equity, gender equality and inclusion in the education sector in Nigeria from 2012 to 2019
Finding 18: New data from the UNICEF Multiple Indicator Cluster Survey (MICS) gives an insight into changes in student outcomes. In access and equity, the story nationally is not good, with deterioration visible in many key indicators. The picture in the NIPEP states is also not good, but is marginally better, with improvements visible in gender equity of attendance rates, and in engagement in Early Childhood Education (ECE).
94. The analysis of student outcomes in Nigeria is challenging as data available from the annual school census at state level is unreliable and inconsistent in the indicators reported on across states. Most crucially it is inaccurate for enrollment figures and numbers of out-of-school children. This leaves a large range of project level studies which look at changes in outcomes over project lifespans for limited populations. While these are useful snapshots, they do not provide a holistic picture of education for whole states.
95. A valuable development since the publication of the first annual report of this prospective evaluation has been the publication of the full results of UNICEF’s 2017 multiple indicator cluster survey (MICS) for Nigeria in late 2018. This features state level data on fixed indicators and was last carried out in 2011. While this only leaves two time points, it is the most reliable data available for
167 The underlying assumptions for this contribution claim are (1) changes in the education system positively affect learning outcomes and equity, and (2) country-produced data on equity, efficiency and learning allow measuring/tracking these changes.

DRAFT REPORT (VX) – COUNTRY
72
© UNIVERSALIA
state level, student outcome indicators. Table 30 outlines the results of MICS (2011 and 2017) at the national level and for the five NIPEP states.168
Table 30 - Summary of changes in student outcome indicators at national and in NIPEP states (2011-2017)
NATIONAL LEVEL NIPEP STATES169
INDICATORS THAT IMPROVED DURING THE 2011-2017 PERIOD170
Gender Parity Index (GPI) for Gross Enrollment Rates (GER):171 GPI for both primary and secondary GER improved between 2009 and 2016, reaching .90 for secondary GER and .94 for primary GER.
Young Female (15-24) Literacy: In contrast to the national figures, young female literacy in the NIPEP states increased by an average of 3.12 percentage points. While this is lower than the 6.2 percentage point increase for the north-western region, excluding Sokoto as an outlier (with a decrease of 8.2 percent) means the other four states are approximately in line with the regional average.
Engagement in Early Childhood Education: Engagement in ECE increased by an average of 5.38 percentage points, from an average baseline of 29.68 percent in 2011.
GPI for Primary Net Attendance Ratio (NAR): Nationally GPI for NAR increased marginally from .94 to .95. NIPEP states increased by an average of .076 with four out of five states moving into the GPE RF recommended range (.88-1.11). This is compared to the north-west region in general where GPI decreased from .88-.8.
INDICATORS THAT REMAINED STABLE DURING THE 2011-2017 PERIOD172
Primary survival Rates: Nationally survival rates decreased slightly from 97.4 to 95.5 between 2011 and 2017.
Primary Completion Rates: There is significant variation between NIPEP states in PCR – with Kaduna increasing by 24 percentage points (from 55 to 79), and Sokoto decreasing by 54.5 (from 73.2 to 18.7) percentage points between 2011
168 Where other data was available (e.g. from UIS or other reliable sources) this data has been added to supplement or triangulate the MICS data. Where MICs data contradicts other sources, the other source is included as a footnote, with explanation. While a range of household surveys in Nigeria cover education as a topic, there are issues of quality and comparability of indicators, meaning that for the sake of consistency over time, where possible we have used MICs data only. For an overview on the quality and comparability of household survey data on education see https://edorennigeria.files.wordpress.com/2014/07/edoren-2014-education-data-in-hh-survey-reports.pdf 169 The broad categorization represents the general trend across the five states. Where one or two states have moved in a different direction to the others this is noted in the indicator explanation. Averages are not weighted for population, and represent a simple averaging of state level figures. 170 Unless otherwise noted the comparative figures shown are for 2011 and 2017 171 UIS data 172 For this table, marginal increases or fluctuating trends are categorised as remaining stable. Depending on the indicator and its absolute value this may be a positive or negative thing. i.e. if NER is at 100 percent then stability is valuable, whereas if it is at 50 percent it is stagnation.

DRAFT REPORT (VX) – COUNTRY
73
© UNIVERSALIA
GPI for Primary Net Attendance Ratio (NAR): Nationally GPI for NER increased marginally from .94 to .95.
and 2017 – this possibly points to sampling differences (perhaps caused by internal migration), or possible measurement errors173
INDICATORS THAT DETERIORATED DURING THE 2012-2018 PERIOD
Gross Enrollment Rates: GER for primary education rose from 85.35 to 94.07 percent in 2013 before falling to 84.7 percent in 2016. For secondary education GER peaked at 56.18 percent in 2013 before falling to 41.98 percent in 2016.
Primary Completion Rates: Nationally PCR has fallen from 85.6 to 63.1 percent between 2011 and 2017.
Transition Rates (Primary to Lower Secondary): A drop from 74 to 48.9 percent between 2011 and 2017.
Young Female (15-24) Literacy: Data for young male literacy is only available for 2017 – but female literacy has decreased from 65.6 percent to 59.3 percent between 2011 and 2017.
Engagement in Early Childhood Education: MICS showed that the proportion of children engaged in ECE fell from 42.65 to 35.55 between 2011 and 2017.
Transition Rates (Primary to Lower Secondary): Data shows an average 22.46 percentage point decrease in transition rates from 56 to 33 percent across the five NIPEP states between 2011 and 2017 (compared to a 25-point decrease in the North-West Region where figures fell from 61 to 36 percent).
Survival Rates: While primary survival rates nationally remained relatively stable. The NIPEP states generally fared worse than the national average (with all states bar Katsina falling between 3 and 6 percent between 2011 and 2017, and Katsina decreasing by 15.4 percent from 99 to 84 percent), but largely better than the North Western average decline of 7.2 percent (bar Katsina). Data are available for secondary survival rates.
INDICATORS FOR WHICH NO CONCLUSIVE/RELIABLE DATA IS AVAILABLE
Changes in OOS Rates NER Secondary Completion Rates Enrollment in Private/IQS
Changes in OOS Rates GER/NER Secondary Completion Rates Enrollment in Private/IQS
96. What can be seen from Table 30 – and taking into account the limited range of sources and potential unreliability in the data – is that the NIPEP states have fared in general better than the country as a whole with several key indicators improving at state level but not nationally. Overall improvements are not significant, but any improvements should be seen as a positive development.174 It will be important to verify these findings by triangulating them against the education sector analysis currently underway.
97. Data gaps: Data from MICS on OOS children is only available for 2017, impeding the assessment of how these rates have changed nationally or in NIPEP states over the review period. Rates nationally and in the five NIPEP states are high: 25.8 percent of school aged children reported not being in school, (34.8 percent in the NIPEP states, with the figure for Jigawa being reported at 44.7 percent). Data is also missing for enrollment in unregistered schools. MICS data is survey based so the attendance rates reported implicitly include unregistered schools (private or IQS), which ASC data would not include. It is therefore impossible to distinguish specific enrollment in unregistered schools.
173 It is hard to rationalise a 54.5 pp decrease in completion rates in a state surrounded by states which saw marginal increases – such a decrease can only be caused by a significant disruption to the education system – or an error in measurement. 174 It is also important to recognise that on many of the indicators in which NIPEP states contradicted national trends, the endline figures are largely still lower than the national average.

DRAFT REPORT (VX) – COUNTRY
74
© UNIVERSALIA
98. Gender Equity in Education: GPIs for Gross Enrollment Ratio and Net Attendance Ratio are within an acceptable range – while girls are at a disadvantage in completion and literacy. Where time
sequence data is available there are no significant trends visible (Figure 5).
Figure 5 - GPI on National Key Performance Indicators (MICS 2017)175
Finding 19: While there is no state or national level data on learning outcomes, project level data available shows that learning outcomes for children in school are low. In project samples learning outcomes have remained low but stable, but this is likely due to the interventions – outcomes for non-intervention samples have likely fallen in recent years.
99. As detailed earlier there is currently no nationally representative learning assessment in Nigeria. The closest is the National Assessment of Learning in Basic Education – administered by UBEC. The most recent NALABE was carried about in 2017, but the results have not yet been published. Beyond NALABE more accurate but less representative learning outcomes data can be taken from project assessments carried out by DFID and USAID. Details of the most recent/relevant project learning assessments, as well as the results of the most recent NALABE (2011) are shown in Table 31.
Table 31 - Collation of Results of Project Level Learning Assessments
Assessment Description
Scope (and timeframe) Outcomes176
DFID - ESSPIN: Composite study of reading levels in 6 states
Jigawa, Kaduna, Kano, Kwara, Enugu and Lagos. Project sample of schools involved in the ESSPIN
Across states the share of students reading at grade level fell from 25 percent to 10.8 percent in grade two and 19 to 12.2 percent in grade four (between 2012 and 2016).
175 Here red denotes GPI outside of the .88 – 1.11 range, while green values are within the range and yellow denotes borderline values. 176 For this column, green implies a marked increase over time in learning outcomes, amber implies no change, and red implies deterioration. Grey means that the assessment doesn’t provide enough data to look at trends in learning outcomes.

DRAFT REPORT (VX) – COUNTRY
75
© UNIVERSALIA
Assessment Description
Scope (and timeframe) Outcomes176
school improvement programs (2012-2016)
For mathematics, similar figures were seen with those numerate to grade level falling from 25.2 to 12.3 percent in grade two but rising from 6.7 to 8.1 percent at grade 4 (again between 2012 and 2016).
USAID - NEI+: Results of Early Grade Reading Activities177
Sokoto and Bauchi. Sample of students taking part in the NEI+ EGRA activities (2014-2015)
While the percentage of zero scores in reading at grade two decreased between 2014 and 2015 for intervention groups (from 95 percent to 68 percent) they increased for control groups (from 90 percent to 96 percent). These findings echo the ESSPIN findings – and as the report notes, even the post intervention scores are still unacceptably high.
UBEC – NALABE: UBEC reading assessment (carried out again in 2017, but no data published yet).
National (2011)
Reading: The national average score was 55.25 percent in 2011. Across grades the NIPEP states performed 5.3 percent below the national average.178 Mathematics: The national average score was 48.85 for mathematics. While NIPEP state scores were below the national average across primary grades, they were slightly higher than the national average for JS1 mathematics.
DFID – EDOREN: learning in public private and private schools in Lagos
Lagos While the study does not provide information on change over time, the study found that in Lagos private school students perform better in literacy than public-school students and public-school students perform better in numeracy than their privates school peers. Evidence suggests this is predominantly due to peer effects and the dominance of English language L1 students in private schools.179
Source: Authors’ elaboration from various project documents (see footnotes for individual sources).
100. These limited results show that there is a crisis in learning in northern Nigeria with no sign of improvements. More disaggregated data would help further define what individual or social characteristics shape learning, but this data is not readily available. The introduction of a robust national learning assessment collected with the background and school level characteristics of learners would provide this data and allow for informed decision making around improving quality of education and learning outcomes. Project level assessments show important effects of socio-economic variable (wealth, parental education etc.) – and a yearly national assessment would allow for these effects to be nationally measured and used for policymaking.
177 See https://pdf.usaid.gov/pdf_docs/PA00KVM1.pdf for full results of EGRA in Sokoto and Bauchi. 178 Tests are not standardized so it is not possible to speak about the absolute performance nationally, or to make time series comparison with other NALABE tests. Full results available at https://ubeconline.com/Pre/2011%20National%20Assessment%20of%20Learning%20Achievement%20in%20Basic%20Education%20(NALABE)%20Report.pdf 179 Forthcoming. Outhred, R and Lipcan, A. Do private schools produce superior English language outcomes? Examining the public/private school debate in Lagos, Nigeria and EDOREN P4 study. Outhred, R, Lipcan A and Bahari, S. 2016. EDOREN P4 public/private school study.

DRAFT REPORT (VX) – COUNTRY
76
© UNIVERSALIA
Is there evidence to link changes in learning outcomes, equity, gender equality and inclusion to system -level changes identified? What other factors can explain observed changes (or lack thereof)?
Finding 20: The link between ESP implementation, systematic change and student outcome indicators cannot be definitely established. Data on outcome indicators is neither consistent nor comprehensive enough and reporting on system level changes is not detailed enough for concrete conclusions about the causality of changes to be drawn.
101. Considering the lack of comprehensive data on where and to what extent the systematic changes outlined in the previous section have been implemented robust assertions about links between system level change and student outcomes are not possible. Table 32 gives an indication of any plausible links. The conclusion is that in a system as complex as Nigeria, causal links are naturally more difficult to attribute at the student level, and this is compounded by the fractured nature of implementation (which would require equally granular student data), and the lack of reliable data either on system level changes or student outcomes. Last, in complex systems, change is a more incremental process, and results may take longer to become apparent.
Table 32 - Plausible links between system level changes and student outcomes
Observed Impact Level Changes Plausible links to System Level Changes
Improvement in gender equity in NIPEP states
This is potentially linked to the female scholarship and community mobilization programs that have been implemented across the NIPEP states (with funding from NIPEP, GEP and state budgets). As these are not a feature nationally, this would explain the differential increases between NIPEP states and the country as a whole.
Increase in ECE engagement in NIPEP states
The introduction of school improvement plans, and the funding of school improvement grants has led to an increase in funding for ECD centers – with many schools using SIGs to pay for improved facilities for early learners. While it is difficult to discern whether this is a systematic change or the results of project funding – it could potentially be linked to the improvements in ECE engagement seen in MICS data.
Improvements in Young Female Literacy in NIPEP States
As with improvements in gender equity, improvements in literacy, and specifically girls’ literacy could plausibly be attributed to the work done by states and DPs to support scholarships for female students, as well as training allowances for female teachers. It may also be contributed to by donor lead reading interventions (such as USAID’s activities in Sokoto).
Implications for GPE ToC and country -level operational model
102. The Nigeria case highlights the difficulty of reforming decision making when there is very little data available. The reasoning given by DPs for conducting the national education sector analysis is that it will help states benchmark against each other, encouraging “friendly competition”. The lack of clear time-series data on access, equity and learning makes it difficult to even start conversations about systematic change or policy reform. While the education sector analysis will undoubtedly be useful, focus should be placed on support for producing regular, reliable impact level data for policymakers to use.

DRAFT REPORT (VX) – COUNTRY
77
© UNIVERSALIA
103. Box 9 assesses the assumptions that underpin impact in the country-level ToC.
Box 9 - Testing Assumptions and Assessing Strength of Evidence
The underlying assumptions for this contribution claim are (1) changes in the education system positively affect learning outcomes and equity, and (2) country-produced data on equity, efficiency and learning allow measuring/tracking these changes.
Assumption 1 partially holds. While there is some limited evidence that changes at the system level have impacted access indicators – the evidence is not conclusive, and the range of confounding factors make it difficult to say that this assumption fully holds.
Assumption 2 does not hold. There is a pervasive issue with a lack of credible data on student outcomes – making it difficult to track any changes.
The evidence for assessing changes in the education system in Nigeria is moderate. The release of 2017 MICS data has made the assessment of this contribution claim possible, where it was not in the 2018 evaluation report. However, considering MICS data is not published regularly, it does not remedy the consistent lack of data on student outcomes in Nigeria.

DRAFT REPORT (VX) – COUNTRY
78
© UNIVERSALIA
6 Changes over time and key influencing factors
6.1 Introduction
141. This prospective evaluation is a culmination of a baseline report, a first annual report and this final second annual report which is summative in nature, reporting on the efficacy of GPE support to Nigeria during the full evaluation period. However, comparisons between findings at the baseline report stage of the evaluation and the final findings (second annual report) provide insight into the key influencing factors across the ToC.
142. This section reflects on the assessment of the contribution claims and assumptions that emerged at the conclusion of Year 1 of the evaluation and Year 2 and highlights any lessons learnt. This section of the report presents any insights that emerge from comparing the plausibility of GPE contribution claims over time. Table 33 - Assessment of the plausibility of each Contribution Claim at Year 1 and Endline
Contribution Claim Assessment at Year 1
Endline
Claim A: “GPE (financial and non-financial) support and influence contribute to the development of government-owned, credible and evidence-based sector plans focused on equity, efficiency and learning.”
Not Plausible Partly Plausible
Claim B: “GPE (financial and non-financial) support for inclusive sector planning and joint monitoring contribute to mutual accountability for education sector progress.”
Not Plausible Not Plausible
Claim C: “GPE advocacy and funding requirements contribute to more and better financing for education in the country.”
Not Plausible Partly plausible in terms of the harmonization and alignment of intl. sector financing
Claim D: “GPE (financial and non-financial) support and influence contribute to the effective and efficient implementation of sector plans.”
Possibly plausible but more evidence required.
Not plausible.
Claim E: “The implementation of realistic evidence-based sector plans contributes to positive changes at the level of the overall education system.”
Not plausible Not plausible
Claim F: “Education system-level improvements result in improved learning outcomes and in improved equity, gender equality and inclusion in education.”
Possibly plausible but more evidence required.
Not Plausible
143. The major change between the assessment of plausibility between Year 1 and Year 2 for this report is in the area of sector planning. As has been discussed in detail within the report, the decision by the Secretariat to endorse plans that were not credible was questioned in the first annual report. Over the policy cycle, modest improvements in planning have taken place, predominantly due to the work of UNICEF and DFID, who have provided support to planning at the state level. We find that the decision to fund the plans catalyzed a focus on planning in Nigeria. Improvements are small and have taken a long time to occur, but were unlikely to have taken place without the partnership. In this sense the assessment is now partly plausible, in light of the need for these modest improvements to be sustained and built upon to have a meaningful impact on strengthening state level systems.

DRAFT REPORT (VX) – COUNTRY
79
© UNIVERSALIA
Implications for GPE’s ToC and country -level operational model
144. Being the final report in this evaluation, it is important to reflect on how the assessment of contribution claims and their underlying assumptions allows for assessment of the appropriateness of the GPE theory of change and operational model. As can be seen in Table 34 only 4 of 23 assumptions were found to be plausible in Nigeria. Two of these assumptions (A1 and A4) were associated with GPE support to sector planning – the one contribution claim which was found to be plausible at this stage. The fact that so few of the assumptions underlying the theory of change in Nigeria were found to be plausible makes the question of the value of GPE’s model in the Nigerian context unavoidable. Considering that the fundamental pre-requisites for success (as represented by the 23 assumptions) are not present, there is a clear imperative to look outside the standard theory of change and operating model, and to consider an approach more in line with the needs of a large, complex federal state such as Nigeria. This is further compounded by the almost complete lack of reliable data in Nigeria.
Table 34 - Summary of Assessment of Assumptions
Assumption
A1 Country level stakeholders have the capabilities to jointly improve sector analysis and planning
A2 Stakeholders have the opportunities (resources, time, conducive environment) to do so
A3 Stakeholders have the motivation (incentives) to do so
A4 GPE has sufficient leverage within the country to influence sector planning
A5 EMIS and LASs produce relevant and reliable data to inform sector planning
B1 GPE has sufficient leverage at global and country levels to influence LEG existence and functioning
B2 Country level stakeholders have the capabilities to work together to solve education sector issues
B3 Stakeholders have the opportunities (resources, time, conducive environment) to do so
B4 Stakeholders have the motivation (incentives) to do so.
C1 GPE has sufficient leverage to influence the amount and quality of domestic education sector financing
C2 External (contextual) factors permit national and international stakeholders to increase/improve the quality of
sector financing
C3 Stakeholders have the opportunities (resources, time, conducive environment) to do so
D1 Relevant country-level actors have the technical capabilities, motivation (political will, incentives) and
opportunity (funding, conducive environment) to implement all elements of the sector plan
D2 Available domestic and international funding is sufficient in quantity and adequate in quality to implement all
elements of the sector plan
D3 Country-level development partners have the motivation and opportunity (e.g. directive from respective donor
government) to aligned their own activities with the priorities of the sector plan and to work through the LEG as
a consultative and advisory forum
D4 Country-level stakeholders take part in regular, evidence-based joint sector reviews and apply recommendations
deriving from these reviews to enhance equitable and evidence-based sector plan implementation

DRAFT REPORT (VX) – COUNTRY
80
© UNIVERSALIA
D5 The sector plan includes provisions for strengthening EMIS and LAS to produce timely, relevant and reliable data
E1 Sector plan implementation leads to improvements of previous shortcomings in relation to sector management
E2 There is sufficient national capacity (technical capabilities, political will, resources) to analyze, report on and use
available data and maintain EMIS and LAS
E3 ESP implementation leads to improvements of previous shortcomings in relation to learning
E4 Implementation leads to improvements in relation to equity
F1 Changes in the education system positively affect learning outcomes and equity
F2 Country-produced data on equity, efficiency and learning allow measuring/tracking these changes
DRAFT REPORT (VX) – COUNTRY
81
© UNIVERSALIA
7 Conclusions and strategic questions/issues 145. This final section of the report draws overall conclusions deriving from the evaluation findings and formulates several strategic questions that have been raised by the findings of the Nigeria evaluation. These questions are of potential relevance for GPE overall and may warrant further exploration in other upcoming country-level evaluations.
7.1 Conclusions
146. Progress in Nigeria is slow, incremental and politically complex. The multi-layered system, the size of the country and the system, and the almost complete lack of reliable data on enrollment, learning and finance makes Nigeria unlike any other GPE member country. Given the number of OOS children in Nigeria and the current learning crisis across such a large country, improvements in education service delivery is a “must win” battle. On the other hand, the recognition that progress in Nigeria is incremental should not become a reason for setting low expectations or demands for the government and other GPE partners. While flexibility around targets in the past has been implicit (i.e. endorsing plans that were not credible), future efforts should focus on setting achievable, explicit targets for funding. If performance-based funding were to be introduced, serious consideration should be given to what targets can be realistically achieved, and whether they can be credibly measured.
147. The issues in developing credible sector plans in Nigeria demonstrate that effectively the GPE theory of change is not appropriate for Nigeria. As demonstrated in Section 6, and throughout this report – the country level ToC that GPE uses does not work in Nigeria. For that reason, it is necessary for GPE and its partners to consider what a more effective model for Nigeria would look like – considering the size, institutional complexity and weaknesses in data, governance and accountability – perhaps placing primary focus not on strengthening implementation through planning, but instead focusing purely on dialogue, data production and accountability – as a precursor or support mechanism for state governments to begin to engage in their own planning processes (with support from actors such as UNICEF).
148. At the beginning of this policy cycle, the Secretariat decided to endorse plans that were not credible. This decision has (partially) paid off and small, incremental improvements in planning have taken place. However, the cost of non-credible plans being in place has been very little progress in dialogue, monitoring or implementation. Beyond this there is a question of what a credible plan in the case of Nigeria would look like, and what the structure of planning between different state and federal actors would look like. In light of the deficiencies in data production and financial forecasting, it is doubtful that states could produce useful statewide operational plans at this point. If in retrospect it is to be considered that the decision to endorse the Medium-Term Sector Strategies in 2015 was the correct one – what are the implications for assessment of future plans? For the next ESPIG, how will the plans for the new states be appraised, particularly considering that they may not have received any external support in developing plans. If the strategy in Nigeria is to give softer endorsements than in other countries, then this should be done explicitly, and a new set of success criteria (or adapted standards) should be developed for Nigeria.
149. The plethora of plans that do not align are the result of a complex system and a history of funding incentives driving planning rather than driving action against developed plans. However, contributions from several partners in Nigeria have improved state level sector planning. GPE focus on education sector planning has ensured that these contributions are greater than the sum of their parts. The approach taken by GPE, of incentivizing better planning through conditionality for ESPIG
DRAFT REPORT (VX) – COUNTRY
82
© UNIVERSALIA
applications, may not be the best one to take in Nigeria, as it runs the risk of creating incentive systems that link the creation of plans to external funding rather than to system strengthening. This is embodied in the work which UNICEF is supporting, which supports planning without any links to subsequent funding, necessitating a focus on planning for the sake of planning, rather than to access funding. GPE should be wary of how its funding supports reform in institutional norms around external funding for education.
150. In rethinking the theory of change for Nigeria, actors should consider timescale, with incremental change across funding cycles. For example, the contribution claim that GPE support and influence contribute to the development of government-owned, credible and evidence-based sector plans may hold true over two or three policy cycles rather than one policy cycle. The extent to which the Secretariat is comfortable with such a long lag time to improve one step in the ToC is worth consideration. The evaluation team views that the consideration of a long-term strategy (that may require larger investments than other countries) would suit the challenges in Nigeria’s education service delivery and the sheer number of learners in the country. This discussion should however, also consider how much influence GPE (and other partners) have in pushing for change in institutional norms and practices. Considering the relatively minor financial input that GPE has, focus should be placed on strategic inputs – such as focusing on improving dialogue or monitoring.
151. The operating model of supporting dialogue through the CA and LEG is severely challenged by the size and complexity of the sector in Nigeria. While there are positive signs of improved dialogue and coordination in Nigeria, they exist only at the federal level, and have been somewhat limited in scope. For these improvements to move beyond the federal level, and become truly inclusive and far reaching, huge coordination and investment is needed. If GPE aims to effectively support better sector dialogue, the question of how this can be supported and funded should be asked. The CA role cannot be undertaken in the manner intended in the GPE ToC (sector wide) in a complex decentralized country as large as Nigeria, without significant increases in the resources provided. The ToC is not well aligned to large decentralized states. It is worth considering if financing for the CA should be provided and if resources should increase with the size of the country. The use of ESPIG funding to support the role of the CA is a positive development and should be institutionalized in the next grant.
152. GPE should reflect on the understanding of alignment of funding. In the results framework, alignment is measured on nine criteria.180 Using these criteria, the funding in Nigeria performs well – however in reality this assessment does not capture the situation in Nigeria. While GPE funding in Nigeria is closely aligned to SMoE systems, it has no alignment with UBEC/SUBEB, which are the primary channels for basic education funding. While this does not mean that the RF assessment is inaccurate, it does miss a deeper examination of the implications of how funding is delivered. This becomes particularly useful in light of the different approach taken by BESDA, a model GPE should consider in the future. When considering assessments of alignment of their funding – a more qualitative approach could perhaps be taken, looking not just at binary options in the use of fiduciary, planning or budgeting systems – but what impact the funding is having on the key country funding structures (and the relationships between them).181
180 Alignment is defined on RF indicator 29 by 10 questions across 7 criteria – with a grant being considered aligned if it meets at least 7 out of 10 questions. Nigeria scores 8 out of 10 in the latest RF assessments. 181 This is similarly the case in countries in which GPE funding is using sub-national but not national systems or visa versa.

DRAFT REPORT (VX) – COUNTRY
83
© UNIVERSALIA
7.2 Strategic Issues
153. Partners should consider a re-prioritized approach to the GPE theory of change. It is clear that the country level theory of change here evaluated does not function in Nigeria as it does in other countries. When looking at the long term of GPE support to Nigeria, more thought should go in to what a theory of change for achieving GPE higher level outcomes (stronger education systems, and better access, equity and learning outcomes) in Nigeria would look like. This would open up the possibility of provision of specific grants for key elements, such as monitoring, dialogue or improvement of public finance management in states. This means taking a bottom up approach – starting with Nigeria’s specificity, rather than a top-down approach, starting with GPE global theory of change and grant-making and partnership structures.
154. A long-term vision for states is needed, to bridge across GPE funding cycles. In addition to a bottom up approach to partnership planning – a long term focus is needed to ensure sustained improvements across funding cycles. The next ESPIG is unlikely to target the five states targeted by NIPEP, and the 2019 ESPDG is focused on FMoE planning, rather than on the states previously supported. If the strategy is to be rotating support for states, then a clear exit strategy is needed to ensure that progress made in states is maintained and built upon. A multi-cycle strategy could also focus on providing support to states until they reach a pre-determined point before moving to different states (e.g. sustainable dialogue structures, yearly JSRs, and the creation of credible government owned sector plans).
155. More analysis is needed on planning and use of plans between levels of government to create a meta-framework for planning. The decision to support the development of national education sector plans is one with some merits, but also one that relies on significant assumptions about how the NESP will be used to inspire improvements in state level planning. Considering the number and complexity of plans being created currently, a worthy intervention for GPE to focus on would be looking in more detail at how plans are used, and the relationship between plans at different levels of government. This would allow for the development of a framework to govern how planning would take place, which would in turn allow for GPE to support planning in a more effective way, by identifying the key gaps.
156. A revised approach to coordinating dialogue and the role of the CA is needed. The use of NIPEP funding to support a coordinating consultant, along with the provision of dedicated resources by DFID to the role of coordination is an important step in improving dialogue at the federal level in Nigeria. This should be built upon, again by looking to take a bottom up approach to structuring GPE support to dialogue and coordination. This could be by providing a number of agencies with funding to support the creation of dialogue groups at the state level, and the permanent funding of a coordinating role at the federal level to support states. Considering the unique challenges faced in creating mutually accountable dialogue in Nigeria, this should be considered of central importance, and prioritized by GPE funding.
157. If results-based financing (RBF) is to be considered, a thoughtful approach which considers monitoring limitations will be required. The issue of results-based financing is made difficult by the absence of reliable data against which to monitor progress towards targets. However, this does not mean that RBF should not be considered. If RBF is to be considered by GPE, specific focus should be placed on setting targets that can be measured, and will provide motivation in the right areas. This would potentially mean focusing on high level process indicators – such as releasing funding based on the continued function of the NEG, or on progress towards establishing state level JSRs (or any number of other similar indicators).

DRAFT REPORT (VX) – COUNTRY
84
© UNIVERSALIA
Annexes

DRAFT REPORT (VX) – COUNTRY 1
© UNIVERSALIA
Revised Evaluation Matrix
MAIN EVALUATION QUESTIONS AND SUB- QUESTIONS
INDICATORS MAIN SOURCES OF INFORMATION ANALYSIS
Key question I: Has GPE support to Nigeria contributed to achieving country-level objectives related to sector plan implementation, sector dialogue and monitoring,
and more/better financing for education?182 If so, then how?
CEQ 1: Has GPE contributed to education sector plan implementation in Nigeria during the period under review? 183 How?
CEQ 1.1a (prospective CLE) What have been strengths and weaknesses of sector planning during the period under review?184
What are likely reasons for strong/weak sector planning?
• Extent to which the country’s sector plan met the criteria for
a credible ESP as put forward in GPE/IIEP Guidelines185
− ESP is guided by an overall vision
− ESP is strategic, i.e. it identifies strategies for achieving its vision, including required human, technical and financial capacities, and sets priorities)
− ESP is holistic, i.e. it covers all sub-sectors as well as non-formal education and adult literacy
• Sector plan(s) for the period covered by the most recent ESPIG
• Education Sector Analyses and other documents analyzing key gaps/issues in the sector
• GPE ESP/TEP quality assurance documents
• Descriptive analysis
• Triangulation of data deriving from document review and interviews
182 OECD DAC evaluation criteria of relevance, effectiveness, and efficiency. 183 The core period under review varies for summative and prospective evaluations. Prospective evaluations will primarily focus on the period early 2018 to early 2020 and will relate observations of change back to the baseline established at this point. The summative evaluations will focus on the period covered by the most recent ESPIG implemented in the respective country. However, where applicable, (and subject to data availability) the summative evaluations will also look at the beginning of the next policy cycle, more specifically sector planning processes and related GPE support carried out during/towards the end of the period covered by the most recent ESPIG. 184 This question will be applied in prospective evaluations in countries that have not yet developed a (recent) sector plan, such as Mali, as well as in countries that have an existing plan, but that are in the process of embarking into a new planning process. In countries where a sector plan exists and where related GPE support has already been assessed in Year 1 reports, future reports will use a similarly descriptive approach as outlined under question 1.1b, i.e. briefly summarizing key characteristics of the existing sector plan. 185 Global Partnership for education, UNESCO International Institute for Educational Planning. Guidelines for Education Sector Plan Appraisal. Washington and Paris. 2015. Guidelines for Education Sector Plan Preparation. Available at: https://www.globalpartnership.org/content/guidelines-education-sector-plan-preparation

DRAFT REPORT (VX) – COUNTRY 2
© UNIVERSALIA
MAIN EVALUATION QUESTIONS AND SUB- QUESTIONS
INDICATORS MAIN SOURCES OF INFORMATION ANALYSIS
− ESP is evidence-based, i.e. it starts from an education sector analysis
− ESP is achievable
− ESP is sensitive to context
− ESP pays attention to disparities (e.g. between girls/boys or between groups defined geographically, ethnically/culturally or by income)
• For TEPs: Extent to which the country’s sector plan met the criteria for a credible TEP as put forward in GPE/IIEP Guidelines186
− TEP is shared (state-driven, developed through participatory process)
− TEP is evidence-based
− TEP is sensitive to context and pays attention to disparities
− TEP is strategic, i.e. it identifies strategies that not only help address immediate needs but lay the foundation for realizing system’s long-term vision
− TEP is targeted (focused on critical education needs in the short and medium term, on system capacity development, on limited number of priorities)
• GPE RF data (Indicator 16 a-b-c-d)189
• Other relevant reports or reviews that comment on the quality of the sector plan
• Interviews
186 Global Partnership for Education, UNESCO International Institute for Educational Planning. Guidelines for Education Sector Plan Appraisal. Washington and Paris. 2016. Guidelines for Transitional Education Plan Preparation. Available at: https://www.globalpartnership.org/content/guidelines-transitional-education-plan-preparation 189 If the respective ESP has not been rated by GPE (i.e. if no specific information is available on indicators 16 a-d), the evaluation team will provide a broad assessment of the extent to which the ESP meets or does not meet the quality criteria. This review will be based on existing reviews and assessments of the sector plan, in particular the appraisal report. To the extent possible, findings of these assessments will be ‘translated’ in terms of the GPE/IIEP quality standards.

DRAFT REPORT (VX) – COUNTRY 3
© UNIVERSALIA
MAIN EVALUATION QUESTIONS AND SUB- QUESTIONS
INDICATORS MAIN SOURCES OF INFORMATION ANALYSIS
− TEP is operational (feasible, including implementation and monitoring frameworks)
• Extent to which the ESP/TEP meets GPE quality criteria as outlined in the GPE 2020 results framework (indicators 16a, b, c and d)187
• Extent to which the ESP/TEP addresses the main issues/gaps in the education sector (as identified through Education Sector Analyses and/or other studies)
• Extent to which the process of sector plan preparation has been country-led, participatory, and transparent188
• Stakeholder views on strengths and weaknesses of the most recent sector planning process in terms of:
− Leadership for and inclusiveness of sector plan development
− Relevance, coherence and achievability of the sector plan
CEQ 1.1b (summative CLE) What characterized the education sector plan in place during the core period under review?
• ESP/TEP objectives/envisaged results and related targets
• For ESPs: Extent to which the country’s sector plan met the criteria for a credible ESP as put forward in GPE/IIEP Guidelines190
− ESP is guided by an overall vision
• Sector plan(s) for the period covered by the most recent ESPIG
• GPE ESP/TEP quality assurance documents
• Descriptive analysis
187 If no GPE ratings on these indicators are available, evaluation team’s assessment of extent to which the ESP meets the various criteria outlined under indicator 16a-d. 188 Global Partnership for Education, UNESCO International Institute for Educational Planning. Guidelines for Education Sector Plan Appraisal. Washington and Paris. 2015. Available at: http://unesdoc.unesco.org/images/0023/002337/233768e.pdf 190 Global Partnership for Education, UNESCO International Institute for Educational Planning. Guidelines for Education Sector Plan Appraisal. Washington and Paris. 2015. Guidelines for Education Sector Plan Preparation. Available at: https://www.globalpartnership.org/content/guidelines-education-sector-plan-preparation

DRAFT REPORT (VX) – COUNTRY 4
© UNIVERSALIA
MAIN EVALUATION QUESTIONS AND SUB- QUESTIONS
INDICATORS MAIN SOURCES OF INFORMATION ANALYSIS
− ESP is strategic, i.e. it identifies strategies for achieving its vision, including required human, technical and financial capacities, and sets priorities)
− ESP is holistic, i.e. it covers all sub-sectors as well as non-formal education and adult literacy
− ESP is evidence-based, i.e. it starts from an education sector analysis
− ESP is achievable
− ESP is sensitive to context
− ESP pays attention to disparities (e.g. between girls/boys or between groups defined geographically, ethnically/culturally or by income)
• For TEPs: Extent to which the country’s sector plan met the criteria for a credible TEP as put forward in GPE/IIEP Guidelines191
− TEP is shared (state-driven, developed through participatory process)
− TEP is evidence-based
− TEP is sensitive to context and pays attention to disparities
− TEP is strategic, i.e. it identifies strategies that not only help address immediate needs but lay the foundation for realizing system’s long-term vision
• GPE RF data (indicator 16 a-b-c-d)
193
• Other relevant reports or reviews that comment on the quality of the sector plan
191 Global Partnership for Education, UNESCO International Institute for Educational Planning. Guidelines for Education Sector Plan Appraisal. Washington and Paris. 2016. Guidelines for Transitional Education Plan Preparation. Available at: https://www.globalpartnership.org/content/guidelines-transitional-education-plan-preparation 193 If the respective ESP has not been rated by GPE (i.e. if no specific information is available on indicators 16 a-d), the evaluation team will provide a broad assessment of the extent to which the ESP meets or does not meet the quality criteria. This review will be based on existing reviews and assessments of the sector plan, in particular the appraisal report. To the extent possible, findings of these assessments will be ‘translated’ in terms of the GPE/IIEP quality standards.

DRAFT REPORT (VX) – COUNTRY 5
© UNIVERSALIA
MAIN EVALUATION QUESTIONS AND SUB- QUESTIONS
INDICATORS MAIN SOURCES OF INFORMATION ANALYSIS
− TEP is targeted (focused on critical education needs in the short and medium term, on system capacity development, on limited number of priorities)
− TEP is operational (feasible, including implementation and monitoring frameworks)
• Extent to which the ESP/TEP meets GPE quality criteria as outlined in the GPE 2020 results framework (indicators 16a, b, c and d) 192
CEQ 1.2a (prospective CLE) Has GPE contributed to the observed characteristics of sector planning? How? If no, why not?
a) Through the GPE ESPDG grant- (funding, funding requirements)
b) Through other support for sector planning (advocacy, standards, quality assurance procedures, guidelines, capacity building, facilitation, CSEF and ASA grants, and cross-national sharing of
evidence/good practice )194
a) Contributions through GPE ESPDG grant and related funding requirements:
• ESPDG amount as a share of total resources invested into sector plan preparation.
• Types of activities/deliverables financed through ESPDG and their role in informing/enabling sector plan development
b) Contributions through other (non ESPDG-related) support to sector planning:
• Evidence of GPE quality assurance processes improving the quality of the final, compared to draft versions of the sector plan
• Stakeholder views on relevance and appropriateness/value added of GPE Secretariat support, in-country assistance from GA/CA, , Secretariat/GA/CA advocacy, capacity building, facilitation; GPE standards, guidelines, CSEF and ASA grants, and knowledge exchange in relation to:
• Draft and final versions of the sector plan
• Related GPE ESP/TSP quality assurance documents
• Secretariat reports, e.g. country lead back to office/mission reports
• Other documents on advocacy/facilitation provided by Secretariat, CA or GA
• Country-specific ESPDG grant applications
• Interviews
• Education sector analyses and other studies conducted with ESPDG funding
• Triangulation of data deriving from document review and interviews
192 If no GPE ratings on these indicators are available, evaluation team’s assessment of extent to which the ESP meets the various criteria outlined under indicator 16a-d. 194 Advocacy can include inputs from Secretariat, grant agent, coordinating agency, LEG, and GPE at global level (e.g. Board meetings, agreed upon standards). Knowledge exchange includes cross-national/global activities organized by the Secretariat, as well as the sharing and use of insights derived from GRA and KIX grant-supported interventions.

DRAFT REPORT (VX) – COUNTRY 6
© UNIVERSALIA
MAIN EVALUATION QUESTIONS AND SUB- QUESTIONS
INDICATORS MAIN SOURCES OF INFORMATION ANALYSIS
− Improving the quality (including relevance) of education sector plans
− Strengthening in-country capacity for sector planning
CEQ 1.2b-d (summative CLE – currently in Part B of the matrix below and labelled CEQ 9-11)
CEQ 1.3 What have been strengths and weaknesses of sector plan implementation during the period under review?
What are likely reasons for strong/weak sector plan implementation?
• Progress made towards implementing sector plan objectives/meeting implementation targets of current/most recent sector plan within envisaged timeframe (with focus on changes relevant in view of GPE 2020 envisaged impact and outcome areas).
• Extent to which sector plan implementation is funded (expected and actual funding gap)
• Evidence of government ownership of and leadership for plan implementation (country specific).195
• Government implementation capacity and management, e.g.:
− Existence of clear operational/implementation plans or equivalents to guide sector plan implementation and monitoring
− Clear roles and responsibilities related to plan implementation and monitoring
− Relevant staff have required knowledge/skills/experience)
• Sector plan(s) for the period covered by the most recent (mostly) complete ESPIG
• DCP government ESP/TEP implementation documents including mid-term or final reviews
• Relevant programme or sector evaluations, including reviews preceding the period of GPE support under review
• JSR reports
• Reports or studies on ESP/TEP implementation commissioned by other development partners and/or the DCP government
• CSO reports
• Interviews
• Descriptive analysis
• Triangulation of data deriving from document review and interviews
195 For example, in some countries one indicator of country ownership may be the existence of measures to gradually transfer funding for specific ESP elements from GPE/development partner support to domestic funding. However, this indicator may not be applicable in all countries. Stakeholder interviews will be an important source for identifying appropriate, context-specific indicators for government ownership in each case.

DRAFT REPORT (VX) – COUNTRY 7
© UNIVERSALIA
MAIN EVALUATION QUESTIONS AND SUB- QUESTIONS
INDICATORS MAIN SOURCES OF INFORMATION ANALYSIS
• Extent to which development partners who have endorsed the plan have actively supported/contributed to its implementation in an aligned manner.
• Extent to which sector dialogue and monitoring have facilitated dynamic adaptation of sector plan implementation to respond to contextual changes (where applicable)
• Extent to which the quality of the implementation plan in the ESP/TEP and of the plan itself is influencing the actual implementation (e.g. achievability, prioritization of objectives).
• Stakeholder views on reasons why plan has or has not been implemented as envisaged
• DCP’s plan implementation progress reports
CEQ 1.4 Has GPE contributed to the observed characteristics of sector plan implementation?
If so, then how? If not, why not?
a) Through GPE EPDG, ESPIG grants-related funding requirements and the variable tranche under the
New Funding Model (NFM)196
b) Through non-financial support (advocacy, standards, quality assurance procedures, guidelines, capacity building,
Contributions through GPE EPDG and ESPIG grants, related funding requirements and variable tranche under the NFM (where applicable)
• Proportion of overall sector plan (both in terms of costs and key objectives) funded through GPE ESPIG
• Absolute amount of GPE disbursement and GPE disbursement as a share of total aid to education
• Evidence of GPE grants addressing gaps/needs or priorities identified by the DCP government and/or LEG
• Degree of alignment of ESPIG objectives with ESP objectives.
• Grant implementation is on time and on budget
• ESP implementation data including joint sector reviews
• GPE grant agent reports and other grant performance data
• Secretariat reports, e.g. country lead back to office/mission reports
• GPE ESP/TSP quality assurance
documents
• Other documents on GPE advocacy/facilitation
• Country-specific grant applications
• Interviews
• Triangulation of data deriving from document review and interviews
• Where applicable: Comparison of progress made towards ESPIG grant objectives linked to specific performance targets with those without targets (variable tranche
196 Where applicable.

DRAFT REPORT (VX) – COUNTRY 8
© UNIVERSALIA
MAIN EVALUATION QUESTIONS AND SUB- QUESTIONS
INDICATORS MAIN SOURCES OF INFORMATION ANALYSIS
and facilitation, and cross-national sharing of
evidence/good practice)197
• Degree of achievement of/progress toward achieving ESPIG targets (showed mapped to ESPIG objectives, and sector plan objectives)
• Evidence of variable tranche having influenced policy dialogue before and during sector plan implementation (where applicable)
• Progress made towards sector targets outlined in GPE grant agreements as triggers for variable tranche under the NFM, compared to progress made in areas without specific targets (where applicable)
• EPDG/ESPIG resources allocated to(implementation) capacity development
• Stakeholder views on GPE EPDG and ESPIG grants with focus on:
− Value added by these grants to overall sector plan implementation;
− the extent to which the new (2015) funding model is clear and appropriate especially in relation to the variable tranche;
− how well GPE grant application processes are working for in-country stakeholders (e.g. are grant requirements clear? Are they appropriate considering available grant amounts?);
Contributions through non-financial support
• Education sector analyses
• Country’s poverty reduction strategy paper
under the New Funding Model)
197 Facilitation provided primarily through the GPE Secretariat, the grant agent and coordinating agency. Advocacy – including inputs from Secretariat, grant agent, coordinating agency, LEG, and GPE at global level (e.g. Board meetings, agreed upon standards). Knowledge exchange - including cross-national/global activities related to the diffusion of evidence and best practice to improve sector planning and implementation.

DRAFT REPORT (VX) – COUNTRY 9
© UNIVERSALIA
MAIN EVALUATION QUESTIONS AND SUB- QUESTIONS
INDICATORS MAIN SOURCES OF INFORMATION ANALYSIS
• Types of GPE support (advocacy, facilitation, knowledge sharing) aimed at strengthening sustainable local/national capacities for plan implementation
• Relevance of GPE non-financial support in light of DCP government’s own capacity development plan(s) (where applicable)
• Stakeholder views on relevance and effectiveness of GPE non-financial support with focus on:
− GPE non-financial support contributing to strengthening sustainable local/national capacities relevant for plan implementation
− GPE non-financial facilitating harmonized development partners’ support to plan implementation
• Possible causes for no/ limited GPE contribution to plan implementation.
CEQ 1.5 How has education sector financing evolved during the period under review?
a) Amounts of domestic financing
b) Amounts and sources of international financing
c) Quality of domestic and international financing (e.g. short, medium and long-term predictability, alignment with government systems)?
1. If no positive changes, then why not?
a) Amounts of domestic education sector financing
• Changes in country’s public expenditures on education during period under review (absolute amounts and spending relative to total government expenditure)
• Extent to which country has achieved, maintained, moved toward, or exceeded 20% of public expenditures on education during period under review
• Changes in education recurrent spending as a percentage of total government recurrent spending
b) Amounts and sources of international financing
• Changes in the number and types of international donors supporting the education sector
• Changes in amounts of education sector funding from traditional and non-traditional donors (e.g. private foundations and non-DAC members)
• Creditor Reporting System (CRS) by OECD-DAC
• UIS data by UNESCO
• National data (e.g. Education Management Information Systems, National Education Accounts, Joint Sector Reviews, public expenditure reviews)
• GPE results framework indicator 29 on alignment
• Trend analysis for period under review
• Descriptive analysis
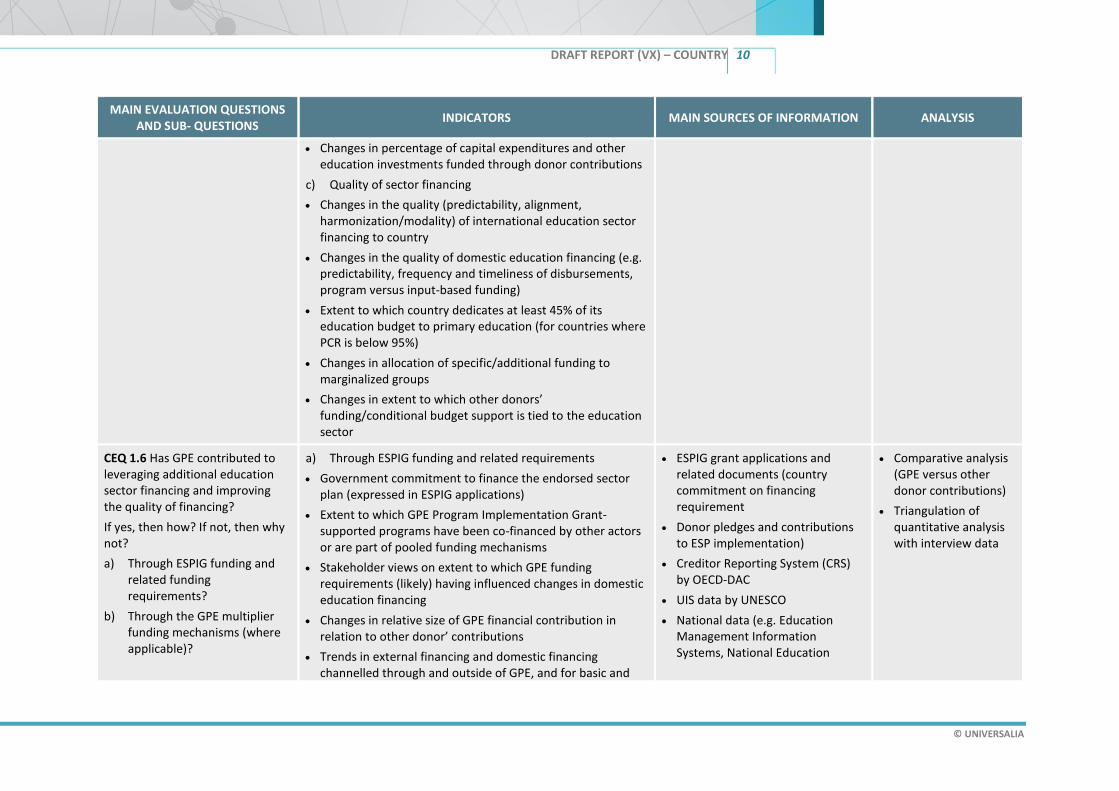
DRAFT REPORT (VX) – COUNTRY 10
© UNIVERSALIA
MAIN EVALUATION QUESTIONS AND SUB- QUESTIONS
INDICATORS MAIN SOURCES OF INFORMATION ANALYSIS
• Changes in percentage of capital expenditures and other education investments funded through donor contributions
c) Quality of sector financing
• Changes in the quality (predictability, alignment, harmonization/modality) of international education sector financing to country
• Changes in the quality of domestic education financing (e.g. predictability, frequency and timeliness of disbursements, program versus input-based funding)
• Extent to which country dedicates at least 45% of its education budget to primary education (for countries where PCR is below 95%)
• Changes in allocation of specific/additional funding to marginalized groups
• Changes in extent to which other donors’ funding/conditional budget support is tied to the education sector
CEQ 1.6 Has GPE contributed to leveraging additional education sector financing and improving the quality of financing?
If yes, then how? If not, then why not?
a) Through ESPIG funding and related funding requirements?
b) Through the GPE multiplier funding mechanisms (where applicable)?
a) Through ESPIG funding and related requirements
• Government commitment to finance the endorsed sector plan (expressed in ESPIG applications)
• Extent to which GPE Program Implementation Grant-supported programs have been co-financed by other actors or are part of pooled funding mechanisms
• Stakeholder views on extent to which GPE funding requirements (likely) having influenced changes in domestic education financing
• Changes in relative size of GPE financial contribution in relation to other donor’ contributions
• Trends in external financing and domestic financing channelled through and outside of GPE, and for basic and
• ESPIG grant applications and related documents (country commitment on financing requirement
• Donor pledges and contributions to ESP implementation)
• Creditor Reporting System (CRS) by OECD-DAC
• UIS data by UNESCO
• National data (e.g. Education Management Information Systems, National Education
• Comparative analysis (GPE versus other donor contributions)
• Triangulation of quantitative analysis with interview data

DRAFT REPORT (VX) – COUNTRY 11
© UNIVERSALIA
MAIN EVALUATION QUESTIONS AND SUB- QUESTIONS
INDICATORS MAIN SOURCES OF INFORMATION ANALYSIS
2. Through other means, including advocacy198 at national and/or global levels?
total education, to account for any substitution by donors or the country government
• Alignment of GPE education sector program implementation grants with national systems199
• Possible reasons for non-alignment or non-harmonization of ESPIGs (if applicable)
b) Through the GPE multiplier funding mechanism
• Amount received by DCP government through the GPE multiplier fund (if applicable)
• Stakeholder views on clarity and efficiency of multiplier application process
c) Through other means (especially advocacy)
• Likelihood of GPE advocacy having contributed to country meeting/approaching goal of 20% of the total national budget dedicated to education
• Changes in existing dynamics between education and finance ministries that stakeholders (at least partly) attribute to GPE advocacy200 (e.g. JSRs attended by senior MoF staff)
• Amounts and quality of additional resources likely mobilized with contribution from GPE advocacy efforts at country or global levels
• Amounts and sources of non-traditional financing (e.g. private or innovative finance) that can be linked to GPE leveraging
Accounts, Joint Sector Reviews, public expenditure reviews)
• Interviews with national actors (e.g. Ministry of Finance, Ministry of Education, Local Education Groups/ Development partner groups)
198 Through the Secretariat at country and global levels, and/or GPE board members (global level, influencing country-specific approaches of individual donors) 199 GPE’s system alignment criteria including the 10 elements of alignment and the elements of harmonization captured by RF indicators 29, 30 respectively. 200 This advocacy can have taken place in the context of GPE support to education sector planning, sector dialogue, and/or plan implementation

DRAFT REPORT (VX) – COUNTRY 12
© UNIVERSALIA
MAIN EVALUATION QUESTIONS AND SUB- QUESTIONS
INDICATORS MAIN SOURCES OF INFORMATION ANALYSIS
CEQ 2 Has GPE contributed to strengthening mutual accountability for the education sector during the period under review? If so, then how?
CEQ 2.1 Has sector dialogue changed during the period under review?
If so, then how and why? If not, why not?
• Composition of the country’s LEG (in particular civil society and teacher association representation), and changes in this composition during period under review; other dialogue mechanisms in place (if any) and dynamics between those mechanisms
• Frequency of LEG meetings, and changes in frequency during period under review
• LEG members consulted for ESPIG application
• Stakeholder views on changes in sector dialogue in terms of:
− Degree to which different actors lead, contribute to, or facilitate dialogue
− Inclusiveness
− Consistency, clarity of roles and responsibilities
− Meaningfulness (i.e. perceptions on whether, when and how stakeholder input is taken into account for decision making)
− Quality (evidence-based, transparent)
− Likely causes for no/limited (changes in) sector dialogue
• LEG meeting notes
• Joint sector reviews or equivalents from before and during most recent ESPIG period
• GPE sector review assessments
• ESP/TSP, and documents illustrating process of their development
• Back to office reports/memos from Secretariat
• ESPIG grant applications (section V – information on stakeholder consultations)
• Interviews
• Pre-post comparison
• Triangulate results of document review and interviews
• Stakeholder analysis and mapping
CEQ 2.2 Has sector monitoring changed?
If so, then how and why? If not, why not?
• Extent to which plan implementation is being monitored (e.g. results framework with targets, performance review meetings, annual progress reports… and actual use of these monitoring tools)
• Frequency of joint sector reviews conducted, and changes in frequency during period under review; nature of JSR meetings held; and any other monitoring events at country level (e.g., DP meetings…)
• Extent to which joint sector reviews conducted during period of most recent ESPIG met GPE quality standards (if
• LEG and JSR meeting notes
• Joint sector review reports/aide memoires or equivalents from before and during most recent ESPIG period
• GPE sector review assessments
• Grant agent reports
• Back to office reports/memos from Secretariat
• Pre-post comparison
• Triangulate the results of document review and interviews

DRAFT REPORT (VX) – COUNTRY 13
© UNIVERSALIA
MAIN EVALUATION QUESTIONS AND SUB- QUESTIONS
INDICATORS MAIN SOURCES OF INFORMATION ANALYSIS
data is available: compared to JSRs conducted prior to this period)
• Evidence deriving from JSRs is reflected in DCP government decisions (e.g. adjustments to sector plan implementation) and sector planning
• Stakeholder views on changes in JSRs in terms of them being:
− Inclusive and participatory, involving the right number and types of stakeholders
− Aligned to existing sector plan and/or policy framework
− Evidence based
− Used for learning/informing decision-making
− Embedded in the policy cycle (timing of JSR appropriate to inform decision making; processes in place to follow up
on JRS recommendations)201 and recommendations are
acted upon and implemented
• Stakeholder views on extent to which current practices of sector dialogue and monitoring amount to ‘mutual accountability’ for the education sector.
• Likely causes for no/ limited (changes in) sector monitoring.
• Interviews
CEQ 2.3 Has GPE contributed to observed changes in sector dialogue and monitoring?
If so, then how? If not, why not?
a) Grants and funding requirements
• Proportion of total costs for sector dialogue mechanisms (and/or related specific events) funded through GPE grants
• LEG meeting notes
• Joint sector reviews or equivalents from before and during most recent ESPIG period
• Triangulate the results of document review and interviews
201 Criteria adapted from: Global Partnership for Education. Effective Joint Sector Reviews as (Mutual) Accountability Platforms. GPE Working Paper #1. Washington. June 2017. Available at: https://www.globalpartnership.org/blog/helping-partners-make-best-use-joint-sector-reviews

DRAFT REPORT (VX) – COUNTRY 14
© UNIVERSALIA
MAIN EVALUATION QUESTIONS AND SUB- QUESTIONS
INDICATORS MAIN SOURCES OF INFORMATION ANALYSIS
a) Through GPE grants and funding requirements202
b) Through other support (capacity development, advocacy, standards, quality assurance, guidelines, facilitation, cross-national sharing of evidence/good
practice)203
• Proportion of total costs for sector monitoring mechanisms (e.g. JSR) funded through GPE grants
• Stakeholder views on extent to which GPE funding process (e.g. selection of grant agent, development of program document, grant application) and grant requirements positively or negatively influenced the existence and functioning of mechanisms for sector dialogue and/or monitoring
b) Non-grant related support
• Support is aimed at strengthening local/national capacities for conducting inclusive and evidence-based sector dialogue and monitoring
• Support is targeted at gaps/weaknesses of sector dialogue/monitoring identified by DCP government and/or LEG
• Support for strengthening sector dialogue/monitoring is adapted to meet the technical and cultural requirements of the specific context in Nigeria
a) and b)
• Stakeholder view on relevance and appropriateness of GPE grants and related funding process and requirements, and of other support in relation to:
− Addressing existing needs/priorities
• GPE sector review assessments
• Grant agent reports
• Back to office reports/memos from Secretariat
• Interviews
• CSEF, KIX documents etc.
202 All relevant GPE grants to country/actors in country, including CSEF and KIX, where applicable. 203 Capacity development and facilitation primarily through Secretariat, coordinating agency (especially in relation to sector dialogue) and grant agent (especially in relation to sector monitoring). Advocacy through Secretariat (country lead), CA, as well as (possibly) GPE at the global level (e.g. Board meetings, agreed upon standards). Knowledge exchange includes cross-national/global activities organized by the Secretariat, as well as the sharing and use of insights derived from GRA and KIX grant-supported interventions. Knowledge sharing also possible through other GPE partners at country level (e.g. other donors/LEG members) if provided primarily in their role as GPE partners.

DRAFT REPORT (VX) – COUNTRY 15
© UNIVERSALIA
MAIN EVALUATION QUESTIONS AND SUB- QUESTIONS
INDICATORS MAIN SOURCES OF INFORMATION ANALYSIS
− Respecting characteristics of the national context
− Adding value to country-driven processes (e.g. around JSRs)
• Possible causes for no/ limited GPE contributions to dialogue/monitoring.
CEQ 3: Has GPE support had unintended/unplanned effects? What factors other than GPE support have contributed to observed changes in sector planning, sector plan implementation, sector financing and monitoring?
CEQ 3.1 What factors other than GPE support are likely to have contributed to the observed changes (or lack thereof) in sector planning, financing, plan implementation, and in sector dialogue and monitoring?
• Changes in nature and extent of financial/non-financial support to the education sector provided by development partners/donors (traditional/non-traditional donors including foundations)
• Contributions (or lack thereof) to sector plan implementation, sector dialogue or monitoring made by actors other than GPE
• Changes/events in national or regional context(s)
− Political context (e.g. changes in government/leadership)
− Economic context
− Social/environmental contexts (e.g. natural disasters, conflict, health crises)
− Other (context-specific)
• Documents illustrating changes in priorities pursued by (traditional/non-traditional) donors related implications for Nigeria
• Relevant studies/reports commissioned by other education sector actors (e.g. donors, multilateral agencies) regarding nature/changes in their contributions and related results
• Government and other (e.g. media) reports on changes in relevant national contexts and implications for the education sector
• Interviews
• Triangulate the results of document review and interviews
CEQ 3.2 During the period under review, have there been unintended, positive or negative, consequences of GPE financial and non-financial support?
• Types of unintended, positive and negative, effects on sector planning, financing, sector plan implementation, sector dialogue and monitoring deriving from GPE grants and funding requirements
• Types of unintended, positive and negative, effects deriving from other GPE support.
• All data sources outlined for CEQs 1 and 2 above
• Interviews
• Triangulate the results of document review and interviews

DRAFT REPORT (VX) – COUNTRY 16
© UNIVERSALIA
MAIN EVALUATION QUESTIONS AND SUB- QUESTIONS
INDICATORS MAIN SOURCES OF INFORMATION ANALYSIS
Key question II: Has sector plan implementation contributed to making the overall education system in Nigeria more effective and efficient?
CEQ 4 During the period under review, how has the education system changed in relation to:
a) Improving access to education and equity?
b) Enhancing education quality and relevance (quality of teaching/instruction)?
c) Sector Management?204
If there were no changes in the education system, then why not and with what implications?205
a) Improving education access and equity - focus on extent to which DCP meets its own performance indicators, where available, e.g. related to:206
• Changes in number of schools relative to children
• Changes in the average distance to schools
• Changes in costs of education to families
• Changes in the availability of programs to improve children’s’ readiness for school)
• New/expanded measures put in place to ensure meeting the educational needs of children with special needs and of learners from disadvantaged groups
• New/expanded measures put in place to ensure gender equality in education
b) Enhancing education quality and relevance (Quality of teaching/instruction) – focus on extent to which DCP meets its own performance indicators, e.g. related to:
• Changes in pupil/trained teacher ratio during period under review
• Changes in equitable allocation of teachers (measured by relationship between number of teachers and number of pupils per school)
• Education Management Information System (EMIS)
• UIS data
• World Bank data
• Household survey data
• ASER/UWEZO other citizen-led surveys
• Grant agent progress reports
• Implementing partner progress reports
• Mid-term Evaluation reports
• GPE annual Results Report
• Appraisal Reports
• Public expenditure reports
• CSO reports
• SABER database
• Education financing studies
• Pre-post comparison of statistical data for periods under review
• Triangulate the results of document review with statistical data, interviews and literature on ‘good practice’ in specific areas of systems strengthening
204 The sub-questions reflect indicators under Strategic Goal #3 as outlined in the GPE results framework as well as country-specific indicators for system-level change and elements (such as institutional strengthening) of particular interest to the Secretariat. 205 Implications for education access and equity, quality and relevance, and sector management, as well as likely implications for progress towards learning outcomes and gender equality/equity. 206 The noted indicators are examples of relevant measures to indicate removal of barriers to education access. Applicability may vary across countries. Where no country specific indicators and/or data are available, the CLE will draw upon UIS (and other) data on the described indicators.

DRAFT REPORT (VX) – COUNTRY 17
© UNIVERSALIA
MAIN EVALUATION QUESTIONS AND SUB- QUESTIONS
INDICATORS MAIN SOURCES OF INFORMATION ANALYSIS
• Changes in relevance and clarity of (basic education) curricula
• Changes in the quality and availability of teaching and learning materials
• Changes in teacher pre-service and in-service training
• Changes in incentives for schools/teachers
c) Sector Management – focus on extent to which DCP meets its own performance indicators, e.g. related to:
• Changes in the institutional capacity of key ministries and/or other relevant government agencies (e.g. staffing, structure, organizational culture, funding)
• Changes in whether country has and how it uses EMIS data to inform policy dialogue, decision making and sector monitoring
• If no functioning EMIS is in place, existence of a realistic remedial strategy in place
• Changes in whether country has and how it uses quality learning assessment system within the basic education cycle during period under review
(a-c):
• Likely causes for no/ limited changes at system level (based on literature review and stakeholder views)
• Literature on good practices in education system domains addressed in country’s sector plan
• Interviews
• ESPIG grant applications
• Relevant documents/reports illustrating changes in key ministries’ institutional capacity (e.g. on restructuring, internal resource allocation)
CEQ 5 How has sector plan implementation contributed to observed changes at education system level?
• The specific measures put in place as part of sector plan implementation address previously identified bottlenecks at system level
• Alternative explanations for observed changes at system level (e.g. changes due to external factors, continuation of trend that was already present before current/most recent policy cycle, targeted efforts outside of the education sector plan)
• Sources as shown for CEQ 4
• Literature on good practices in education system domains addressed in country’s sector plan
• Education sector analyses
• Country’s poverty reduction strategy paper

DRAFT REPORT (VX) – COUNTRY 18
© UNIVERSALIA
MAIN EVALUATION QUESTIONS AND SUB- QUESTIONS
INDICATORS MAIN SOURCES OF INFORMATION ANALYSIS
Key question III: Have improvements at education system level contributed to progress towards impact?
CEQ 6 During the period under review, what changes have occurred in relation to:
a) Learning outcomes (basic education)?
b) Equity, gender equality and inclusion in education?
Is there evidence to link changes in learning outcomes, equity, gender equality, and inclusion to system-level changes identified under CEQ 4?
What other factors can explain changes in learning outcomes, equity, etc.?
Changes/trends in DCP’s core indicators related to learning/equity as outlined in current sector plan and disaggregated (if data is available). For example:
a) Learning outcomes
• Changes/trends in learning outcomes (basic education) during period under review (by gender, by socio-economic group, by rural/urban locations)
b) Equity, gender equality, and inclusion
• Changes in gross and net enrollment rates (basic education) during review period (by gender, by socio-economic group, by rural/urban)
• Changes in proportion of children (girls/boys) who complete (i) primary, (ii) lower-secondary education
• Changes in transition rates from primary to lower secondary education (by gender, by socio-economic group)
• Changes in out of school rate for (i) primary, (ii) lower-secondary education (by gender, socio-economic group, rural/urban location)
• Changes in dropout and/or repetition rates (depending on data availability) for (i) primary, (ii) lower-secondary education
• Changes in the distribution of out of school children (girls/boys; children with/without disability; ethnic, geographic and/or economic backgrounds)
• Plausible links between changes in country’s change trajectory related to learning outcomes, equity, gender equality, and inclusion during period under review on the one hand, and specific system-level changes put in place during the same period
• Sector performance data available from GPE, UIS, DCP government and other reliable sources
• Teacher Development Information System (TDIS)
• Education Management Information System (EMIS)
• National examination data
• International and regional learning assessment data
• EGRA/EGMA data
• ASER/UWEZO other citizen-led surveys
• Grant agent and Implementing partner progress reports
• Mid-term Evaluation reports
• GPE annual Results Report
• Studies/evaluation reports on education (sub)sector(s) in country commissioned by the DCP government or other development partners (where available)
• Literature on key factors affecting learning outcomes, equity, equality, and inclusion in comparable settings
• Pre-post comparison of available education sector data (examination of trends) during and up to 5 years before core period under review
• Triangulation of statistical data with qualitative document analysis

DRAFT REPORT (VX) – COUNTRY 19
© UNIVERSALIA
MAIN EVALUATION QUESTIONS AND SUB- QUESTIONS
INDICATORS MAIN SOURCES OF INFORMATION ANALYSIS
• Additional explanations for observed changes in learning outcomes, equity, gender equality, and inclusion other than system-level changes noted under CEQ 4 and 5
• Likely reasons for impact-level changes during period under review
Key question IV: What are implications of evaluation findings for GPE support to Nigeria?
CEQ 7 What, if any, aspects of GPE support to Nigeria should be improved? What, if any, good practices have emerged related to how GPE supports countries? 207
• Insights deriving from answering evaluation questions above e.g. in relation to:
− Clarity and relevance of the roles and responsibilities of key GPE actors at the country level (Secretariat, GA, CA, DCP government, other actors)
− Strengths and weaknesses of how and whether GPE key country-level actors fulfill their roles (both separately and jointly i.e. through a partnership approach)
− The relative influence/benefits deriving from GPE financial and non-financial support respectively (with focus on the NFM, where applicable)
− Extent to which logical links in the GPE theory of change are, or are not, supported by evidence
− Extent to which originally formulated underlying assumptions of the ToC appear to apply/not apply and why
− Extent to which different elements in the theory of change appear to mutually enforce/support each other (e.g. relationship sector dialogue and sector planning)
− Stakeholder satisfaction with GPE support
• All of the above as well as (for summative evaluations) sources applied for CEQs 9, 10 and 11 (part B below)
• Triangulation of data collected and analysis conducted for other evaluation questions
207 For both questions CEQ 7 and 8 the notion of ‘good practice’ refers to acknowledging processes, mechanisms, ways of working etc. that the CLE found to work well and/or that were innovative in that specific context. The intention is not to try and identify globally relevant benchmarks or universally ‘good practice’.

DRAFT REPORT (VX) – COUNTRY 20
© UNIVERSALIA
MAIN EVALUATION QUESTIONS AND SUB- QUESTIONS
INDICATORS MAIN SOURCES OF INFORMATION ANALYSIS
CEQ 8 What, if any, good practices have emerged related to how countries address specific education sector challenges/how countries operate during different elements of the policy cycle?208
• Insights deriving from answering evaluation questions above e.g. in relation to:
− Effectiveness of approaches taken in the respective country to ensure effective sector planning, sector dialogue and monitoring, sector financing, sector plan implementation.
− Successful, promising, and/or contextually innovative approaches taken as part of sector plan implementation to address specific sector challenges209
• All of the above as well as (for summative evaluations) sources applied for CEQs 9, 10 and 11 (part B below)
• Triangulation of data collected and analysis conducted for other evaluation questions
208 This could mean, for example, highlighting strengths of existing mechanisms for sector planning that either reflect related GPE/IIEP guidelines and quality criteria or that introduce alternative/slightly different approaches that appear to work well in the respective context. 209 For example, highlighting promising approaches taken by the respective government and development partners to try and reach out of school children. Please note that ‘innovative’ means ‘innovative/new in the respective context’, not necessarily globally new.

DRAFT REPORT (VX) – COUNTRY 21
© UNIVERSALIA
GPE ToC
g

DRAFT REPORT (VX) – COUNTRY 22
© UNIVERSALIA

DRAFT REPORT (VX) – COUNTRY 23
© UNIVERSALIA
Explanatory mechanisms and (implicit) contribution claims
# EXPLANATORY MECHANISM
(IMPLICIT) CONTRIBUTION CLAIM
1 – GPE contributions to sector planning
1.1, 1.2, 1.3 and 1.4
BECAUSE
• (1) GPE provides Education Sector Plan Development Grants and guidance, quality assurance, capacity development and technical guidance
• (2) GPE promotes (at global and country levels) evidence-based and adaptive planning
• (3) GPE promotes and facilitates cross-national sharing of evidence and good practice
• (4) GPE fosters clear roles, responsibilities and accountabilities among stakeholders in policy dialogue and their collaboration in a coordinated, harmonized way to solve sector issues
• (5) Data on systems, equity, and learning generated through quality EMIS and LAS are fed back and used to inform sector planning
DCP government produces and owns credible and evidence-based sector plans focused on equity, efficiency, and learning
Contribution claim A: GPE (financial and non-financial) support and influence contribute to the development of government owned, credible and evidence-based sector plans focused on equity, efficiency and learning.
2 - GPE contributions to sector plan implementation, sector monitoring, and dialogue
2.1 BECAUSE
• (1) GPE provides CSEF and ASA grants
• (2) GPE supports and promotes evidence-based and inclusive national sector monitoring and adaptive planning at global and country levels
• (3) GPE promotes and facilitates cross-national sharing of evidence and good practice
• (4) GPE fosters clear roles, responsibilities and accountabilities among stakeholders in policy dialogue and their collaboration in a coordinated, harmonized way to solve sector issues
There is mutual accountability for sector progress through inclusive sector policy dialogue and monitoring
Contribution claim B: GPE (financial and non-financial) support for inclusive sector planning and joint monitoring contribute to mutual accountability for education sector progress.
2.2 BECAUSE
• (1) GPE advocates for and establishes mechanisms for increased, harmonized, and better aligned international financing for education, and
Contribution claim C: GPE advocacy and funding requirements contribute to more

DRAFT REPORT (VX) – COUNTRY 24
© UNIVERSALIA
# EXPLANATORY MECHANISM
(IMPLICIT) CONTRIBUTION CLAIM
• (2) GPE funding requirements include the promotion of improvements in domestic financing for education promotes
There is more and better financing for education mobilized in the country.
and better financing for education in the country.
2.3, 2.4, 2.5, 2.6 2.7 and 2.8
BECAUSE
• (1) GPE provides funding through PDGs and ESPIGS
• (2) GPE provides quality assurance, processes, guidelines, capacity building and technical guidance for ESPIG development and implementation
• (3) there is mutual accountability for education sector progress
• (4) the country has developed a credible and evidence-based sector plan
• (5) more and better domestic and international financing for education is available
• (6) GPE promotes and facilitates cross-national sharing of evidence and good practice
• (7) Data on systems, equity, and learning generated through quality EMIS and LAS are fed back and used to inform sector plan implementation
The country implements and monitors credible, evidence-based sector plans based on equity, efficiency and learning
Contribution claim D: GPE (financial and non-financial) support and influence contribute to the effective and efficient implementation of sector plans.
3. From country-level objectives to system-level change (intermediary outcome)
3.1 BECAUSE
• (1) countries implement and monitor realistic, evidence-based education sector plans based on equity, efficiency and learning
The education system becomes more effective and efficient towards delivering equitable quality educational services for all
Contribution claim E: The development, implementation and monitoring of realistic evidence based sector plans contributes to positive changes at the level of the overall education system.
3.2 BECAUSE
• (1) sector plan implementation includes provisions for strengthened EMIS and LAS
• (2) because GPE promotes and facilitates sharing of evidence and mutual accountability for education sector progress
Country produces and shares disaggregated data on equity, efficiency, and learning

DRAFT REPORT (VX) – COUNTRY 25
© UNIVERSALIA
# EXPLANATORY MECHANISM
(IMPLICIT) CONTRIBUTION CLAIM
4. From system-level change (intermediate outcomes) to impact
4 BECAUSE of improvements at the level of the overall education system, there are improved learning outcomes and improved equity, equality, and inclusion in education.
Contribution claim F: Education system-level improvements result in improved learning outcomes and in improved equity, gender equality, and inclusion in education.


DRAFT REPORT (VX) – COUNTRY 27
© UNIVERSALIA
Interview protocols
These guidelines are not intended as questionnaires. It will not be possible to cover all issues in all categories with all individuals or groups. The evaluation team members will use their judgment and focus on areas which are likely to add most to the team’s existing knowledge, while allowing interviewees and groups to highlight the issues that are most important to them.
158. The evaluators will formulate questions in a (non-technical) way that respondents can easily relate to, while generating evidence that is relevant to the evaluation questions that the evaluators have in mind.
i. Approach to interviews
1. Interviews will be a major source of information for this evaluation. These will be a means to
extract evidence, as well as to triangulate evidence drawn from other interviews and the
document review, and will form part of the consultative process.
2. A stakeholder analysis, as presented in baseline report, will inform the selection of
interviewees. Over the evaluation period the evaluation team aims to target a comprehensive
range of stakeholders that fully represent all significant institutional, policy and beneficiary
interests. The team will periodically review the list of those interviewed to ensure that any
potential gaps are addressed and to prevent under-representation of key stakeholders.
3. All interviews will comply with the team’s commitment to the respective evaluation ethics (the work of the evaluation team will be guided by: OECD DAC Evaluation Quality Standards for Development Evaluation;210 UNEG Norms, Standards, Ethical Guidelines and Code of Conduct for Evaluation in the UN System;211 the World Bank’s principles and standards for evaluating global and regional partnership programs;212 ALNAP’s Evaluation of Humanitarian Action Guide;213 the Sphere Handbook and Standards for Monitoring and Evaluation;214 and Guidance on Ethical Research Involving Children.215)
4. Interviews will be conducted in confidence and usually on a one-to-one or one-to-two basis
(to enable note-taking). Reports will not quote informants by name and will not include direct
quotes where it could risk revealing the participant’s identity or attribution without prior
consent.
5. A protocol and standard format for recording interview notes is presented below. This will be
used for all interviews and will ensure systematic recording of details, while allowing for
flexibility in the specific questions asked. Interview notes will be written up, consolidated into
an interview compendium and shared among team members via the internal team-only e-
library. To respect interviewee confidentiality, the interview notes will be accessible only to
team members. The compendium of interview notes will facilitate analysis across all
interviews and will enable searches on key thematic terms, initiatives and so on. This will
maximize the analytical potential of interviews and the possibilities for triangulation.
210 http://www.oecd.org/development/evaluation/qualitystandards.pdf 211 http://www.uneval.org/document/detail/21 and http://www.uneval.org/document/detail/22 , http://www.uneval.org/document/detail/102 and http://www.unevaluation.org/document/detail/100 212 http://siteresources.worldbank.org/EXTGLOREGPARPROG/Resources/sourcebook.pdf 213 http://www.alnap.org/resource/23592.aspx 214 http://www.sphereproject.org/silo/files/sphere-for-monitoring-and-evaluation.pdf 215 http://childethics.com/

DRAFT REPORT (VX) – COUNTRY 28
© UNIVERSALIA
ii. Focus group discussions
6. The evaluation team may also make use of focus group discussions. Similar to the interview
guides, the sub-headings and discussion guide points used are linked to the areas of enquiry
and evaluation questions set out in the evaluation matrix, and are intended as a guide only,
for the evaluation team to follow flexibly in order to maximize its learning from each
discussion group.
7. All focus group discussions will reflect with the evaluation team’s commitment to appropriate
evaluation ethics (as referenced above).

DRAFT REPORT (VX) – COUNTRY 29
© UNIVERSALIA
Risks to the Evaluation and Ethics
i . Risks to the evaluation
1. The table below outlines the key anticipated risks and limitations as outlined in the risk management and contingency plan section of the inception report. It also puts forward the anticipated mechanisms to mitigate risks.
Annex Table 1: Key anticipated risks and limitations, and proposed mitigation mechanisms
ANTICIPATED RISK AND CONSEQUENCES MITIGATION MECHANISMS
Delays in the timing of the 24 country visits
Consequences: some country evaluation reports are submitted later than required to inform GPE strategy and impact committee and/or Board meetings, or to feed into the synthesis report.
Likelihood: High
If full evaluation/progress reports are not yet complete, the evaluation team will provide the Secretariat with at least an overview of emerging key findings at the agreed-upon timelines that are linked to SIC and Board meetings or the submission of synthesis reports. The full reports will be submitted as soon as possible thereafter and will be reflected in subsequent synthesis reports in case important information was missed.
Conflict or fragility undermine the ability of our teams to conduct in-country data collection for summative or prospective evaluations
Consequences: international consultants cannot conduct in-person data collection on the ground. Delays in conducting of site visits and of subsequent deliverables.
Likelihood: Medium to high
Change timing of site visits, and postpone related deliverables.
Change order in which 22 summative evaluations are conducted and/or make use of the contingency provision of two extra countries included in the sample for summative evaluations.
Collect data from individual in-country stakeholders via email, telephone, Skype; use electronic survey to reach several stakeholders at once.
Increase level of effort of national consultant(s) to ensure in-country data collection.
Interventions are not implemented within the lifecycle of the evaluation
This constitutes a particular risk for the prospective evaluations. While a lack of implementation can create learning opportunities in impact evaluations, such situations do not present value for money.
Likelihood: Medium
If interventions are not implemented within the lifecycle of the evaluation, data on bottlenecks, barriers, contextual factors and the political economy will be able to shed light on why implementation did not take place and the extent to which such factors were within GPE’s control.
Large data and evidence gaps
Consequences: inability to conduct reliable trend analysis. Lack of a solid basis on which to assess country progress made in strengthening the overall education system and education outcomes, as well as GPE contributions along the ToC.
Likelihood: Medium, but varying by country
Inclusion of data availability as a consideration in the sampling strategy. Work with the Secretariat and in-country stakeholders to fill data gaps. For prospective evaluations, if gaps identified as baseline cannot be filled, adjust the prospective evaluation focus to make the most of alternative data that may be available.
Use of qualitative data – e.g. based on stakeholder consultations – to reconstruct likely baseline for key issues relevant for assembling the contribution story.

DRAFT REPORT (VX) – COUNTRY 30
© UNIVERSALIA
ANTICIPATED RISK AND CONSEQUENCES MITIGATION MECHANISMS
Clearly identify data gaps and implications for data analysis in all deliverables.
Structure of available data is limiting
To assess education sector progress, the evaluation team will use the best data available at country level. However, the format of available data may vary by country. For example, countries may use different criteria to define ‘inclusion’ in their data. This can pose challenges to synthesizing findings on GPE contributions in the respective area.
Likelihood: Medium
As qualitative synthesis does not face the same limitations, we will mitigate this risk by describing differences in measurement criteria across countries.
Inaccessibility of in-country partners, resulting in incomplete datasets; limited triangulation; partners not fully seeing their views reflected in, and therefore rejecting, evaluation findings and forward-looking suggestions; increases in costs and time required for data collection; and delays in completing data collection and submitting deliverables.
Likelihood: Medium
Reaching out to in-country stakeholders as early as possible before scheduled missions to explore their availability.
Data collection via email, telephone, Skype, or through local consultants before or after site visits.
Close collaboration with the Secretariat country lead and in-country focal point (e.g. coordinating agency) to identify and gain access to all key in-country stakeholders.
Consult other individuals from the same stakeholder group if key envisaged informants are not available.
Being part of an evaluation changes the behavior of actors, independent of GPE support
GPE partners within prospective evaluation countries may, involuntarily, perceive the prospective evaluation countries as showcase examples and increase efforts due to the evaluation.
Likelihood: Medium to low
The evaluation team will review the performance data for the full set of GPE countries and see if the prospective evaluation countries have moved in their performance ranking over the lifecycle of the evaluation.
Evaluations (perceived to be) not sufficiently independent from the Secretariat Consequences: negative effects on credibility of evaluation findings and forward-looking suggestions in the eyes of key stakeholders. Limited use of evaluations to inform decision-making and/or behaviors of key stakeholders. Reputational damage for the Secretariat and consortium members.
Likelihood: Medium to low
Findings, conclusions and forward-looking suggestions will be based on clearly identified evidence.
Review of all draft deliverables by an Independent Technical Review Panel (ITRP).
The evaluation team will incorporate feedback received on draft deliverables as follows: (a) factual errors will be corrected; (b) for other substantive comments, the evaluation team will decide based on the available evidence whether (and how) to incorporate them or not. If comments/suggestions are not accepted, the evaluation team will explain why.
Prospective country evaluation teams becoming excessively sympathetic to GPE or others through repeat visits
This can result in overly positive reports that miss areas requiring constructive criticism.
Likelihood: Medium to low
The internal, independent and external quality assurance mechanisms described in Section 4.3, as well as feedback received from the ITRP, will make it possible to identify any cases where prospective evaluation reports provide insufficient evidence for overly positive assessments.

DRAFT REPORT (VX) – COUNTRY 31
© UNIVERSALIA
ANTICIPATED RISK AND CONSEQUENCES MITIGATION MECHANISMS
Countries no longer willing to participate in, or wish to withdraw partway through, an (prospective) evaluation
Consequences: an unbalanced sample of summative or prospective evaluations. Difficulty completing all eight prospective evaluations in a consistent manner.
Likelihood: Medium to low
A transparent selection/sampling process.
Early work with GPE country leads and in-country implementing partners to build support for all country-level evaluations.
Early and ongoing direct engagement with senior decision-makers in DCPs to ensure that key stakeholders understand the nature and anticipated duration –especially of the prospective evaluations.
i i . Ethics
1. The members of our consortium abide by and uphold internationally recognized ethical practices and codes of conduct for evaluations, especially when they take place in humanitarian and conflict situations, and with affected and vulnerable populations.
2. For this evaluation the team has been guided by: OECD DAC Evaluation Quality Standards for Development Evaluation; UNEG Norms, Standards, Ethical Guidelines and Code of Conduct for Evaluation in the UN System; the World Bank’s principles and standards for evaluating global and regional partnership programs; ALNAP’s Evaluation of Humanitarian Action Guide; the Sphere Handbook and Standards for Monitoring and Evaluation; and Guidance on Ethical Research Involving Children.

DRAFT REPORT (VX) – COUNTRY 32
© UNIVERSALIA
Confirming and refuting evidence methodology
1. This evaluation pays attention to how contribution analysis can identify and determine the extent of influencing factors and alternative explanations and weighs confirming and refuting evidence.
2. Following Lemire, Nielsen and Dyadal,216 we use the Relevant Explanation Finder (REF) as an operational framework to provide structure for enabling transparent and explicit decision-making regarding weighing confirming and refuting factors in the evaluative inquiry.
3. For each item of evidence the evaluation team recorded the contribution claim the evidence relates to, described the item of evidence, recorded the data source and assessed whether the evidence confirms or refutes the contribution claim. The degree of influence on the contribution claim was assessed for each item of evidence, being judged on the basis of certainty, robustness, validity, prevalence and theoretical grounding.
Annex Table 2 Strength of evidence assessment example – documents
Number Certainty Robustness Validity Prevalence Theoretical grounding
Degree to which the evidence is
confirming or refuting the
explanation (i.e. identifier)
Degree to which the evidence is
identified as a significant explanation
or influencing factor across a broad
range of evidence
Degree to which the evidence measures
the explanation and is reliable
Degree to which the evidence
contributes to the outcome
of interest across a wide
range of contexts
The evidence is informed by
theory (identifies existing
theories of which it is an
example) and is cast in specific
terms (i.e. it is not vague)
Doc1 weak n/a moderate strong strong
Doc2
4. Confirming and refuting evidence emerging from interview data was assessed by analyzing the impartiality of the informant (to what extent does this person have a vested interest in the subject of the fragment?), knowledge (How much knowledge/experience does the subject have of the subject of the fragment?) and coherency (How coherent is their point? Do they provide evidence?).
216 Lemire, Nielsen and Dybdal, 2012. Making contribution analysis work: A practical framework for handling influencing factors and alternative explanations. Evaluation volume 18: 294.

DRAFT REPORT (VX) – COUNTRY 33
© UNIVERSALIA
Annex Table 3 Strength of evidence assessment - interviews
Fragment
# Interviewee Contribution Claim Position View Impartiality Knowledge Coherency
Use interviewee code
To which contribution claim
does the view stated pertain
Does the viewpoint confirm
or refute the contribution
claim
Give details of the view
of the interviewee given
in the fragment
To what extent does
this person have a
vested interest in
the subject of the
fragment
How much
knowledge/experience does
the subject have of the
subject of the fragment
How coherent is
their point? Do
they provide
evidence?
1 MoE4a A
Interviewee asserts
that CSOs were
involved at all stages
of planning n/a weak weak
2
5. The assessment of plausibility for each contribution claim was then made on the basis of:
• The preconditions of contribution are in place (did the change happen? If not, there could not have been a contribution)
• Where GPE provided inputs or support for this change
• Other support provided outside of the partnership
• Supporting and refuting evidence
• The extent to which the assumptions hold; and
• Logical reasoning

DRAFT REPORT (VX) – COUNTRY 34
© UNIVERSALIA
Annex Table 4 Example of weighing of evidence to support contribution claim plausibility and identification of influencing factors
Contribution claim A: GPE (financial and non-financial) support and influence contribute to the development of government-owned, credible and
evidence-based sector plans focused on equity, efficiency and learning.
Preconditions
GPE
support/inputs
Non-GPE
support/inputs
Supporting
Evidence
Refuting
Evidence Assumption met Assessment Reasoning
What has been
achieved in sector
planning in the
review period
What
(specifically) has
GPE done to
support each of
these
achievements?
What (specifically)
have others done to
support each of these
achievements?
List docs and interviews that
support or refute GPE support
resulted in a contribution
Were the generic
assumptions met
On the basis of the
precondition being
met, GPE inputs and
the evidence, is the
GPE contribution
plausible
What is the overall narrative
for why the contribution is
plausible or not plausible?
Follow up from
year one issue 1
Did GPE input to
address this
issue?
Who else supported
or inputted into this
and how?
Doc 4, 7, 9,
11 etc Doc4
Country level
stakeholders have the
capabilities to jointly
improve sector analysis
and planning
Plausible
A credible quality plan is in
place + it was developed
through inclusive processes +
GPE provided financial
support for plan development
+ GPE provided technical
support which improved the
quality of the plan + most
members of the LEG agree
GPE contributed + the ESPIG
completion reports detail GPE
contributions + plans prior to
becoming a GPE member
were not credible and did not
focus on equity, efficiency and
learning.
Follow up from
year one issue 2
Did GPE input to
address this
issue?
Who else supported
or inputted into this
and how? Doc3 Int3
stakeholders have the
opportunities
(resources, time,
conducive
environment) to do so
Follow up from
year one issue 3
Did GPE input to
address this
issue?
Who else supported
or inputted into this
and how? Int1
stakeholders have the
motivation (incentives)
to do so
ESP is guided by
an overall vision,
is strategic and
holistic
Did GPE input to
this?
Who else supported
or inputted into this
and how? Int3
GPE has sufficient
leverage within the
country to influence
sector planning

DRAFT REPORT (VX) – COUNTRY 35
© UNIVERSALIA
ESP is achievable,
sensitive to
content and pays
attention to
disparities
Did GPE input to
this?
Who else supported
or inputted into this
and how?
EMIS and LASs produce
relevant and reliable
data to inform sector
planning
ESP meets GPE
quality criteria
Did GPE input to
this?
Who else supported
or inputted into this
and how?
Process has been
country-led,
participatory and
transparent
Did GPE input to
this?
Who else supported
or inputted into this
and how?
Other areas of
support

DRAFT REPORT (VX) – COUNTRY
36
© UNIVERSALIA
Mapping Major Donor Funded Projects in NIPEP States
UBE-IF Projects
Jigawa 15
Kaduna 23
Kano 28
Katsina 36
Sokoto 23
NIPEP
USAID (NEI+)
DFID (Teacher Development Program)
World Bank (BESDA)
DFID (PLANE)
Federal Capital
Territory
(Abuja)
Kaduna
Kano
Jigawa
Katsina
Sokoto
UBE-IF Projects
Jigawa 15
Kaduna 23
Kano 28
Katsina 36
Sokoto 23
NIPEP
USAID (NEI+)
DFID (Teacher Development Program)
World Bank (BESDA)
DFID (PLANE)
Federal Capital
Territory
(Abuja)
Kaduna
Kano
Jigawa
Katsina
Sokoto
UBE-IF Projects
Jigawa 15
Kaduna 23
Kano 28
Katsina 36
Sokoto 23
NIPEP
USAID (NEI+)
DFID (Teacher Development Program)
World Bank (BESDA)
DFID (PLANE)
Federal Capital
Territory
(Abuja)
Kaduna
Kano
Jigawa
Katsina
Sokoto
UBE-IF Projects
Jigawa 15
Kaduna 23
Kano 28
Katsina 36
Sokoto 23
NIPEP
USAID (NEI+)
DFID (Teacher Development Program)
World Bank (BESDA)
DFID (PLANE)
Federal Capital
Territory
(Abuja)
Kaduna
Kano
Jigawa
Katsina
Sokoto
UBE-IF Projects
Jigawa 15
Kaduna 23
Kano 28
Katsina 36
Sokoto 23
NIPEP
USAID (NEI+)
DFID (Teacher Development Program)
World Bank (BESDA)
DFID (PLANE)
Federal Capital
Territory
(Abuja)
Kaduna
Kano
Jigawa
Katsina
Sokoto
UBE-IF Projects
Jigawa 15
Kaduna 23
Kano 28
Katsina 36
Sokoto 23
NIPEP
USAID (NEI+)
DFID (Teacher Development Program)
World Bank (BESDA)
DFID (PLANE)
Federal Capital
Territory
(Abuja)
Kaduna
Kano
Jigawa
Katsina
Sokoto
UBE-IF Projects
Jigawa 15
Kaduna 23
Kano 28
Katsina 36
Sokoto 23
NIPEP
USAID (NEI+)
DFID (Teacher Development Program)
World Bank (BESDA)
DFID (PLANE)
Federal Capital
Territory
(Abuja)
Kaduna
Kano
Jigawa
Katsina
Sokoto
UBE-IF Projects
Jigawa 15
Kaduna 23
Kano 28
Katsina 36
Sokoto 23
NIPEP
USAID (NEI+)
DFID (Teacher Development Program)
World Bank (BESDA)
DFID (PLANE)
Federal Capital
Territory
(Abuja)
Kaduna
Kano
Jigawa
Katsina
Sokoto

DRAFT REPORT (VX) – COUNTRY
37
© UNIVERSALIA
List of consulted individuals
In total 49 stakeholders were consulted from the federal level and from Kano state during the 2019 country visit. This is in addition to 62 stakeholders consulted across Kaduna, Sokoto and the federal level in 2018. This report then relies on evidence gathered from 111 stakeholders across three of the five NIPEP states, and the federal level. Of the 111 consulted, 27 are female, and 84 are male. Data collection at the federal level was hampered in 2019 by civil unrest in the area surrounding the Federal Ministry of Education, which led to the cancellation of a number of interviews.
Annex Table 5 - Stakeholders Consulted during 2019 Country Visit
ORGANIZATION LAST NAME, FIRST
NAME TITLE M/W
Federal level stakeholders
Government
NIPEP FPSU Achede, Joseph National State Project Coordinator M
NIPEP FPSU Olatunji-David, Folake National M&E Officer F
UBEC Mayowa Aleshi Dep.Director, Teacher Education M
Development Partners
The World Bank Adekola, Olatunde Task Team Leader, Education M
USAID Olawale Samuel Manager Education M
USAID Elice Alegbe Dep Team Lead, Education F
DFID F
UNICEF Rose Mary Chief of Education F
Cambridge Education
Pius Elumeze Consultant M
British Council Mohammed Ahmed Director: Society and Governance M
Civil Society
CSACEFA Damian-Mary Adeleke Prog Officer F
CSACEFA Nathaniel Adamu Policy advisor M
CSACEFA Ahanonu Odinakachi Admin Officer M
NERDC Madu, Samuel Research Officer M
Teachers’ Registration Council Nigeria (TRCN)
Josiah Ajiboye
Registrar M
State Level Stakeholders (Kano State)

DRAFT REPORT (VX) – COUNTRY
38
© UNIVERSALIA
ORGANIZATION LAST NAME, FIRST
NAME TITLE M/W
Federal level stakeholders
Government
MoE Musa I Musa Deputy Director PRS M
MoE Abdurrahman Ado Ibrahim UNICEF GEPIII - Component 3 (SBMC strengthening) lead M
SUBEB Mujitapha Aminu Deputy Director PRS - NIPEP Component 3 (M&E) Lead M
MoE Abubakar Nashabaru UNICEF GEPIII - Component 3 (System Strengthening Lead) M
SUBEB Baffa Salah Director School Services - NIPEP Component 1b (ECCD) Lead M
SUBEB Amina Umar Director Social Mobilization - NIPEP component 2c (SBMC training and community mobilisation) Lead F
SUBEB Yakubu M.Ayagi
Deputy Director Teacher training - SUBEB - Lead Person NIPEP Component 1c - Teacher Professional Development M
IQS Board Muhammed Dadoo Dayyano
Director PRS M
MoE Alkasim Nababa Finance Officer - NIPEP M
SBMC Muha Nura Alhassan Sala Chairman
M
SBMC Kabiru Abdullah Warawa Chairman
M
SBMC Masud Shehu Garunmazam Chairman
M
SBMC Sugu Ado Bashir Tarauni Chair
M
SBMC Eniga Salaisu Muhammed Sikudu Chair M
SBMC Abubakar Yaiu Gwale Chair M
SBMC Murtala Abba Shariff Gwale Chair M
SBMC Kabir Ado Juen Gwale Chair M
SBMC Tijjani Haladu Bauaya Kano Chairman F
SBMC Amina Umar SUBEB Lead F
Fagge Special Primary Jamila Isah Farah Head Teacher M
Fagge Special Primary
Uba Muhammed Ibrahim Assistant Head M
Fagge Special Primary Babangida Ibrahim Sidi Examination Officer M
Fagge Special Primary Tijjani Haladu Bauaya SBMC Chairman M

DRAFT REPORT (VX) – COUNTRY
39
© UNIVERSALIA
ORGANIZATION LAST NAME, FIRST
NAME TITLE M/W
Federal level stakeholders
Fagge Special Primary Halima Tijjani ECCD Teacher M
Jaen Special Primary
Abba Suleiman Muhammed Head Teacher M
Jaen Special Primary Usman Ali Bayi SBMC Member M
DPs
DFID Nafisa Ado Kano State Director F
Cambridge Ed. TDP State Project Director M
Civil Society and Teachers’ Unions
High Level Women Advocates
Ladidi Sani Fagge Founder F
Community Development Initiative/CSACEFA
Kabir Hamisu Kura Executive Director (former Kano CSACEFA Chair) M
National Union of Teachers
Muhammed Abubakar Hambali
Kano State Chairman M
Kano State PTA Salisu Dan Hassan Kano state chair/National Vice President M
Annex Table 6 - Stakeholders consulted during 2018 country visit
ORGANIZATION LAST NAME, FIRST NAME TITLE (AND DEPARTMENT) M/F
National Stakeholders
GPE Nigeria Dhar, Subrata GPE Country Lead M
NIPEP SPSC Waworo, Fati Jigawa State Project
Coordinator
F
NIPEP SPSC Lawal, Halima Katsina State Project
Coordinator
F
NIPEP SPSC Yabo, Aminu Musa Sokoto State Project
Coordinator
M
NIPEP SPSC Nutta, Abdusshakur A. Kano State Project Coordinator M
NIPEP SPSC Datturu, Musa Kaduna State Project
Coordinator
M
NIPEP FPSU Achede, Joseph National State Project
Coordinator
F

DRAFT REPORT (VX) – COUNTRY
40
© UNIVERSALIA
NIPEP FPSU Olatunji-David, Folake National M&E Officer F
Teachers’ Registration Council
Nigeria (TRCN)
Ezeankwukwe, Jacinta Assistant Director, Education
Accreditation
F
Federal Ministry of Finance Onabanjo, Remi Director, Social Services M
Federal Ministry of Finance Lawal, Usman M
Federal Ministry of Education Mrs Aribaoye Director, Basic Education F
NERDC Unungu, Paul Director NERDC Board M
NERDC Otaru, Bernard Research Officer M
NERDC Madu, Samuel Research Officer M
Federal Education Quality
Assurance Services
Mbaakaa, Jonathan Director M
UBEC Iro, Umar Director, Special Projects M
Development Partners, Donors and Private Sector
The World Bank Adekola, Olatunde Task Team Leader, Education M
USAID Harris-Hussein, Croschelle Education Office Director F
USAID Olawale, Samuel Education Program Manager M
DFID Eshoe Eigbike Education Advisor F
MacArthur Foundation Olaide, Oladayo Head, Nigeria Office M
Civil Society
CSACEFA Kabiru, Amiru National Moderator M
CSACEFA Okafor, Tochukwu Member M
State level Stakeholders (Kaduna and Sokoto)
NIPEP Sokoto SPSU Sabo, Aminu Musa State Project Coordinator M
NIPEP Sokoto SPSU Sani, Umar Member M
NIPEP Sokoto SPSU Amanana, A.B. Member M
NIPEP Sokoto SPSU Salisu, Ibrahim Member M
NIPEP Sokoto SPSU Gacadian, Mamuda Deputy Project Coordinator M
NIPEP Sokoto SPSU Haruna, Aliyu Member M
NIPEP Sokoto SPSU Abubakar, Maimuna Member F
NIPEP Sokoto SPSU Umar, Husaina Member F
NIPEP Sokoto SPSU Abdumalik, Ahmad Member M

DRAFT REPORT (VX) – COUNTRY
41
© UNIVERSALIA
NIPEP Sokoto SPSU Auwal, Ibrahim Member M
NIPEP Sokoto SPSU Garba, Yusuf Member M
NIPEP Sokoto SPSU Mulid, Sambo EMIS and Communications M
Sokoto State Ministry of
Education
Madawaki, Aisha Honourable Commissioner F
Sokoto State Ministry of
Education
Abubakar, Muhammad
Sambo
M
Sokoto SUBEB Bello, Yusuf Executive Chairman M
Sultan Maiturare Nizzamiyya
Primary School
Kabiru, Mohammhed Headmaster M
Sultan Maiturare Nizzamiyya
Primary School SBMC
Mohammad Shehu Chairman M
Sultan Maiturare Nizzamiyya
Primary School SBMC
Sambo Aliyu Member M
Sultan Maiturare Nizzamiyya
Primary School SBMC
Badamasi Buda Member M
Sultan Maiturare Nizzamiyya
Primary School SBMC
Musa, Mansura Member; Women Leader F
Kaduna State Ministry of
Education, Science & Technology
Salisu, A.Y. Director, Planning, Research &
Statistics
M
Kaduna State Basic Education
Board (SUBEB)
Aminu, Ibrahim Acting Director, Socail
Mobilization
M
Kaduna State Basic Education
Board (SUBEB)
Halima Mohammad Director, School Services F
Kaduna State Ministry of
Education, Science & Technology
Sani, Jaafam I Honorable Commissioner M
Kaduna State Ministry of
Education, Science & Technology
Bage, Kande Nana Permanent Secretary F
Kaduna State Ministry of
Education, Science & Technology
Dahuru, Musa Kaduna State NIPEP Project
Coordinator
M
Kaduna State Ministry of
Education, Science & Technology
Jimoh, Musa EMIS Officer M
Lifeline Education Centre Aliu, Ahamad Tijani Director M
Civil Society Organization Dikko, Hauwa F
Sheik Gumi Model Pry School
Tiwada, Kaduna
Larai, Salamatu Salisu Head Teacher F

DRAFT REPORT (VX) – COUNTRY
42
© UNIVERSALIA
Sheik Gumi Model Pry School
Tiwada, Kaduna
Ibrahim, Salisu Teacher M
Maiduguri Road Pry School,
Kaduna
Hassan, Jibring Head Teacher M
Maiduguri Road Pry School,
Kaduna
Atabo, Grace Teacher F

DRAFT REPORT (VX) – COUNTRY
43
© UNIVERSALIA
Education Financing Implications from the Universal Basic Education Act (2004)
Annex Figure 1 - Overview of Structure of education sector financing in Nigeria (From World Bank Public Expenditure Review)
Annex Figure 2 - Key influencing actors in sector financing (taken from ESSPIN review of basic education financing)

DRAFT REPORT (VX) – COUNTRY
44
© UNIVERSALIA
Overview of priorities and strategies from 2015-2017 Medium Term Sector Strategies
Annex Table 7 - Overarching themes of MTSSs 2015-2017
State Overarching MTSS themes
I) Improve the quality and relevance of
basic, secondary and tertiary education
II) Expand basic education coverage,
especially for disadvantaged
groups
III) Provide appropriate non-formal learning opportunities, particularly for
illiterate and hard-to-reach children and
youth
IV) Strengthen government’s
capacity to manage, plan, and monitor
the delivery of education services
more effectively and efficiently
Jigawa Provide 80 percent of
basic schools with
teaching and learning
materials
30 percent of JSS with
libraries, laboratories,
ICT labs and technical
equipment
Reduce parent–teacher ratio from 93:1 to 54:1, and from 45:1 to 30:1 for primary and JSS
Increase GER from 65
percent to 70 percent
at primary and 73
percent to 80 percent
at JSS
Increase gender
parity at primary and
JSS from .43 to .50
Increase number of IQTE schools from 25 to 175
Promote
dissemination of
information to the
public (e.g. EMIS) by
raising proportion of
ICT-trained staff from
50 percent to 65
percent
Produce comprehensive policy review in support of gender IQTE, ICT and private entrepreneurship education
Kaduna Improve student learning outcomes
Recruit new teachers
Train teachers in literacy, numeracy and leadership
Provide textbooks at a 1:1 ratio
Increase enrollment at primary, pre-primary, secondary and tertiary levels
Increase opportunities for students with special educational needs (SEN)
Improve GPI
Improve budget implementation for MTSS priorities
Improve function of LGEAs and education MDAs
Ensure timely availability of data for planning
Kano 85 percent increase in
proportion of primary
Reduce number of
out of school children
by 50 percent
Increase in number of
IQTE schools
Develop realistic
MTSS and annual
action plans
(including

DRAFT REPORT (VX) – COUNTRY
45
© UNIVERSALIA
pupils acquiring
expected RWA skills
Increase primary
enrollment by ~50
percent
Increase GER at junior
secondary from 42
percent to 55 percent
Adult literacy rate reaches 85 percent
development of
EMIS)
Promote teacher/admin capacity building (build libraries)
Katsina Improve physical infrastructure
Recruit new teachers, provide textbooks and materials
Increase enrollment through community enrollment campaigns
Promote equity in enrollment through cash transfers
Build new facilities for students with SEN
Improve accounting capacity
Improve school-level inspections
Improve EMIS capacity
Sokoto “To improve quality
learning outcomes
through enhanced
teacher training
opportunities”
“To ensure that appropriate practices are adapted to meet the needs of all children of school age”
“provide equitable
access and quality
basic education for all
children of school
age”
“Increase and support the inclusion of OOS children, those with special needs and from disadvantaged socio-economic backgrounds”
“Enhance financial and material support to relevant sectors in charge of basic education service delivery” “Establish efficient
management and
standards of
operation for quality
service delivery to
basic education”
“Improve the efficacy
of the policy, planning
and management
framework for
effective education
service delivery
system”
Source: State MTSS documents (direct quotations shown in quotation marks)

DRAFT REPORT (VX) – COUNTRY
46
© UNIVERSALIA
Selected MTSS implementation data (2016/17)
Annex Table 8 - ESP implementation by priority area in each state
State MTSS thematic area
Improve the
quality and
relevance of
basic,
secondary
and tertiary
education
Expand basic
education
coverage,
especially for
disadvantaged
groups
Provide
appropriate
non-formal
learning
opportunities,
particularly
for illiterate
and hard-to-
reach children
and youth
Strengthen government’s capacity to
manage, plan, and monitor the delivery of
education services more effectively and
efficiently
Jigawa Could not
obtain
Could not
obtain
Could not
obtain
Could not obtain
Kaduna Could not
obtain
Could not
obtain
Could not
obtain
Could not obtain
Kano Procurement
of teaching
and learning
materials for
special needs
schools
Procurement
of sports
materials
Payment for
training on
research and
staff
development
in tertiary
education
Books
purchased for
17 divisional
libraries
Conducting of
a community
sensitization
campaign for
pre-primary
and primary
schools
Payment of
examination
fees for
secondary
school
students
Integration of
82 Islamiyya
schools
Mentoring and monitoring of SBMC activities
in secondary
Conducting of ASC
Development of MTSS

DRAFT REPORT (VX) – COUNTRY
47
© UNIVERSALIA
Katsina Recruiting of
1,933 basic
and post-
basic
teachers
Construction
of computer
centers
SUBEB
investment in
teacher
professional
development
Establishment
of new schools
Initiation of
family support
incentives
Development
of more
community
schools
Enrollment
drive
campaign to
engage
communities
in
mainstreaming
out-of-school
children
Adoption of an effective budgeting system
Increased community participation in school
management through SBMC reform
Training of SBMC on school management
issues
Investment in upgrading EMIS facilities and
training EMIS staff
Increase in quality assurance staff
Conducting of ASC
EGRA carried out across all LGEAs
Study on supply and demand of teachers
carried out to assess future resource gaps
Sokoto Training of
over 2,000
teachers, 334
head
teachers and
50 education
managers at
primary level
Training of
250 ECCDE
care fivers
and
education
managers
Rehabilitation
of four
government
Construction
of 75 new
classrooms
and
renovation of
712
classrooms
Training of
2,162 SBMC
members, 13
district heads,
and 65 LGEA
officials to
carry out
enrollment
drives across
23 LGAs
Construction
of new
classrooms at
nomadic
primary
schools
Training of 100 quality assurance officers
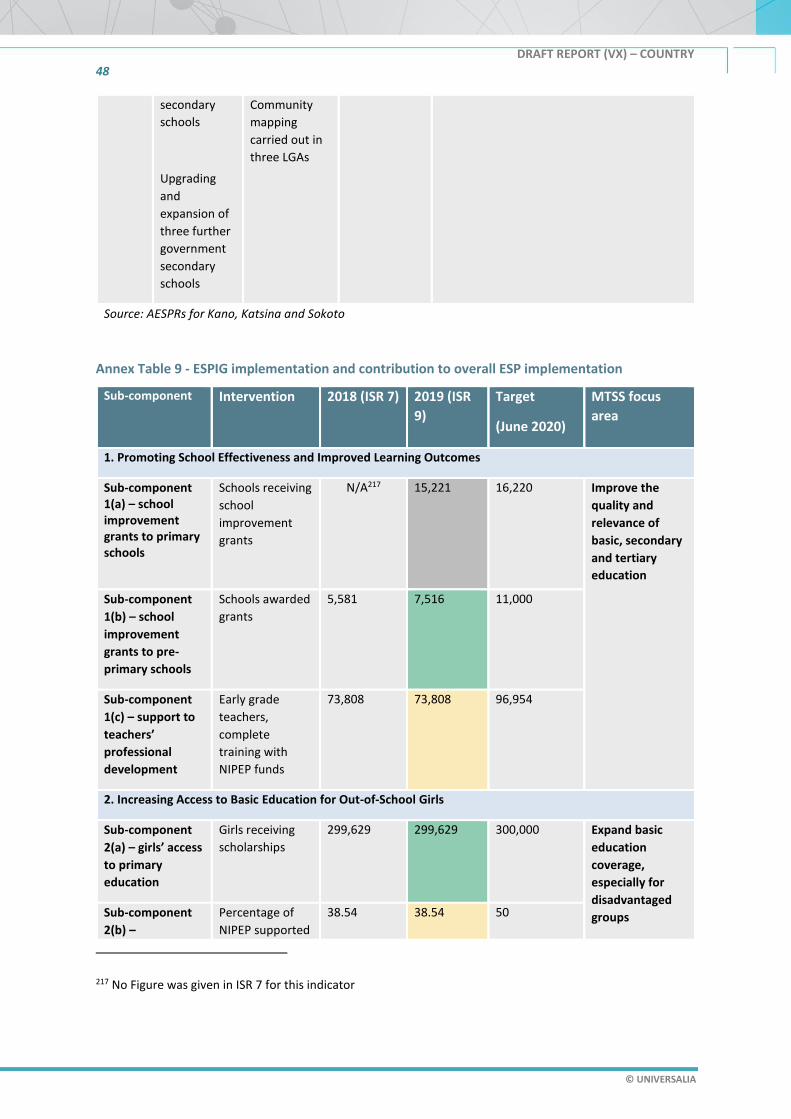
DRAFT REPORT (VX) – COUNTRY
48
© UNIVERSALIA
secondary
schools
Upgrading
and
expansion of
three further
government
secondary
schools
Community
mapping
carried out in
three LGAs
Source: AESPRs for Kano, Katsina and Sokoto
Annex Table 9 - ESPIG implementation and contribution to overall ESP implementation
Sub-component Intervention 2018 (ISR 7) 2019 (ISR
9)
Target
(June 2020)
MTSS focus
area
1. Promoting School Effectiveness and Improved Learning Outcomes
Sub-component 1(a) – school improvement grants to primary schools
Schools receiving
school
improvement
grants
N/A217 15,221 16,220 Improve the
quality and
relevance of
basic, secondary
and tertiary
education
Sub-component
1(b) – school
improvement
grants to pre-
primary schools
Schools awarded
grants
5,581 7,516 11,000
Sub-component
1(c) – support to
teachers’
professional
development
Early grade
teachers,
complete
training with
NIPEP funds
73,808 73,808 96,954
2. Increasing Access to Basic Education for Out-of-School Girls
Sub-component
2(a) – girls’ access
to primary
education
Girls receiving
scholarships
299,629 299,629 300,000 Expand basic
education
coverage,
especially for
disadvantaged
groups Sub-component
2(b) –
Percentage of
NIPEP supported
38.54 38.54 50
217 No Figure was given in ISR 7 for this indicator

DRAFT REPORT (VX) – COUNTRY
49
© UNIVERSALIA
scholarships for
female teachers
female teachers
receiving NCE
scholarship218
Sub-component
2(c) – community
mobilization and
SBMC training
SBMC members
given training
8,635 8,635 12,130 Strengthen
government’s
capacity to
manage, plan,
and monitor the
delivery of
education
services more
effectively and
efficiently
3. Strengthening Planning and Management Systems including Learning Assessment and Capacity
Development
Sub-Component
3(a) –
management and
implementation
support
State level
education actors
engaged in
capacity building
programs
555 (13
events)
- - Strengthen
government’s
capacity to
manage, plan,
and monitor the
delivery of
education
services more
effectively and
efficiently
Sub-component
3(b) – monitoring,
evaluation and
learning
assessment
AESPRs
completed
EMISs in place
Standardized
tests being run
5
5
2
5219
5
2
5
5
2
Source: NIPEP ISR 7. (Jan. 2019) and ISR 8. (June 2019)220
Annex Table 10 - Non-GPE contributions to sector plan implementation in Nigeria
State ESP priority
I) Improve the quality and relevance of basic,
secondary and tertiary education
II) Expand basic education coverage,
especially for
III) Provide appropriate non-formal learning opportunities,
IV) Strengthen government’s capacity to manage, plan, and monitor the delivery
218 The numerator is the number of teachers who receive NIPEP scholarship who either continue with or complete the NCE
course in the following year (year “n+1”). The denominator is the total number of female teachers in that year. 219 It seems that this indicator only measures whether the states have completed the exercise once, not whether they regularly complete it – as none of the five NIPEP states have completed an AESPR since 2017. 220 Figures marked with * are taken from the 2017 NIPEP mid-term review, as no figures were given in the latest ISR.

DRAFT REPORT (VX) – COUNTRY
50
© UNIVERSALIA
disadvantaged groups
particularly for illiterate and hard-to-
reach children and youth
of education services more effectively and
efficiently
Jigawa BESDA (World Bank)221 BESDA (World Bank)
No data BESDA (World Bank)
Kaduna BESDA (World Bank)
BESDA (World Bank)
No data BESDA (World Bank)
Kano BESDA (World Bank) Teachers’ Development Program (DFID) Building the capacity of in-service and pre-service teachers
BESDA (World Bank)
BESDA (World Bank)
Katsina BESDA (World Bank) UNICEF Head teacher trainings, early grade reading interventions, monitoring and mentoring Girls’ Education Project (UNICEF, DFID funding) Improved capacity of teachers to deliver effective learning for girls Reading and Numeracy Activity (FHI 360) Improving Hausa literacy and numeracy instruction at the primary level Teachers’ Development Program (DFID) Building the capacity of in-service and pre-service teachers VSO Building the capacity of teaching and learning of sciences through mobile science laboratories
BESDA (World Bank) UNICEF Community mapping and support for increased enrollment Girls’ Education Project (DFID) Increased access to and demand for girls’ education Educate a Child Project Supports out-of-school children through surveys and cash transfers
BESDA (World Bank) UNICEF Supported establishment of EMIS Conducting ASCs Training and capacity building for SBMC/CBMC Development of SESP and MTSS Girls’ Education Project (UNICEF, DFID funding) Improved governance to strengthen girls’ education
Sokoto USAID Northern Education Initiative Plus Implementation of an early grade reading program in half of LGAs,
BESDA (World Bank)
USAID Northern
Education Initiative
Plus
BESDA (World Bank)
221 BESDA has not yet become operational, but will operate in the five NIPEP states, and aims to improve educational outcomes, primarily through the implementation of a payment for results framework, focusing on directing UBEC funding more effectively to improve educational quality and sector accountability, and reduce the number of out-of-school children. For more details see the BESDA PAD: http://documents.worldbank.org/curated/en/839251498183393835/pdf/BESDA-PAD-May-30-2017-06012017.pdf

DRAFT REPORT (VX) – COUNTRY
51
© UNIVERSALIA
with materials and approach adopted by UNICEF in other parts of the state BESDA (World Bank) Girls’ Education Project (UNICEF, DFID funding) Improved capacity of teachers to deliver effective learning for girls
Oando Foundation
Adopt-A-School
Training 266
headteachers; Provided
instructional materials for
three schools; Renovation
of one primary school
DFID/UNICEF
Girls’ Education
Program
Provision of
furniture and
learning materials
for primary
schools
Disbursement of
grants for school
upkeep to SBMCs
at ECCDE level
Oando
Foundation
Adopt-A-School
Scholarships for
78 pupils to
complete basic
education
Established 700 non-
formal learning
centers, 100
adolescent girls
learning centers, and
100 youth learning
centers
Training for
facilitators at 1,500
centers, and for 59
master trainers
Feed the Future
Development of 35
non-formal education
centers to train
farmers in basic
literacy and
numeracy

DRAFT REPORT (VX) – COUNTRY
52
© UNIVERSALIA
Appraisal of 2013-2015 medium term sector strategies
Annex Table 11 - Appraisal of 2013-2015 MTSSs
Very satisfactory Satisfactory Room for improvement
Education plan development process
Education plan preparation process
JG, KD, KN, KT222 SK
Stakeholders’ engagement
JG, KD KN, KT, SK
Education plan Education sector analysis JG, KT KD, KN, SK
Plan design
Policy priorities
JG, KN, KD, KT, SK
Program design and prioritization of strategies
JG, KN, KD, KT, SK
Plan financing JG, KN, KD, KT, SK
M&E JG, KN, KD, KT, SK
Development and financing of an action plan
JG, KN, KD, KT, SK
Appraisal of implementation readiness
System capacity JG, KN, KD, KT, SK
Governance and accountability
JG, KN, KD, KT, SK
Risks to implementation and mitigation
JG, KN, KD, KT, SK
Source: 2013 GPE appraisal document
222 JG = Jigawa, KN = Kano, KD = Kaduna, SK = Sokoto, KT = Katsina.

DRAFT REPORT (VX) – COUNTRY
53
© UNIVERSALIA
Updated Strategies for Emergent MTSSs/SESPs
Annex Table 12 - Strategies of new (2018 onwards) Sector Plans in NIPEP states
State Current Cycle
Jigawa No new plans
Kaduna 1. Access and Equity a. Ensure increase in access, retention and completion rates at all levels
2. Quality relevance and internal efficiency a. Improve learning achievement and teaching quality
3. Infrastructure a. Ensure Adequate infrastructure at every level
4. Management and Efficiency a. Improve EMIS b. Improve M&E systems c. Improve Teacher Motivation d. Ensure efficient implementation of policies
5. Sustainable funding for Education
Kano 1. Equitable Access 2. Education Quality 3. Technical And Vocational Education and Training 4. Information and Communication technology 5. Education Management information systems 6. Entrepreneurial studies 7. Security, Safety in Schools 8. Education Finance 9. Education Planning and Management 10. Library Service in Education
Katsina 1. Increase level of access, coverage and inclusiveness
2. Improved quality and relevance
3. Improved level of infrastructure
4. Improved system efficiency
5. Improved sustainable funding and adequate resourcing
Sokoto No new plans

DRAFT REPORT (VX) – COUNTRY
54
© UNIVERSALIA
Nigeria sector financing data
ISSUE DATA
DOMESTIC FINANCING
Total domestic educ. expenditure No data available223
Education share of total government Expenditures No data available
% of domestic education financing allocated to Basic education No data available
Funding by expenditure type (salary, non-salary recurrent, investment)
No data available
INTERNATIONAL FINANCING
Total ODA (all sectors) during review period from 2011 to 2017 Between 2011 and 2017 ODA to Nigeria equalled US$ 18.23 billion224 within this, the amount of ODA increased by 57 percent from US$ 1.78 billion per year, to US$ 3.47 billion per year. Of the US$ 15.7 billion 39 percent came from DAC countries, 61 percent came from multi lateral organizations – with a marginal amount coming from other sources.
Total amount of ODA to education from 2011 to 2017 Between 2011 and 2017 ODA to education equalled US$ 1.006 billion. With this the amount for education increased from US$ 127 million to US$ 172 million per year
Education ODA as share of overall ODA from 2011 to 2017 Slight Decrease from 7 percent in 2011 to 5 percent in 2017
Total amount of ODA to Basic Education from 2011 to 2017 Between 2011 and 2017 ODA to basic education equalled US$ 211.67 million with the yearly amount increasing from US$ 23.53 million in 2011 to US$ 55.31 million in 2017
223 While figures are available for the FMoE budgets, the SMoE budgets and UBEC-IF disbursements – this does not constitute the total domestic education spend – as it excludes the federal transfers to LGEAs to pay teachers, as well as locally generated revenues at the LGEA level. It is clear that there is a significant gap between the funding that is reported, and the total funding for education – an issue which has been consistently cited as holding back planning and accountability in the sector. The figures that are available are reported in the sector financing section of this report. 224 All figures for ODA are taken from OECD-DAC CRS figures for gross disbursements in 2017 constant US$

DRAFT REPORT (VX) – COUNTRY
55
© UNIVERSALIA
ISSUE DATA
DOMESTIC FINANCING
Basic Education ODA as share of total education ODA from 2011 to 2017
Increase from 18 percent to 32 percent
ESPIG amount as share of education ODA during review period 9 percent in 2016 and 7 percent in 2017225
ESPIG amount as share of financing required to fill the ESP funding gap at time of approval
According to the ESPIG application – the ESPIG would cover 2.69 percent of MTSS funding across the five NIPEP states226
ESPIG amount as % of total estimated/expected ESP financing No data available227
ESPIG amount at % of actual ESP financing (if data is available) No data available
225 This is based on the World Bank Implementation Status and Results reports (ISR) from June 2019. While more recent disbursement figures for NIPEP are available – the CRS, at the time of writing had not published ODA figures for 2018. 226 This figure is reported in the ESPIG application – but in interviews with the teams who worked on the application it is clear that this figure is mostly an estimate. No costings were included in any of the MTSSs – and there is very little idea of what the cost of implementation would be. 227 There is no clear paradigm for donors to “fund the ESP” in any of the states in Nigeria – all donor support (even when aligned to fiduciary processes) is completely unaligned with any sector planning.

DRAFT REPORT (VX) – COUNTRY
56
© UNIVERSALIA
OECD-DAC Tables for Nigeria (National)
All data in 2017 Constant US$ gross
disbursements
2011 2012 2013 2014 2015 2016 2017 2011-
2017
Total ODA for Education by Donor Type
Official Donors, Total 127.23 135.88 138.78 131.50 143.32 156.79 172.98 1006.4
9
DAC Countries, Total 67.07 72.11 80.05 76.34 82.06 99.21 109.16 586.00
Multilaterals, Total 60.05 62.95 58.61 54.96 60.58 57.11 63.56 417.82
Non-DAC Countries, Total 0.11 0.82 0.12 0.21 0.68 0.47 0.26 2.67
Total ODA for Education by Individual Donor
World Bank Group 52.60 56.47 51.89 47.30 51.31 50.97 61.26 371.80
Canada 21.12 35.01 42.58 18.60 66.60 35.14 76.33 295.38
United Kingdom 34.38 44.99 50.97 35.66 44.61 43.29 43.49 297.38
United States 12.11 9.05 12.58 8.73 13.50 26.62 26.73 109.32
Germany 7.49 6.96 7.90 9.97 11.28 13.95 15.99 73.53
Japan 2.56 2.10 1.85 13.85 0.90 1.95 2.26 25.47
France 5.29 3.20 3.10 3.09 3.22 2.98 3.46 24.32
Norway 0.01 .. .. 1.22 2.48 3.18 8.32 15.20
Korea 2.07 2.87 2.16 1.17 2.74 2.52 4.18 17.70
UNICEF 2.50 1.39 1.75 3.11 2.11 3.06 2.30 16.21
Total ODA for Education by Sub-Sector
Education, Level Unspecified, Total 55.40 43.57 40.33 76.77 54.91 61.15 55.62 387.75
Education policy and administrative
management
40.11 39.84 33.12 42.61 34.89 46.29 29.24 266.09
Education facilities and training 10.66 2.26 2.41 16.17 3.56 1.17 2.12 38.34
Teacher training 4.62 1.47 1.84 2.73 1.44 1.67 7.10 20.86
Educational research 0.00 0.00 2.97 15.27 15.02 12.03 17.17 62.45
Basic Education, Total 23.53 24.78 35.44 12.13 22.44 38.05 55.31 211.67
Primary education 22.62 23.56 32.07 11.39 22.02 37.83 52.00 201.50
Basic life skills for youth and adults 0.82 1.16 3.07 0.59 0.33 0.07 3.23 9.28
Early childhood education 0.09 0.06 0.30 0.15 0.08 0.14 0.07 0.89

DRAFT REPORT (VX) – COUNTRY
57
© UNIVERSALIA
Secondary Education, Total 13.81 23.97 36.90 28.43 39.60 24.66 21.62 188.99
Secondary education 12.83 18.61 21.37 10.81 17.08 7.94 -3.12 85.52
Vocational training 0.98 5.36 15.53 17.62 22.52 16.72 24.74 103.47
Post-Secondary Education, Total 34.50 43.57 26.10 14.17 26.37 32.93 40.43 218.08
Higher education 29.24 36.23 21.61 11.78 23.67 31.99 38.56 193.09
Advanced technical and managerial
training
5.27 7.33 4.49 2.39 2.70 0.94 1.87 24.99
Annex Table 13 - Breakdown of Planned Expenditure for Kaduna MTSS 2018-2020
Kaduna MTSS 2018-2020 Priority Area Funding 2018-2020 Proportion of total
Increase level of access, coverage and
inclusiveness
26.43 18%
Improved quality and relevance 19.85 13%
Improved level of infrastructure 66.78 45%
Improved system efficiency 5.52 4%
Improved sustainable funding and adequate
resourcing
29.62 20%
Total expenditure 148.20 100%

DRAFT REPORT (VX) – COUNTRY
58
© UNIVERSALIA
Selected system-level country data
Changes suited to remove barriers to equitable access to education ISSUE OBSERVATIONS
Changes in # of schools relative to # of children
No data available
Changes in average distance to school
No data available
Changes in costs of education to families
Basic education is free in Nigeria – however parents and communities contribute significantly to school budgets through the SBMC and PTA structures – which are based on the school improvement plans produced each year. There is no robust data available on what the average contribution from families is – and how payments are designed/collected varies between schools.
Changes in availability of programs to improve children’s readiness for school
No data available
New/expanded measures put in place to meet the educational needs of children with special needs and learners from disadvantaged groups
None recorded. Data on the number and status of Children with Special Educational needs is non-existent across Nigeria, making the development of provisions for education for these students very difficult. A proportion of UBEC funding is ear-marked for students with special educational needs – but there is little data to show how this money is spent, or how effective it is at reducing disparities.
The home-grown school feeding program in Nigeria is designed to support access to education for the poorest and most marginalised. While data on the efficacy of this program is not available it has been successfully rolled out by UBEC across the country.
New/expanded measures put in place to further gender equality in education
The use of allowances to incentivize families to support education for girls has become institutionalized in north-western states since it was introduced by DFID and UNICEF’s Girls Education Program (GEP). While girls’ scholarships are still partly funded by NIPEP – State governments have also taken on expanding and supporting the scholarship program.
Changes suited to remove barriers to quality education
ISSUE OBSERVATIONS
Changes in Pupil/teacher ratios (basic education)
No data available
Changes in pupil/trained teacher ratio
No data available
Changes in equitable allocation of teachers (measured by relationship between number
No data available

DRAFT REPORT (VX) – COUNTRY
59
© UNIVERSALIA
of teachers and number of pupils per school
Changes in relevance and clarity of (basic education) curricula
NERDC is tasked with delivering curriculum reform, and has produced some new curricula related to ECD and psycho-social skills. However, research and distribution of syllabi is hampered by a reliance on donor funding, and a lack of human resources
Changes in availability and quality of teaching and learning materials
Materials Ideally as pupil/textbook ratio, but also qualitative data if no ratios available and on quality of materials
Changes to pre-service/in-service teacher training
The teacher development program in Jigawa, Kaduna and Kano have made significant improvements in how teachers are trained, recruited and managed. This has been done by working to support teacher training colleges, the teacher registration council, and the work of school support officers to develop the TMIS to better track teacher professional development needs/activities
Improvement in school inspection and oversight
The improvements made to the role of the school support officer show a positive trend towards greater support and oversight for teachers and school leadership. SSOs regularly visit schools and are tasked with supporting the professional development of teachers – which is to be tracked using a newly created digital TMIS. This change has largely been pushed forwards by TDP – but in collaboration with SUBEBs and teacher training colleges.
Progress in strengthening sector management ISSUE OBSERVATIONS
Changes in the institutional capacity of key ministries and/or other relevant government agencies (e.g. staffing, structure, organizational culture, funding)
Relationships between the two key bodies in education at federal (UBEC and FMoE) and state level (SMoE and SUBEB) as well as other decision-making bodies (the governor’s office and department of budgets and planning at the state level) present the key challenge to the Nigerian education sector. A lack of properly organised decision-making protocols, and diffusion of responsibility means that decisions at state level are made on an ad-hoc basis, and are therefore overly reliant on political will on the behalf of the governor.
The key moment of change was the introduction of the UBE act in 2004, but since then little has been done to address the obvious inefficiencies of the system in place. The establishment of the NEG addresses alignment with donors, but is not inclusive of government bodies and parastatals – meaning that it doesn’t necessarily improve sector governance.
All national level fora for dialogue have failed to adequately include state level actors – with no clear solution for the sheer number of potential actors (including state ministers, Permanent Secretaries, commissioners for education and SUBEB chairs would mean at least 144 state representatives, without any representation from non-SUBEB parastatals). No new solutions are currently in discussion, and no reform of the system in sight.

DRAFT REPORT (VX) – COUNTRY
60
© UNIVERSALIA
ISSUE OBSERVATIONS
Introduction of a national Learning Assessment System
While NALABE has been carried out periodically by UBEC (with the 2017 results due to be released in 2019) it is not considered to be a robust learning assessment, and is not well integrated into state level policymaking. There is now a national movement to introduce a National Learning Assessment – to provide a single method for capturing learning quality data from across states.
This effort is being coordinated by the Federal Ministry of Education with support from the World Bank’s BESDA program, and NIPEP (through component 3 funding for EMIS and learning assessments). There are still serious question marks about how this will be implemented nationally, and whether its results will be taken seriously by federal and state governments – particularly as state governments would be under no obligation to take on its findings.
Regardless of the challenges faced – the fact that an assessment has been designed and is ready to implement is a significant step forward and should be viewed positively.
Function of and Improvements to the EMIS system
EMIS data is theoretically collected by all bodies working in education (FMoE, SMoE and parastatals) and collated by the monitoring evaluation departments in the state ministries of education – who compile the annual school census. The national EMIS (NEMIS) should concurrently collect and verify data.
DFID’s ESSPIN was pivotal in the establishment of the annual school census program in its focal states (of which Jigawa, Kaduna and Kano are also NIPEP focus states). In these states the compilation of the ASC has continued, with support from NIPEP – but serious concerns remain about the quality of data.
Since ESSPIN there have been no notable changes in how data is collected, beyond what data individual donor funded projects have collected.
Changes in how country uses EMIS data to inform policy dialogue, decision making and sector monitoring
Data is not regularly used to inform decision making. The development of a national Education Sector Analysis – which is currently taking place is designed to help change this, by providing a national analysis and benchmarks which states can frame discourse around. At state level – where most decisions are made – data is not reliable enough to well inform decision making, and the dislocation between different implementing bodies further compounds the issue.
A good example of this has been the difficulty in designing a policy for integrating IQS – as the official data doesn’t recognise the existence of out of school children (only looking at the enrolled population) or provide any accurate representation of how many unregistered schools exist.

DRAFT REPORT (VX) – COUNTRY
61
© UNIVERSALIA
ISSUE OBSERVATIONS
Strengthening of school governance and school-based management committees
Policy was introduced at the federal level to mandate the creation of school-based management committees (SBMCs) in all schools nationally. Initially this mandate was poorly defined and little consistent action was taken at state level.
In 2012 this was kickstarted in six states by DFID’s Education Sector Strengthening Project in Nigeria (ESSPIN) – which developed a structure and terms of reference for SBMCs in a limited number of Local Government Areas. This model and process was scaled up by government and other donor partners in the ESSPIN states and eventually across most states in Nigeria. While it is not possible to talk nationally about the effectiveness or function of the SBMCs – they have made key improvements in accountability at the school level, in advocating for more community funding of education, and in supporting improvements in access and quality of education. SBMCs are managed by an LGA and a state chair – who coordinate across schools.
Registration of Private and IQS The number of unregistered private and IQS in northern Nigeria is a serious governance issue. While progress towards registration has been slow in the north – some improvements have been made in recent years. Currently a number of states are undergoing surveys of IQS to determine how many exist, and how many would be eligible for integration. Kano state is furthest along in this process – having discerned a figure for total number of unregistered schools – and working with UNICEF (through GEP III) setting targets of 420 schools to be integrated in the next year. The challenge across states is making funding available for the newly integrated schools to provide them with improved facilities and new teachers to address the integrated curriculum.

DRAFT REPORT (VX) – COUNTRY
62
© UNIVERSALIA
Selected impact-level country data
Impact level trends
Generally, use UIS data as a starting point. If country-level sources provide differing/additional information, provide both (if necessary, add a third column, so we would have one for trends as per UIS data, and one for trends as per differing/additional or more recent county or other documentation)
ISSUE OBSERVED TRENDS (UP TO AND INCLUDING DURING REVIEW PERIOD)
Learning outcomes
Changes/trends in learning outcomes (basic education) during period under review (by gender, by socio-economic group, by rural/urban locations)
While there is no reliable representative learning assessment either nationally or individual states, data can be synthesised from a variety of project samples (using control groups where possible).
Doing this shows a general stagnation or decline in the level of learning in schools. DFID’s ESSPIN carried out learning assessments on a sample of schools in 6 states228 with results showing a general decline in grade two literacy and numeracy levels between 2012 and 2016.
Across states the number of students reading at grade level fell from 25 percent to 10.8 percent in grade two and 19 to 12.2 percent in grade four.
For mathematics, similar figures were seen with those numerate to grade level falling from 25.2 to 12.3 percent in grade two but rising from 6.7 to 8.1 percent at grade 4.
228 Jigawa, Kaduna, Kano, Kwara, Lagos and Enugu

DRAFT REPORT (VX) – COUNTRY
63
© UNIVERSALIA
ISSUE OBSERVED TRENDS (UP TO AND INCLUDING DURING REVIEW PERIOD)
Equity, gender equality and inclusion
Changes in (i) gross and (ii) net enrollment rates (basic education including pre-primary) during review period (by gender, by socio-economic group, by rural/urban
State Level: GER and NER are measured by state Annual school census. Poor methodological rigour229 means that this data is at best unreliable. Figures for both GER and NER are regularly reported as being 100 percent or over – considering the widely cited fact that most states in north have OOS rates between 30 and 50 percent, the ASC data must be considered completely unreliable on matters of enrollment.
National Level230: UIS data for GER shows rates increasing between 2009 and 2013 and then decreasing between 2013 and 2016. For primary school GER rose from 85 percent to 90 percent in 2013, before falling to 84 percent in 2016. Secondary GER rose from 39 percent to 56 percent in 2013 before falling to 41 percent in 2016. Enrollment rates for pre-primary/ECD are only available for 2009 and 2010 but shows GER for ECD in 2010 to be 42 percent.
Gender parity index of enrollment National Level: GPI for UIS figures on enrollment show a general upward trend for GPI of GER at both primary and secondary level. At secondary level GPI has moved from .87 in 2009 to .9 in 2016, while at primary level GPI has increased from .9 to .94 – showing that now GER at both levels lies within the acceptable range set out in the GPE RF231
Changes in (i) primary completion rate and (ii) lower secondary completion rate (by gender)
i) The most reliable data on PCR comes from MICS there is a marked deterioration in Primary Completion Rate between in 2011 and 2017 (from 94.3 percent to 68.5 percent). In the north west the rates bucked this trend, increasing marginally from 54.6 to 57.1 percent. All NIPEP states saw small decreases except for Kaduna where rates increased from 55 percent to 79 percent.
ii) No Reliable data available.
229 It was anecdotally reported to the evaluators that in the absence of a population comparator from which to calculate NER, the number of enrolled students was compared to spot checks on the number of students in school – leading to NER figures of above 100 percent (which is a logical impossibility). 230 Data from UIS is patchy for Net Enrollment Rates (GER) - with data available for primary school for 2009 and 2010 - but better for Gross Enrollment (GER)
231 .88 to 1.11
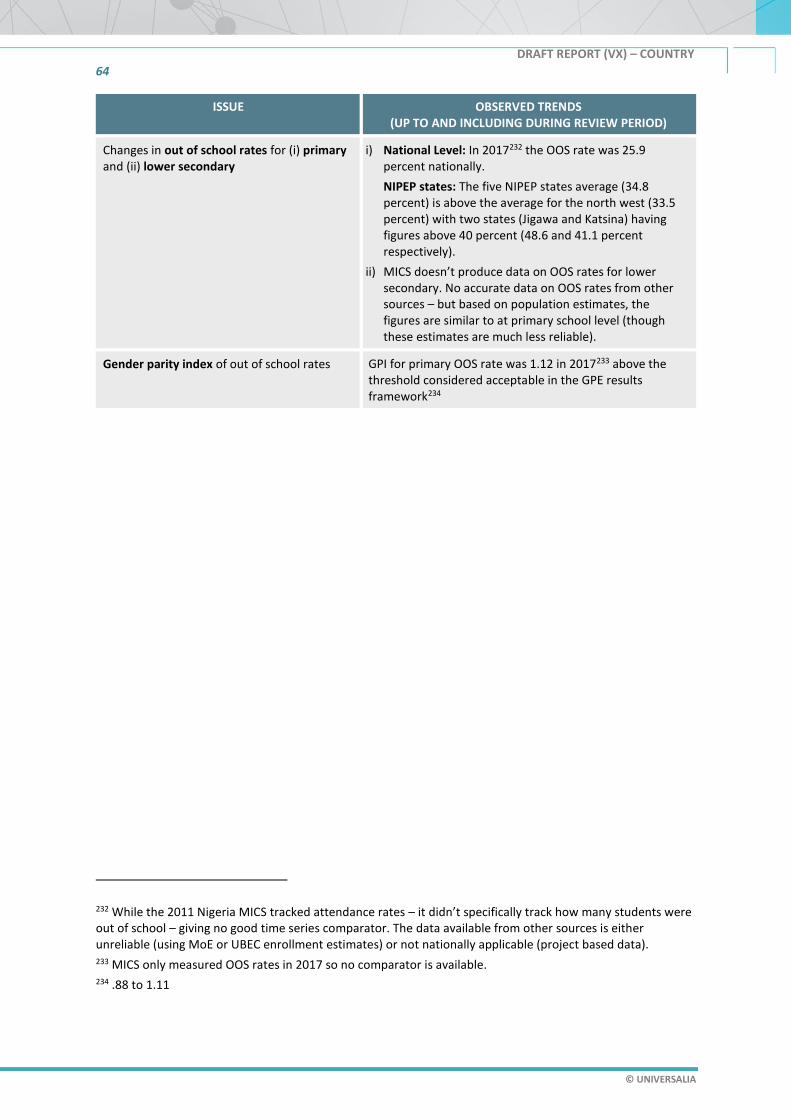
DRAFT REPORT (VX) – COUNTRY
64
© UNIVERSALIA
ISSUE OBSERVED TRENDS (UP TO AND INCLUDING DURING REVIEW PERIOD)
Changes in out of school rates for (i) primary and (ii) lower secondary
i) National Level: In 2017232 the OOS rate was 25.9 percent nationally.
NIPEP states: The five NIPEP states average (34.8 percent) is above the average for the north west (33.5 percent) with two states (Jigawa and Katsina) having figures above 40 percent (48.6 and 41.1 percent respectively).
ii) MICS doesn’t produce data on OOS rates for lower secondary. No accurate data on OOS rates from other sources – but based on population estimates, the figures are similar to at primary school level (though these estimates are much less reliable).
Gender parity index of out of school rates GPI for primary OOS rate was 1.12 in 2017233 above the threshold considered acceptable in the GPE results framework234
232 While the 2011 Nigeria MICS tracked attendance rates – it didn’t specifically track how many students were out of school – giving no good time series comparator. The data available from other sources is either unreliable (using MoE or UBEC enrollment estimates) or not nationally applicable (project based data). 233 MICS only measured OOS rates in 2017 so no comparator is available. 234 .88 to 1.11

DRAFT REPORT (VX) – COUNTRY
65
© UNIVERSALIA
ISSUE OBSERVED TRENDS (UP TO AND INCLUDING DURING REVIEW PERIOD)
Changes in the distribution of out of school children (girls/boys; children with/without disability; ethnic, geographic, urban/rural and/or economic backgrounds depending on data availability)
National Level
By geographic zone235: As with most indicators the OOS rates are highest in the North West (33.5 percent) and North East (37.5 percent) – and lowest in South East (7.7 percent) South West (11.7 percent) and South South (8.5 percent)236.
Urban/Rural: The OOS rate for urban children is much lower (at 12.6 percent) then it is for rural children (33 percent)237.
Wealth Index Quintile: The gap between OOS rates is significant between poorest and richest quintiles. The rate for the poorest quintile is 53.6 percent in 2017, and 8.5 percent for the richest quintile238.
Changes in transition rates from primary to lower secondary education (by gender, by socio-economic group)
National Level
According to MICS data, transition rates239 decreased significantly between 2011 and 2017 – falling from 74 percent to 48.9 percent240. GPI for transition fell in the same period from .99 to .94.
NIPEP States
In contrast to the national level MICS figures, completion rates in the north west rose between 2011 and 2017 – from 54.6 percent to 57.1 percent. The NIPEP states averaged slightly more than this, and in most cases increased slightly over the period. Kaduna exceptionally rose from 55 percent to 79 percent while Sokoto fell from 73.2 percent to 18.7 percent.
235 Beyond its federal division, Nigeria is broadly divided into six geopolitical zones: South South, South West, South East, North West and North Central – with all NIPEP states being in the North West zone. For further details see https://www.researchgate.net/figure/Map-of-Nigeria-showing-the-six-6-geopolitical-zones-For-interpretation-of-the_fig1_51795009 236 Data taken from UNICEF Multiple Indicator Cluster Survey 2017 237 Data taken from UNICEF Multiple Indicator Cluster Survey 2017 238 Data taken from UNICEF Multiple Indicator Cluster Survey 2017 239 MICS defines transition rates as the comparison between enrollment in secondary 1 in one year and enrollment in primary 6 in the previous year. 240 While the figures in MICS seem remarkable, there is no data to triangulate against to verify whether these figures are either accurate or inaccurate. They are presented here as accurate, as the MICS methodology is independent and robust.

DRAFT REPORT (VX) – COUNTRY
66
© UNIVERSALIA
ISSUE OBSERVED TRENDS (UP TO AND INCLUDING DURING REVIEW PERIOD)
Changes in dropout and/or repetition rates (depending on data availability) for (i) primary, (ii) lower-secondary education
No data is available either at state or national level on repeat or drop out rates.
Enrollment in unregistered IQS and Private Education
Currently there is no data available on the current state of enrollment in unregistered IQS or private schools. The most recent data, is the unpublished survey of unregistered IQS in Kano state, which found 13,250 schools – but has not yet gotten enrollment figures for these schools. Currently the students enrolled in these school and any other unregistered schools will be counted by EMIS and UIS data as out of school241
241 On this count MICS is not clear – as it is a household survey, children who are in un-registered schools should be counted as in school. This is not made clear in the methodological briefs for the MICS in 2011 or 2017.

DRAFT REPORT (VX) – COUNTRY
67
© UNIVERSALIA
Impact Level Data Tables
Annex Table 14 - Education Indicators from UNICEF Multiple Indicator Cluster Survey (2011 & 2017)
Male Female Jigawa Kaduna Kano Katsina Sokoto N West
Early Childhood
Education
2011 42.3 43 10 32.2 9.4 8.6 15.4 14
2017 35.7 35.4 11.1 51.1 18.1 17.6 4.6 19.5
Development Index 2011 31.9 32.8 10.4 27.3 5.7 6.9 24 12
2017 28.4 30.3 13.8 32.9 15.6 10.5 4.3 14.6
Female Literacy
(15-24)
2011
65.6 18 48.3 40.7 27.1 28.3 31.6
2017 59.3 24.8 54.4 46.1 32.6 20.1 38
Male Literacy (15-
24)
2011
2017 70.9 32.3 65.2 72.5 62.6 47.4 57.5
School Readiness 2011 45.2 44.5 2 13.6 41.1 1 4.1 18.9
2017 39.7 38.8 10.3 30.5 23.8 15.9 8.3 20.3
Net Intake Rate
(Primary)
2011 45.8 41.7 30.8 35.2 35.2 29.8 17.4 28.7
2017 39.8 38.9 24 39.6 35.4 42.6 27 32.5
Net Attendance
Ratio (primary)
2011 72 68 43.5 74.2 57.7 49 35.5 50.4
2017 62.6 59.2 38.6 66.5 54.8 56.8 32 49.1
OOS Rate (Primary) 2011
2017 26.5 27.9 44.7 24.2 20.8 34.8 29.9 29.9
Net Attendance
Ratio (Secondary)
2011 54.2 54.3 22.9 53.4 44.5 29.9 16.9 34.4
2017 47.4 46.2 19.6 44.1 18 36.4 16.7 33.5
OOS Rate
(Secondary)
2011
2017 24.4 27.3 48.6 29.7 21.5 41.1 33.1 33.5
Survival Rate
(Primary)
2011 97.4 97.3 98.1 99.7 99.7 99.7 100 98.4
2017 95.5 92.7 94.4 94.1 93.6 84.3 93.4 91.2
Primary Completion
Rate
2011 94.3 76.9 64.6 55 60.6 58 73.2 54.6
2017 68.5 57.7 68.3 79 56.9 65.5 18.7 57.1
Transition Rate (P-
S)
2011 74.2 73.8 53.4 74.2 59.7 50 26 61
2017 50.4 47.4 8.6 56.7 39.7 33.9 12.1 36
GPI for Net
Attendance Ratio
2011 0.94 0.81 1.07 0.85 0.79 0.83 0.88
2017 0.95 0.93 0.9 1 0.9 1 0.8

DRAFT REPORT (VX) – COUNTRY
68
© UNIVERSALIA
2009 2010 2011 2012 2013 2014 2015 2016 2017 2018
Secondary education
Gross enrollment ratio (%)
Total 39.21 44.2 45.54 47.16 56.18 45.6 46.76 41.98
Female 36.43 41.17 41.87 44.93 53.49 42.98 44.65 39.8
Male 41.91 47.13 49.09 49.32 58.78 48.13 48.8 44.08
GPI .87 .87 .85 .91 .91 .89 .91 .90
Net enrollment rate (%)
Total
Female
Male
Primary education
Gross enrollment ratio (%)
Total 85.35 85.07 90.62 92.04 94.07 90.06
84.7
Female 80.6 80.92 87.4 90.8 92.84 89.38
82.18
Male 89.93 89.08 93.72 93.23 95.25 90.71
87.13
.90 .91 .93 .97 .97 .99 .94
Net enrollment rate (%)
Total 64.31 64.1
Female 57.84 58.07
Male 70.55 69.92
Pre-Primary Education
Gross enrollment ratio (%)
Total 40.59 41.81
Female 37.01 41.46
Male 44.02 42.14
Net enrollment rate (%)
Total
Female
Male

DRAFT REPORT (VX) – COUNTRY
69
© UNIVERSALIA