prospects for the world jute industry wbg number...
TRANSCRIPT
SCP-14
Prospects for the World Jute Industry WBG
M. Elton Thigpen and Takamasa Akiyama
WORLD BANK STAFF COMMODITY WORKING PAPERSNumber 14
C.hokel BoF omirH k l-001
Pub
lic D
iscl
osur
e A
utho
rized
Pub
lic D
iscl
osur
e A
utho
rized
Pub
lic D
iscl
osur
e A
utho
rized
Pub
lic D
iscl
osur
e A
utho
rized
WORLD BANK STAFF COMMODITY WORKING PAPERS
1. The World Tin Economy: An Econometric Analysis (out of print)
2. International Cotton Market Prospects
3. An Econometric Model of the World Rubber Economy
4. Industrial Processing of Natural Resources
5. The World Sugar Economy: An Econometric Analysis of Long-term Developments
6. World Bank Commodity Models (2 volumes)
7. Analysis of the World Coffee Market
8. Analysis of the World Cocoa Market
9. The Outlook for Primary Commodities
10. World Rubber Market Structure and Stabilisation: An Econometric Study
11. The Outlook for Primary Commodities, 1984 to 1995
12. The Outlook for Thermal Coal
13. Jute Supply Response in Bangladesh
WORLD BANK STAFF COMMODITY WORKING PAPERSNumber 14
Prospects for the World Jute Industry
M. Elton Thigpen and Takamasa Akiyama
The World BankWashington, D.C., U.S.A.
Copyright CC 1986The International Bank for Reconstructionand Development / THE WORLD BANK
1818 H Street, N.W.Washington, D.C. 20433, U.S.A.
All rights reservedManufactured in the United States of AmericaFirst printing January 1986
This is a document published informally by the World Bank. In order that theinformation contained in it can be presented with the least possible delay, thetypescript has not been prepared in accordance with the procedures appropriate toformal printed texts, and the World Bank accepts no -, sponsibility for errors. Thepublication is supplied at a token charge to defray part of the cost of manufacture anddistribution.
The World Bank does not accept responsibility for the views expressed herein, whichare those of the author(s) and should not be attributed to the World Bank or to itsaffiliated organizations. The findings, interpretations, and conclusions are the resultsof research supported by the Bank; they do not necessarily represent official policy ofthe Bank. The designations employed, the presentation of material, and any maps usedin this document are solely for the convenience of the reader and do not imply theexpression of any opinion whatsoever on the part of the World Bank or its affiliatesconcerning the legal status of any country, territory, city, area, or of its authorities, orconcerning the delimitation of its boundaries or national affiliation.
The full range of World Bank publications, both free and for sale, is described in theCatalog of Publications; the continuing research program is outlined in Abstracts ofCurrent Studies. Both booklets are updated annually; the most recent edition of each isavailable without charge from the Publications Sales Unit, Department T, The WorldBank, 1818 H Street, N.W, Washington, D.C. 20433, U.S.A., or from the EuropeanOffice of the Bank, 66 avenue d'1lna, 75116 Paris, France.
M. Elton Thigpen and Takamasa Akiyama are economists in the Commodity Studiesand Projections Division of the World Bank.
Library of Congress Cataloging-in-Publication Data
Thigpen, M. Elton, 1932-Prospects for the world jute industry.
(World Bank staff commodity working paper,ISSN 0253-3537 ; no. 14)
Bibliography: p.1. Jute industry. I. Akiyama, T. (Takamasa),
1944- . II. Title. III. Series.HD9156.J7T45 1986 338.4'767713 85-31467ISBN 0-8213-0701-0
- iii -
ABSTRACT
Prospects for the world jute industry to the mid-1990s are analyzedto identify trends likely to follow the confusion in the jute market originat-ing from the 1984/85 fiber supply crisis. These prospects are derived fromanalysis of information obtained from surveys of jute demand in severalcountries and from simulation results from a recently built econometric modelof the world jute economy.
Jute fiber is used primarily as a textile raw material for makingpackaging products, carpets, industrial fabrics and twine. Its main demandbase is derived from the need to package agricultural inputs and produce incountries where storage and distribution to wholesale and retail markets is inpackaged form. Structural changes occurring in the world demand for jute areidentified. Prospects for the expansion of jute consumption for packaginguses in developing countries are fairly bright since the scope for earlychanges to bulk-handling and synthetic substitution are limited.
The rapid loss of markets for jute sacks and bags to bulk handling inthe industrial countries and grain-exporting developing countries during the1970s has about run its course. So have the losses of fabric markets wheresynthetic products held distinct advantages in technical performance or cost.The resulting structural shifts in the regional distribution of consumptionand changes in the product composition of final demand suggest that the growthin world demand for jute to the mid-1990s should be somewhat higher than wasattained during the 1970s and early 1980s.
The sharp output decline in India and Bangladesh in 1984 appears tohave started another price/supply cycle. On past performance it is likelythat the high prices of 1984/85 will lead to large output increases in the1985/86 and 1986/87 harvests causing prices to fall and leading to a period oflow prices and low output in the late 1980s.
- iv -
ACRONYMS AND ABBREVIATIONS
BWD - Bangladesh White Grade D Raw JuteCBC - Carpet Backing ClothCPEs - Centrally Planned Economies of Eastern Europe and USSREPDCS - Economic Analysis and Projections Department
Commodity Studies and Projections Divisionfob - Free On BoardFAO - Food and Agriculture OrganizationGNP - Gross National ProductMT - Metric Tonoz. - ounceP.A. - Per AnnumSq. Yds. - Square YardsUSSR - Union of Soviet Socialist Republic% - Percent$ - United States Dollar
CONVERSION FACTORS
I maund = 37.326 kg1 bale = 18t) kg = 4.822 maunds1 long ton = 1.016 metric ton
TABLE OF CONTENTS
ABSTRACT............................................................ iii
ACRONYMS AND ABBREVIATIONS........ ............. ........................... iv
LIST OF TABLES. ..................................................... vii
LIST OF FIGURES .................. ... viii
I. INTRODUCTION AND SUMMARY ........................ .................... I
II. ASSUMPTIONS IN KEY EXOGENOUS VARIABLES .............................. 6
III. JUTE PRODUCTION: RECENT TRENDS AND PROSPECTS... ..................... 8
Future Prospects for Jute Production........................... 11
IV. WORLD DEMAND FOR JUTE: RECENT TRENDS ............................... 17
V. ANALYSIS OF DEMAND FOR JUTE: BY COUNTRIES AND REGIONS.oO... NS...0..0 26
Industrial Countries.... ... o.. ..out ri........... o....es..e... 26
ad North A 27b. Western Eart peopee..........*............ 31Co3aa 38do utai 41
Developing Countriesa....o.o.....o..o......................... 43
as B p ndlthesSSR.l a d e sh.. . .. . . . . . . o. . ... oo ... . 43be ondia 44c.ohi ln 45d.oai sa 46e Cia47f. Near Eat48g.ofrc 49h. Latin Amerca..... 50
Brazil ~~~~~~~~~~~~~~~51Cuba ~~~~~~~~~~~~~~~52
Eastern Europe and the USSSSRooo.oooosooooeee 52
Rest of the Worrld. 54
- vi -
TABLE OF CONTENTS
Annex I: AN ECONOMETRIC MODEL FOR THE WORLD JUTE ECONOMY ............... 57
The Demand Block ......... ...... ... 58The Supply Block ......... ...... ... ......... 62Stocks and Prices ................................... O ... 66
Price Linkages CFLTUIO IN ..E WORL .JUT MRE......... 70
Annex II: ANALYSIS OF PRICE FLUCTUATIONS IN THE WORLD JUTE MARKET. T.. 72
REFERENCES: ... ... 00000.0.. 79
- vii -
LIST OF TABLES
Table
Table 1: Average Historical and Projected Jute Consumption and GrowthRates in Major Countries and Regions......**................ 4
Table 2: Major Exogenous Variable Growth Assumptions 1983 to 1995 ..... 7
Table 3: Jute Production in Major Countries ....... . ...... .... 10
Table 4: Average Historical and Projected Jute Production andGrowth Rates in Major Producing Countries*r........ e..*.... 14
Table 5: Jute Fiber and Product Imports 1981-83 and Implied ImportRequirements to Meet Projected Demand in 1993-95.............. 16
Table 6: Jute Goods Production by Type of Products .................... 17
Table 7: Jute Goods Production and Shares by MajorProducing Countries.*.. .. e.......... 18
Table 8: Jute - Apparent Consumption and Shares by Major ConsumingCountries/Regions..o..o.. .......................... .... ..... 20
Table 9: Jute Goods Exports by Origin. ............................. 22
Table 10: Projected Average Jute Consumption 1993-95 Compared toActual Average 1981-83 and Growth Rates 1970-82 and1981-83 to 1993-95 ........ .................... 55
Table 1.1: Elasticities with Regard to the Agricultural ProductionIndex, GNP and Time Trend .... .. .... ....... ............. 60
Table I.2: Short and Long Term Own-Price Elasticitiesof Demand for Jute..................................... 61
Table I.3: Elasticity Relationships between Producer Prices, WorldJute Prices, and Domestic Jute Production........o..o..o.. 70
Table I.4: Elasticity Relationships between the BWD F.O.B. Raw JutePrice and Jute Goods Prices..r. *.*# ............. o. .o. .o.*oo 71
Table 11.1: Indices of Fluctuations in World Jute Productionand Demne...m.............ndooo.s 75
Table II.2: Indices of Supply Fluctuations in Major ProducingCountries and World: 1972-1982 .............................. 75
- viii -
LIST OF TABLES
Table
Table II.3: Deviations of Jute Stocks from their Averages forPeriod 1965/66-1982/83: World, India and Bangladesh......... 76
Table II.4: Correlation Coefficients of the Deviations in Jute Stocksfrom their Averages for the Period 1965/66-1982/83:World, India and Bangladesh. ............ . . . . . .............. . .. ...... 77
LIST OF FIGURES
Figure 1: Jute Production in Major Countries and the World............. 12
Figure I.l: Movements of Calculated World Stocks & the Sum of StocksHeld in India & Bangladesh. . . .. . . . . .. s... . . . . ... . . . . . . . . . . . . . . 68
Figure II.1: Movements of Implied World Stocks & the Real Jute ProducerPrice in Bangladesh ............................. .............. 73
- 1 -
I. INTRODUCTION AND SUMMARY
The world jute economy was severely shocked in 1984 when dry weather
during the sowing period, combined with very serious flooding during the
growing season, reduced jute production in Bangladesh and India to well below
growers' intended levels. The impact of the production shortfall on the jute
market was particularly strong because the stocks accumulated through 1979/80
had been liquidated during the next three years of relatively low prices and
output. As a result, with sharply reduced supplies faced with inelastic
short-term demand, raw jute prices climbed to record levels before export
sales by private traders were banned by the two largest fiber exporting
countries, Bangladesh and Thailand. In view of the ensuing disarray in the
jute market, an assessment of jute's medium and long-term outlook is of
particular importance at this time.
In this paper, prospects for the world jute industry to the mid-1990s
are presented in the light of information obtained from surveys of jute demand
in several countries and from simulation results of an econometric model
recently built at the World Bank. The regional and global prospects are
presented along with a description of the underlying assumptions and an
analysis of their implications. A description of the jute model is contained
in Annex I. Annex II contains an analysis aimed at identifying causes of
instability in the jute economy.
The key jute variables are projected to fluctuate rather widely in
response to the extremely tight supply position reached during 1984/85 and the
resulting record nominal prices. A sharp production decline in both India and
- 2 -
Bangladesh in 1984 thus appears to have started another price/supply cycle. 1/
Typically, the response to current price levels would carry through at least
to the next two crops in the major producing countries. The fiber
supply/demand imbalance in 1983/84 should result in attractive producer prices
for the 1985/86 crop, which should, in turn, encourage grower efforts to pro-
duce a second consecutive large crop in 1986/87. Barring disastrous weather,
large crops during those two years will exceed consumption requirements,
restore stocks and cause prices to fall to more moderate levels. On past per-
formance it would be most unusual, however, if the response of jute production
to the shock of current high prices did not lead to an overshooting of demand,
providing the conditions for another cycle of low prices and production in the
late 1980s. Based on historical levels of response, the simulations indicate
that the accumulation of excess stocks could cause real jute prices to decline
to around $250 per ton by 1988/89. Such a price level would again make jute
growing less attractive relative to rice and reduce jute production. Barring
further weather-induced shocks, the simulations indicate that the cyclical
movements should continue, with another real price peak of around $400 per ton
in 1991/92. The long-run average real prices necessary to stimulate production
to the level of projected demand appears to be around $300-$330 per ton, in
terms of 1984 US dollars, basis BWD, f.o.b. Bangladesh.
There are promising prospects that world demand for jute will grow
faster over the next decade than the rate achieved during 1970-82, due to
structural shifts in the regional distribution of consumption and changes in
1/ As discussed in detail in Annex II, world jute price fluctuations aremainly caused by supply fluctuations in Bangladesh and India.
- 3 -
the product composition of final demand in the industrial countries. Even so,
the direction of trends is expected to change in only a few countries/regions.
The expectation for improved growth in jute consumption derives from the
circumstances which resulted in jute's sharp losses during the 1970s having
about run their course. For example, the technical performance and cost
advantages of synthetic substitutes for jute primary carpet backing for tufted
carpets and for cotton bale covers under United States trading conditions have
reduced jute's share of these uses to only marginal proportions. On the other
hand, jute's outstanding performance in secondary carpet backing has increased
the share of this product in the total demand for jute in the industrial
countries and the expected future growth of secondary carpet backing should
offset some of the further decline expected in the use of other jute products-
-moderating the rate of decline in overall jute consumption in North America,
Western Europe and Japan.
The other major cause of erosion in jute demand in recent years was
the rapid adoption of bulk-handling methods for grains and materials formerly
packaged in jute bags. This transition is virtually complete in the industrial
countries and in the major grain-exporting developing countries. Growth in
demand for jute sacking and wrapping fabrics is still favorable in the jute-
producing countries and in the agricultural producing countries where storage
and distribution to wholesale and retail markets is in packaged form. Con-
sidering these changes in the geographical distribution and product
composition of jute consumption, world demand is projected to grow at an
average of 1.4% per year from 1981-83 to 1993-95 compared to 0.9% per year in
the 1970-82 period (Table 1).
- 4 -
Table 1: AVERAGE HISTORICAL AND PROJECTED JUTE CONSUMPTION ANDGROWTH RATES IN MAJOR COUNTRIES AND REGIONS
Countries/ ConsunpLtion Growth RatesRegions 1969-71 1981-83 1989-91 1993-95 1981-83 TO
1970-82 1993-95
---------('000 tons) --------- ---(% per annum)---
Industrial 1,224 580 529 479 -6.0 -1.5North America 515 193 178 164 -8.1 -1.4West Europe 506 235 203 168 -5.6 -2.7Japan 107 71 63 57 -2.5 -1.8Australia/ 96 81 85 90 1.6 0.9New Zealand
Developing 1,823 2,655 3,159 3,391 3.1 2.1
Producers 1,190 1,902 2,431 2,639 3.8 2.8
Bangladesh 46 106 133 149 8.8 2.9Brazil 45 74 72 73 3.5 -0.1China 386 501 680 690 1.5 2.7India 622 1,053 1,350 1,530 5.0 3.2Thailand 61 124 145 141 5.2 1.1Others 30 44 51 56 3.2 2.0
Importers 633 753 728 752 1.5 0.0Africa 220 169 157 164 -1.4 -0.3Cuba 51 72 62 74 5.6 0.2Near East 140 262 247 252 4.5 -0.3Pakistan 60 109 145 161 5.4 3.3Others 162 141 117 101 -1.2 -2.7
CPEs 225 314 323 339 1.7 0.6
World 3,272 3,549 4,111 4,209 0.9 1.4
Source: Historical Data, FAO; Projections, Economic Analysis and ProjectionsDepartment, World Bank.
The projected increase in demand for jute is seen to be largely
generated by the need to package agricultural inputs and produce in the jute-
producing countries, as well as Pakistan and the USSR. India and China are
expected to account for most of the projected increase in demand for jute.
Increases in domestic production should be enough to meet their demand growth
leaving combined annual export supply at around 200-300,000 tons.
Simulation results from the jute model indicate that Bangladesh will
be next in importance to India in meeting the projected increase in world
demand for jute. A comparison of the jute production and consumption projec-
tions indicates that most of the increase in production in Bangladesh will be
available for export as fiber and manufactured products. Export supplies (both
fiber and manufactured products) from Bangladesh during the mid-1990s are
projected to rise to around one million tons per year.
World import requirements in the mid-1990s are expected to total
around 1.1 million tons of jute goods (fiber equivalent) and over 400,000 tons
of jute fiber. The estimated volumes of imports of hessian, sacking, carpet
backing and fiber required by each region are presented in Table 5. The
product break-down is based on past trends, expected further shifts in market
requirements and continuation of import policies that discriminate against
trade in manufactured products. In general, carpet backing is expected to
account for an increasing share of jute requirements in the industrial
countries. Many developing countries could meet their jute product require-
ments at lower cost by importing manufactured goods, but such a shift is being
discouraged by escalating tariff structures.
-6-
II. ASSUMPTIONS ON KEY EXOGENOUS VARIABLES
Some of the key variables that impact on the jute economy and assump-
tions regarding their growth prospects to the mid-1990s are presented in
Table 2.
Among these exogenous, variables the polypropylene resin price is the
most important one in terms of its impact on the jute market. Polyolefin
plastics, mainly polypropylene and polyethylene, challenge jute products for
market share in each major jute end-use. Polypropylene is the single most
important synthetic substitute for jute. It is a product of the petrochemical
industry, its resin form being derived by the polymerization of propylene. The
derivation of its feedstock from the petroleum and gas industries links its
prospects to the outlook for these industries. Polypropylene's potential com-
petitiveness is also greatly influenced by recent technical developments in
manufacturing processes and the third generation of catalysts. These cost-
efficient processes and materials are being rapidly adopted and will add to
the near-term weakness of feedstock costs to keep polypropylene substitute
products highly cost-competitive with jute goods. The assumption in the model
is that the real prices of the synthetic resin and products will remain at the
1984 level in the projection period. The impact of anticipated higher feed-
stock costs on real prices of resin and products in the first half of the
1990s is expected to be fully offset by the industry-wide adoption of the new
process technologies.
The model-generated projections of jute demand and real prices take
into account this competition from synthetic substitutes. The competition
between jute and polypropylene has been most severe in the industrial and
grain-exporting developing countries and jute consumption is projected to
continue declining in those regions, although at a slower rate than in the
-7 -
1970s. In most developing countries the demand base for jute products is the
production of packagable agricultural commodities. The jute consumption
projections for developing countries, except for India and Pakistan, reflect
growth rates slower than anticipated agricultural output, reflecting addi-
tional use of synthetic substitutes and modest increases in bulk handling
facilities. In India and Pakistan jute sacking is used for industrial as well
as agricultural packaging and the industrial area is where the greatest losses
to synthetic competition are anticipated. Although jute demand in those two
countries are projected to increase at about the same pace as agricultural
production, the loss of market share in industrial packaging will reduce jute
demand growth well below the rate achieved during the 1970s.
The nature of the competition from synthetics suggest that viable
marketing strategies for jute should place strong emphasis upon enhancing the
quality of jute goods, adapting jute products to meet specific end uses,
increasing the efficiency of jute manufacturing and marketing in order to
strengthen jute's price competitiveness and searching for new properties in
jute products that can be applied to new end-uses.
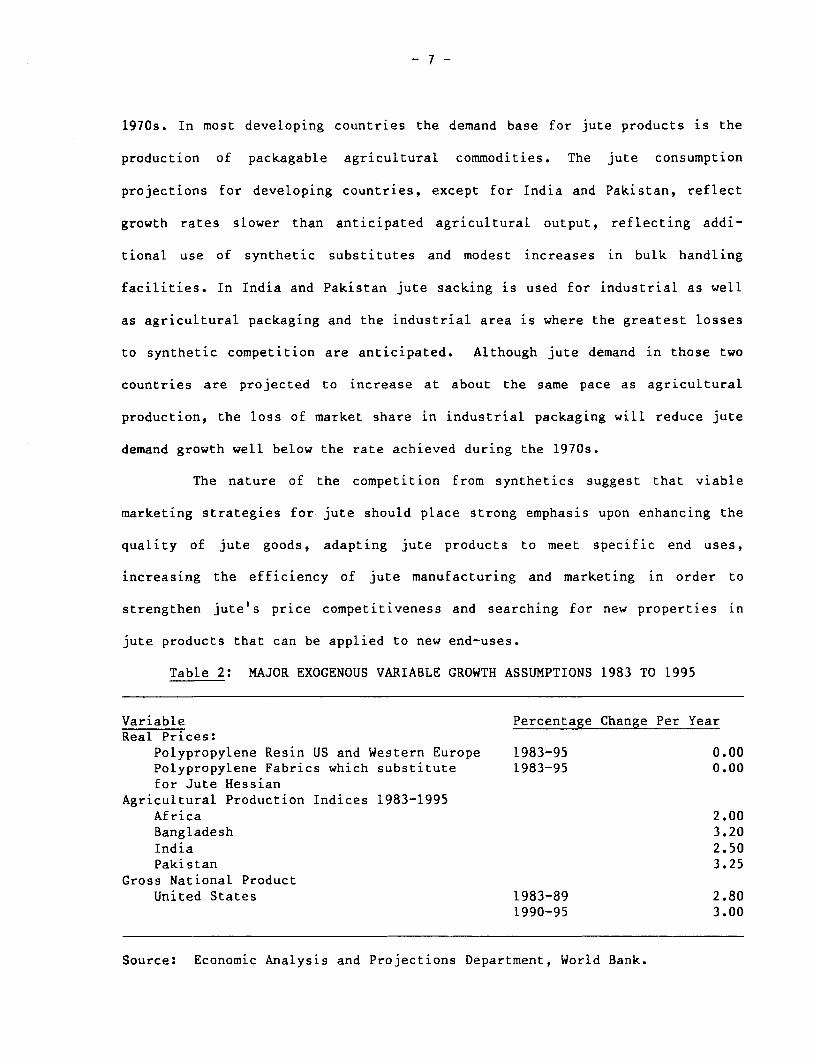
Table 2: MAJOR EXOGENOUS VARIABLE GROWTH ASSUMPTIONS 1983 TO 1995
Variable Percentage Change Per YearReal Prices:
Polypropylene Resin US and Western Europe 1983-95 0.00Polypropylene Fabrics which substitute 1983-95 0.00for Jute Hessian
Agricultural Production Indices 1983-1995Africa 2.00Bangladesh 3.20India 2.50Pakistan 3.25
Gross National ProductUnited States 1983-89 2.80
1990-95 3.00
Source: Economic Analysis and Projections Department, World Bank.
- 8 -
III. JUTE PRODUCTION: RECENT TRENDS AND PROSPECTS
Jute 1/ has been grown in Bengal and other areas for centuries. It is
an annual plant which grows best in hot, damp climates. It requires relatively
large amounts of agricultural labor for cultivation and industrial labor for
processing into a variety of products. The jute plant contains a bast fiber
that is separated from the stem and bark after retting in water. Although over
30 species are known, only two, Corchorus capsularis (white jute) and
Corchorus olitorius (tossa jute) are widely grown.
Jute production is centered in Asia, with the four major producing
countries--Bangladesh, China, India and Thailand--accounting for 92% of world
output during 1981-83. Another 2% of world output was in Latin America,
mostly in Brazil. In South Asia, jute is produced mainly by subsistence
farmers as a cash crop in competition for land with food crops, primarily rice
(paddy). The acreage devoted to jute cultivation is quite responsive to
changes in relative prices of jute and paddy at the farm level and, hence, to
each crop's expected contribution to net profitability of the farm operation.
In addition to relatively large shifts in jute acreage, year-to-year
variations in production are also caused by changes in yields due to seasonal
differences in growing conditions. Both flooding and, to a lesser extent,
drought are hazards to jute growing. The quality of jute fiber is also
strongly influenced by the availability and quality of retting water used to
prepare the plant for separation of the fiber from the stem and bark. Jute
I/ In this report, jute includes similar fibers such as kenaf (grownprincipally in Thailand), malva (grown in Brazil) and mesta (grown inBangladesh and India) which are used mainly in the manufacture of sacksand bags.
-9-
sticks--the wood stem from which the fiber is separated--are about twice the
weight of the fiber. Historically, jute sticks have been used for such
household purposes as firewood, fencing and roofing and were of substantially
lower value than the fiber. More recently, jute sticks have been a source of
wood fiber for making paper. This use, combined with the increasing scarcity
of firewood in producing areas, has raised the value of sticks relative to the
value of the fiber.
Although jute production is concentrated in a few countries, crop
developments in these countries have been diverse. Prior to the 1950s, more
than half of the world's supply was produced in the area now constituting
Bangladesh and nearly one-third was grown in India. At that time Indian mills,
concentrated in the Calcutta area, accounted for about one-half of world
consumption and mills in Western Europe accounted for about one-fifth of the
total. The expansion of jute production from the mid-1950s to the mid-1960s
centered on the efforts made by India to achieve self-sufficiency in produc-
tion and on the emergence of Thailand as an important exporter of fiber.
Average yields remained stagnant during that period and nearly aLl the
expansion in production resulted from increased jute acreage. World production
of jute grew very slowly (0.4X per annum) over the period 1961-82, despite a
surge in production in China (Table 3). I/
1/ Caution is indicated since Chinese production estimates are derived fromcombined production statistics for jute and ambry hemp.
- 10 -
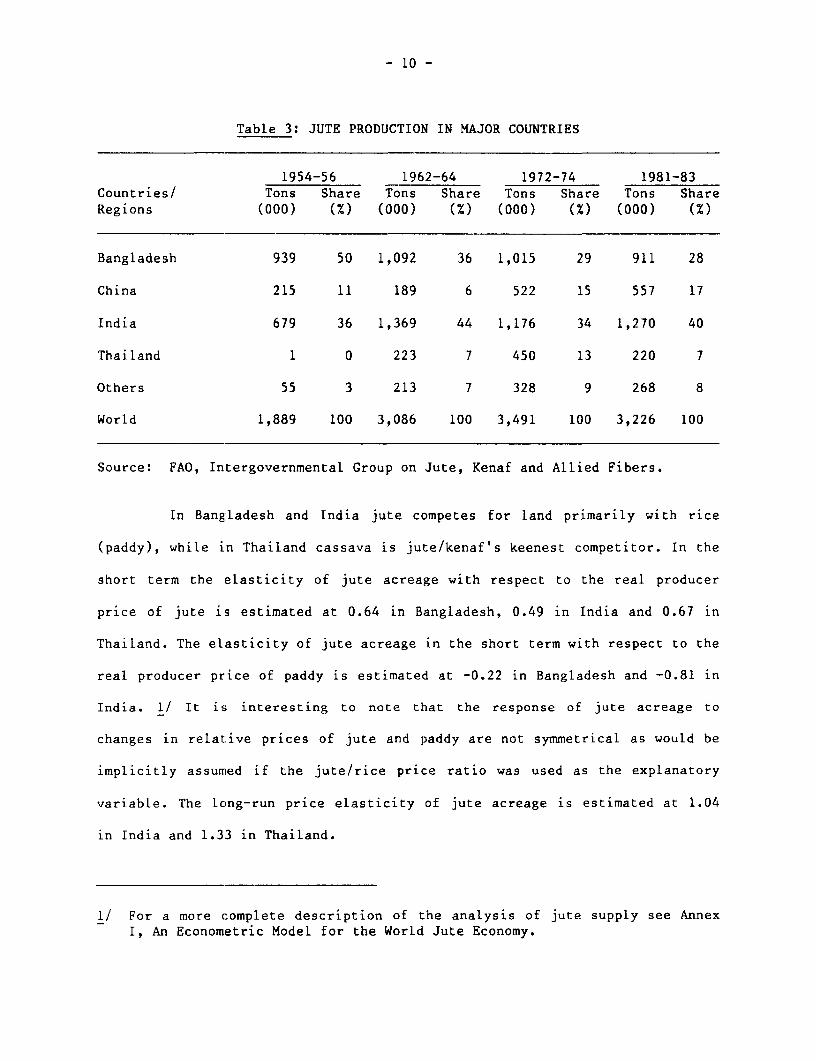
Table 3: JUTE PRODUCTION IN MAJOR COUNTRIES
1954-56 1962-64 1972-74 1981-83Countries/ Tons Share Tons Share Tons Share Tons ShareRegions (000) (%) (000) (%) (000) (%) (000) (M)
Bangladesh 939 50 1,092 36 1,015 29 911 28
China 215 11 189 6 522 15 557 17
India 679 36 1,369 44 1,176 34 1,270 40
Thailand 1 0 223 7 450 13 220 7
Others 55 3 213 7 328 9 268 8
World 1,889 100 3,086 100 3,491 100 3,226 100
Source: FAO, Intergovernmental Group on Jute, Kenaf and Allied Fibers.
In Bangladesh and India jute competes for land primarily with rice
(paddy), while in Thailand cassava is jute/kenaf's keenest competitor. In the
short term the elasticity of jute acreage with respect to the real producer
price of jute is estimated at 0.64 in Bangladesh, 0.49 in India and 0.67 in
Thailand. The elasticity of jute acreage in the short term with respect to the
real producer price of paddy is estimated at -0.22 in Bangladesh and -0.81 in
India. 1/ It is interesting to note that the response of jute acreage to
changes in relative prices of jute and paddy are not symmetrical as would be
implicitly assumed if the jute/rice price ratio was used as the explanatory
variable. The long-run price elasticity of jute acreage is estimated at 1.04
in India and 1.33 in Thailand.
1/ For a more complete description of the analysis of jute supply see AnnexI, An Econometric Model for the World Jute Economy.
- 11 -
Jute production is determined by both the area harvested and yields
per unit of land. While jute area is influenced by growers' expectation of
jute's relative profitability, yields are influenced substantially by crop
husbandry and seasonal growing conditions. Farmers' efforts in crop husbandry
may be partly determined by their expectations of profitability of jute
growing, but they have no control over seasonal conditions; drought and
flooding periodically have dramatic effects on jute yields. Therefore, jute
production is subject to wide fluctuations from one season to the next due to
variable growing conditions. As a result, world supply fluctuations are
sometimes pronounced. This is especially so for the proportion of total jute
supply that enters international trade since the production fluctuations are
highly correlated in the two most important jute fiber and goods exporting
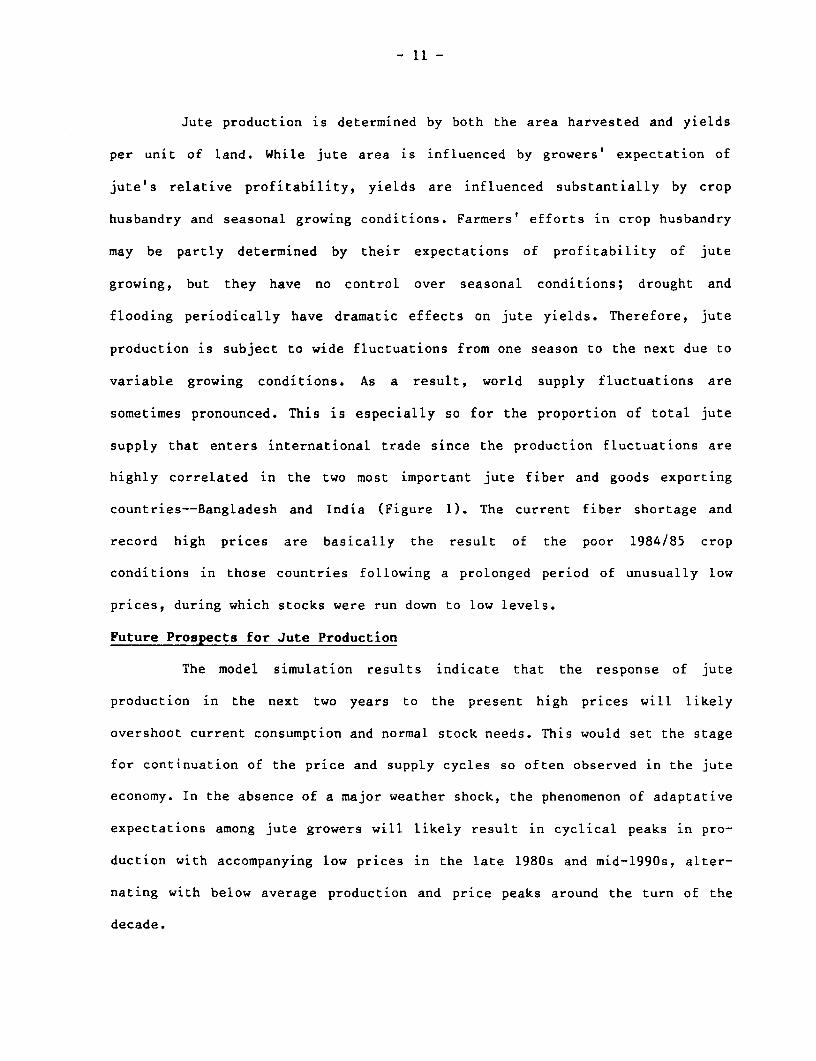
countries--Bangladesh and India (Figure 1). The current fiber shortage and
record high prices are basically the result of the poor 1984/85 crop
conditions in those countries following a prolonged period of unusually low
prices, during which stocks were run down to low levels.
Future Prospects for Jute Production
The model simulation results indicate that the response of jute
production in the next two years to the present high prices will likely
overshoot current consumption and normal stock needs. This would set the stage
for continuation of the price and supply cycles so often observed in the jute
economy. In the absence of a major weather shock, the phenomenon of adaptative
expectations among jute growers will likely result in cyclical peaks in pro-
duction with accompanying low prices in the late 1980s and mid-1990s, alter-
nating with below average production and price peaks around the turn of the
decade.
Figure 1: JUTE PRODUCTION IN MAJOR COUNTRIES AND THE WORLD
4 0 o" / ., ~World
-- 003z \s ,.i ~/ \II / 'us! \ \ /
,~~~~~~~~~~~~~~~~~~~~~~~~
12.~~~~~~~~~~~~~~~~~~~~~~~~~.
I -. ~~~~~India1 003
Bangladesh
Thailand
YSc PiF
,Source: EPDCS.
- 13 -
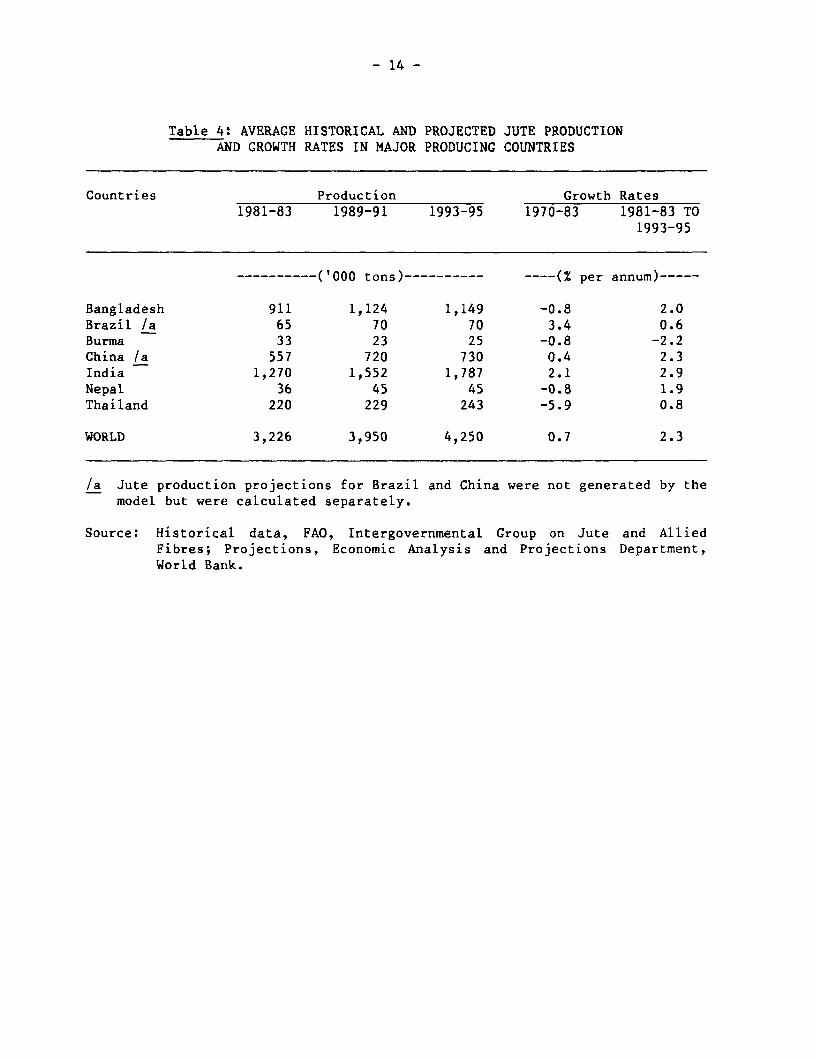
Average annual production projections derived from the simulations
for the main jute growing countries in 1989-91 and 1993-95 are presented in
Table 4 along with average annual output during 1981-83. The production
projections for Brazil and China were not generated by the model but were
calculated separately at levels roughly equivalent to expected domestic
consumption. These production assumptions imply no significant impact on
international trade in jute fiber or product markets from these two countries
during the projection period.
The simulations indicate that the greatest increases in jute produc-
tion and consumption will occur in India, which already has the world's
largest jute sector. With all of the increase in jute production being
required to meet domestic demand, India's volume of exports of jute products
are likely to remain relatively stable at 200-300,000 tons during the projec-
tion period. In Bangladesh, however, the jute requirements for local uses are
likely to remain a relatively small proportion of total output. Therefore,
most of the 200,000 tons of projected increase in production by the mid-1990s
will be available to meet international demand for jute fiber and manufactured
goods. This will raise Bangladesh's export supply, on a fiber equivalent
basis, to around one million tons per year. Thailand's exportable supply of
jute/kenaf is projected to remain around 100,000 tons per year. The additional
jute fiber and product requirements to meet the level of demand implied by the
simulation results of around 100-200,000 tons per year should be shared by the
other smaller suppliers, including Western Europe, the USSR and the other jute
producing countries.
- 14 -
Table 4: AVERAGE HISTORICAL AND PROJECTED JUTE PRODUCTIONAND GROWTH RATES IN MAJOR PRODUCING COUNTRIES
Countries Production Growth Rates1981-83 1989-91 1993-95 1970-83 1981-83 TO
1993-95
…--------- ('000 tons)---------- ---- (% per annum)…
Bangladesh 911 1,124 1,149 -0.8 2.0Brazil /a 65 70 70 3.4 0.6Burma 33 23 25 -0.8 -2.2China /a 557 720 730 0.4 2.3India 1,270 1,552 1,787 2.1 2.9Nepal 36 45 45 -0.8 1.9Thailand 220 229 243 -5.9 0.8
WORLD 3,226 3,950 4,250 0.7 2.3
/a Jute production projections for Brazil and China were not generated by themodel but were calculated separately.
Source: Historical data, FAO, Intergovernmental Group on Jute and AlliedFibres; Projections, Economic Analysis and Projections Department,World Bank.
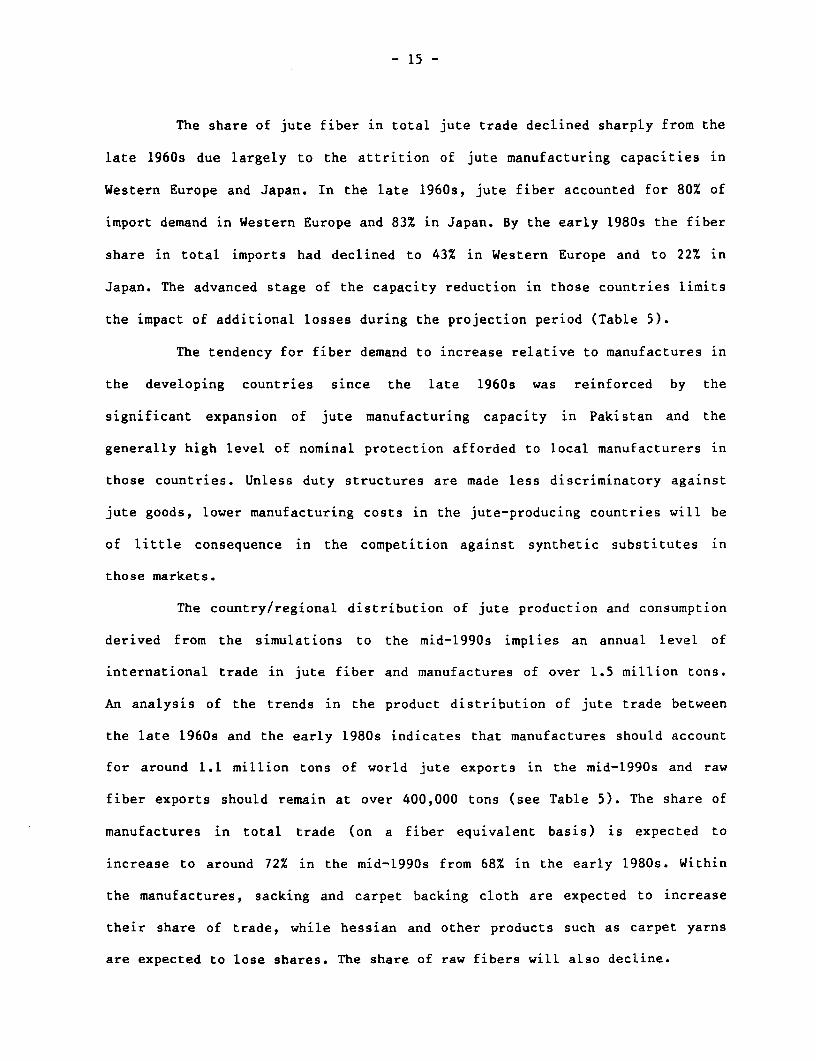
- 15 -
The share of jute fiber in total jute trade declined sharply from the
late 1960s due largely to the attrition of jute manufacturing capacities in
Western Europe and Japan. In the late 1960s, jute fiber accounted for 80% of
import demand in Western Europe and 83% in Japan. By the early 1980s the fiber
share in total imports had declined to 43% in Western Europe and to 22% in
Japan. The advanced stage of the capacity reduction in those countries limits
the impact of additional losses during the projection period (Table 5).
The tendency for fiber demand to increase relative to manufactures in
the developing countries since the late 1960s was reinforced by the
significant expansion of jute manufacturing capacity in Pakistan and the
generally high level of nominal protection afforded to local manufacturers in
those countries. Unless duty structures are made less discriminatory against
jute goods, lower manufacturing costs in the jute-producing countries will be
of little consequence in the competition against synthetic substitutes in
those markets.
The country/regional distribution of jute production and consumption
derived from the simulations to the mid-1990s implies an annual level of
international trade in jute fiber and manufactures of over 1.5 million tons.
An analysis of the trends in the product distribution of jute trade between
the late 1960s and the early 1980s indicates that manufactures should account
for around 1.1 million tons of world jute exports in the mid-1990s and raw
fiber exports should remain at over 400,000 tons (see Table 5). The share of
manufactures in total trade (on a fiber equivalent basis) is expected to
increase to around 72% in the mid-1990s from 68% in the early 1980s. Within
the manufactures, sacking and carpet backing cloth are expected to increase
their share of trade, while hessian and other products such as carpet yarns
are expected to lose shares. The share of raw fibers will also decline.
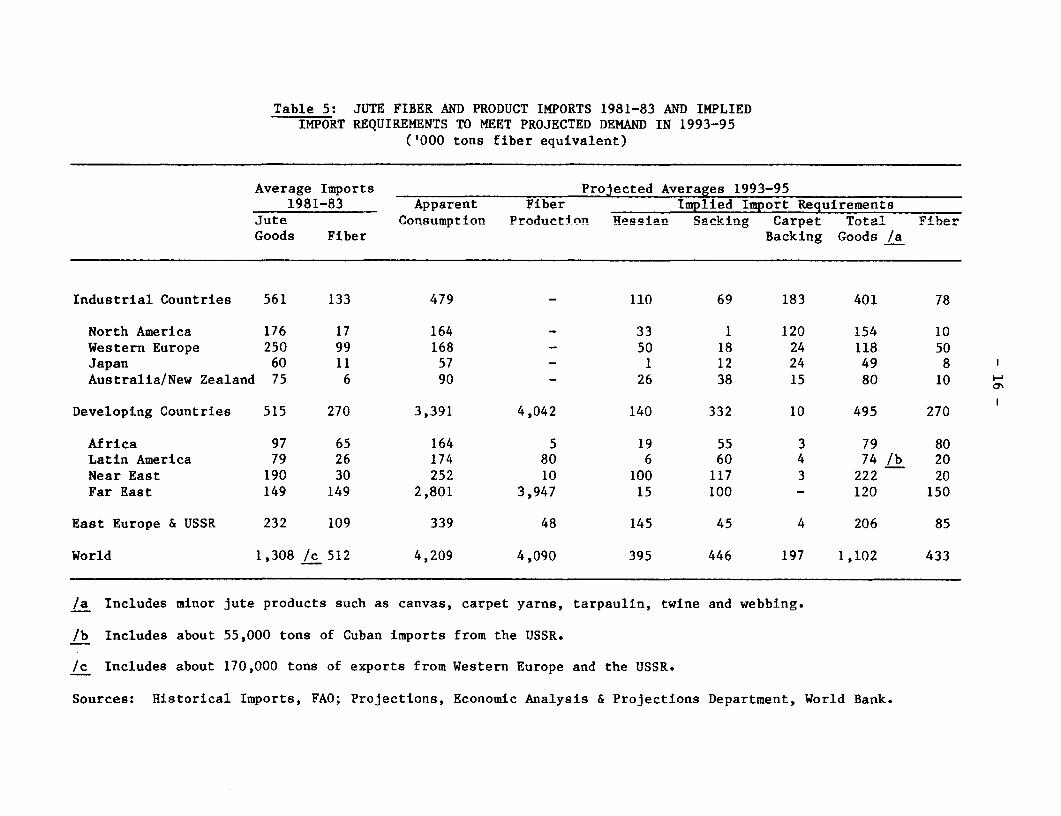
Table 5: JUTE FIBER AND PRODUCT IMPORTS 1981-83 AND IMPLIEDIMPORT REQUIREMENTS TO MEET PROJECTED DEMAND IN 1993-95
('000 tons fiber equivalent)
Average Imports Projected Averages 1993-951981-83 Apparent Fiber Implied Import Requirements
Jute Consumption Production Hessian Sacking Carpet Total FiberGoods Fiber Backing Goods /a
Industrial Countries 561 133 479 - 110 69 183 401 78
North America 176 17 164 - 33 1 120 154 10Western Europe 250 99 168 - 50 18 24 118 50Japan 60 11 57 - 1 12 24 49 8Australia/New Zealand 75 6 90 - 26 38 15 80 10
Developing Countries 515 270 3,391 4,042 140 332 10 495 270
Africa 97 65 164 5 19 55 3 79 80Latin America 79 26 174 80 6 60 4 74 /b 20Near East 190 30 252 10 100 117 3 222 20Far East 149 149 2,801 3,947 15 100 - 120 150
East Europe & USSR 232 109 339 48 145 45 4 206 85
World 1,308 /c 512 4,209 4,090 395 446 197 1,102 433
/a Includes minor jute products such as canvas, carpet yarns, tarpaulin, twine and webbing.
/b Includes about 55,000 tons of Cuban imports from the USSR.
/c Includes about 170,000 tons of exports from Western Europe and the USSR.
Sources: Historical Imports, FAO; Projections, Economic Analysis & Projections Department, World Bank.
- 17 -
IV. WORLD DEMAND FOR JUTE: RECENT TRENDS
Jute fiber is used primarily as a textile raw material for making
packaging products--bags, sacks and wrapping fabrics--as well as carpets,
carpet backing, household and industrial fabrics and twine and cordage. Bags
accounted for half of the jute goods produced in the six major South Asian
fiber-producing countries during the early 1960s. Their share increased to 56%
in 1983/84 (Table 6). Hessian cloth accounted for 37% of production in 1961-63
but declined to 25% in 1983/84. The market share lost by hessian cloth was
shared by growth of all other products. In 1983/84, carpet-backing cloth was
2.4 times the 1961-63 level, in volume terms, as the widespread acceptance of
household and commercial wall-to-wall tufted carpeting stimulated demand
growth in the industrial countries, particularly in the United States. Of the
other products, carpet yarns and twine were the most important ones.
Table 6: JUTE GOODS PRODUCTION BY TYPE OF PRODUCTS,1961-63 AND 1982/83 /a
Bags and Carpet-BackingHessian Sacking Cloth Other /b Total
1961-63Tons ('000) 536 748 53 123 1,460Share (Z) 37 51 4 8 100
1983/84Tons ('000) 491 1,090 128 243 1,952Share tX) 25 56 7 12 100
/a Aggregate production in Bangladesh, Burma, India, Nepal, Pakistan andThailand.
/b Includes canvas, tarpaulin, carpet yarns, webbing, twine and the like.
Source: FAO, Intergovernmental Group on Jute, Kenaf and Allied Fibers, TheStatistical Situation, various issues, and FAO, Jute, Kenaf andAllied Fibers, Quarterly Statistics, March 1985.
- 18 -
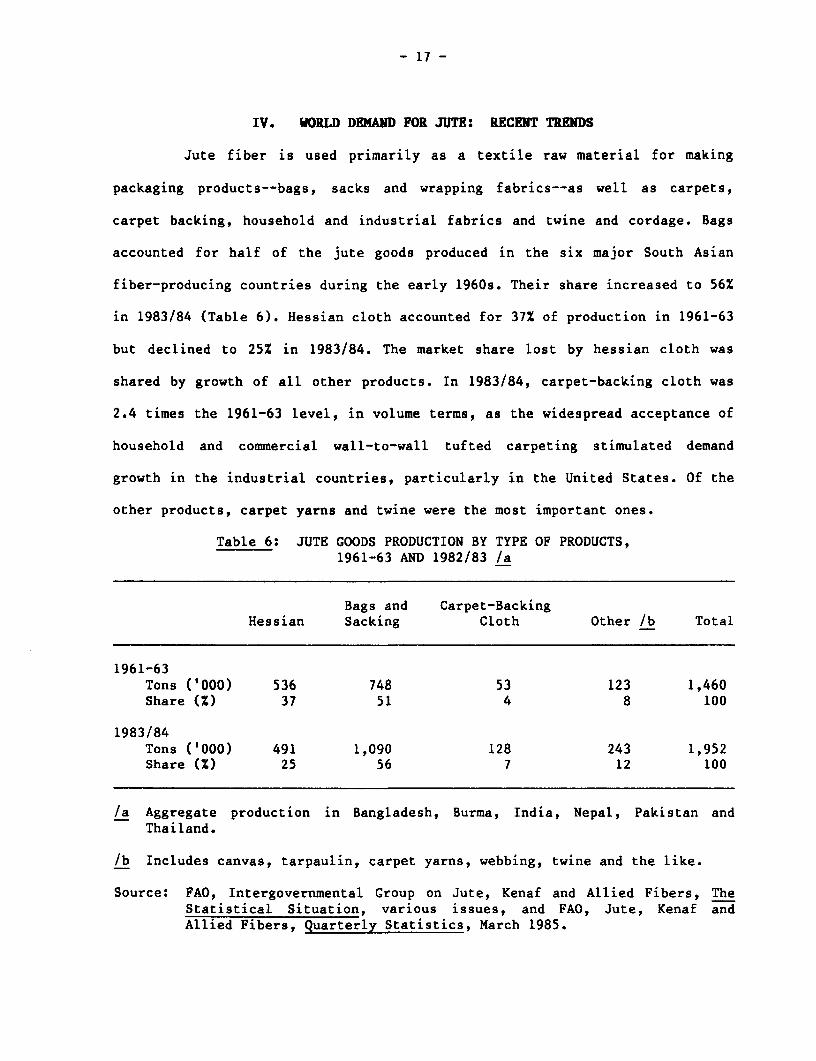
Jute manufacturing is concentrated in the jute-producing countries
and their dominance has increased during the last two decades (Table 7). The
four largest producer-manufacturers of jute--Bangladesh, China, India and
Thailand--increased their share of world jute goods output from 60% in 1962-64
to 82% in 1981-83. Jute goods production in Bangladesh increased from an
average of 299,000 tons during 1962-64 to an average of 620,000 tons during
1981-83, raising its share of world output from 9% to 18%. At the same time,
Thailand's production of manufactured jute/kenaf products increased by over
seven-fold to 202,000 tons and its world market share increased from 1% to 6%.
Jute manufacturing capacity in Western Europe experienced severe erosion from
the early 1960s and their product output fell from 479,000 tons in 1962-64 to
78,000 tons in 1981-83. Consequently, Western Europe's share of the world jute
goods output fell from 15% in the early 1960s to 2% in the early 1980s.
Table 7: JUTE GOODS PRODUCTION AND SHARES BY MAJOR PRODUCING COUNTRIES
1962-64 1972-74 1981-83Countries/ Tons Share Tons Share Tons ShareEconomies (000) (Z) (000) (Z) (000) (%)
Bangladesh 299 9 259 13 620 18China 351 11 565 16 619 17India 1,231 39 1,197 34 1,426 41Thailand 27 1 131 4 202 6W. Europe 479 15 270 8 78 2E. Europe & USSR 120 4 125 4 153 4Others 668 21 754 21 410 12
World 3,175 100 3,501 100 3,508 100
Source: FAO, Intergovernmental Group on Jute, Kenaf and Allied Fibers, TheStatistical Situation, various issues and FAO, Jute, Kenaf and AlliedFibers, Quarterly Statistics, September 1984.
- 19 -
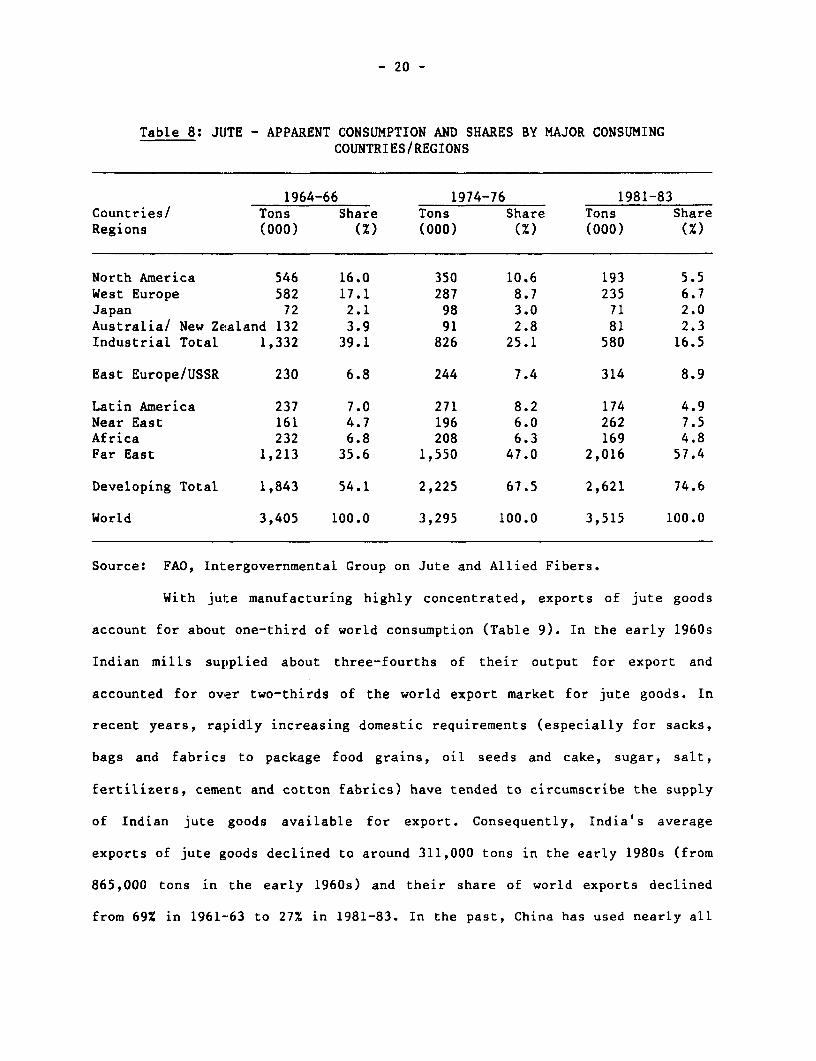
World apparent consumption of jute increased at a reduced annual rate
of about 0.9% during the 1970s compared to a rate of 2.6% per annum in the
1960s. During the last two decades, the fastest growth in apparent consumption
of jute occurred in the two largest jute-producing countries--China and India-
-and in Pakistan, a jute-importing country. Developing countries in the Near
East 1/ and the Far East increased their share of world apparent consumption
of jute from 40% in 1964-66 to 65% in 1981-83 (Table 8). While jute consump-
tion in the Near East and Far East combined increased from an annual average
of nearly 1.4 million tons during 1964-66 to 2.3 million tons in 1981-83,
apparent consumption actually declined in the remainder of Africa and Latin
America. Jute consumption also declined in Eastern Europe, where the tendency
was to replace worn-out jute manufacturing facilities with plants producing
synthetic substitutes. Apparent consumption of jute in the USSR increased at
more than twice the global growth rate during the last two decades, raising
the USSR and Eastern Europe's combined share of world consumption by 2
percentage points to 8.9%. The major losses in jute markets were in the
industrial countries where the competition from synthetic materials, paper
bags, and other developments in packaging and transport systems reduced
average annual jute consumption from 1.3 million tons in 1964-66 to 580,000
tons in 1981-83.
1/ Near East includes Egypt, Libya and Sudan along with the countries in WestAsia.
- 20 -
Table 8: JUTE - APPARENT CONSUMPTION AND SHARES BY MAJOR CONSUMINGCOUNTRIES/REGIONS
1964-66 1974-76 1981-83Countries/ Tons Share Tons Share Tons ShareRegions (000) (Z) (000) (%) (000) (Z)
North America 546 16.0 350 10.6 193 5.5West Europe 582 17.1 287 8.7 235 6.7Japan 72 2.1 98 3.0 71 2.0Australia/ New Zealand 132 3.9 91 2.8 81 2.3Industrial Total 1,332 39.1 826 25.1 580 16.5
East Europe/USSR 230 6.8 244 7.4 314 8.9
Latin America 237 7.0 271 8.2 174 4.9Near East 161 4.7 196 6.0 262 7.5Africa 232 6.8 208 6.3 169 4.8Far East 1,213 35.6 1,550 47.0 2,016 57.4
Developing Total 1,843 54.1 2,225 67.5 2,621 74.6
World 3,405 100.0 3,295 100.0 3,515 100.0
Source: FAO, Intergovernmental Group on Jute and Allied Fibers.
With jule manufacturing highly concentrated, exports of jute goods
account for about one-third of world consumption (Table 9). In the early 1960s
Indian mills supplied about three-fourths of their output for export and
accounted for over two-thirds of the world export market for jute goods. In
recent years, rapidly increasing domestic requirements (especially for sacks,
bags and fabrics to package food grains, oil seeds and cake, sugar, salt,
fertilizers, cement and cotton fabrics) have tended to circumscribe the supply
of Indian jute goods available for export. Consequently, India's average
exports of jute goods declined to around 311,000 tons in the early 1980s (from
865,000 tons in the early 1960s) and their share of world exports declined
from 69% in 1961-63 to 27% in 1981-83. In the past, China has used nearly all
- 21 -
the jute goods produced in local mills, but in recent years exports of sacks,
hessian and yarn have increased, reaching about 64,000 tons in 1983 compared
to estimated internal consumption of 455,000 tons. 1/
Bangladesh, the third largest producer of jute, depends on export
markets for most of its output. Although Bangladesh mills have more than
doubled their output of jute manufacturers since the early 1960s, throughout
the 1970s roughly 90% of their jute goods were exported. During 1981-83
Bangladesh accounted for 44% of world jute goods exports--up from an 18% share
in 1961-63. Bangladesh has also remained the largest exporter of jute fiber,
accounting for 73% of world exports during the last three seasons (1981/82 -
1983/84). The market for raw fiber has been shrinking, however, and
Bangladesh's exports declined by an average of 4.3% per year between 1961 and
1983. The main reason for the decline in fiber exports was the contraction of
jute manufacturing in the industrial countries, especially in Western Europe.
Those countries received two-thirds of the world's total fiber exports in
1961-63 but only 25% in 1981-83. Concurrent with the reduction in jute manu-
facturing in Western Europe, Pakistan expanded its jute mill capacity and is
now the world's largest importer of raw jute.
Thailand exported only fiber in the early 1960s but developed
substantial export capacity for sacks, yarns and twine by the early 1970s.
With the decline in fiber production in the later years of the 1970s, largely
because of competitive losses of growing area to cassava and maize, jute goods
became the predominent export items as fiber exports declined. Although
1/ FAO CCP:JU/QS 85/1, March 1985.
- 22 -
Thailand did not export any jute products in the early 1960s, about 48% of its
production of jute goods have been exported in the last three seasons.
Table 9: JUTE GOODS EXPORTS BY ORIGIN /a(ANNUAL AVERAGE)
1961-63 1972-74 1981-83
----------------------('000 tons)----------------------
Bangladesh 227 416 507China 0.3 57India 865 561 311Thailand - 79 89West Europe 127 119 94Others 39 103 106
World 1,258 1,278 1,164
/a Crop Year (July/June) for countries of the Far East and calendar yearsbeginning in the first year of the crop year for other countries.
Source: FAO, Int:ergovernmental Group on Jute, Kenaf and Allied Fibers.
The degree of market control implied by the concentration of supplies
of jute fibers and manufactures has been eroded by the development of textile
polyolefin substitutes (mainly polypropylene and polyethylene). These products
challenge jute in each of its major end-uses, especially in the industrial
countries. PolyoLefin plastics are products of the petrochemical industry and
are characterized by high tensile strength, impact resistance, light weight
and relatively low costs of production.
Polypropylene is the single most important synthetic substitute for
jute. The resin is derived by the polymerization of propylene. Propylene, the
basic raw material, is manufactured by steam cracking and refinery processes.
The steam cracking of naphtha provides the bulk of propylene in Western Europe
and Japan, where propylene is a co-product of ethylene production. By
- 23 -
comparison, in the United States much of the propylene is supplied by
refineries and it is derived from natural gas liquids and from liquified
petroleum gases.
Polypropylene was a late-comer in the family of synthetic fibers.
Research and development efforts have proven very successful in increasing the
efficiency of production processes and in adapting various forms of the fiber
to specific end-use requirements. These improved efficiencies in production,
increased economies of scale as the polypropylene industry matured and the
incentive to sell products below total costs when demand was slackened by
recession have tended to keep prices relatively low for extended periods when
manufacturing capacities surpassed demand. Cost-efficient processes and
materials--vapor phase technology and third generation catalysts--will keep
polypropylene costs highly competitive as they continue to be adopted as the
industry standard, offsetting the effects of higher feedstock prices in the
first half of the 1990s.
The polyolefin product producers fielded aggressive marketing efforts
to penetrate new use areas. Their market promotion included technical assis-
tance to users and substantial research in product development and adaption.
Each disruption in jute supplies or sharp rise in jute prices since the mid-
1960s has provided the synthetics an opportunity for further penetration of
jute markets, particularly in the industrial countries. The expanded use of
polypropylene products as substitutes for jute goods has expanded sharply
during the late 1970s and early 1980s. In those cases where the synthetic
products combined technical advantages and lower prices the effect on jute was
devastating. This is clearly illustrated by the market for primary backing for
tufted carpets. In the United States jute accounted for 89X of this end-use in
- 24 -
1967, but the development and effective marketing of a lower-priced synthetic
fabric that performed well technically in the manufacturing processes caused a
sharp erosion of this market. In 1983, use of jute as the primary backing for
carpets was confined to specialty items and accounted for less than 5% of the
total. The use of jute primary backing for tufted carpets also declined
sharply during the 1970s in Japan and Western Europe. By contrast, jute's
superior technicaL performance as a secondary backing for tufted carpets and
the jute manufactures' responsiveness in developing lighter-weight fabrics to
meet cost competition kept 55% of this market in the United States for jute in
1983. However, the rise in jute carpet backing prices associated with the
1984/85 fiber shortage has resulted in a loss of competitiveness and a severe
decline in jute's market share. Based on past experience, an extended period
of assured supplies of jute secondary backing fabrics at competitive prices
will be required to recover most of jute's former share of this market. Jute
secondary backing had begun making gains vis-a-vis foam cushion backings in
Western Europe prior to the current period of high prices and it has also been
a growth item in Japan during recent years.
Jute also faces serious competition from synthetic products in its
largest markets--bags, sacks, bale wraps and industrial cloths--in virtually
all consuming countries. At the same time, the total market for bags has
declined in those countries where bulk handling of agricultural and industrial
products--especially grains, cement and fertilizers--have become predominant
handling methods and extensive processing and prepackaging of groceries have
become common merchandising factors. The cost competitiveness of polyolefin
synthetic fibers has been particularly intense since the mid-1970s because
excess production capacity often resulted in short-term marketing strategies

- 25 -
based on recovery of direct costs when full-cost recovery was impossible. The
effects of this competition have been widespread; they have been a major
factor limiting the demand for jute bags in African, Asian and Latin American
countries as well as in the industrial countries.
- 26 -
V. ANALYSIS OF DEMAND FOR JUTE: BY COUNTRIES AND REGIONS
The slow-down in world demand growth for jute since the mid-1960s is
largely attributable to technological changes in the transportation,
packaging, storage and handling of agricultural and industrial products
traditionally packaged in jute bags or fabrics and to the substitution of
paper and synthetic products for those made from jute. These technological
developments, including synthetic substitution, were initially introduced in
the industrial countries and it is there that the impact on jute consumption
has been the greatest. The substitution of synthetic products for jute
products was accelerated periodically by the scarcity of and sharply higher
prices for jute fiber and goods in the consuming countries. These scarcities
have arisen fronn unusually small jute crops due to unfavorable growing condi-
tions and the interruptions to manufacturing and/or transport of products
during strikes aand Bangladesh's independence struggle.
Recent trends in the end-use markets are described in detail by
region and count:ry in this section. Trends in demand for jute during the last
two decades have! been analyzed econometrically for 15 countries/regions. These
econometric estimates, together with other information about likely demand
behavior in these markets, for both jute and its substitutes, are then used to
make projectionsi for jute demand in these markets (see Annex 1 for a detailed
listing of the various parameters estimated in the jute model).
Industrial Countries
The importance of the industrial countries as consumers of jute has
eroded seriously since the mid-1060s. Apparent consumption of jute in these
countries averag;ed 1.33 million tons per year during 1964-66 and accounted for
39% of total world demand. By 1981-83 average apparent consumption in the
- 27 -
industrial countries had declined to 579,000 tons, about 16% of the world
total.
a. North America
A full range of jute products are used in North America, but carpet
backing cloth and burlap accounted for 83% of imports of fiber and products
during 1981-83. Jute is not produced locally and manufacturing activities are
limited to specialized yarn spinning, bag sewing operations and converting
jute butts and waste into felts and padding products. Imports of raw jute and
waste account for about 10% of the jute fiber and products imported into
Canada and the United States.
Apparent consumption of jute in North America declined from the 1964-
66 average of 546,000 tons per year to an average of 192,000 tons during 1981-
83. Although jute consumption has declined by 65% since the mid-1960s, the use
of jute secondary carpet backing exhibited relative strength. In the mid-1960s
average imports of 131,000 tons of jute carpet backing cloth accounted for
nearly 26% of total jute fiber and goods imported. On a yardage basis those
imports were about equally divided between primary and secondary backing
cloths, although on a tonnage basis the primary, generally a 9.0 oz. fabric
compared to secondary of 7.0 oz, was more important. During the late 1960s a
price-competitive, woven polypropylene primary-backing cloth with technical
advantage for fine gauge tufted carpets began rapidly to replace jute primary
backing cloth in broadloom tufted carpets. Jute's share in this end use fell
from around 90% in the mid-1960s to less than 5% in the 1980s. Price and
technical competitiveness were better maintained by jute in the secondary
carpet backing, however, and jute's market share in the early 1980s was around
55% compared to over 70% in the late 1960s. Costs of jute secondary carpet
- 28 -
backing cloth were kept under control by the progressive development of
lighter-weight fabrics of adequate technical competitiveness. Jute's market
share has dipped seriously during periods of inadequate supply and uncompeti-
tive prices, as in 1969/70 and in 1984, and the long-term ability of jute to
recover and maintain a significantly larger share is yet uncertain. Although
jute lost a major portion of its primary backing market, the growth in
secondary backing raised carpet backing's share of the total jute fiber and
goods imports into North America to 45% in the early 1980s.
The demand for carpet-backing cloth is derived from the demand for
broadloom tufted carpets, and jute's share of that market is essentially
determined by its price and technical competitiveness vis-a-vis synthetic
substitutes. Broadloom carpet shipments in the United States increased at a
rate of over 16% per year during the 1960s, when real incomes were rising
favorably, new synthetic face yarns came into use at declining real prices,
wall-to-wall carpeting became fashionable and construction (residential and
commercial) was growing rapidly. Since 1970, real income growth has moderated
and increased saturation of carpeting on existing floor space has reduced the
rate of growth of broadloom tufted carpet shipments to around 3% per year.
During the early 1980s broadloom carpet shipments declined due to the economic
recession's effect: on incomes and the adverse effect of high real interest
rates on home and commercial construction. Since the mid-1970s, 92% of the
variation in jute secondary carpet backing consumption in the United States
can be explained by broadloom tufted carpet shipments and the ratio of the
prices of jute and polypropylene secondary carpet backing cloth, with a price
elasticity of -0.3.
- 29 -
Jute burlap (fabrics up to 100 inches wide) imports into North
America declined from an average of 250,000 tons during 1964-66 to around
80,000 tons in the early 1980s. With about two-thirds of the burlap consumed
in the United States and most of it consumed in Canada being used for making
bags, this sharp decline in burlap imports reflects the erosion of the jute
bag market. The jute bag market has declined along with total bag use due to
extensive bulk handling of agricultural products and industrial materials. At
the same time, jute's share of the smaller bag market was further eroded by
increasing use of paper and synthetic substitutes. Only potato bags, made from
iight-weight hessian, were able to maintain a greater share of the US market
than the synthetics. Heavy-weight jute bags lacked price competitiveness with
synthetic products.
Jute dominated the US cotton bale wrap market up to the mid-1970s;
1970-74 imports averaged 72,500 tons per year, but subsequently the shift of
cotton trading to a net weight basis encouraged the use of lighter weight
synthetic bale wraps. Rapid adoption of improved synthetic bale wraps resulted
in the decline of jute material to 8,600 tons in 1979 and only 800 tons in
1983. Regulations have been introduced such that, in 1985, cotton bale wraps
must cover the entire bale, and the polyolefin coating used to prevent
fibrillation must be thermally bonded to the woven polypropylene fabric by
extrusion coating. The cost of this additional requirement for the synthetic
product may be sufficient to make new lighter-weight jute construction cost
competitive.
A small proportion of the jute burlap market is for decorative
fabrics. These fabrics accounted for about 8 million square yards of burlap in
the United States annually in the early 1980s and about one million square
- 30 -
yards in Canada. The demand for decoratives is subject to the sudden shifts of
fashion trends but it is not likely to become a high volume item in the North
American market.
The divergent trends in the demand for jute secondary carpet backing
cloth and for other jute products in the North American market are expected to
continue into the 1990s. The model simulations indicate that broadloom tufted
carpet shipments in the United States should increase to around 1.3 billion
square yards by 1990 and by a further 300 to 400 million square yards in the
mid-1990s. Therefore, jute's opportunities in the North American secondary
carpet backing market seem quite favorable. Jute's annual share of the
secondary backing market for broadloom tufted carpets varied between 53.5% and
68.7% during the last decade under various competitive conditions until record
high jute prices in 1984/85 caused a sharp decline in jute's competitiveness.
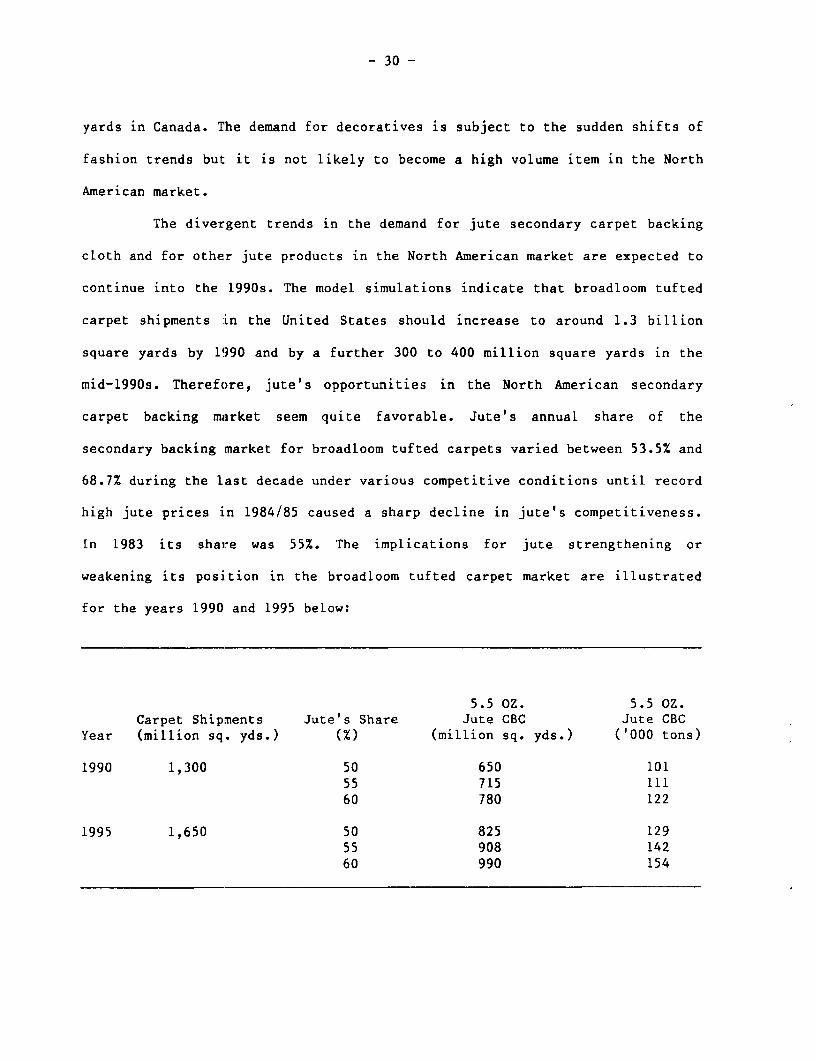
In 1983 its share was 55%. The implications for jute strengthening or
weakening its position in the broadloom tufted carpet market are illustrated
for the years 1990 and 1995 below:
5.5 OZ. 5.5 OZ.Carpet Shipments Jute's Share Jute CBC Jute CBC
Year (million sq. yds.) (Z) (million sq. yds.) ('000 tons)
1990 1,300 50 650 10155 715 11160 780 122
1995 1,650 50 825 12955 908 14260 990 154
- 31 -
By maintaining their 1983 level of competitiveness, the jute manufacturing
industries can expect a market in the United States for over 700 million
square yards of secondary carpet backing by the end of the 1980s and around
900 million square yards in the mid-1990s. Should the 5.5 oz. cloth still be
the standard jute secondary carpet backing construction in 1995, it would
amount to 142,000 tons of fabric, which is more than double the average
1980-83 imports of all carpet-backing cloth. By regaining the competitive
position of the 1970s (say a share of 60%), jute carpet backing use would be
substantially higher.
A new carpet underlay for glue-down installations, consisting of a
dense sponge rubber pad with a woven jute scrim on each side, is now being
promoted in the US market and trial samples have been shown in the European
market. This pad can be released from the floor and carpet with relative ease
and it has increased installation productivity by eliminating the need for
stretching or heat-bond seaming. If the full market potential for this new
underlay is realized it could increase the annual demand for 6 oz. jute carpet
backing cloth by several thousand tons in the United States alone.
Prospects for other traditional jute products in the North American
market are less promising than those for secondary carpet backing. There is no
apparent development that would be expected to reverse the downward trend in
use of these products over the projection period, which is likely to keep
total jute consumption in a moderate decline when the cyclical peaks and
valleys are averaged out.
b. Western Europe
Jute utilization in Western Europe experienced a sharp decline from
the late 1960s until it tended to level-out in the early 1980s. European jute
- 32 -
manufacturers' ability to compete against paper and synthetic substitutes was
hindered by rising processing costs and higher raw material prices. Moreover,
jute consumers were unable to obtain jute products at world market prices
because of the protectionist measures taken on behalf of domestic jute
manufactures. Therefore, imports of jute goods did not fully compensate for
the lower indigenous production. In these circumstances, the substitution of
polyolefin textiles for jute goods proceeded rapidly from the late 1960s when
synthetic prices became highly competitive. The trend toward bulk handling of
agricultural commodities and the pre-packaging of groceries also cut sharply
into the need for jute sacks and bags. These developments reduced apparent
consumption of jute in Western Europe from an annual average of 582,000 tons
during 1964-66, representing 17% of the world total, to 235,000 tons, or 6.6%
of the world total during 1981-83.
The dramatic retrenchment in jute manufacturing in Western Europe is
indicated by the changes in equipment and employment in the industry. The
availability of spindles and looms in the industry declined by 83% and 91%,
respectively, between 1965 and 1980, while employment declined by 80%. As a
result, jute fiber imports fell from 521,000 tons in 1965 to 84,000 tons in
1983.
Sacks and bags provided the largest market for jute goods in Western
Europe during the 1970s and was estimated to account for one-third of its
total use in the four major jute consuming countries in the early 1980s. The
demand for jute sacks has been sustained by their use for packaging European
products for export. Most of these bags are sent to developing countries, with
Africa being the largest destination. The reusability of jute bags is
important to their preferences in these markets.
- 33 -
The growth in domestic demand for jute sacks has been constrained by
increased use of intermediate bulk containers (in one or two ton units) for
packaging, handling and storage of powder or granular materials. In this form
they can be lifted and transported by fork lift trucks or cranes and stored
without pallets.
The increased use of synthetic bags and bale wraps has also impacted
adversely on jute demand in Western Europe. The increase in polyolefins used
in bags and bale wraps between 1970 and 1980 is conservatively estimated to
have replaced 135,000 tons of jute-sacking materials. This penetration of the
market by synthetics was strongly aided by very competitive pricing,
especially so for imported bags. Jute sacks were not fully price competitive
with woven polypropylene bags in the early 1980s, even before the sharp
increase in product prices due to tight jute supplies in 1984.
Jute carpet yarns have long been the preferred weft yarn for making
woven carpets. Production of woven carpets in Western Europe, however,
declined by 25% between 1971 and 1980, and the down-trend is expected to
continue in the current decade as tufted carpets now dominate the market.
A marked change in the origin of jute yarns used in Western Europe
has occurred in recent years. Prior to the relaxation of trade restrictions,
most jute yarns were spun domestically. Now a larger share of the available
supply is imported from the jute-producing countries. The continued penetra-
tion of imported jute yarns into the West European market depends importantly
on manufacturers supplying yarns of good quality and free of slubs and
uneveness. Elimination of poorly tied knots and improved packaging also
requires urgent attention. Any excessive down time of weavers' high-speed
looms, caused by poor quality yarns, will jeopardize jute's position in this
- 34 -
market. A main attraction of polypropylene yarn is the extra yardage without a
join on the yarns, which speeds production. The synthetic producers also
emphasize that their yarns are rot-proof, do not shrink when wet and impart
dimensional stability. Jute yarns, on the other hand, are not stiffened by the
application of latex, are more bulky and are very supple, giving jute yarns
and the carpet a better "hand". Synthetics are estimated to be the predominant
warp yarn in European woven carpets, but jute accounts for a major share of
the weft carpet yarns.
Jute primary carpet backing has not been price competitive with woven
polypropylene in recent years and typically has accounted for less than 2% of
the West European market.
Jute's position in West European secondary carpet backing
deteriorated rapid]Ly in the early 1970s as domestic jute manufacturing costs
were rising and imports of jute cloth from lower-cost producers, which could
have competed with synthetic backing, were limited by import barriers. In this
case, the protection of the European jute industry from imported jute cloth
acted to protect t:he synthetic-backing producers from effective competition
from jute. Under these conditions, foam cushion became the predominant
secondary backing fior tufted carpets. In the early 1980s, foam cushion backing
accounted for over 90% of secondary backings in Belgium, France and the
Federal Republic of Germany, although other backings had penetrated substan-
tially more in the Netherlands and the United Kingdom.
There are some favorable factors at work that should encourage jute
manufacturers to make a serious effort to exploit the movement of the European
carpet industry toward woven backing for tufted carpets. The problems
experienced with the first generation of foam backings are surfacing at the
- 35 -
time replacement carpets are required. The cost of lifting the old carpets is
often twice the cost of installation, due to the deterioration of the foam
backing. This difficulty has raised interest in woven backings. Exports of
European-made carpets are expanding, particularly to the Middle East, which
has a distinct preference for carpets with a woven jute secondary backing.
Also, growing concern over the dangers of flammability and smoke
density/toxicity favor the selection of jute cellulosic fibers over synthetic
materials.
In the highly competitive carpet market of the early 1980s, the
standard jute secondary backing in West Europe shifted from a 7 oz. to a 6 oz.
cloth and trials were made with a 5.5 oz. fabric. These efforts helped jute to
maintain a small price advantage over woven polypropylene secondary backing.
With jute-backing prices increasing faster than those of the synthetic
substitute, however, the advantage had largely disappeared by the third
quarter of 1984.
Total carpet production in Western Europe nearly doubled between 1970
and 1980 and tufted carpets increased their share of the market from 48% to
70% during that period. Industry estimates suggest that all the growth in
carpet production during the current decade will be of tufted construction. A
decline in woven carpet output is expected to be led by lower Axminster
production in the United Kingdom and a more modest decline in needlefelt
output generally in the carpet manufacturing countries. Assuming moderate
economic growth during the remainder of the decade, tufted carpet production
could increase by 50% from the 1981 level. These growth prospects represent a
strong challenge to jute secondary carpet backing manufacturers.
- 36 -
The breakthrough in the use of jute in decorative fabrics and other
end uses envisaged at the start of the 1970s now appears unlikely, unless
technical advance!ment is made in controlling light fastness. There has been a
movement away from bleached jute weft fabrics because of the irregular fading
of the material on the wall. Although in many instances the wall covering
might still have a jute warp, the weft is now mainly viscose or a similar
material with the required color fastness. France is the major wall covering
producer with the Federal Republic of Germany second, followed by Sweden and
the United Kingdom.
With the European producers of decorative jute fabrics doing their
own weaving, they will require a steady supply of jute yarns, most likely from
the jute-producing countries. The sales of specialized yarns to the small
sophisticated weavers depend importantly on quality.
Other decorative end uses are small and consume a very minor tonnage
of jute goods. Mobile office partitions are on some occasions made with a dyed
jute covering. This is also the case with window display cloth for department
stores or specialty shops. Lampshades are another area severely handicapped by
poor light fastness of cellulostic fabric. Drapes also suffer from fading and
the effects of the hydroscopic nature of jute. Currently popular throughout
Europe are the "'shopping" type carrier bags, either plain or with a printed
motif.
The price and technical competitiveness of jute secondary carpet
backing and carpet weft yarns, and the requirement that agricultural product
exports to certain countries be packaged in jute sacks, helped stabilize jute
demand in Western Europe in the early 1980s. The current tight supply of and
high prices for jute products are undercutting jute's position. Therefore,
- 37 -
jute producers and manufacturers need to make a concerted effort to reesta-
blish jute's competitiveness in order to minimize the possible permanent
damage that would occur to their market position if the situation were to
persist long enough to attract capital investments to supply substitute
products. The model simulations indicate that success in this effort could
maintain a jute market of around 200,000 tons per year into the early 1990s.
The most promising area for increased jute consumption in Western
Europe is in secondary backing cloth for tufted carpets. A substantial growth
in the production of these carpets during the rest of the 1980s seems assured.
Given the demands of the export market for woven secondary backing and the
disaffection of local consumers with the foam backings at replacement time,
jute manufacturers have a unique opportunity to penetrate this market. The
growth will not automatically accrue to jute, however; keenly competitive
synthetic backing manufacturers will prevent that. Jute's success will depend
upon how well the market's needs are met for an uninterrupted supply of
competitively-priced fabric of acceptable quality. Technological developments
also change market requirements over time and the successful commercialization
of carpet backing cloth incorporating twistless jute yarns could make a dif-
ference in jute's market share into the 1990s. In any case, customer service
activities commensurate with those of the synthetic competitors would improve
the jute industry's communication of market developments to manufacturers and
vice-versa, thereby, improving jute's prospects for successfully exploiting
this opportunity. With so much depending on the successful management of the
market penetration effort, consumption of jute in carpet backing is highly
uncertain and could range from 50 to 80,000 tons in Western Europe at the end
of the decade.
- 38 -
In the bag market, demand is closely tied to the export of
commodities to areas not yet provided with bulk handling facilities and the
maintenance of price competitiveness with sacks of substitute materials.
Jute's comparative advantage here is in the lighter-weight bags, which should
keep consumption in this market at around 60,000 tons in 1990.
Jute consumption in carpet yarns, its other major end-use in Western
Europe, is projected to decline further during the 1980s due to falling
production of woven carpets. If jute maintains its recent share in weft yarns,
consumption would amount to around 35,000 tons at the end of the decade.
C. Japan
Japan's consumption of jute products peaked at 136,000 tons in 1968
and then trended irregularly downward to an average of 74,480 tons during the
first four years of the 1980s. Individual products experienced divetgent
trends; increased demand for jute carpet backing offset some of the impact of
the sharply declining use of jute bags.
During the 1970s jute manufacturing in Japan declined at a much
faster rate than the consumption of jute products. The import emphasis,
therefore, shifted from raw jute to products manufactured in the jute-produc-
ing countries. Raw jute imports were equivalent to 86% of apparent consumption
during 1967-69 but declined to only 15% of consumption during 1981-83.
Jute and kenaf bags for packaging foodgrains is the most important
single use for jute products in Japan. Indeed, this is the market on which the
domestic industry's rapid development in the early 1960s was largely based.
After six years of testing and official approval, jute bags were introduced
for packaging foodgrains in 1961. Jute bags made rapid gains against the
traditional straw bags, which required considerable farmers' time to make and
- 39 -
were more costly to buy than bags of other materials. During the 1970s, both
paper and synthetic bags gained importance as rice packaging materials.
Although price series for jute, paper and synthetic bags are unobtainable,
traders confirmed that jute bags were more expensive than either paper or
synthetic bags. Nevertheless, jute bags were often preferred since they could
be used three times and the others could be used only once. In 1980 it was
estimated that 55% of the jute bags used to package foodgrains were new and
45% had been used previously. Paper bags are not reusable and synthetic bags
are damaged in use and the government does not permit their reuse. Although
rice production declined by 26% between 1970 and 1980 paper bags used for
foodgrain packaging increased by 58% and synthetic bags in this use increased
by over six-fold, contributing to jute's decline of 50%.
While the total demand for bags for packaging and storage of
foodgrains in Japan has been adversely affected by declining domestic
production of rice, the development of bulk handling for imported grains has
also been important. Imports of foodgrains into Japan trended upward over the
last decade. Arrivals in 1969 totaled 5.1 million tons and in 1980, 7.0
million tons. Despite the rise in import volume, jute bags for this use fell
from 22 million in 1969 to 3.8 million in 1980 as increased bulk-handling
reduced the proportion of imported foodgrains packaged in bags (from 38% in
1969 to less than 5% in 1980).
In the 1970s, changing home-furnishing styles in Japan fostered
rapidly increasing production of tufted carpets. At the beginning of the
decade over 90 percent of the tufted carpets used a jute primary backing and
the more expensive one-fourth of those carpets also had a jute secondary
backing. Less costly backings such as latex coating or cotton and rayon mesh,
were used on the lower-priced carpets. By the mid-1970s, however, use of jute
- 40 -
primary carpet backing was negligible due to jute's inability to compete with
polypropylene in the heavier fabrics. During most years since 1970 jute
primary carpet backing has been priced at 30% to 100% higher than the
polypropylene substitute fabric.
Jute has been more competitive in the lighter-weight fabrics used as
a secondary backing for tufted carpets. Even so, the exports of jute carpet
backing cloth (primary and secondary) from the two main producing countries to
Japan increased from an average of 4,700 tons during 1967/68 to 1969/70 to an
average of 21,400 tons during 1980/81 to 1982/83. This growth in exports of
jute carpet backing to Japan, of over 12% per year, compares to the 1972 to
1980 rate of growth in domestic shipments of polypropylene carpet backing
fabrics of around 8% per annum.
Jute consumption in minor end-uses has declined in Japan since 1970.
Jute binders twine is used primarily for rice harvesting by traditional
methods. A substitute polypropylene twine, which is much cheaper than the jute
product, competes for this end-use. The utilization of rice harvesting
combines, which do not use twine, is increasing. The demand for jute binders
twine in 1970 was around 15,000 tons but by 1980 imports plus domestic
production had fallen to 8,550 tons. Jute hessian cloth consumption--mostly as
packing cloth--declined from around 12,000 tons in 1970 to only 2,250 tons in
1980. In the industrial fabric market the large premiums for jute fabrics
indicate that their use will continue only where consumers have a very strong
preference for jute vis-a-vis the synthetic substitutes.
Jute industry leaders in Japan feel that the present level of jute
consumption can be sustained only if new products are introduced to offset
losses where technological developments, such as bulk handling of grains and
use of rice harvesting combines, are reducing the need for jute products. They
- 41 -
do not recall the development of any new jute product since jute binders twine
for rice harvesters was introduced about 20 years ago. For those jute products
with promising growth prospects, such as secondary carpet backing, increased
jute utilization will require the successful meeting of competition from
synthetic products, especially polypropylene woven fabrics. This means that
jute producers and manufacturers would have to closely control costs while, at
the same time, intensifying quality control measures. It is equally important
that jute products be constantly available to consumers at reasonably stable
prices. Failure on any of these conditions will cause the future trend in jute
consumption to be lower than it otherwise could have been. Aggressive efforts
are also needed to develop new applications for jute to offset the further
losses that appear certain due to further substitution by synthetics and
mechanization of rice harvesting. Promising areas for additional emphasis
appear to be applications for new products from twistless yarns which overcome
the major technical deficiencies of spun jute yarn in primary carpet backing
fabrics -- lack of smooth surface and needle deflection.
The growth in demand for jute carpet backing should moderate the
decline in jute use in Japan and is expected to maintain a market for around
55,000-60,000 tons of jute products in the mid-1990s.
d. Australia
Jute consumption in Australia consists predominantly of grain and
flour sacks, wool packs, industrial fabrics and carpet-backing cloth. Most of
the demand is supplied by imports of manufactures from jute-producing
countries. The local spinning industry produces jute yarns, twines and cordage
from imported fiber, amounting to around 10% of total jute consumption. A
major portion of the grains and flour sacks are used to package exports of
- 42 -
those products to countries not prepared to receive and distribute them in
bulk. Jute hessian imports, primarily for industrial use, have declined
sharply over the last decade due to substitution by lighter and often cheaper
synthetic fabrics.
The use of traditional jute wool packs in Australia has fluctuated
with the popularity and relative costs of jute and various synthetic
substitutes. The adoption of higher-density presses, to economize on freight,
has also placed more stringent demands on wool packaging materials, requiring
stronger yarns and flexible constructions. Protection of wool from
contamination continues to be the important issue in wool packaging, but cost
considerations constrain the viability of the various options. In spite of the
many obstacles Eacing jute wool packs, imports of around 27,000 tons in 1983
compares favorably with the average imports of 21,120 tons in the late 1960s
and much lower imports in the late 1970s.
Jute carpet backing cloth has been a growth item in Australian
imports, in spite of the synthetics taking a predominant share of the primary
carpet backing market in recent years. Exports of carpet backing cloth from
Bangladesh and India to Australia averaged 7,600 tons during the period
1980/81 to 1982/83 compared to 4,600 tons during the period 1967/68 to
1969/70. Jute accounts for all the secondary carpet backing used, except for a
small amount of synthetic backing used in special circumstances.
Jute consumption in Australia is significantly related to the level
of agricultural production, since exports of grain and wool account for a
major share of jute-packaging materials used. The relative prices of jute and
polypropylene fabrics also exert a significant influence on the level of jute
consumption. Assuming that the use of jute carpet backing will continue to
increase along with commercial building and housing construction and that the
- 43 -
influence of increased agricultural production on the use of jute bags will be
moderated by continued competition from synthetic substitutes, a modest growth
in total jute consumption is expected in Australia, to around 80,000-85,000
tons in the mid-1990s.
Developing Countries
Jute consumption has increased strongly over the last two decades in
those countries where agricultural production has been expanding and where the
packaging, transport and storage of agricultural products were not generally
handled by bulk procedures. With those conditions being met in many developing
countries, their aggregate consumption of jute increased from an annual
average of 1.8 million tons during 1964-66, representing 54% of the world
total, to an average of nearly 2.7 million tons during 1981-83, equal to 75%
of the world total. Apparent consumption of jute over this period experienced
its fastest growth in the two largest jute-producing countries--China and
India--and in Pakistan, a jute importing country.
a. Bangladesh
Apparent consumption of jute in Bangladesh is smaller in relation to
the size of the industry than in the other major jute-producing countries,
with domestic use accounting for around 10% of mill output. Nevertheless,
domestic utilization is estimated to have increased from an average of 65,670
tons during 1964-66 to an average of 107,600 tons during 1981-83. Sacking is
the predominant manufactured product delivered for internal consumption but
the total includes a substantial quantity of "village consumption" of
unspecified form. Competition from synthetic products has had only a
very limited effect on jute consumption in Bangladesh. Locally-produced
- 44 -
polyethylene film and bags are used primarily for packaging pharmaceuticals,
foods and other industrial products where jute is not usually used.
The use of jute sacks for packaging food grains and other agricul-
tural produce makes jute consumption strongly correlated with the index of
agricultural production. Jute consumption is also significantly related to the
real price of raw jute. Assuming that agricultural production in Bangladesh
will increase at an average rate of 3.2% per annum, domestic use of jute would
reach about 150,000 tons by the mid-1990s. However, the jute manufacturing
industry in Bangladesh will continue to depend upon exports for the major part
of its demand.
b. India
Apparent consumption of jute in India virtually doubled from an
annual average level of 530,600 tons during 1964-66 to an average of 1,053,000
tons during 1981-83. The growth in domestic consumption has exceeded the
increase in production of jute products, and jute goods exports declined from
an annual average level of 865,000 tons during 1961-63 to an average of
311,000 tons during 1981-83. As a result, India's share of world jute goods
trade declined from 45% in the early 1960s to 27% in the early 1980s.
The driving force behind the impressive growth in the demand for jute
products in India has been the substantial increase in the production of agri-
cultural products and the inputs required in farming, especially seeds and
fertilizers. Packaging of cement, and other industrial products also contri-
buted to the growth in demand for jute sacks. Jute fabrics are used for
wrapping cotton lint and cotton fabrics. Jute sacking accounted for 73% of
jute goods deliveries for domestic consumption in the early 1980s and hessian
cloth accounted for another 14%.
- 45 -
Although jute is the preferred packaging material for agricultural
produce in India, synthetic bags--high density polyethylene and polypropylene-
-are used for packaging some pesticides and chemicals. It is estimated that
during 1979-81 an average of 82 million polyolefin bags were used annually in
India, despite a price disadvantage of 20-25% compared to plastic-lined jute
B-twill bags.
As plastic supplies from local plants increase, the price elasticity
of jute demand will rise and product pricing will become increasingly crucial
for keeping jute in its present uses. The strong relationship between the
demand for jute goods and agricultural production in India suggests that con-
tinuation of the trend rate of agricultural growth (2.5% p.a.) would ensure
favorable growth in jute demand. The model simulations indicate jute consump-
tion levels of nearly 1.4 million tons at the end of the decade and around 1.5
million tons in the mid-1990s. Even if the new indigenous plastics industry is
moderately more successful in displacing jute than now anticipated, jute
consumption growth rate would still be impressive. With present mill capacity
estimated at 1.9 million tons of fiber per year, the projected increase in
consumption and maintenance of recent levels of exports of jute products could
be accommodated mostly by increased utilization of capacity. New investments
could be concentrated on increasing efficiency and the introduction of new
technology such as twistless spinning, if it proves viable.
c. Thailand
Apparent consumption of jute in Thailand demonstrated irregular but
substantial growth from the early 1960s until 1980. The explanation for the
behavior of consumption has not been satisfactorily quantified in the model,
but the evidence suggests that the declining real price of fiber was a very
- 46 -
important factor underlying the growth in consumption. The most important use
for jute in Thailand is in the form of bags for packaging rice, maize, sugar
and tapioca products. Synthetic bags are being manufactured in Thailand from
imported resins and the competition from this source may have been among the
factors responsible for the decline in jute consumption in the early 1980s.
Jute consumption in Thailand will receive another setback when the
petrochemical complex, scheduled to come on stream in 1988, provides a domes-
tic supply of plastic resins for bag manufacturing. Given the responsiveness
of jute use to the price of jute, the relative efficiencies of the jute and
plastics industries will be crucial to future trends in jute production and
consumption. Any growth in jute consumption during the next decade will likely
be modest.
d. Pakistan
Jute consumption in Pakistan doubled between the mid-1960s and the
early 1980s. The increasing requirement for jute bags and bale wraps
paralleled the substantial growth in agricultural production. The main agri-
cultural uses for jute are bags for packaging cereals, oilseeds and farm
inputs, bags for handling and transport of seed cotton, and bale wraps for
cotton lint. In spite of the imposition import duties and sales taxes that
doubled the cost of imported polypropylene resin, in the early 1980s synthetic
bags were priced at around half the price of jute bags manufactured domes-
tically from jute fiber imported duty free. Synthetic bag manufacturing
capacity reached about 48 million bags in the early 1980s and plans were
announced to add capacity for nearly 20 million bags. In the early 1980s
the fertilizer industry, a major user of polypropylene bags had an annual
- 47 -
requirement for 65 million bags and expects its requirement to increase to 85
million bags by 1987.
The continued penetration of synthetic bags into fertilizer and
textile packaging is expected to slow the growth of jute utilization in
Pakistan from the 1970-82 average annual rate of 5.2%. Nevertheless, with
agricultural production projected to increase at a rate of 3.25 percent and
the real price of jute fiber averaging around $320, in 1983 constant dollars,
the model simulations indicate jute consumption will reach about 145,000 tons
at the end of the decade and around 161,000 tons in the mid-1990s.
e. China
Official Chinese statistics on jute production are usually combined
with those for ambary hemp, so estimates for jute consumption are subject to a
great deal of uncertainty. However, the bulk of jute-like fibers produced in
China are consumed domestically and its impact on international markets in
recent years has been through the net export of jute fiber and manufactured
products--mainly sacks and yarn--of around 50,000 tons per year.
Since Chinese jute production and consumption data are uncertain,
China's market projections were calculated separately and not by assistance
from the model. Jute consumption in China is nominally projected at nearly
690,000 tons in the mid-1990s. In recent years the supply of jute bags in
China has been supplemented with an increasing quantity of polypropylene bags
made from indigenous supplies of resin. The synthetic bags were selling at a
lower price than jute ones during 1984. Jute manufacturing capacity is
expected to remain stable, and China is not expected to become a major factor
in the international market for jute fiber or products.
- 48 -
f. Year East
Apparent consumption of jute in the Near East increased from an
annual average of 160,000 tons during 1964-66 to an average of 248,400 tons
during 1981-83. Ilearly all of the jute consumed in the region is in the form
of bags, sacks and wrapping cloth. On average more than 90% is used for
packaging and handling agricultural products, but in the early 1980s military
operations in the region increased the use of jute sand bags. Around two-
thirds of the jute products used in agricultural applications was needed for
handling products consumed domestically and smaller quantities were needed for
items imported and exported. The internal handling of cereals generated the
largest demand for jute bags followed by oilseeds and cotton. Non-agricultural
uses include bagging salt, yarn and fabrics for carpets and carpet backing and
fabrics for wrapping textile goods.
Consumption of jute products in the Near East is concentrated in the
agricultural producing countries: Egypt, Iran, Iraq, Sudan, Syria and Turkey.
Imports of jute fiber and goods account for around 90% of the region's
requirements. Egypt, however, manufactured nearly three-fourths of its jute
goods requirements during the early 1980s, primarily from imported fiber.
The growth in demand for jute products in the Near East is now being
slowed by increased bulk handling of agricultural products and by the
substitution of synthetic bags for jute ones, although historically apparent
consumption was estimated to be inelastic with respect to real jute prices
(-0.33). Bulk handling is most widely used for transport and storage of
cereals. The share of local production handled in this way has increased in
recent years and imported grains usually come in bulk and are transported in
the same manner from ports to silos and flour mills. Bags are usually used for
distribution to wholesale and retail markets. Exports of groundnuts of average
- 49 -
quality from the Sudan and oilcake from Sudan and Turkey are mainly handled by
bulk methods. Although jute bags are the predominant packaging material used
in the Near East, polypropylene bags have become the most common package for
flour and fertilizer and they are also used for sugar, potatoes and onions in
some countries. Synthetic bag requirements are met by imports of finished bags
and by limited domestic manufacturing usually from imported resin.
Favorable growth prospects for cotton and textile production in the
Near East should maintain rising demand for jute hessian cloth for wrapping
textiles and bale wraps for packaging raw cotton. Increased use of bulk
handling methods for cereals, however, will impinge on the growth in demand
for sacks. This development, combined with reduced demand for sand bags
contingent upon military disengagement, would keep the increase in total
demand for jute to modest proportions. Jute consumption in the Near East is
projected at around 250,000 tons per annum in the mid-1990s.
g. Africa
Apparent consumption of jute in the African countries (excluding the
North African countries included in the Near East) averaged around 230,000
tons per year from the early 1960s up to the mid 1970s. Since 1975, jute
consumption in South Africa has been on a substantially lower plateau than in
the earlier years, and apparent consumption in the African countries averaged
only 169,000 tons during 1981-83. During the last few years jute consumption
was adversely affected by lower agricultural production caused by the pro-
longed drought in Africa South of the Sahara. Regionally, jute utilization
declined during the 1970s in Western and Southern Africa, increased steadily
in Northwest Africa and remained about level in East and Central Africa. As in
other developing regions, jute products were used largely for packaging agri-
cultural commodities, with sacks for minerals and fertilizers being important
- 50 -
uses in some countries. Bulk handling has only a limited impact on the demand
for jute sacks and bags in Africa, but alternative packaging materials,
particularly sisal, in East Africa, and polypropylene bags in Nigeria have
made significant penetration into jute markets.
The emphasis on improving agriculture in Africa, if successful, will
provide an important opportunity for jute producers since jute consumption is
highly elastic with respect to the index of agricultural production. There are
major obstacles to capitalizing on those opportunities, however. Importers are
generally faced with escalating duties for jute products vis-a-vis jute fiber
or plastic resin, which provides an incentive for local manufacturing. Where
local manufacturing is inefficient and/or plant capacity utilization low, jute
bag consumption is discouraged by relatively high costs. In those cases,
marketing opportunities could be improved by successful negotiations for trade
policy changes that would permit freer import of jute goods from more effi-
cient manufacturers. Alternatively, market opportunities for raw jute would be
improved if appropriate technical assistance could improve the efficiency of
local manufacturing. The generated forecasts indicate that, after some further
decline, there could be a turnaround in jute consumption so that by the mid-
1990s consumption will be near the 1981-83 average.
h. Latin America
Consumption of jute-like fibers in Latin America is predominantly in
sacks and bags for packaging agricultural products in Brazil and Cuba. The
share of these two countries in Latin America's total consumption of jute
increased from 44% in the mid-1960s to 84% in the early 1980s. Aggregate con-
sumption in the region declined from an annual average of 237,300 tons during
1964-66 to 174,400 during 1981-83. Jute's poor market position is explained by
the displacement of sacking by bulk handling of agricultural produce, the
- 51 -
replacement of jute sacks by those made from paper and synthetic fibers and
administrative measures taken against the import of jute fiber and products to
protect domestic production of hard fibers used in bag manufacturing.
Brazil. Brazil's predominant position in jute-like fibers in Latin
America is illustrated by its 82% share of the region's production of these
fibers and its 42% share of consumption during 1981-83. Annual production
fluctuates widely because of the high risk of flooding in the river basins
where the fiber is grown. There is also substantial instability in demand
because of fluctuations in production of the products that utilize jute sacks;
coffee, sugar, rice (paddy), raw cotton, cocoa beans and peppers.
Although agricultural production in Brazil continued rising during
the late 1970s and early 1980s, jute consumption peaked at an average of
105,000 tons in the mid-1970s and declined to an average of 74,300 tons in the
early 1980s. The greatest impact on the potential jute bag market was the
development of bulk handling and storage of grains and soybeans. These commo-
dities are predominantly bulk-handled, with the use of jute and synthetic bags
being confined to packaging planting seeds and a small amount of grain for
domestic distribution. By the late 1970s the 250 million synthetic bags being
produced annually made substantial penetration into the bag market, accounting
for a predominant share of the sacking used for peanuts, potatoes and onions.
These gains were aided by very competitive prices for synthetic bags compared
to the price of jute bags.
The substantial cost savings from bulk handling of grains have
encouraged the construction of silos, even in the newly-opened agricultural
areas, and will not again be an area for jute demand growth. The efficiency of
synthetic bag production vis-a-vis jute bag manufacturing is well established
and they will likely continue to penetrate the bag market. With jute
- 52 -
consumption in Brazil being highly correlated with national jute production,
and jute production and manufacturing being crucially dependent upon
government support policies, the future direction of jute consumption will be
largely determined by the level of government support given to the industry.
Cuba. The principal uses for jute in Cuba are in sacks for packaging
sugar for domestic distribution, heavy jute bags for fertilizers, salt and
some mineral ores, and light bags for potatoes, onions, grains and forage.
Jute sacks lost an important use when sugar exports were converted to bulk
handling in the mid-1970s. Locally-produced kenaf is quite limited and the
bulk of Cuba's jute sacks are imported from the USSR. Apparent consumption of
jute in Cuba averaged 51,000 tons per year during 1964-66 and increased to an
average of 72,400 tons during 1981-83.
Basically, future demand for jute sacks in Cuba depends upon the
local distribution of sugar and on the production of other packagable food
crops. Jute's loss of the sugar export packaging use and the recent introduc-
tion of fiber blending in jute processing plants--woven fabrics of 25% poly-
propylene and 75% kenaf yarns--caused a decline in apparent consumption of the
natural fiber during the early 1980s. Should the blended fabrics find only
limited acceptance in the sacking market jute consumption could continue over
the next decade at near the 1981-83 average level of 72,000 tons per year.
Eastern Europe and the USSR.
Apparent, consumption of jute in the USSR has increased since 1970 at
an annual rate of 2.5% to an annual average of 220,400 tons during 1981-83. In
Eastern Europe jute consumption has trended moderately downward since 1970 but
still averaged 93,700 tons during 1981-83. Jute consumption in the combined
region is negatively correlated to the production of flax in the previous year
- 53 -
and to the real price of jute hessian in the international market. Consumption
is positively related to the level of cereal production in the region.
The pattern of jute uses in Eastern Europe is broadly reflected in
the consumption pattern in Poland. Bag production accounts for about 45% of
the jute used in Poland. About half of these bags are required for packaging
flour. For this purpose, jute is strongly preferred over woven polypropylene
because of less loss of content during transport. Another 40% of the jute used
is for floor-covering purposes, including carpet yarns, carpet backing and
felt. Smaller amounts are consumed by the furniture and construction indus-
tries and as jute packaging cloth.
Jute manufacturing is declining in Eastern Europe and there is a
tendency to replace old jute-processing machinery with equipment for making
substitute polypropylene products. Polypropylene production capacity in
Hungary is around 80,000 tons and is expected to increase to 95,000 tons in
1986. Some 30,000 tons of the polypropylene is consumed domestically, with
11,500 tons being used to make products that substitute for jute goods. The
main competing synthetic products are tapes for making woven bags and carpet
backing and fiber for cordage and carpet yarns. In Poland more than 7,000 tons
of polypropylene is used in products that compete with jute and in Romania
locally manufactured synthetic bags fully meet the sacking needs for
fertilizers and chemical products.
The attrition of jute manufacturing capacities in Eastern Europe and
the increasing availability of synthetic resins for making synthetic substi-
tutes present a strong marketing challenge to jute manufacturers and
exporters. The moderate down-trend in jute consumption in Eastern Europe is
likely to continue throughout the projection period. The effects of synthetic
- 54 -
substitution in the USSR apparently have had a less severe impact on jute con-
sumption than in Eastern Europe. Also, the domestic production of flax and
hemp has declined in recent years and jute can be substituted for them in some
end-uses. Continued growth in jute consumption in the USSR is expected to
maintain a modest uptrend in demand for the entire region over the next
decade.
Rest of the World.
Apparent consumption of jute outside the countries and regions
covered above declined from an average of 364,300 tons per year during 1964-66
to an average of 194,900 tons during 1981-83. There are no major consumers in
this group and no reason to expect a reversal of the downward trend in
consumption in the next decade. A continuation of the recent modest decline
would reach a level of around 160,000 tons in the mid-1990s.
In summary, world jute demand growth prospects during the next decade
are improved compared to the actual performance since 1970 (Table 10). The
sharp declines in jute use in the industrial countries have moderated. The
jute products with the poorest market prospects have been reduced to a small
proportion of total consumption and jute secondary carpet backing faces good
growth potential so long as it is kept competitive with synthetic substitutes
on cost and quality considerations.
The demand base for jute consumption in the developing countries is
the packaging requirements for agricultural produce. Prospects for the expan-
sion of this base are quite good. Although jute consumption growth is expected
to fall short of the increase in agricultural output, the projected growth
would be sufficient to raise the utilization of jute manufacturing facilities
in producing cotntries near to their capacity limits by the mid-1990s.
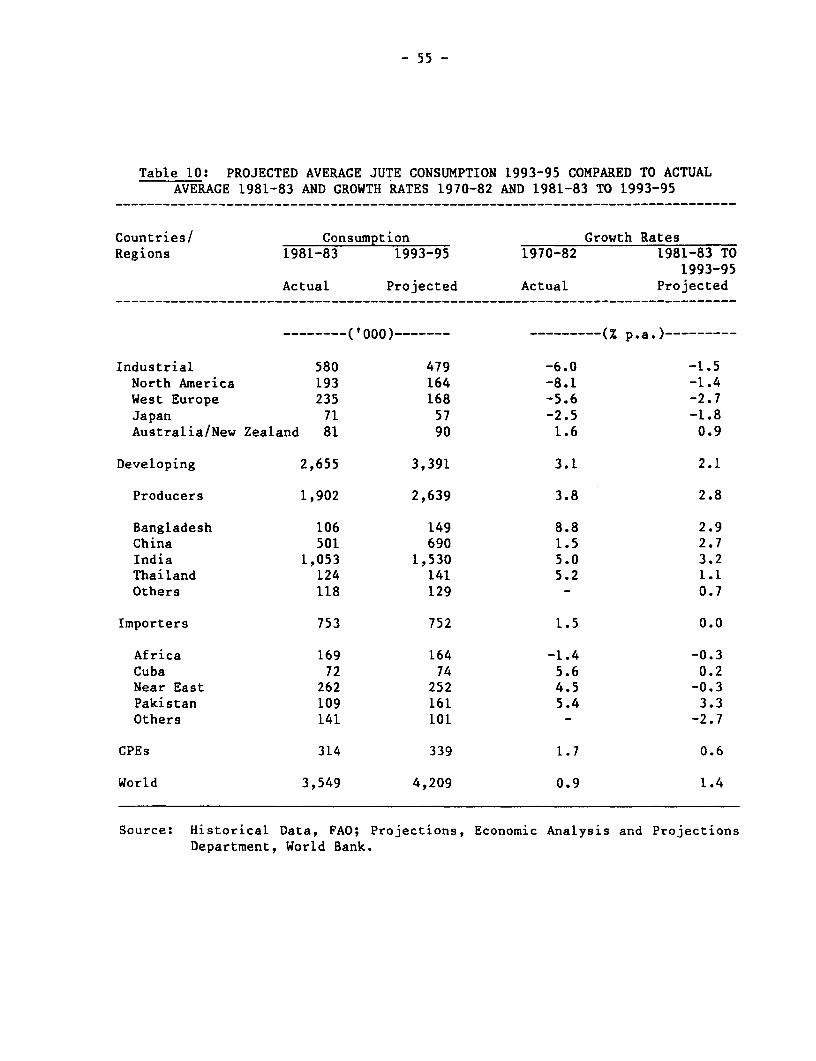
- 55 -
Table 10: PROJECTED AVERAGE JUTE CONSUMPTION 1993-95 COMPARED TO ACTUALAVERAGE 1981-83 AND GROWTH RATES 1970-82 AND 1981-83 TO 1993-95
Countries/ Consumption Growth RatesRegions 1981-83 1993-95 1970-82 1981-83 TO
1993-95Actual Projected Actual Projected
-…------('000)------ ---------(Z p.a.)---------
Industrial 580 479 -6.0 -1.5North America 193 164 -8.1 -1.4West Europe 235 168 -5.6 -2.7Japan 71 57 -2.5 -1.8Australia/New Zealand 81 90 1.6 0.9
Developing 2,655 3,391 3.1 2.1
Producers 1,902 2,639 3.8 2.8
Bangladesh 106 149 8.8 2.9China 501 690 1.5 2.7India 1,053 1,530 5.0 3.2Thailand 124 141 5.2 1.1Others 118 129 - 0.7
Importers 753 752 1.5 0.0
Africa 169 164 -1.4 -0.3Cuba 72 74 5.6 0.2Near East 262 252 4.5 -0.3Pakistan 109 161 5.4 3.3Others 141 101 - -2.7
CPEs 314 339 1.7 0.6
World 3,549 4,209 0.9 1.4
Source: Historical Data, FAO; Projections, Economic Analysis and ProjectionsDepartment, World Bank.
- 56 -
The best prospects for jute consumption growth continue to be in the
Asian jute-producing countries. Even there, however, the increases in jute
consumption are expected to be more moderate than in the past due to further
inroads of synthetic bags, particularly for packaging fertilizers and chemi-
cals, and additional development of bulk-handling transport and storage
facilities.
The magnitude of India's jute production, manufacturing and consump-
tion is of such importance in the world jute industry that it seemed prudent
to use the model simulations to test the effects of an alternate production
growth rate in India on the jute industries of other countries. Should jute
production in India increase to the mid-1990s at around one-half the 2.9% per
annum rate generated in the base run, the impact is shown to reduce India's
jute consumption by only 1.2% in the mid-1990s. By that time the accumulative
shortfall in India's production would require marginal net imports of jute to
meet indigenous consumption requirements. The impact of this increased demand
on jute supplies from other countries would be to raise real world jute prices
by around 15%. Ihe most responsive jute supplier appears to be Bangladesh
whose production it is estimated would increase by 12%. Net world production
and world consumption would decline by around 2%.
- 57 -
Annex I
AN ECONOMETRIC MODEL OF THE WORLD JUTE ECONOMY
An econometric model of the world jute economy was built to examine
quantitatively the relationships among key variables relevant to the world
jute market in order to evaluate jute market prospects in the medium to long
term. Previously-built jute models were examined, but they were found inappro-
priate for analyzing current problems since they were constructed before the
recent drastic changes occurred in demand in the industrial countries. 1/ This
Annex describes the technical aspects of the model.
Given the data limitations, several assumptions were made to simplify
the model. They include:
ti) Due to lack of consistent data on demand for individual jute goods in
many markets, most of the demand in major markets is treated in terms
of raw jute equivalents;
(ii) Although there are differences in physical properties between jute
and jute-like fibers such as kenaf and mesta, they are all treated as
a uniform commodity; and
(iii) Real prices of raw jute and jute goods in most markets are proxied by
the corresponding world prices expressed in terms of local currencies
and deflated by local wholesale price indices.
Due to data limitations, supply analysis in producing countries other
than Bangladesh was done in a rather rudimentary way. To the extent that
further work can improve the model, including collection of data, the current
version could be considered as a prototype.
1/ See References for major jute econometric models built in the past.
- 58 -
All the data used are from FAO except for world stocks which were
calculated as the differences between world supply and demand in each year
(details given lbelow), As a proxy for the world price of raw jute, quotations
for Bangladesh White D, (BWD), f.o.b. Chittagong/Chalna were used.
In the the first and second sections below, the demand and supply
blocks of the model are described. The third section discusses how world jute
stocks are estimated and how the price equation is specified. The last section
describes the way various prices used in the model are linked.
The Demand Block
World d[emand is broken down into 15 regions and 17 markets. They are
India, Africa, Japan, Cuba, Brazil, Australia, Thailand, Bangladesh, Pakistan,
China, the Neat' East, Western Europe, Eastern Europe and the USSR, North
America and the Rest-of-World. The North American market is further broken
down into the US secondary carpet backing market, the US primary carpet
backing market and other products.
A major difficulty encountered in estimating demand equations was the
lack of data on the demand for jute substitutes and technological developments
such as bulk-handling in each market. For most of the developing country
markets, raw jute or jute goods' prices deflated by inflation indices and
total agricultural production proved to be significant in explaining demand.
These results confirmed our a priori expectation that in most developing
countries the extent of jute substitution and bulk-handling has been limited.
However, demand equations for industrialized countries proved to be much more
difficult. Consumption data for the last 15 years or so in most industrialized
country markets showed a sharp decline. The sharp decline was caused mainly by
the expansion of bulk-handling and is treated in the model by a time trend.
- 59 -
Such treatment causes a problem in forecasting demand as it assumes that the
same trend will continue. In making the projections, extrapolations of the
trends of the last 5 years were assumed.
Table I.1 shows the estimated elasticities with regard to the
agricultural production index, GNP and time trend for the 17 markets.
Elasticities of the agricultural production indices for India, Africa and
Australia are well above unity. In the case of India and Africa this is most
probably due to the fact that as agricultural production has increased, the
volumes of agricultural commodities requiring jute sacking for transportation
has increased sharply. As for Australia, the high agricultural production
elasticity reflects recent large increases in its exports of grains to the
Middle East, a market which requires bag handling. In most of the
industrialized countries, sharply declining trends are observed. They are due,
in the main, to increased bulk-handling of agricultural commodities in these
countries.
The estimated price elasticities of demand for each market and the
world (which is the sum of the weighted average of each market) are given in
Table I.2. The estimated own-price elasticities of demand range from 0 to -0.8
in the short run and 0 to -2.0 in the long run, depending on the markets. The
weighted world price elasticities of demand are -0.31 and -0.44 for the short
run and long run, respectively. As Table I.2 indicates, most of the price
elasticities were found to be significant at the 95% level. The very low
short-term world price elasticity of demand is an important reason for the
wide price fluctuations jute has experienced in the past, usually in response
to changes in supply.
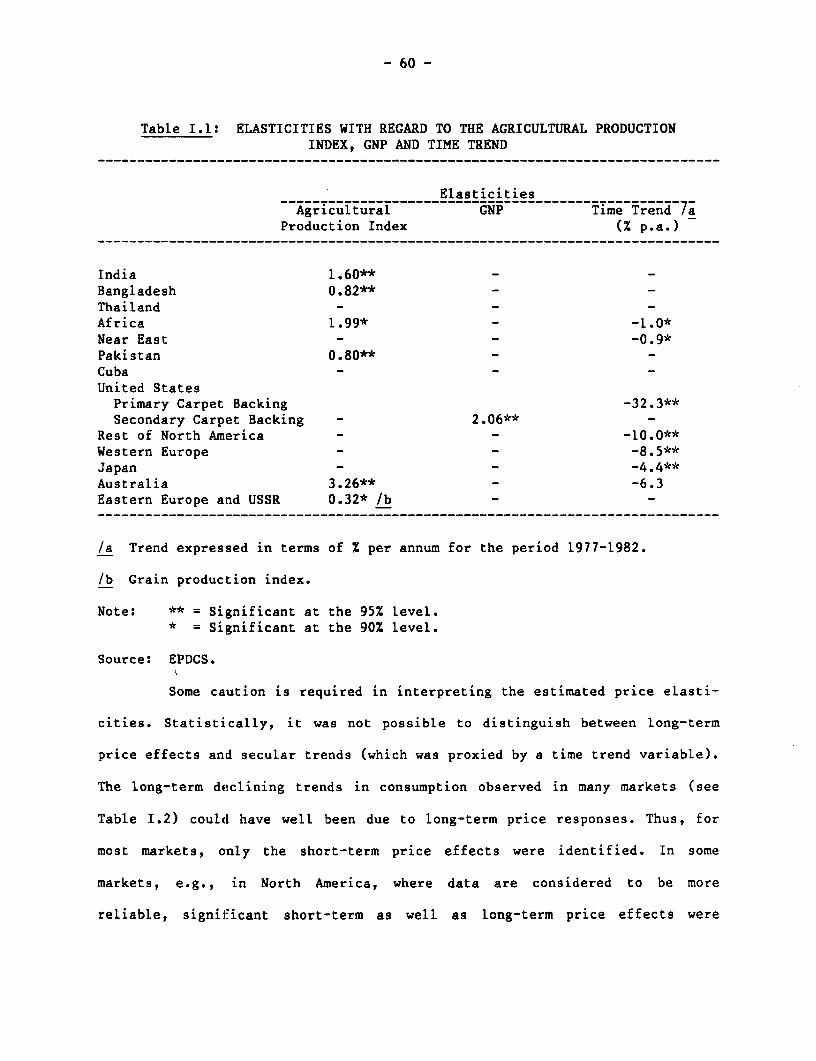
- 60 -
Table I.1: ELASTICITIES WITH REGARD TO THE AGRICULTURAL PRODUCTIONINDEX, GNP AND TIME TREND
ElasticitiesAgricultural GNP Time Trend 7a
Production Index (Z p.a.)
India 1.60**Bangladesh 0.82**Thailand - -Africa 1.99* - -1.0*Near East - .-0.9*Pakistan 0.80** -Cuba - -United StatesPrimary Carpet Backing -32.3**Secondary Carpet Backing - 2.06**
Rest of North America - - -10.0**Western Europe - - -8.5**Japan _ _ -4.4**Australia 3.26** - -6.3Eastern Europe and USSR 0.32* /b - -------------------------------------------------------------------------- __--_
/a Trend expressed in terms of % per annum for the period 1977-1982.
/b Grain production index.
Note: ** = Significant at the 95% level.* = Significant at the 90% level.
Source: EPDCS.
Some caution is required in interpreting the estimated price elasti-
cities. Statistically, it was not possible to distinguish between long-term
price effects and secular trends (which was proxied by a time trend variable).
The long-term declining trends in consumption observed in many markets (see
Table I.2) could have well been due to long-term price responses. Thus, for
most markets, only the short-term price effects were identified. In some
markets, e.g., in North America, where data are considered to be more
reliable, significant short-term as well as long-term price effects were
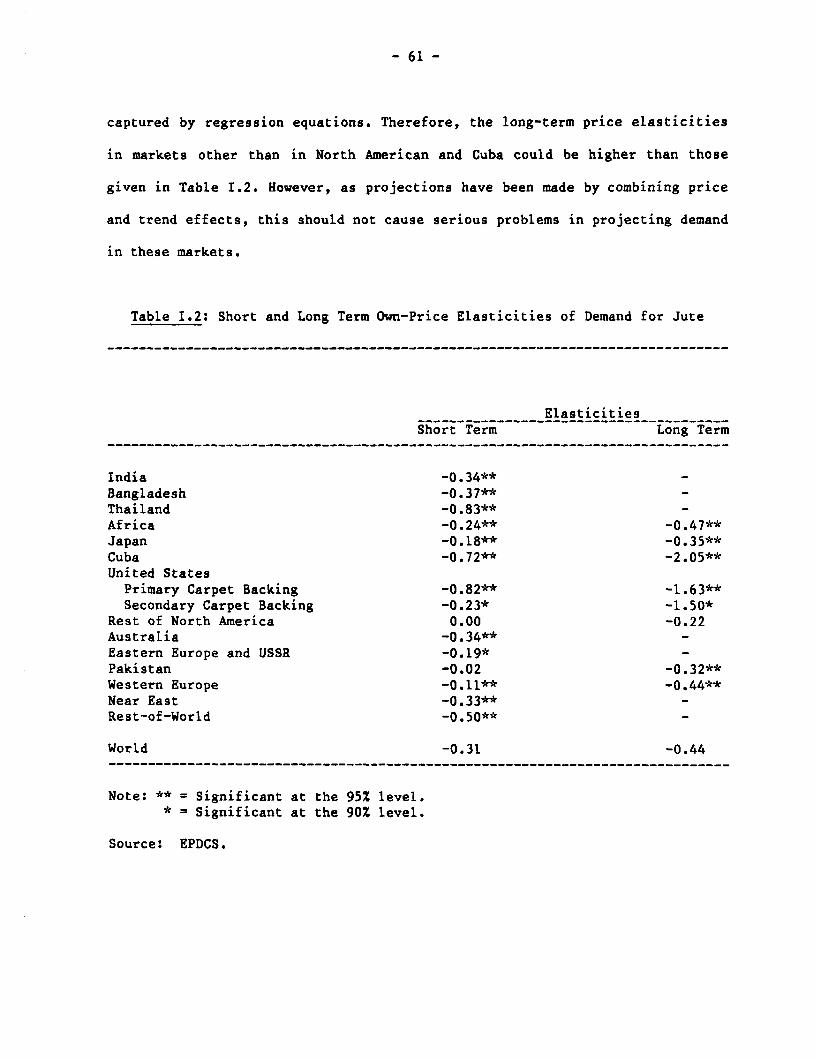
- 61 -
captured by regression equations. Therefore, the long-term price elasticities
in markets other than in North American and Cuba could be higher than those
given in Table I.2. However, as projections have been made by combining price
and trend effects, this should not cause serious problems in projecting demand
in these markets.
Table I.2: Short and Long Term Own-Price Elasticities of Demand for Jute
ElasticitiesShort Term Long Term
India -0.34**Bangladesh -0.37**Thailand -0.83**Africa -0.24** -0.47**Japan -0.18** -0.35**Cuba -0.72** -2.05**United States
Primary Carpet Backing -0.82** -1.63**Secondary Carpet Backing -0.23* -1.50*
Rest of North America 0.00 -0.22Australia -0.34** -Eastern Europe and USSR -0.19*Pakistan -0.02 -0.32**Western Europe -0.11** -0.44**Near East -0.33**Rest-of-World -0.50** -
World -0.31 -0.44
Note: ** = Significant at the 95X level.* = Significant at the 90% level.
Source: EPDCS.
- 62 -
In addit:ion to the use of price and economic activity variables as
explanations of dlemand, a time trend was used as an explanatory variable to
proxy technological developments in several markets. Such developments were
prevalent in the markets of US primary carpet backing, hessian and sacking in
North America, Japan, Western Europe and to a lesser degree in Africa and
Australia. The major technological development in these markets in the past
two decades, which reduced jute demand sharply, was the bulk-handling of
commodities formerly packaged in jute sacks. However, we believe that this
technological development had run its course in the industrial countries by
the early 1980s and we doubt the past trend will continue. For example, jute
demand, which declined substantially in Japan and Western Europe up to the
late 1970s, has shown stability since. Thus, in the forecasting exercises with
the model, qualitative judgments have been used to reduce the rate of time-
trend decline in many of the demand equations.
Demand equations for China and Brazil are treated differently from
the others. In these countries, most of production is consumed domestically
and there is little trade. Thus, the main explanatory variable in the demand
equations for these countries is their jute production.
The Supply Block
Jute supply equations were estimated for Bangladesh, India, Thailand,
Nepal, Burma, China and the Rest-of-World. Detailed discussion of the supply
response in BangLadesh is given in the paper "Jute Supply Response in
Bangladesh". L/ The model uses equations (2) and (4) given in that paper for
1/ World Bank Commodity Staff Working Paper, No. 13, 1985.
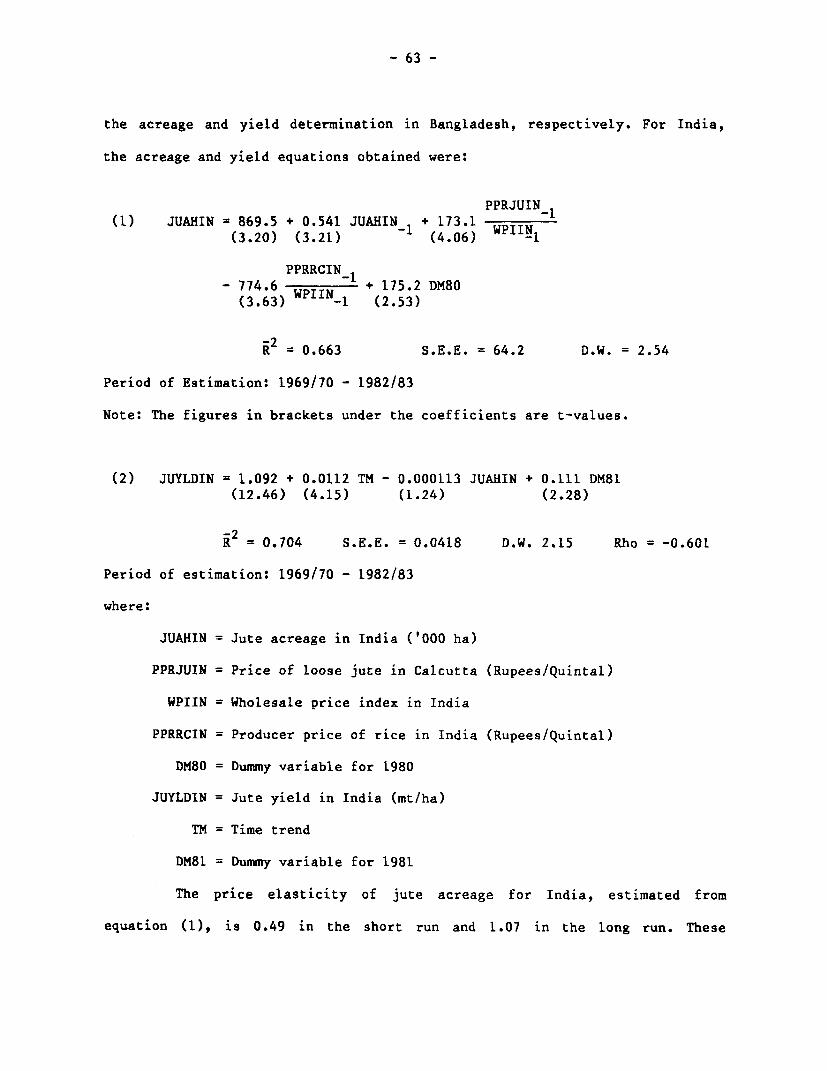
- 63 -
the acreage and yield determination in Bangladesh, respectively. For India,
the acreage and yield equations obtained were:
PPRJUIN(1) JUAHIN = 869.5 + 0.541 JUAHIN_1 + 173.1 WPIIN
(3.20) (3.21) (4.06) -1
PPRRCIN_1- 774 6 WPIIN + 175.2 DM80(3.63) -1 (2.53)
R = 0.663 S.E.E. = 64.2 D.W. = 2.54
Period of Estimation: 1969/70 - 1982/83
Note: The figures in brackets under the coefficients are t-values.
(2) JUYLDIN = 1.092 + 0.0112 TM - 0.000113 JUAHIN + 0.111 DM81(12.46) (4.15) (1.24) (2.28)
R- = 0.704 S.E.E. = 0.0418 D.W. 2.15 Rho = -0.601
Period of estimation: 1969/70 - 1982/83
where:
JUAHIN = Jute acreage in India ('000 ha)
PPRJUIN = Price of loose jute in Calcutta (Rupees/Quintal)
WPIIN = Wholesale price index in India
PPRRCIN = Producer price of rice in India (Rupees/Quintal)
DM80 = Dummy variable for 1980
JUYLDIN = Jute yield in India (mt/ha)
TM = Time trend
DM81 = Dummy variable for 1981
The price elasticity of jute acreage for India, estimated from
equation (1), is 0.49 in the short run and 1.07 in the long run. These
- 64 -
elasticities are similar to that for Bangladesh which is 0.68. In the yield
equation a time trend variable was used, due to the lack of long time series
data on fertilizer consumption. The jute acreage variable is used in the yield
equations for India on the basis of the results for Bangladesh which showed
that as the acreage is expanded jute would be grown in areas less suited for
jute growing and this reduces average yield.
Production was directly estimated for the other countries because of
the poor statistical results obtained from regression analyses using acreage
and yield data. The reason for these poor results appears to be the poorer
quality of acreage and yield data compared with the production data.
Tapioca is the main agricultural commodity that competes with kenaf
for land use in Thailand. Thus, the main explanatory variable used for the
Thai supply equation is the price ratio of kenaf to tapioca. Statistical
examination showed that for the Thai supply equation, the distributed-lag
specification best explains the supply response.
Due to the lack of producer prices of jute and rice, we assumed that
the producer prices in Burma, China and Nepal are correlated to world prices.
Thus, for those countries the lagged ratio of world prices of jute and rice
was used to explain jute supply. For the Rest-of-World, a measure of raw jute
prices deflated by a measure of international inflation (MUV) was used as an
explanatory variable. In spite of these crude assumptions on jute and
competing commodity prices, the supply equations for these countries/regions
showed a fairly gDod fit and the price terms were significant at the 95% level
for all the equations.
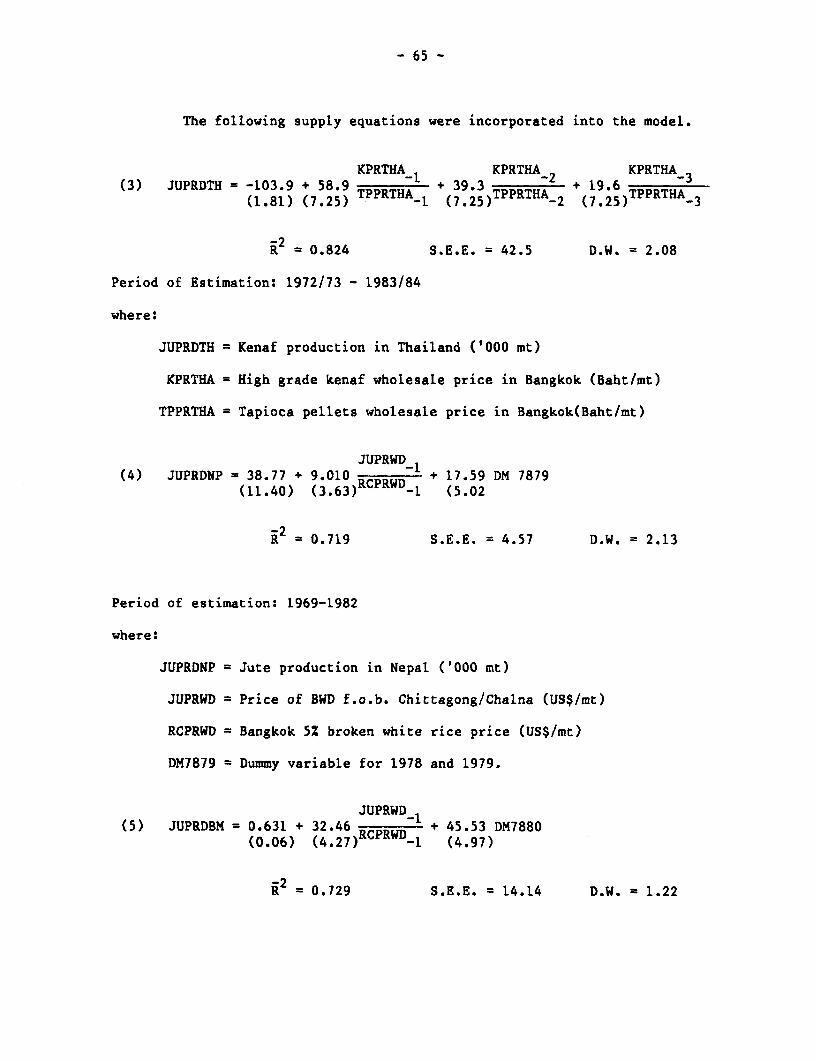
- 65 -
The following supply equations were incorporated into the model.
KPRTHA._ KPRTHA_ KPRTHA_3(3) JUPRDTH = -103.9 + 58.9 TPRTA - 39.3 -2+ 19 6 TPRH
(1.81) (7.25) _IRTA (7.25 )TPPRTHA_2 -7~)TPRH_3
i2= 0.824 S.E.E. = 42.5 D.W. = 2.08
Period of Estimation: 1972/73 - 1983/84
where:
JUPRDTH =Kenaf production in Thailand ('000 mt)
KPRTHA = Hfigh grade kenaf wholesale price in Bangkok (Baht/mt)
TPPRTHA = Tapioca pellets wholesale price in Bangkok(Baht/mt)
JUPRWD_1(4) JUPRDNP = 38.77 + 9.010 + 17.59 DM 7879
(11.40) (3.63) -CRW_l (5.02
i2= 0.719 S.E.E. = 4.57 D.W. =2.13
Period of estimation: 1969-1982
where:
JUPRDKP = Jute production in Nepal ('000 mt)
JUPRWD =Price of BWD f.o.b. Chittagong/Chalna (US$hmt)
RCPRWD = Bangkok 5% broken white rice price (Us$/mt)
DM7879 =Dummy variable for 1978 and 1979.
JUPRWD_1(5) JUPRDBM = 0.631 + 32.46 i*pm 45.53 DM7880
(0.06) (4.27) RW 1 (497
i2= 0.729 S.E.E. = 14.14 D.W. = 1.22
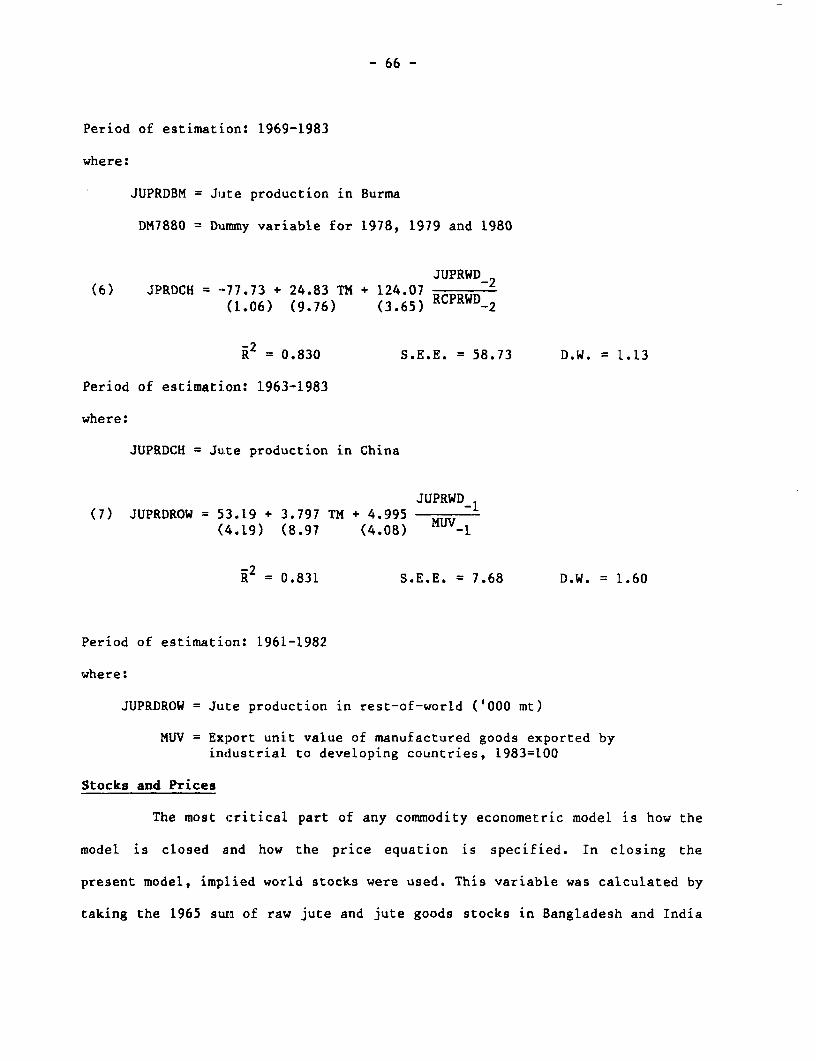
- 66 -
Period of estimation: 1969-1983
where:
JUPRDBM = Jute production in Burma
DM7880 = Dummy variable for 1978, 1979 and 1980
JUPRWD2(6) JPRDCH = --77.73 + 24.83 TM + 124.07 2
(1.06) (9.76) (3.65) RCPRWD 2
R2 = 0.830 S.E.E. = 58.73 D.W. = 1.13
Period of estimation: 1963-1983
where:
JUPRDCH = Jute production in China
JUPRWD1(7) JUPRDROW = 53.19 + 3.797 TM + 4.995 MUV
(4.19) (8.97 (4.08) -1
-2 = 0.831 S.E.E. = 7.68 D.W. = 1.60
Period of estimation: 1961-1982
where:
JUPRDROW = Juite production in rest-of-world ('000 mt)
MUV = Export unit value of manufactured goods exported byindustrial to developing countries, 1983=L00
Stocks and Prices
The most critical part of any commodity econometric model is how the
model is closed and how the price equation is specified. In closing the
present model, implied world stocks were used. This variable was calculated by
taking the 1965 surn of raw jute and jute goods stocks in Bangladesh and India
- 67 -
of 677,000 mt as the base and creating data for the following years by adding
the algebraic difference of the world production and world consumption for
each of the following years.
Mathematically, this can be expressed as:
(8) CALWDSTKt = CALWDSTKt 1 + JUPRDWDt - CWDt
where:
CALWDSTK = Implied or calculated world stocks ('000 mt)
JUPRDWD = World jute production ('000 mt)
CWD World jute consumption ('000 mt)
In order to examine whether the implied world stocks CALWDSTK
actually represent the "real" world stocks, correlation coefficients between
CALWDSTK and the sum of the raw jute and jute goods stocks held in Bangladesh
and India were calculated. Correlation coefficients of 0.91 and 0.96 were
found for the periods 1965-1982 and 1972-1982, respectively.
The correlation coefficients and the movements of the two variables
since 1965 as shown in Figure I.1 suggest that CALWDSTK proxies the "real"
world stock level well. This enables us to use equation (8) to close the model
and to use CALWDSTK as an explanatory variable in the price equation.
The price chosen to represent the real world price of raw jute is the
crop year average of BWD f.o.b. Chittagong/Chalna deflated by MUV, and the
explanatory variables are polypropylene resin price in Western Europe deflated
by MJV, the ratio of CALWDSTK to the world jute consumption excluding Brazil
and China (consumption of these two countries have had little impact on the
world jute economy), real US dollar interest rate proxied by the difference
between US government bond yield and the world inflation rate (proxied by
percentage year-to-year change in MUV) and a dummy variable for 1973 and 1974
when jute prices increased sharply with petroleum prices.
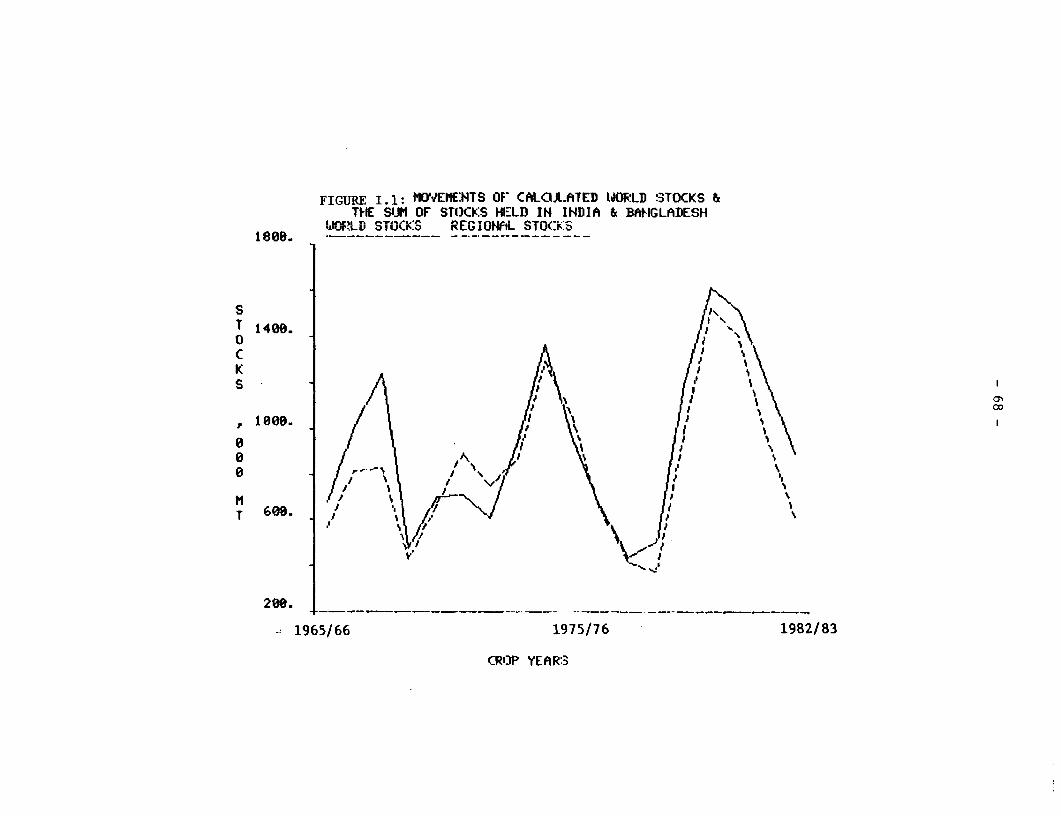
FIGURE I. 1: MOVEtE:MTS OF CALCUL.ATED WORLD STOCKS &THE SIJM OF STOCKS HIELD IH INDIA & BfAGLADESH
IiOF?LD STOCk:S REG NfOL STOCKS1800.
T 1408.
c AK~~~~~~~~~~~~~~~~~IK .
0 \%~~~~~i /.5S
200.~~~~'.
-- 1965/66 1975/76 1982/83
CR')P YEARS3
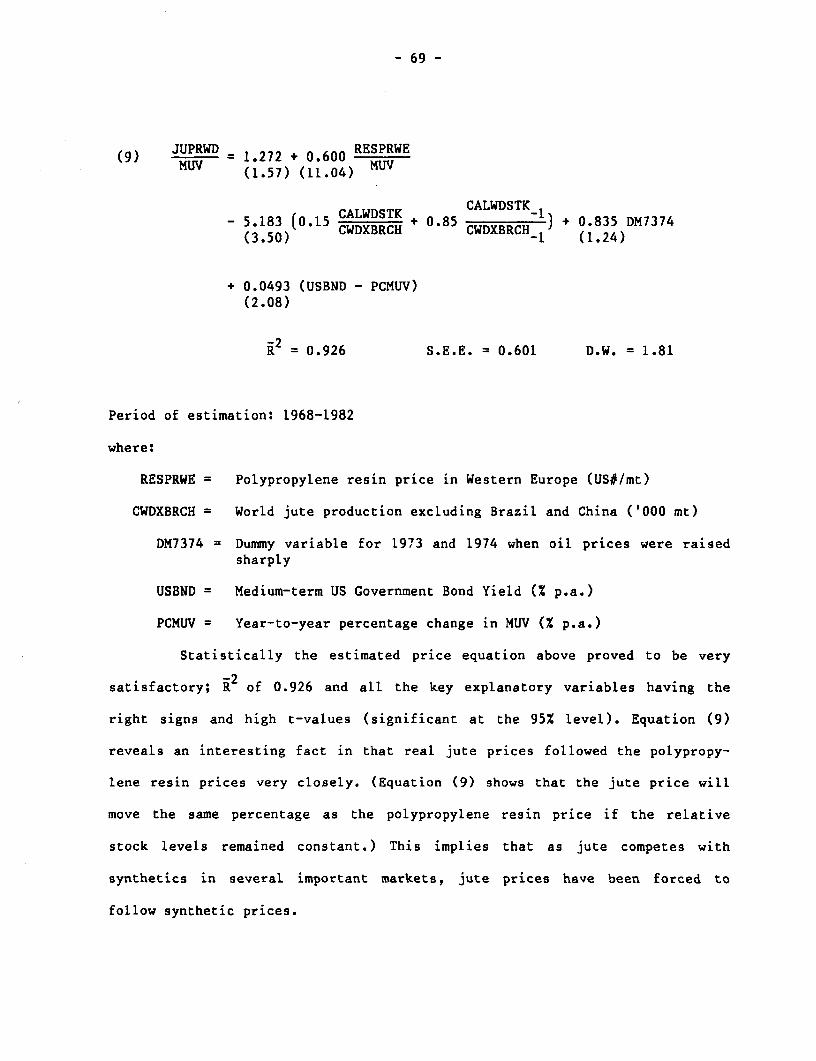
- 69 -
9) JUPRWD =1.272 + 0.600 RESPRWE
(9) M W = (1.57) (11.04) MUV
- 5.183 (0.15 CALWDSTK i 0.85 WD 1STK_) + 0.835 DM7374(3.50) CWDXBRCH CWDXBRCH_1 124
+ 0.0493 (USBND - PCMUV)(2.08)
-2 = 0.926 S.E.E. = 0.601 D.W. = 1.81
Period of estimation: 1968-1982
where:
RESPRWE = Polypropylene resin price in Western Europe (US#/mt)
CWDXBRCH = World jute production excluding Brazil and China ('000 mt)
DM7374 = Dummy variable for 1973 and 1974 when oil prices were raisedsharply
USBND = Medium-term US Government Bond Yield (% p.a.)
PCMUV = Year-to-year percentage change in MUV (% p.a.)
Statistically the estimated price equation above proved to be very
satisfactory; R of 0.926 and all the key explanatory variables having the
right signs and high t-values (significant at the 95% level). Equation (9)
reveals an interesting fact in that real jute prices followed the polypropy-
lene resin prices very closely. (Equation (9) shows that the jute price will
move the same percentage as the polypropylene resin price if the relative
stock levels remained constant.) This implies that as jute competes with
synthetics in several important markets, jute prices have been forced to
follow synthetic prices.
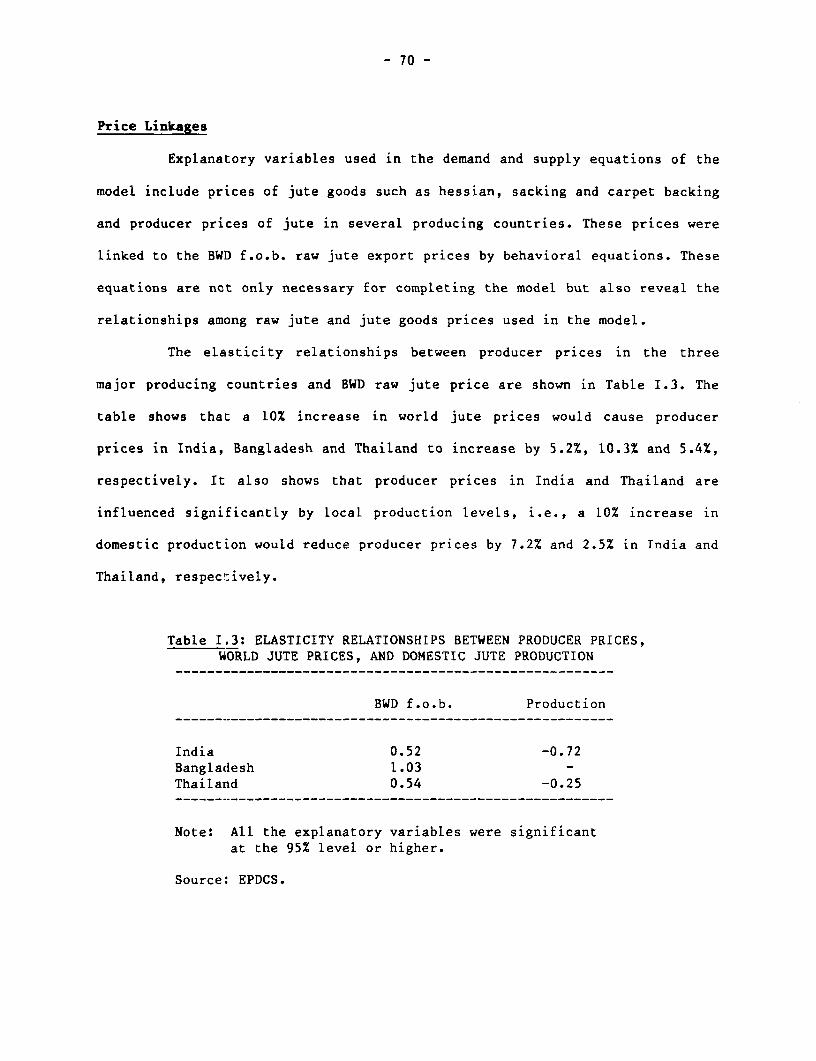
- 70 -
Price Linkages
Explanatory variables used in the demand and supply equations of the
model include prices of jute goods such as hessian, sacking and carpet backing
and producer prices of jute in several producing countries. These prices were
linked to the BWD f.o.b. raw jute export prices by behavioral equations. These
equations are not only necessary for completing the model but also reveal the
relationships among raw jute and jute goods prices used in the model.
The elasticity relationships between producer prices in the three
major producing countries and BWD raw jute price are shown in Table I.3. The
table shows that a 10% increase in world jute prices would cause producer
prices in India, Bangladesh and Thailand to increase by 5.2%, 10.3% and 5.4%,
respectively. It also shows that producer prices in India and Thailand are
influenced significantly by local production levels, i.e., a 10% increase in
domestic production would reduce producer prices by 7.2% and 2.5% in India and
Thailand, respecitively.
Table I.3: ELASTICITY RELATIONSHIPS BETWEEN PRODUCER PRICES,WORLD JUTE PRICES, AND DOMESTIC JUTE PRODUCTION
BWD f.o.b. Production
India 0.52 -0.72Bangladesh 1.03 -Thailand 0.54 -0.25
Note: All the explanatory variables were significantat the 95% level or higher.
Source: EPDCS.
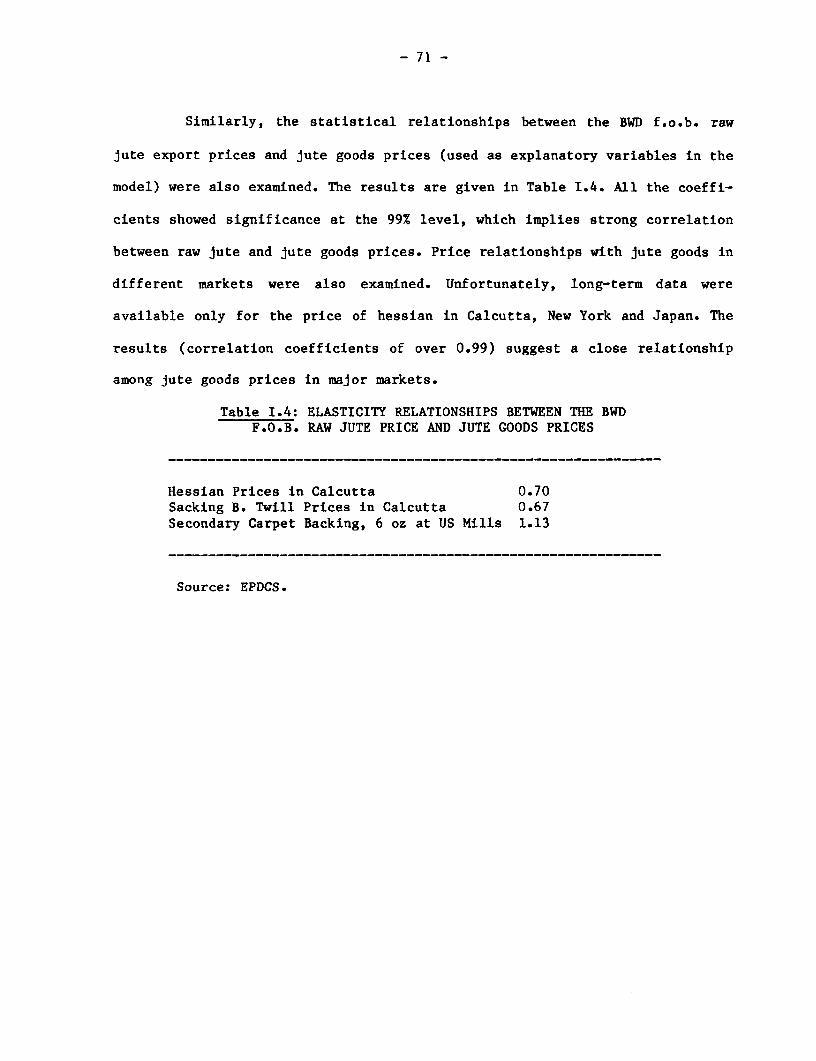
- 71 -
Similarly, the statistical relationships between the BWD f.o.b. raw
jute export prices and jute goods prices (used as explanatory variables in the
model) were also examined. The results are given in Table I.4. All the coeffi-
cients showed significance at the 99% level, which implies strong correlation
between raw jute and jute goods prices. Price relationships with jute goods in
different markets were also examined. Unfortunately, long-term data were
available only for the price of hessian in Calcutta, New York and Japan. The
results (correlation coefficients of over 0.99) suggest a close relationship
among jute goods prices in major markets.
Table 1.4: ELASTICITY RELATIONSHIPS BETWEEN THE BWDF.O.B. RAW JUTE PRICE AND JUTE GOODS PRICES
Hessian Prices in Calcutta 0.70Sacking B. Twill Prices in Calcutta 0.67Secondary Carpet Backing, 6 oz at US Mills 1.13
Source: EPDCS.
- 72 -
Annex II
ANALYSIS OF PRICE FLUCTUATIONS IN THE WORLD JUTE MARKET
In view of the wide supply/price fluctuations which jute has
experienced in the past, several studies have suggested it would be desirable
to implement policies to stabilize the jute market. 1/ If it does make
economic sense to attempt to stabilize the jute market, a question not
discussed here, it is necessary to establish the nature and the sources of the
instability so as to design the most appropriate policy. In this Annex the
sources and nature of jute market instability are analyzed.
As the price equation for raw jute used in the econometric model
implies (See Annex I), raw jute prices can be explained by changes in world
jute stocks, polypropylene prices and US interest rates. Since no jute-
producing country can take action to influence polypropylene prices or US
interest rates, analysis should focus on the relationships among key variables
of the jute market; these are brought together in the implied world stocks
variable. (As noted in Annex I, implied world stocks are the accumulated sum
of differences between world production and consumption.) The inverse
relationship between the implied world stocks and the real jute producer price
in Bangladesh can be clearly seen in Figure 1I.1. In order to evaluate the
relative importance of world demand and supply on the fluctuations of jute
prices, an examirLation of fluctuations in the factors that determine these two
variables, including supply and demand elasticities, are necessary. Assume
world demand and supply equations for jute to be: Dt = at + kiPt; St = bt +
1/ See, for example, World Bank Working Paper No. 391, "A Dynamic SimulationModel of the World Jute Economy," Dec. 1980.
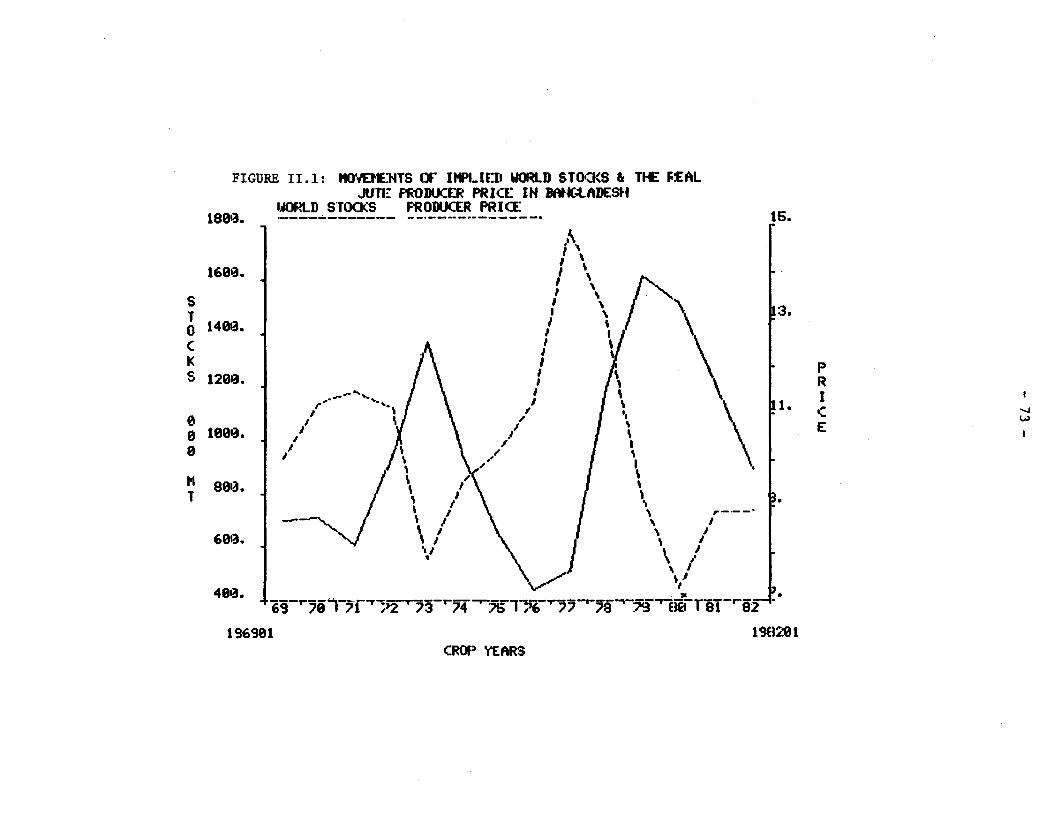
FIGURE II.1: 1OVEPHENTS OF IWPLIED WORLD STOCKS & THE FEALJUTI' PRODUCER PRICE IN MI(LADES
WIORLD STOCKS PRODUKER PRICE
s~~~~~~~~~T 13.~~~~~~~~~1
160G. i -
S R1
CROP W"R.
T
S12090. 1920-- I/ 1 1.I EAR
- 74 -
k2Pt-, where at and bt are interpreted as net intercepts in that they embody
the influence of various demand and supply shifters. In the case of at, these
would include the time trend, a measure of aggregate agricultural production
and incomes of major consuming countries and synthetic prices. In the case of
bt they include weather and prices of competing crops such as rice and
tapioca. The terms k1 and k2 are demand and supply slopes, respectively. The
variance of Dt and St can be expressed as:
var (D ) var (at) + k cov p + k var (P t t 1tPt 1t
var (S )var (bt) + k2 cov (b, P k 2 var (P 1
Assuming coy (i tP t) cov (bt, Pt1 ) = 0 and var (P ) = var (P )
the relative magnitude of variances of Dt and St depends on
var (at), var (b 2), k2 and k2.
Variations around a time trend of the main demand shifters such as
agricultural production indices of major consuming countries, polypropylene
prices and time trend are, by their nature, small. On the other hand, varia-
tions of supply shifters weather and rice and cassava prices, have been
larger. As regards the slopes of the demand and supply curves, the slope of
the supply curve is much larger than that of demand judging from the elastici-
ties; the weighted average world price elasticity of demand is -0.45 while the
weighted average price elasticity of supply for three major producing
countries is 0.85. Thus the variance of supply has been much larger than that
of demand. This is also confirmed by the indices of fluctuations in world jute
production and demand shown in Table II.1.
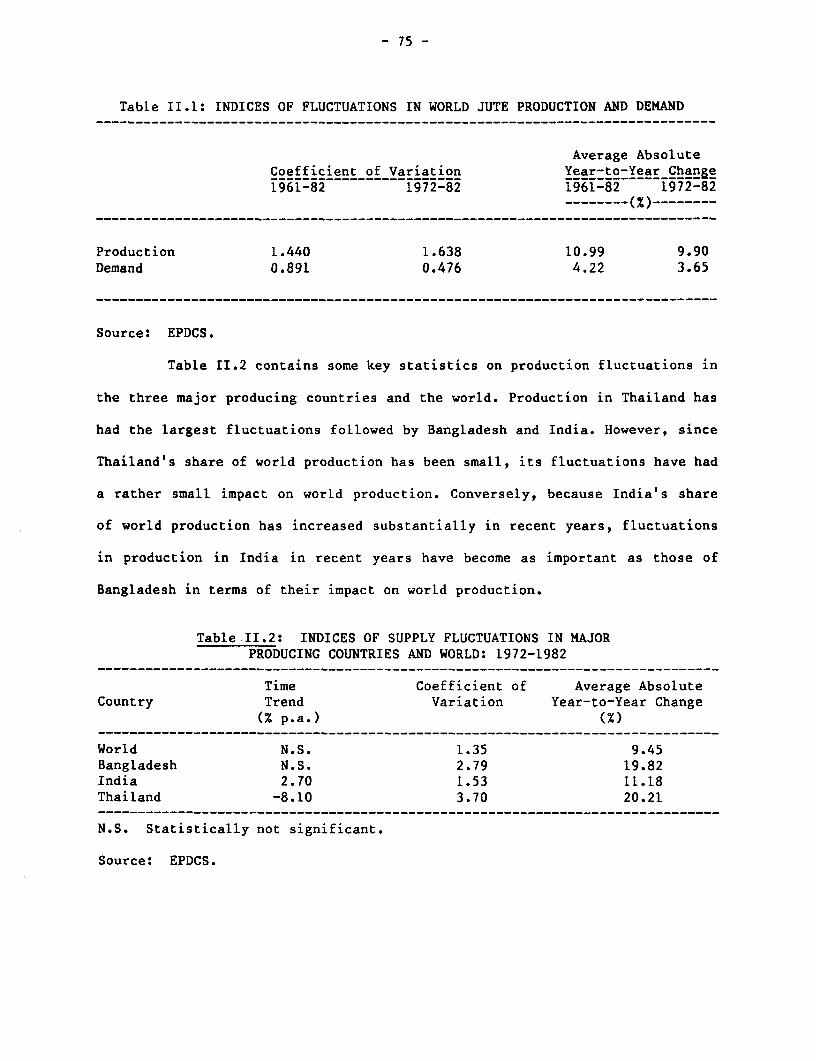
- 75 -
Table II.l: INDICES OF FLUCTUATIONS IN WORLD JUTE PRODUCTION AND DEMAND------------------------------------------------------------------ __---------_
Average AbsoluteCoefficient of Variation Year-to-Year Chance1961-82 1972-82 1961-82 1972-82
Production 1.440 1.638 10.99 9.90Demand 0.891 0.476 4.22 3.65
------------------------------------------------------------------- __--------_
Source: EPDCS.
Table II.2 contains some key statistics on production fluctuations in
the three major producing countries and the world. Production in Thailand has
had the largest fluctuations followed by Bangladesh and India. However, since
Thailand's share of world production has been small, its fluctuations have had
a rather small impact on world production. Conversely, because India's share
of world production has increased substantially in recent years, fluctuations
in production in India in recent years have become as important as those of
Bangladesh in terms of their impact on world production.
Table II.2: INDICES OF SUPPLY FLUCTUATIONS IN MAJORPRODUCING COUNTRIES AND WORLD: 1972-1982
------------------------------------------------------------ __---------------_
Time Coefficient of Average AbsoluteCountry Trend Variation Year-to-Year Change
(% p.a.) (X)------------------------------------------------------------------- __--------_
World N.S. 1.35 9.45Bangladesh N.S. 2.79 19.82India 2.70 1.53 11.18Thailand -8.10 3.70 20.21------------------------------------------------------------------ __---------_
N.S. Statistically not significant.
Source: EPDCS.
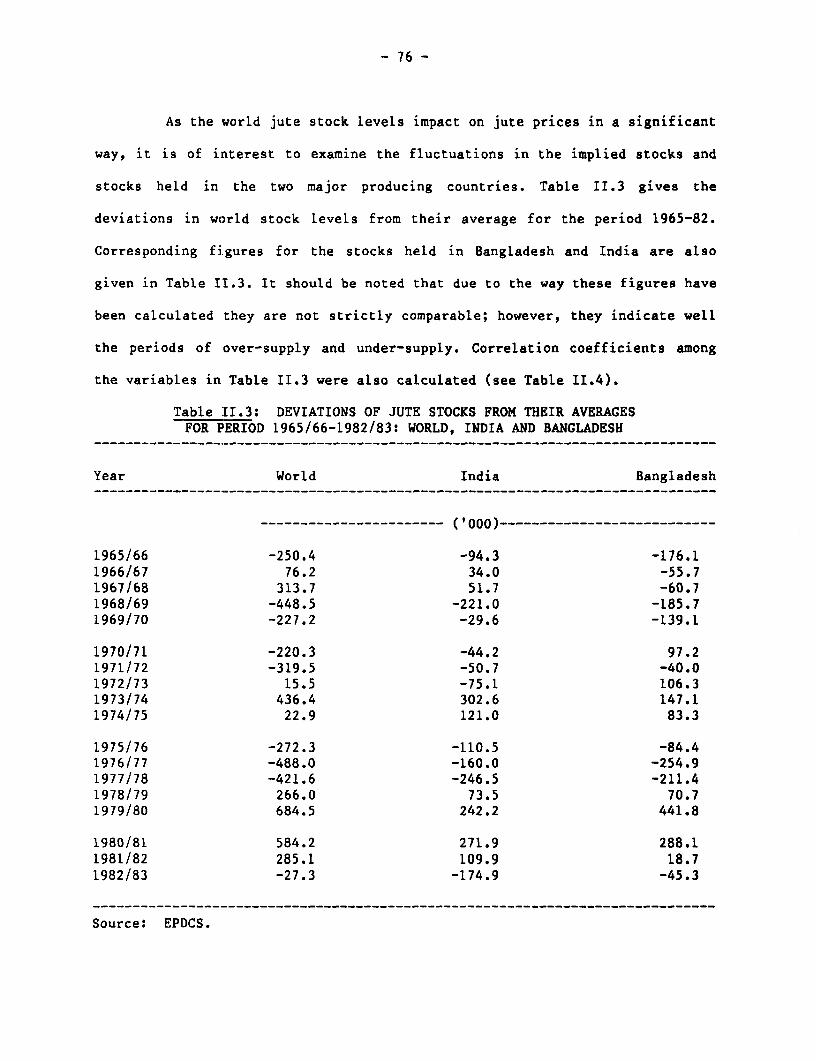
- 76 -
As the world jute stock levels impact on jute prices in a significant
way, it is of interest to examine the fluctuations in the implied stocks and
stocks held in the two major producing countries. Table II.3 gives the
deviations in world stock levels from their average for the period 1965-82.
Corresponding figures for the stocks held in Bangladesh and India are also
given in Table II.3. It should be noted that due to the way these figures have
been calculated they are not strictly comparable; however, they indicate well
the periods of over-supply and under-supply. Correlation coefficients among
the variables in Table II.3 were also calculated (see Table II.4).
Table [11.3: DEVIATIONS OF JUTE STOCKS FROM THEIR AVERAGESFOR PERIOD 1965/66-1982/83: WORLD, INDIA AND BANGLADESH
Year World India Bangladesh
- ('000)…-
1965/66 -250.4 -94.3 -176.11966/67 76.2 34.0 -55.71967/68 313.7 51.7 -60.71968/69 -448.5 -221.0 -185.71969/70 -227.2 -29.6 -139.1
1970/71 -220.3 -44.2 97.21971/72 -319.5 -50.7 -40.01972/73 15.5 -75.1 106.31973/74 436.4 302.6 147.11974/75 22.9 121.0 83.3
1975/76 -272.3 -110.5 -84.41976/77 -488.0 -160.0 -254.91977/78 -421.6 -246.5 -211.41978/79 266.0 73.5 70.71979/80 684.5 242.2 441.8
1980/81 584.2 271.9 288.11981/82 285.1 109.9 18.71982/83 -27.3 -174.9 -45.3
Source: EPDCS.
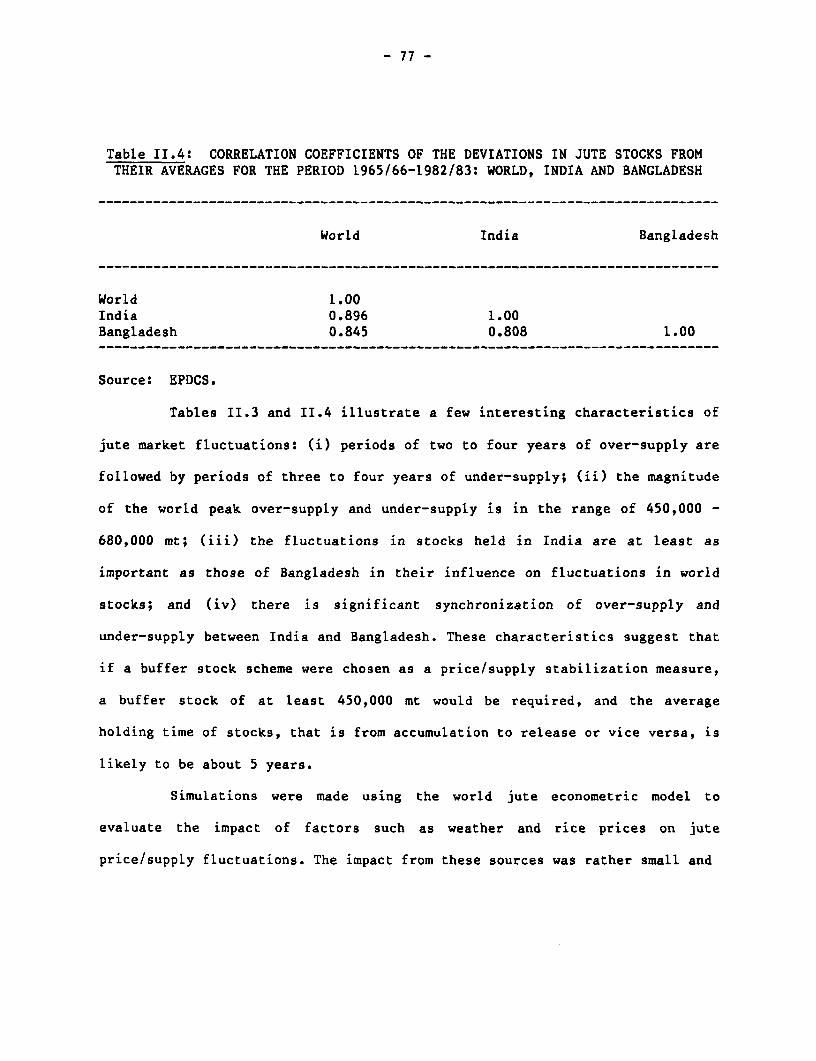
- 77 -
Table II.4: CORRELATION COEFFICIENTS OF THE DEVIATIONS IN JUTE STOCKS FROMTHEIR AVERAGES FOR THE PERIOD 1965/66-1982/83: WORLD, INDIA AND BANGLADESH
World India Bangladesh
World 1.00India 0.896 1.00Bangladesh 0.845 0.808 1.00
Source: EPDCS.
Tables II.3 and II.4 illustrate a few interesting characteristics of
jute market fluctuations: (i) periods of two to four years of over-supply are
followed by periods of three to four years of under-supply; (ii) the magnitude
of the world peak over-supply and under-supply is in the range of 450,000 -
680,000 mt; (iii) the fluctuations in stocks held in India are at least as
important as those of Bangladesh in their influence on fluctuations in world
stocks; and (iv) there is significant synchronization of over-supply and
under-supply between India and Bangladesh. These characteristics suggest that
if a buffer stock scheme were chosen as a price/supply stabilization measure,
a buffer stock of at least 450,000 mt would be required, and the average
holding time of stocks, that is from accumulation to release or vice versa, is
likely to be about 5 years.
Simulations were made using the world jute econometric model to
evaluate the impact of factors such as weather and rice prices on jute
price/supply fluctuations. The impact from these sources was rather small and
- 78 -
short-lived exciept in 1975, a time after Bangladesh had experienced three
consecutive years of flooding and a year of extremely high rice prices. I/
The analysis of jute price/supply fluctuations above suggests that
the main cause of world price/supply fluctuations are the production
fluctuations in India and Bangladesh; their impact is amplified by the strong
correlation between production in these two countries. The statistical
analysis indicates that if a buffer stock scheme were to be implemented to
stabilize prices it would have to have financial resources sufficient to
maintain stocks of at least 450,000 mt and to maintain that amount over a
period of 4 to 6 years. 2/
1/ The floods in the summer of 1984 would have had an important impactconsidering l:hat the damage was by far the biggest in the last 15 yearsand it occurred at a time when world stocks were at a very low level.
2/ This assumes no changes in stocking behavior by those who held stocks inthe past once a buffer stock scheme comes into operation. It is likelythat those who held stocks in the past would hold less stocks when thebuffer stock scheme is in operation. In this case the amount required tobe held by thie buffer stock scheme would be more than 450,000 mt.
- 79 -
REFERENCES
Sadiq Ahmed, "Should Bangladesh Participate in an International BufferStocking Arrangement for Raw Jute?" in The Bangladesh Development Studies,Vol. VI, No. 1, Winter 1978.
Takamasa Akiyama, "Jute Supply Response in Bangladesh," World Bank StaffCommodity Working Paper, No. 13, 1985.
Jock Anderson, Charles Blitzer, Tom Cauchois and Enzo R. Crilli, A DynamicSimulation Model of the World Jute Economy, World Bank Staff Working PaperNo. 391, Revised (Washington, December 1980).
Hossein Askari and John Thomas Cummings, Agricultural Supply Response: ASurvey of the Econometric Evidence (New York, Praeger, 1976), Chapter 6.
Ralph Clark, "The Economic Determinants of Jute Production," in FAO MonthlyBulletin of Agricultural Economics and Statistics, Vol. 3, September 1957.
John Thomas Cummings, "The Supply Responsiveness of Bangalee Rice and CashCrop Cultivation," in The Bangladesh Development Studies, Vol. II, No. 4,October 1974.
Enzo R. Grilli and Ralph H. Morrison, Jute and the Synthetics, World BankStaff Working Paper No. 171 (Washington, January 1974).
Sayeedul Haque, "Jute Price Stabilization and Resource Allocation between Juteand Rice in East Pakistan," in Pakistan Economic Journal, Vol. XIX,1968/69, No. 2.
W.C. Labys, Dynamic Commodity Models: Specification, Estimation andSimulation, (Massachusettes, Lexington, 1973).
Mustafa K. Mujeri "An Econometric Model Simulation of the World Jute Market,"in The Bangladesh Development Studies, Vol. VII, No. 4, Autumn 1979.
Sultan H. Rahman, "Economic Analysis of Public Stocks Policies in theBangladesh Jute Sector" Stanford University, 1982. Ph.D. Dissertation.
DISTRIBUTORS ~~~~~~~~~~~~~~NLwKO. SAPUSUC OF WfhAPOS.AVf WDIST RIBUTORa_ S orffce des Putica fns UnfriefSaUes Axeateernien Ki9akauppa Pan Korea Book Corporortn informado,n PuhcadriOF WORLD BANK X1. place Cenirale de Ben-Akrnin PO eOx 128 PO 8wx lo, Kwangwtw Private Ld.OF W vORL t sK M?ms 94tlS0 Seoul 024%ls IsFi Pe!l'Fut fRdi e
Tel: 6044-0.60.5460. 53 534 Helsink 10 Tel 23-1421 24 New 7ndusa 1w RoaPUBLv TIONS ANOLVnu Tel: 651-1221121 S.ngapom 1953CaS NHrsch SRL FRANC MEMRk Tel 283-1798Galena Guers Wen 8frl PuiKatoms PO Box 54%5 WAUNFklda 165. 4th Flor-ac 4531465 66 Avenue MlOen Kuwat Mundr-Prensa Ubrors SA1l3l33uensAures 75116Pars Tel 421843 Casteilo37Te: 30-712Z 33-1787 Tel 723-54-21 AL"AYSA 28001 MadnAUSTRALIA. PAPA NEW G AW, PUW. Unversy of Malaya Cooperau7e 276-997
tlFS. Mm, SOLOMON NIUU OP Booksop. Umited SMr LAK A MiA flt D 5O 5MANS, aD VANMIU UN>OVerlag P0. 8ox 1127. Jdi Pantar Bau Lake House Boohop
tnftfbf e D-5300 Bom I KuaVlaLuw 22-11 P0 BOx 244Overseas Dc emI Defnwfy Samrrkstrasse 23 Tel 565t 10 Sir ChirtanpiaLam A Gardiner80xf 506. GPO Tel 10228121 29 40 CO MaworboSyoney. NS5W 200l 0115 INOT2AstralW2ia <GrA Q INFOTEC troTel 1021282-1614 MEMtO San Lorenzo 153-11 Coi rd Vaie Deleg. Te 32104
24. lppodarou Saet Benito JuA7ez ' AALS SA Athens-l t635 03100 Mexco Oty D.F. For singe rtrlesGefold an Co. Tel 7019(1Z 70169tS Tel: 559-5211 ABCE Fnues Kungi.4oxtha-edeA-lOll Wien NOgsata I Rn 1e2erigg au 2. Box 6356Graben 31 HONG 27 9rx ORCCTel 102221 52 22 35 Asia 201 Ltd MEMRB S-103 27 Stock0ic0n6Fl, 1l6bPnnce EdwvardftoiadW. Z u oeRcn Tel 9823 89 0WAN KoAloa casabla-ia Ff J7xOi cram5.MEMN1 H-n Kong TO 259461 Wemee9enWUiarns ASPO Box 22103 7de: 3-0529415 Box rdfl i 91042Z Sloim
Tela 232934 l7 MediaO Boods Euoe. V IMSE) Tel: 0-54 1200TeNGLA239 US3 PubisherVs DsttDutors Ltd. Nordwral 38,uidGaAOm Post Box 7015 7241 5L LochemSMic no imdues Development Assistae Ansan Road Tel: 05730466 6fraune Greiu
SocietyIMIDASJ New Deh 110002 NEW t*AN Case posw 381G.P 0 80x am Tel: 27360t-3 R Hri ans Son Ltd. CH 1211 Gefieva 11Dhaka 10 Fiest Man Road Tl 31-8-50Tel: 326427 Ganch Na1gM New Mrbket Ta9-so3UWlli 8Kcar re 560009 AuCklard TAslAisUPuoixatris des Nations Urnes , l Wd0i 29206 Tel: 544i119 PO 8 2 SZ99
Ax it lou 202 S~~~~~ Wagxae Swee MmAm Dar es SalaamtTel0 Bru53 sIe69 Bombay 4000il Ur'vevty Prs LUnaed Tel: 29209Tel: J2153'3 5169 Tel: 260562. 26027. 266971 Three Crowns Building ierichonow &I-8/, Chowighee L.a Prnva lm B Ma CetrAl DA09 SWPuOcacoes Tecnucas Intemncirrs Lda. Calcuta 7016 Ibadan Central Depanr- nt StreR PM=PeiotorGnde. 209 Tel 212451. 249473 Tel 0-22411356 306i9omRoad014099to Paubo 9P l.718 IICA SwaupNaga NORWAY TeL 233-6930-9Tel: 0111 257-1640.258-8167,258-6442 Kampu muiO Tarum-Ka brian. AS. hlh 2CANADA Tel: 81300 PO Box 1177Sentrum 5st i esUnrtLe Diffuses sNa Road Os,o I 55 EatistrMa Roades tCPSe,ISOlrueAmprer Nungantaickarn Teld 0218012-60 SSEatr MaiRodC 3c5r,vil*. Ouebre Mad3ras 600034 CurepeCarsaea so8 SE6 Tel: 476355 PAKNWAN Txinda West IndiesTelr.5141 6I-I334 Mirza Bode Agercy TdL: 1-1809I 662-5654
Tel~~ 15141641-1334 sirocaunte 65,SslrIeOa--xrCHE Int frrdfa Limred PO bx No. 729 TUNtAEditcnal Renacimento A Sam aru i 37 Laflre 3 Soc#e Tnirsew de D*ffusionMiralores 354P 8cx 1 Tel 66839 STAverie de Ca eSantiago P0O Box 181Tel ;5244 Tel: 81-18 PANAAA Tel 255-000
-ANAND Ediciones ubrena Culturai n,miCOOMIIA ~~~~~~~~TDC Publishers Parsarnen. SA Haste Kitapevr ASEnlace Uda. 12 6b7 ederde Av. 7. Espana 16 sta desAoanado Aero 34270 Di Ner ImeckSr Panamna Zone I 6,ltka adBogota D.E. DulnITel 23-62 470/u7sar1u
Tel 245-0645 Tel. 744835 Te 23-5628Te 144470/7COSTA RC" fA Editonial Desa-rollo 5A UGM AlL,O)(efea Trepos Licosa Cotmussona'a Sanso SPA Ug 3824 anida BooshopCire 11T1r3 Via Larnan ca 45 Ica 242, OE. 106 PO Box 7145Av. Fenaridez Guel Casdla Posrie 552 LimaI KT4ael4356San Dse 50121 Flmre Tel 28-53-840 Tei U75Tel: 3D3-e8l ULSA TC579751/3 UITD M M i
CeM D tntre itton et de Natu Ah c nes al Bode Store P0 Box 6097MEMIOS CEDAI PO Box 1934 SaaPO. 8x 2098 m4 Betro Manila Tl9NMcosa0 8P54 e 523Tel 21-99333 ATe 4an-1 04 Ptau Te z0822 Td 592233 A
Tel 22-20-55 and 32-60-2 P0311CMMn m a a .0V&PN WJAPAN Uvrana Portugal MORr H=n NOLLtdRSefnoedS Aterat IasIrnBoo Serwie 0E531 Rua Do Cant 70-74 ionfL.Rosenoems,lileraur 37-3, Hongo 3tCheirie Buntyc-ku 113 1200 Lsbon POtr H3nI
D(AlSlCoperihageriV Tl Tel 32 82 20 Altn.iw vsin re G 4 TeO 0-35r1942 Tel 1031438-2611 SAIUOAIANA Tel Alton 8684
KGM, ARM 1014UX (W JOND airt BooK Storeyf nAJ a mMEMR PO. Bax 3196 VUer EAGalaa StreneJ7t P tt 3143 Ryadh-I1471Gala Seeudi oxA343biao Apttdo. 610.337Cato 3*60~~~~~~~~ab Caracas 1060-ATel: 7'BB3 Amd Te: 4773140 Tel 32301(332604
ArNfa ec* Sece IEAI Ltd. Wesley BookshopPAO Bod *Se45 P.O. am 207Nau Al2aTel 23641/330272 Te: 22 82

The World Bank
Headquarters European Office Tokyo Office1818 H Street, N.W. 66, avenue d'Iena Kokusai BuildingWashington, D.C. 20433, U.S.A. 75116 Paris, France 1-1 Marunouchi 3-chome
Telephone: (202) 477-1234 Telephone: (1) 47.23.54.21 Chiyoda-ku, Tokyo 100, JapanTelex: WUI 64145 WORLDBANK Telex: 842-620628 Telephone: (03) 214-5001
RCA 248423 WORLDBK Telex: 781-26838Cable Address: INTBAFRAD
WASHINGTONDC
ISSN 02533537/lSBN 0-8213-0701-0