prosper portland · for complete and healthy neighborhoods 1,025 small businesses owned by people...
TRANSCRIPT
PROSPER PORTLAND
TEN YEAR FINANCIAL SUSTAINABILITY PLAN
JULY 2018
Prosper Portland Ten Year Financial Sustainability Plan | July 2018 2
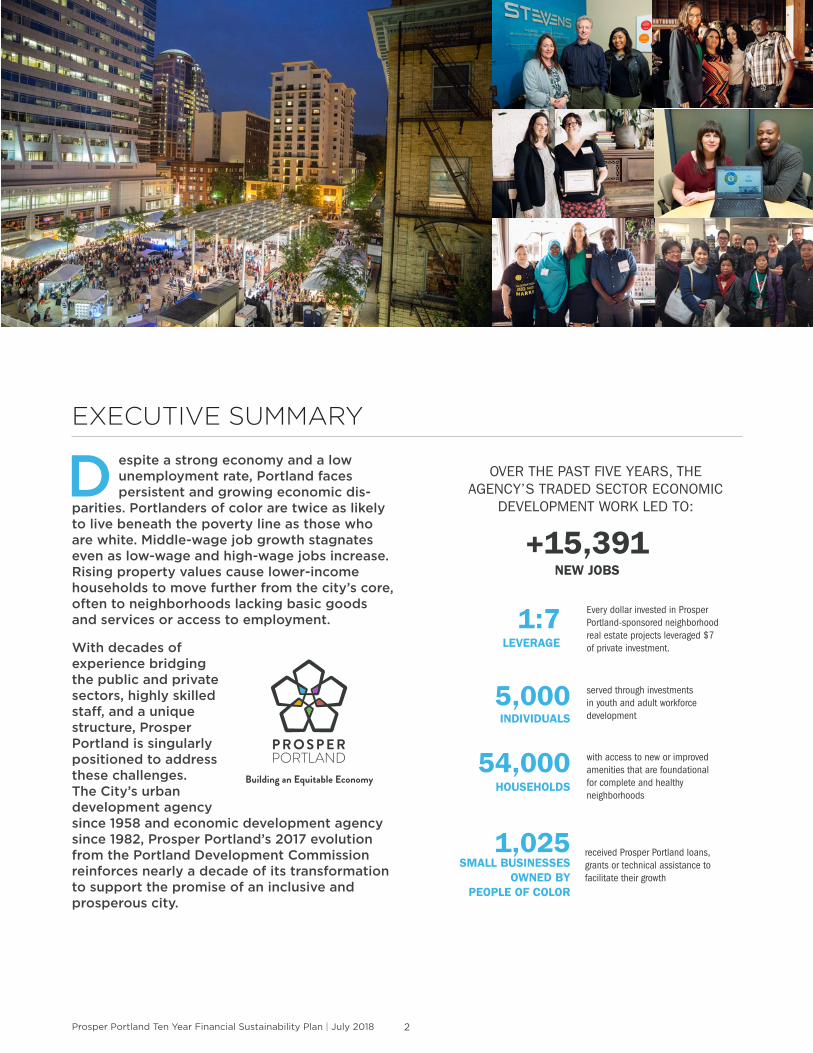
EXECUTIVE SUMMARY
D espite a strong economy and a low unemployment rate, Portland faces persistent and growing economic dis-
parities. Portlanders of color are twice as likely to live beneath the poverty line as those who are white. Middle-wage job growth stagnates even as low-wage and high-wage jobs increase. Rising property values cause lower-income households to move further from the city’s core, often to neighborhoods lacking basic goods and services or access to employment.
With decades of experience bridging the public and private sectors, highly skilled staff, and a unique structure, Prosper Portland is singularly positioned to address these challenges. The City’s urban development agency since 1958 and economic development agency since 1982, Prosper Portland’s 2017 evolution from the Portland Development Commission reinforces nearly a decade of its transformation to support the promise of an inclusive and prosperous city.
OVER THE PAST FIVE YEARS, THE AGENCY’S TRADED SECTOR ECONOMIC
DEVELOPMENT WORK LED TO:
+15,391NEW JOBS
1:7LEVERAGE
Every dollar invested in Prosper Portland-sponsored neighborhood real estate projects leveraged $7 of private investment.
5,000 INDIVIDUALS
served through investments in youth and adult workforce development
54,000 HOUSEHOLDS
with access to new or improved amenities that are foundational for complete and healthy neighborhoods
1,025 SMALL BUSINESSES
OWNED BY PEOPLE OF COLOR
received Prosper Portland loans, grants or technical assistance to facilitate their growth
Prosper Portland Ten Year Financial Sustainability Plan | July 2018 3
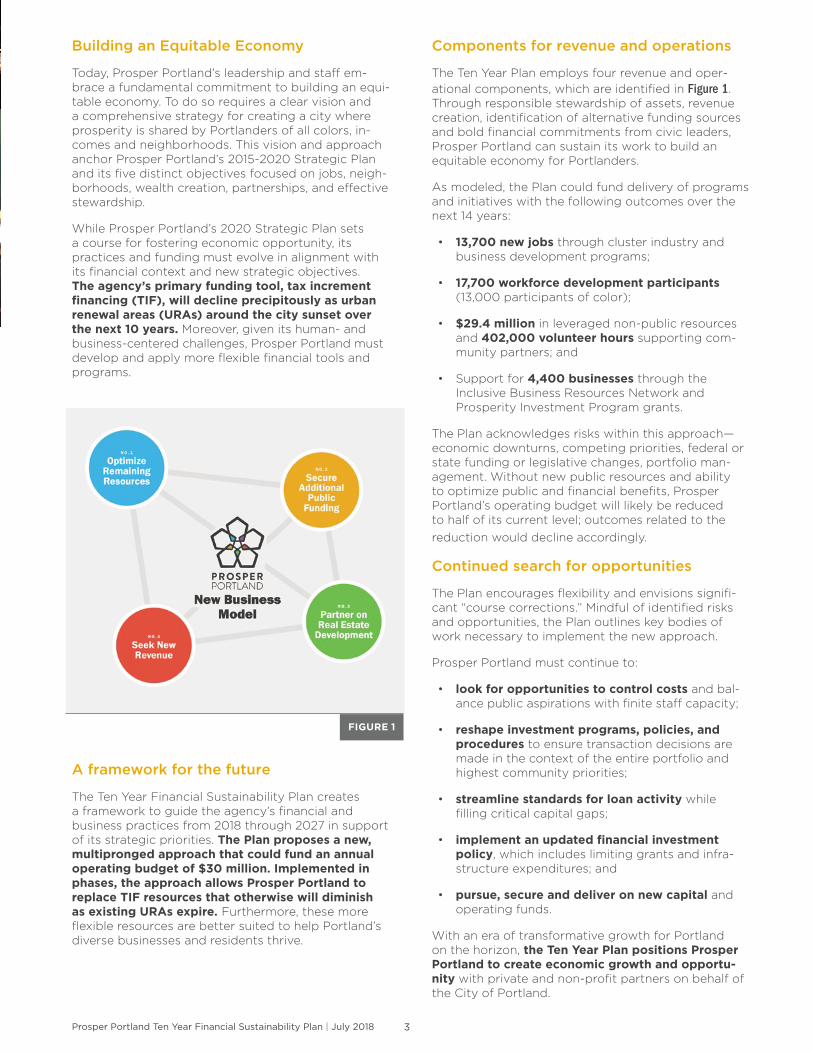
Building an Equitable Economy
Today, Prosper Portland’s leadership and staff em-brace a fundamental commitment to building an equi-table economy. To do so requires a clear vision and a comprehensive strategy for creating a city where prosperity is shared by Portlanders of all colors, in-comes and neighborhoods. This vision and approach anchor Prosper Portland’s 2015-2020 Strategic Plan and its five distinct objectives focused on jobs, neigh-borhoods, wealth creation, partnerships, and effective stewardship.
While Prosper Portland’s 2020 Strategic Plan sets a course for fostering economic opportunity, its practices and funding must evolve in alignment with its financial context and new strategic objectives. The agency’s primary funding tool, tax increment financing (TIF), will decline precipitously as urban renewal areas (URAs) around the city sunset over the next 10 years. Moreover, given its human- and business-centered challenges, Prosper Portland must develop and apply more flexible financial tools and programs.
A framework for the future
The Ten Year Financial Sustainability Plan creates a framework to guide the agency’s financial and business practices from 2018 through 2027 in support of its strategic priorities. The Plan proposes a new, multipronged approach that could fund an annual operating budget of $30 million. Implemented in phases, the approach allows Prosper Portland to replace TIF resources that otherwise will diminish as existing URAs expire. Furthermore, these more flexible resources are better suited to help Portland’s diverse businesses and residents thrive.
Components for revenue and operations
The Ten Year Plan employs four revenue and oper-ational components, which are identified in Figure 1. Through responsible stewardship of assets, revenue creation, identification of alternative funding sources and bold financial commitments from civic leaders, Prosper Portland can sustain its work to build an equitable economy for Portlanders.
As modeled, the Plan could fund delivery of programs and initiatives with the following outcomes over the next 14 years:
• 13,700 new jobs through cluster industry and business development programs;
• 17,700 workforce development participants (13,000 participants of color);
• $29.4 million in leveraged non-public resources and 402,000 volunteer hours supporting com-munity partners; and
• Support for 4,400 businesses through the Inclusive Business Resources Network and Prosperity Investment Program grants.
The Plan acknowledges risks within this approach—economic downturns, competing priorities, federal or state funding or legislative changes, portfolio man-agement. Without new public resources and ability to optimize public and financial benefits, Prosper Portland’s operating budget will likely be reduced to half of its current level; outcomes related to the reduction would decline accordingly.
Continued search for opportunities
The Plan encourages flexibility and envisions signifi-cant “course corrections.” Mindful of identified risks and opportunities, the Plan outlines key bodies of work necessary to implement the new approach.
Prosper Portland must continue to:
• look for opportunities to control costs and bal-ance public aspirations with finite staff capacity;
• reshape investment programs, policies, and procedures to ensure transaction decisions are made in the context of the entire portfolio and highest community priorities;
• streamline standards for loan activity while filling critical capital gaps;
• implement an updated financial investment policy, which includes limiting grants and infra-structure expenditures; and
• pursue, secure and deliver on new capital and operating funds.
With an era of transformative growth for Portland on the horizon, the Ten Year Plan positions Prosper Portland to create economic growth and opportu-nity with private and non-profit partners on behalf of the City of Portland.
FIGURE 1

Prosper Portland Ten Year Financial Sustainability Plan | July 2018 4
I n character and practice Prosper Portland today is a fundamentally different organization than the urban renewal agency founded in 1958. Prosper Portland has built expertise in real estate development and its role as an economic development agency throughout the past decade of
sustained focus and ongoing effort around economic opportunity and social equity. As it enters its 60th year, Prosper Portland is now a learning organization, committed to the future of Portland as a highly progressive and productive city with a diverse population and a robust economy where everyone, no matter who they are or where they came from, has a place to grow and prosper.
1958 - 1988
1961
1967
South Auditorium URA
Memorial Coliseum
Emanuel Hospital URA
Model Cities Program
HISTORY AND ACCOMPLISHMENTS
Keller Auditorium
High-rise housing
I-405 freeway
Displaced a predominantly Jewish and Italian American neighborhood, relocating 1,573 residents and 289 businesses.
City and the Portland Development Commission condemned land in the early 1970s under urban renewal for an expansion of the hospital campus, displacing 171 families, 74 percent of whom were African American.
1966Albina Neighborhood Improvement Program
1966
PSU URA
Park Blocks converted to pedestrian mall
1970Neighborhood Development Program in
Boise-Humboldt, Elliot, Irvington, King/Sabin/Vernon, and Woodlawn. Capital improvements went toward home rehabilitation and smaller
scale neighborhoods.
1974
Downtown Waterfront URA
Tom McCall Waterfront Park
Pioneer Courthouse Square
Pioneer Place
Projects included Old Town revitalization, including Mercy Corps, Yards at Union Station, Lan Su Chinese Garden, White Stag/UO, 38 Davis, Society Hotel
1980 - 1996
St. Johns URA
1985
South Park Blocks URA
Museum Place
Affordable housing
Streetcar
Director Park
1986
Airport Way URA
MAX Red Line
Danner/Lacrosse HQ
Created to increase the amount of industrial land in the Columbia River corridor. $7M in loans from Prosper Portland have leveraged more than $100M in private investment.
Cascade Station
FBI HQ
Central Eastside URA
1986
Eastbank Esplanade
RiverEast
Burnside Bridgehead
1986
N/NE Enterprise Zone created
Prosper Portland has provided funding for the creation of public parks and recreational amenities throughout the city, includ-ing Dawson Park in north Portland, Gateway Urban Plaza in east Portland, and Caruthers Park in the South Waterfront.
1958
Formed to implement a housing development program but closed in 1996.
Director Park
Pioneer Place
Hill Block
South Auditorium
Eastbank Esplanade
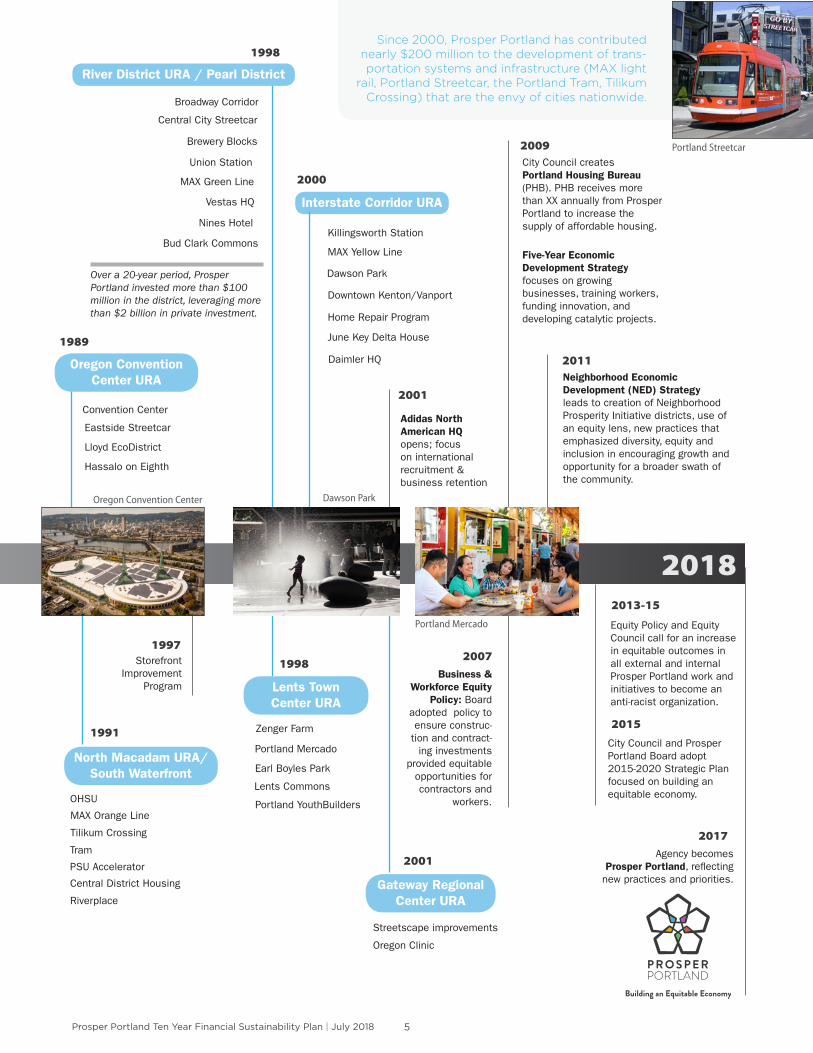
Prosper Portland Ten Year Financial Sustainability Plan | July 2018 5
1989
Oregon Convention Center URA
Convention Center
Eastside Streetcar
Lloyd EcoDistrict
Hassalo on Eighth
1991
North Macadam URA/ South Waterfront
PSU Accelerator
Tram
OHSU
Central District Housing
Riverplace
MAX Orange Line
Tilikum Crossing
1998
River District URA / Pearl District
MAX Green Line
Nines Hotel
Vestas HQ
Over a 20-year period, Prosper Portland invested more than $100 million in the district, leveraging more than $2 billion in private investment.
Bud Clark Commons
Storefront Improvement
Program
1997
Central City Streetcar
Union Station
Broadway Corridor
Brewery Blocks
1998
Lents Town Center URA
Zenger Farm
Portland Mercado
Earl Boyles Park
Lents Commons
Portland YouthBuilders
2000
Interstate Corridor URA
Killingsworth Station
MAX Yellow Line
Downtown Kenton/Vanport
Home Repair Program
June Key Delta House
Dawson Park
2001
Gateway Regional Center URA
Streetscape improvements
Oregon Clinic
Adidas North American HQ opens; focus on international recruitment & business retention
2001
Business & Workforce Equity
Policy: Board adopted policy to ensure construc-
tion and contract-ing investments
provided equitable opportunities for contractors and
workers.
2007
City Council creates Portland Housing Bureau (PHB). PHB receives more than XX annually from Prosper Portland to increase the supply of affordable housing.
2009
Five-Year Economic Development Strategy focuses on growing businesses, training workers, funding innovation, and developing catalytic projects.
Neighborhood Economic Development (NED) Strategy leads to creation of Neighborhood Prosperity Initiative districts, use of an equity lens, new practices that emphasized diversity, equity and inclusion in encouraging growth and opportunity for a broader swath of the community.
2011
Equity Policy and Equity Council call for an increase in equitable outcomes in all external and internal Prosper Portland work and initiatives to become an anti-racist organization.
2013-15
City Council and Prosper Portland Board adopt 2015-2020 Strategic Plan focused on building an equitable economy.
2015
Agency becomes Prosper Portland, reflecting
new practices and priorities.
2017
Since 2000, Prosper Portland has contributed nearly $200 million to the development of trans-portation systems and infrastructure (MAX light
rail, Portland Streetcar, the Portland Tram, Tilikum Crossing) that are the envy of cities nationwide.
2018
Daimler HQ
Oregon Convention Center Dawson Park
Portland Mercado
Portland Streetcar
Prosper Portland Ten Year Financial Sustainability Plan | July 2018 6
NEW AGENGY PRIORITIES
P rosper Portland’s 2020 Strategic Plan calls for a significant course change for the agency. This plan focuses on building
an equitable economy, especially with commu-nities of color and those who have not benefit-ed from economic growth. Pursuit of this mis-sion in today’s economic environment requires different business practices and funding models to address the city’s most pressing needs.
The Ten Year Financial Sustainability Plan creates a framework of business practices in order to support the City of Portland’s economic and community development priorities into the future. This section explores those key priorities, describes recent actions taken, and explores major areas of focus in order to contextualize the financial requirements needed to enable Prosper Portland to sustain operational ca-pacity through anticipated and unforeseen financial challenges.
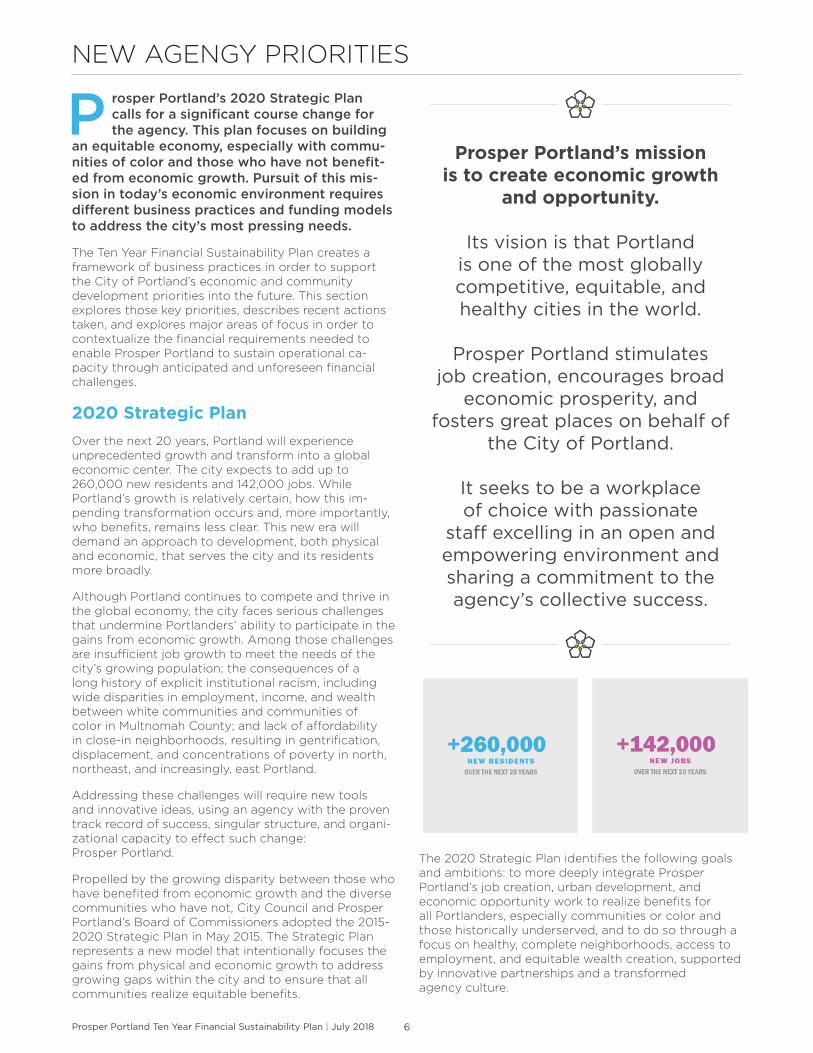
2020 Strategic Plan Over the next 20 years, Portland will experience unprecedented growth and transform into a global economic center. The city expects to add up to 260,000 new residents and 142,000 jobs. While Portland’s growth is relatively certain, how this im-pending transformation occurs and, more importantly, who benefits, remains less clear. This new era will demand an approach to development, both physical and economic, that serves the city and its residents more broadly.
Although Portland continues to compete and thrive in the global economy, the city faces serious challenges that undermine Portlanders’ ability to participate in the gains from economic growth. Among those challenges are insufficient job growth to meet the needs of the city’s growing population; the consequences of a long history of explicit institutional racism, including wide disparities in employment, income, and wealth between white communities and communities of color in Multnomah County; and lack of affordability in close-in neighborhoods, resulting in gentrification, displacement, and concentrations of poverty in north, northeast, and increasingly, east Portland.
Addressing these challenges will require new tools and innovative ideas, using an agency with the proven track record of success, singular structure, and organi-zational capacity to effect such change: Prosper Portland.
Propelled by the growing disparity between those who have benefited from economic growth and the diverse communities who have not, City Council and Prosper Portland’s Board of Commissioners adopted the 2015-2020 Strategic Plan in May 2015. The Strategic Plan represents a new model that intentionally focuses the gains from physical and economic growth to address growing gaps within the city and to ensure that all communities realize equitable benefits.
The 2020 Strategic Plan identifies the following goals and ambitions: to more deeply integrate Prosper Portland’s job creation, urban development, and economic opportunity work to realize benefits for all Portlanders, especially communities or color and those historically underserved, and to do so through a focus on healthy, complete neighborhoods, access to employment, and equitable wealth creation, supported by innovative partnerships and a transformed agency culture.
Prosper Portland’s mission is to create economic growth
and opportunity.
Its vision is that Portland is one of the most globally competitive, equitable, and healthy cities in the world.
Prosper Portland stimulates
job creation, encourages broad economic prosperity, and
fosters great places on behalf of the City of Portland.
It seeks to be a workplace of choice with passionate
staff excelling in an open and empowering environment and sharing a commitment to the agency’s collective success.

Prosper Portland Ten Year Financial Sustainability Plan | July 2018 7
Public Benefits & Outcomes
Prosper Portland’s 2020 Strategic Plan establishes a range of metrics to measure the agency’s progress in meeting its goals.
Ultimately, the success of the Ten Year Financial Sustainability Plan should be mea-sured by the same standard. Establishing a secure, sustainable funding base must be in service to the goals of the Strategic Plan.
Outcomes of Prosper Portland’s five-year track record from fiscal year 2011-12 to 2016-17 can be found in the appendix of this plan. Accomplishments are measured against such markers as job growth, numbers of businesses assisted, service to populations of color, investment capital for early-stage companies, export levels, unemployment rates and new business licenses.
In FY 2015-16 alone, Prosper Portland had the following impact:
• $29 million in financial assistance attracted more than $260 million in private resources and supported the creation or retention of 1,100 jobs
• Business loans generated a 2:1 leverage ratio with private investment
• Storefront improvement grants generat-ed a 5:1 ratio with private investment
• Enterprise Zone enrollment drew $251 million in private investment and creat-ed 400 new jobs
• 1,082 adults received workforce assis-tance (65% people of color)
• 1,106 jobs were created or retained via business recruitment/expansion
• Use of DMWESB subcontractors on Prosper Portland-owned or -sponsored projects totaled $13,088,804
Prosper Portland Ten Year Financial Sustainability Plan | July 2018 8
Two years into implementation of the 2020 Strategic Plan—and with a track record in collaborative efforts to drive job creation, neighborhood economic devel-opment and opportunities for prosperity that began with the 2009 Economic Development Strategy and evolved through implementation of the 2011 Neighborhood Economic Development Strategy—Prosper Portland must continue to expand activities and organizational capacity in the programmatic areas described below.
GROWING FAMILY WAGE JOBS FOR ALL PORTLANDERS
To realize shared prosperity, the city must spur eco-nomic growth that provides job opportunities for Portland residents across all geographic and cultural communities. Given long-term economic trends, this requires the city to embrace its trade, technology, innovation, and talent assets in a way that benefits all Portlanders and to pursue more holistic solutions.
Quality business retention, expansion and recruitment work begins with strategic approaches to each of the city’s traded sector industry clusters. Prosper Portland has helped the city realize more than 11,000 jobs over the past five years and strengthened a longstanding partnership with Worksystems Inc. to connect histori-cally underserved residents with such quality employ-ment opportunities.
Business Competitiveness and Expansion
Prosper Portland business assistance has advanced a thriving entrepreneurial ecosystem as well as robust industry growth across key clusters like athletic and outdoor, advanced manufacturing, software, and green cities. These industries employ 48,000 Portlanders and include such emerging stars as Keen, AWS Elemental and Puppet, powerhouse companies such as Nike and Intel, minority or women-owned growth companies like IOTAS and Wild Fang, and green building stalwarts like ZGF Architects and Gerding Edlen Development.
Initiatives to support industry competitiveness and inclusion include the tech industry’s formal commit-ment to increase its diversity through the TechTown Portland Diversity Pledge. To date 22 companies, employing 2,300 individuals locally, have taken the Diversity Pledge. Of the companies’ new hires in 2016 and 2017, 46 percent are female, 22 percent identify as a person of color, and 13 percent identify as LGBTQ.
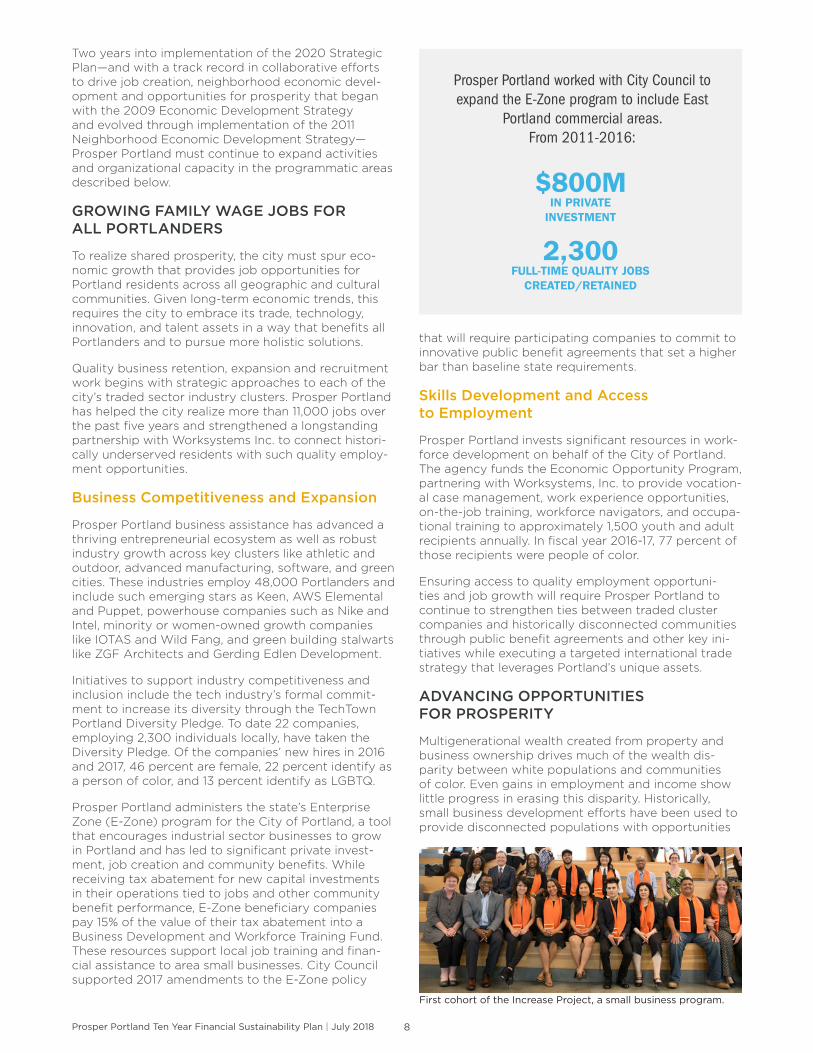
Prosper Portland administers the state’s Enterprise Zone (E-Zone) program for the City of Portland, a tool that encourages industrial sector businesses to grow in Portland and has led to significant private invest-ment, job creation and community benefits. While receiving tax abatement for new capital investments in their operations tied to jobs and other community benefit performance, E-Zone beneficiary companies pay 15% of the value of their tax abatement into a Business Development and Workforce Training Fund. These resources support local job training and finan-cial assistance to area small businesses. City Council supported 2017 amendments to the E-Zone policy
that will require participating companies to commit to innovative public benefit agreements that set a higher bar than baseline state requirements.
Skills Development and Access to Employment
Prosper Portland invests significant resources in work-force development on behalf of the City of Portland. The agency funds the Economic Opportunity Program, partnering with Worksystems, Inc. to provide vocation-al case management, work experience opportunities, on-the-job training, workforce navigators, and occupa-tional training to approximately 1,500 youth and adult recipients annually. In fiscal year 2016-17, 77 percent of those recipients were people of color.
Ensuring access to quality employment opportuni-ties and job growth will require Prosper Portland to continue to strengthen ties between traded cluster companies and historically disconnected communities through public benefit agreements and other key ini-tiatives while executing a targeted international trade strategy that leverages Portland’s unique assets.
ADVANCING OPPORTUNITIES FOR PROSPERITY
Multigenerational wealth created from property and business ownership drives much of the wealth dis-parity between white populations and communities of color. Even gains in employment and income show little progress in erasing this disparity. Historically, small business development efforts have been used to provide disconnected populations with opportunities
Prosper Portland worked with City Council to expand the E-Zone program to include East
Portland commercial areas. From 2011-2016:
$800M IN PRIVATE
INVESTMENT
2,300 FULL-TIME QUALITY JOBS
CREATED/RETAINED
First cohort of the Increase Project, a small business program.
Prosper Portland Ten Year Financial Sustainability Plan | July 2018 9
for ownership and wealth creation, but too often these entrepreneurs are in low-growth fields with significant obstacles to success and little upside.
Recently revamped Prosper Portland programs focus on supporting small businesses and entrepreneurs of color through a network of technical support providers and improved access to capital. Critical future and long-term priorities include significantly increasing access to capital for growing firms across a variety of industries; supporting long-time property owners seeking to leverage wealth through redevelopment of their vacant or underutilized properties; expanding the volume of service both directly and through technical assistance partners to small business owners and long-term property owners; and supporting the growth of a more robust and diversified pool of developers to partner with longtime property owners.
Inclusive Business and Entrepreneurship Development
As the largest funder of small business technical assistance in the city, in 2017, Prosper Portland invest-ed more than $2.5 million in the Inclusive Business Resource Network (IBRN). A new approach to catalyz-ing the success of low-income and underrepresented business owners and entrepreneurs, IBRN provides intense support services for 1,000 underrepresented entrepreneurs and small businesses and offers short-term support services to an additional 1,000 per year through 11 culturally specific and technical service providers.
The Mercatus directory and online platform com-plements the support for entrepreneurs of color by highlighting Portland’s diverse businesses and con-necting them with market opportunities both within the city and beyond. This growing virtual network and related programming, including the recent My People’s Market for Mercatus vendors, allows business owners and entrepreneurs to share stories, experiences, and best practices to achieve growth.
Access to Capital
Accessing capital presents a challenge for most entrepreneurs, and even more so for business owners of color and women. Prosper Portland is committed to expanding access to funding across the capital continuum, from seed funding for new entrepreneurial ventures to loans for established businesses. Loans made for working capital, tenant improvements, and equipment purchases, as well as for property develop-ment, acquisition, and rehabilitation, are designed to provide the gap financing necessary when traditional bank channels are not sufficient or available.
The success of the Startup PDX Challenge and the Seed Fund initiatives prompted the creation of the Inclusive Startup Fund, which provides capital, culti-vates high-growth entrepreneurs from underrepresent-ed populations and provides wealth creation opportu-nities for Portlanders of color and within low-income neighborhoods. In its first year, more than 60 percent of the companies receiving Inclusive Startup Fund
investments were led by founders of color; 50 percent had a black and/or Latino/a founder; collectively they employed 198 individuals; 68 percent of those jobs were held by people of color and/or women.
The Startup PDX Challenge and Portland Seed Fund, recognized regionally and nationally,
are among Prosper Portland’s most effective inclusive entrepreneurship initiatives. The
Challenge connected startups to entrepreneurial resources, helped launch more than a dozen
small businesses— many founded by people of color—and inspired initiatives to continue building a culture of equity. Prosper Portland’s Seed Fund
investment of $1.5 million resulted in:
46COMPANIES
GRADUATED
$8.5M LEVERAGED
IN FOLLOW-ON INVESTMENT
350NEW JOBS
CREATED
$53M ATTRACTED
IN OUTSIDE CAPITAL
4COMPANIES
EXITED THROUGH ACQUISITIONS
The 2015-16 class of the Startup PDX Challenge.
Prosper Portland Ten Year Financial Sustainability Plan | July 2018 10
Targeted Small Developer and Property Owner Programs
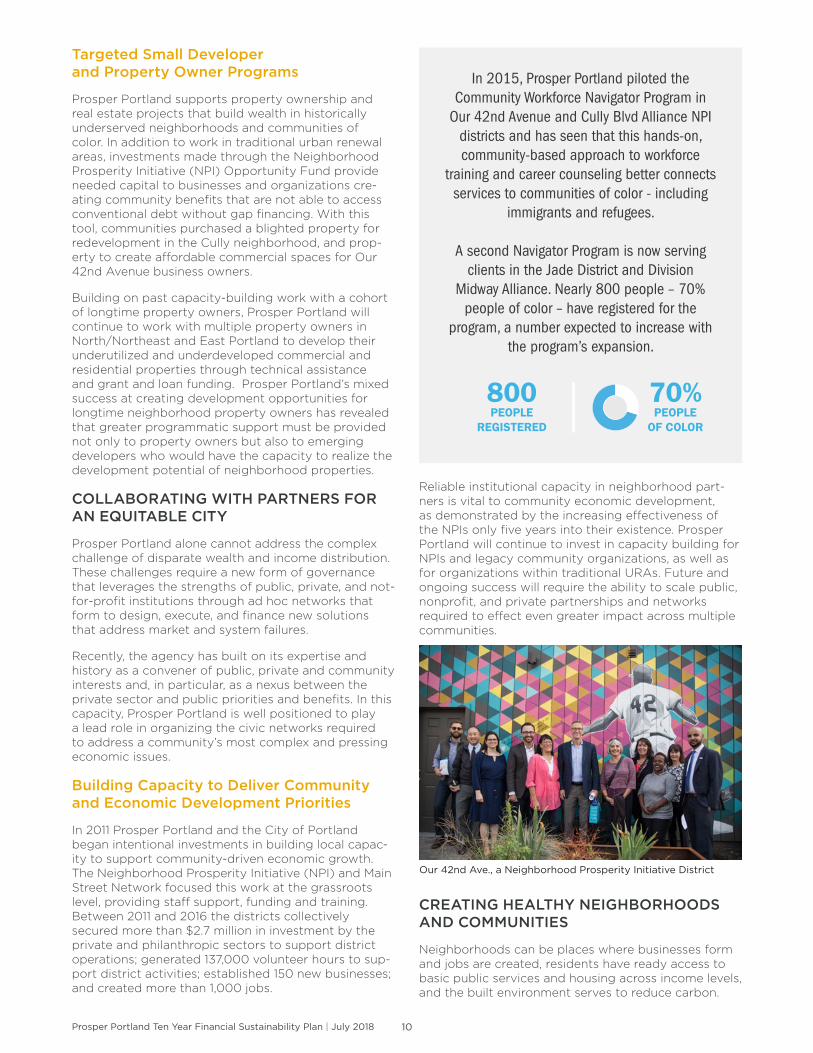
Prosper Portland supports property ownership and real estate projects that build wealth in historically underserved neighborhoods and communities of color. In addition to work in traditional urban renewal areas, investments made through the Neighborhood Prosperity Initiative (NPI) Opportunity Fund provide needed capital to businesses and organizations cre-ating community benefits that are not able to access conventional debt without gap financing. With this tool, communities purchased a blighted property for redevelopment in the Cully neighborhood, and prop-erty to create affordable commercial spaces for Our 42nd Avenue business owners.
Building on past capacity-building work with a cohort of longtime property owners, Prosper Portland will continue to work with multiple property owners in North/Northeast and East Portland to develop their underutilized and underdeveloped commercial and residential properties through technical assistance and grant and loan funding. Prosper Portland’s mixed success at creating development opportunities for longtime neighborhood property owners has revealed that greater programmatic support must be provided not only to property owners but also to emerging developers who would have the capacity to realize the development potential of neighborhood properties.
COLLABORATING WITH PARTNERS FOR AN EQUITABLE CITY
Prosper Portland alone cannot address the complex challenge of disparate wealth and income distribution. These challenges require a new form of governance that leverages the strengths of public, private, and not-for-profit institutions through ad hoc networks that form to design, execute, and finance new solutions that address market and system failures.
Recently, the agency has built on its expertise and history as a convener of public, private and community interests and, in particular, as a nexus between the private sector and public priorities and benefits. In this capacity, Prosper Portland is well positioned to play a lead role in organizing the civic networks required to address a community’s most complex and pressing economic issues.
Building Capacity to Deliver Community and Economic Development Priorities
In 2011 Prosper Portland and the City of Portland began intentional investments in building local capac-ity to support community-driven economic growth. The Neighborhood Prosperity Initiative (NPI) and Main Street Network focused this work at the grassroots level, providing staff support, funding and training. Between 2011 and 2016 the districts collectively secured more than $2.7 million in investment by the private and philanthropic sectors to support district operations; generated 137,000 volunteer hours to sup-port district activities; established 150 new businesses; and created more than 1,000 jobs.
Reliable institutional capacity in neighborhood part-ners is vital to community economic development, as demonstrated by the increasing effectiveness of the NPIs only five years into their existence. Prosper Portland will continue to invest in capacity building for NPIs and legacy community organizations, as well as for organizations within traditional URAs. Future and ongoing success will require the ability to scale public, nonprofit, and private partnerships and networks required to effect even greater impact across multiple communities.
CREATING HEALTHY NEIGHBORHOODS AND COMMUNITIES
Neighborhoods can be places where businesses form and jobs are created, residents have ready access to basic public services and housing across income levels, and the built environment serves to reduce carbon.
In 2015, Prosper Portland piloted the Community Workforce Navigator Program in
Our 42nd Avenue and Cully Blvd Alliance NPI districts and has seen that this hands-on, community-based approach to workforce
training and career counseling better connects services to communities of color - including
immigrants and refugees.
A second Navigator Program is now serving clients in the Jade District and Division
Midway Alliance. Nearly 800 people – 70% people of color – have registered for the
program, a number expected to increase with the program’s expansion.
800PEOPLE
REGISTERED
70% PEOPLE
OF COLOR
Our 42nd Ave., a Neighborhood Prosperity Initiative District
Prosper Portland Ten Year Financial Sustainability Plan | July 2018 11
However, the quality of opportunity and place in Portland’s neighborhoods varies widely, with particular long-standing deficiencies in East Portland.
A new paradigm has emerged to direct urban devel-opment and place-making activities that meet com-munity objectives. This paradigm relies upon a com-munity-centered approach to ensure that investments address the unique conditions of each neighborhood and that the benefits of increased investment flow to those communities. Prosper Portland recognizes that physical improvements and commercial investment can increase an area’s attractiveness to new residents while unintentionally creating affordability issues for low-income and longtime residents and business owners.
Prosper Portland will continue to focus on implement-ing community-centered development that mitigates displacement pressures and generates a higher level of economic integration. This approach will require new and innovative civic solutions, such as scaling the agency’s current efforts in commercial affordability or formalizing the use of community benefit agreements in projects with significant investment and public benefit potential.
Catalytic Commercial and Mixed Use Projects
Prosper Portland has a strong track record of commu-nity-based development, including the agency’s recent investments in the Lents Town Center Urban Renewal Area.
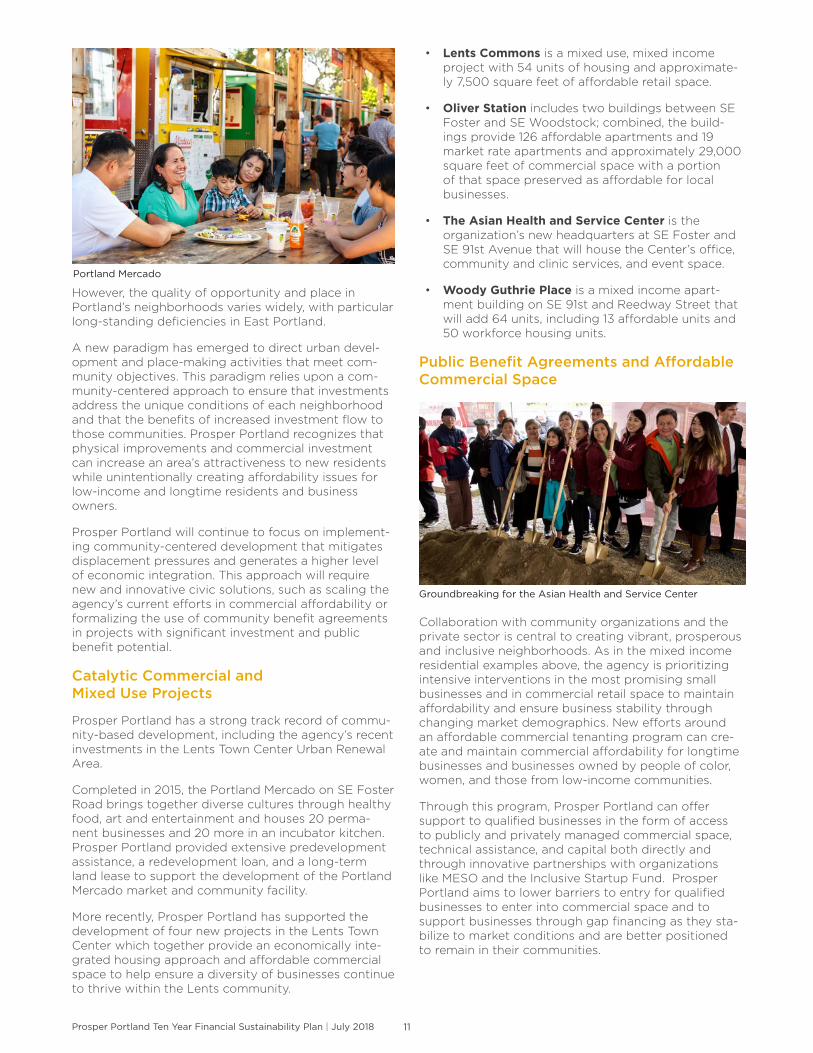
Completed in 2015, the Portland Mercado on SE Foster Road brings together diverse cultures through healthy food, art and entertainment and houses 20 perma-nent businesses and 20 more in an incubator kitchen. Prosper Portland provided extensive predevelopment assistance, a redevelopment loan, and a long-term land lease to support the development of the Portland Mercado market and community facility.
More recently, Prosper Portland has supported the development of four new projects in the Lents Town Center which together provide an economically inte-grated housing approach and affordable commercial space to help ensure a diversity of businesses continue to thrive within the Lents community.
• Lents Commons is a mixed use, mixed income project with 54 units of housing and approximate-ly 7,500 square feet of affordable retail space.
• Oliver Station includes two buildings between SE Foster and SE Woodstock; combined, the build-ings provide 126 affordable apartments and 19 market rate apartments and approximately 29,000 square feet of commercial space with a portion of that space preserved as affordable for local businesses.
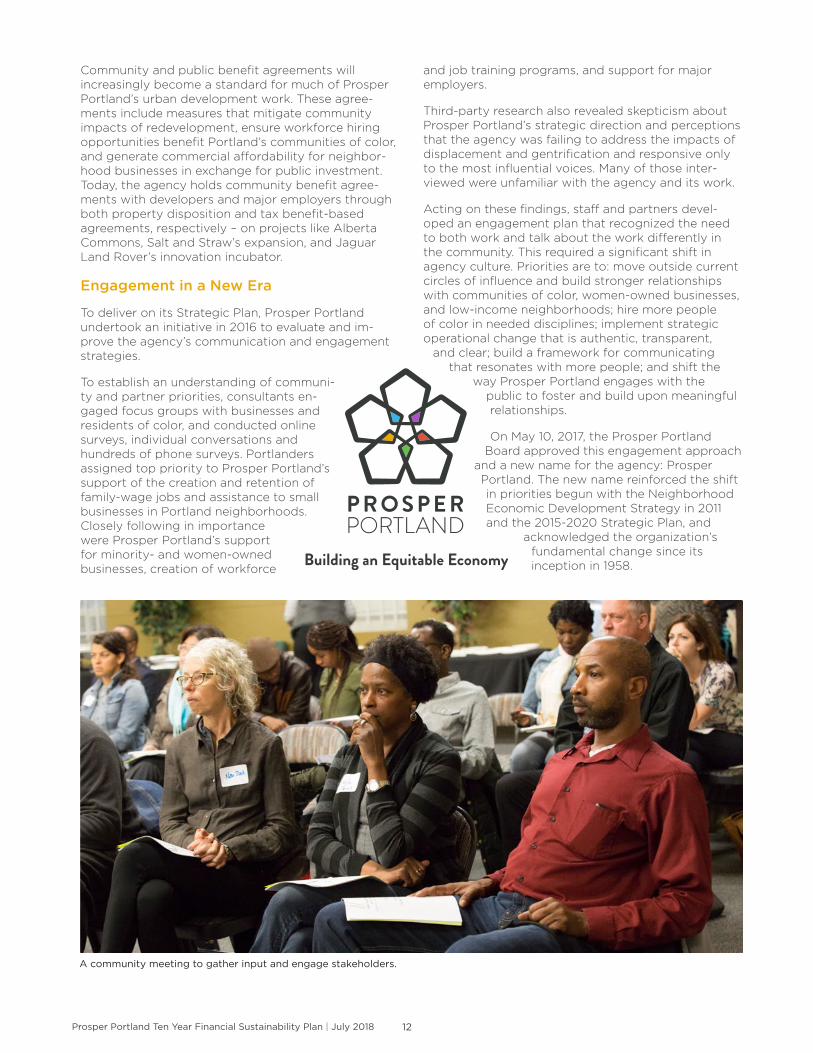
• The Asian Health and Service Center is the organization’s new headquarters at SE Foster and SE 91st Avenue that will house the Center’s office, community and clinic services, and event space.
• Woody Guthrie Place is a mixed income apart-ment building on SE 91st and Reedway Street that will add 64 units, including 13 affordable units and 50 workforce housing units.
Public Benefit Agreements and Affordable Commercial Space
Collaboration with community organizations and the private sector is central to creating vibrant, prosperous and inclusive neighborhoods. As in the mixed income residential examples above, the agency is prioritizing intensive interventions in the most promising small businesses and in commercial retail space to maintain affordability and ensure business stability through changing market demographics. New efforts around an affordable commercial tenanting program can cre-ate and maintain commercial affordability for longtime businesses and businesses owned by people of color, women, and those from low-income communities.
Through this program, Prosper Portland can offer support to qualified businesses in the form of access to publicly and privately managed commercial space, technical assistance, and capital both directly and through innovative partnerships with organizations like MESO and the Inclusive Startup Fund. Prosper Portland aims to lower barriers to entry for qualified businesses to enter into commercial space and to support businesses through gap financing as they sta-bilize to market conditions and are better positioned to remain in their communities.
Portland Mercado
Groundbreaking for the Asian Health and Service Center
Prosper Portland Ten Year Financial Sustainability Plan | July 2018 12
Community and public benefit agreements will increasingly become a standard for much of Prosper Portland’s urban development work. These agree-ments include measures that mitigate community impacts of redevelopment, ensure workforce hiring opportunities benefit Portland’s communities of color, and generate commercial affordability for neighbor-hood businesses in exchange for public investment. Today, the agency holds community benefit agree-ments with developers and major employers through both property disposition and tax benefit-based agreements, respectively – on projects like Alberta Commons, Salt and Straw’s expansion, and Jaguar Land Rover’s innovation incubator.
Engagement in a New Era
To deliver on its Strategic Plan, Prosper Portland undertook an initiative in 2016 to evaluate and im-prove the agency’s communication and engagement strategies.
To establish an understanding of communi-ty and partner priorities, consultants en-gaged focus groups with businesses and residents of color, and conducted online surveys, individual conversations and hundreds of phone surveys. Portlanders assigned top priority to Prosper Portland’s support of the creation and retention of family-wage jobs and assistance to small businesses in Portland neighborhoods. Closely following in importance were Prosper Portland’s support for minority- and women-owned businesses, creation of workforce
and job training programs, and support for major employers.
Third-party research also revealed skepticism about Prosper Portland’s strategic direction and perceptions that the agency was failing to address the impacts of displacement and gentrification and responsive only to the most influential voices. Many of those inter-viewed were unfamiliar with the agency and its work.
Acting on these findings, staff and partners devel-oped an engagement plan that recognized the need to both work and talk about the work differently in the community. This required a significant shift in agency culture. Priorities are to: move outside current circles of influence and build stronger relationships with communities of color, women-owned businesses, and low-income neighborhoods; hire more people of color in needed disciplines; implement strategic operational change that is authentic, transparent,
and clear; build a framework for communicating that resonates with more people; and shift the
way Prosper Portland engages with the public to foster and build upon meaningful relationships.
On May 10, 2017, the Prosper Portland Board approved this engagement approach
and a new name for the agency: Prosper Portland. The new name reinforced the shift in priorities begun with the Neighborhood Economic Development Strategy in 2011 and the 2015-2020 Strategic Plan, and
acknowledged the organization’s fundamental change since its inception in 1958.
A community meeting to gather input and engage stakeholders.
Prosper Portland Ten Year Financial Sustainability Plan | July 2018 13
Strategic Advantage
Prosper Portland’s institutional capacity to lead change is unrivaled among city agencies. This exper-tise and capacity is the key to delivering on the city’s long-term commitment to economic growth and community development that encompasses broader long-term City priorities and goals. The agency is guided by these long-term goals while working in five-year implementation increments to better reflect private market trends and changing community needs. The agency is also uniquely positioned given its distinct charter, per City Council direction, which allows the agency a wide range of tools with which to leverage private partnership, activity, and investment towards publicly desired outcomes.
The agency’s responsiveness, nimbleness, deep expertise, passion, focus on collaboration, and sense urgency are its defining characteristics. Prosper Portland staff are experienced in bridging business needs with public policy objectives. The agency has a history of helping businesses and communities navigate bureaucracy to accomplish their desired outcomes. Development and loan agreements, the agency’s primary redevelopment tools, are effective largely because Prosper Portland has served as a reliable public partner to communities and private partners for decades and across changing political administrations.
The agency has the unique capacity within its staff and IT systems to underwrite loans based on com-munity priorities and to provide access to capital in a manner that is distinctly different from the private lending institutions. The agency has a legal ability to acquire and dispose of properties on behalf of the City, to pursue place-based development trans-actions, and has a culture of building relationships rooted in the community that is distinct from active private and nonprofit development entities.
In many cases, this work is fundamentally about tackling systemic change. TIF has enabled the agency to take a long-term view of its work and make multi-year commitments that provide comfort to communi-ty and private partners as well. A new business model for the agency cannot simply transition the agency into a City bureau dependent on annual appropria-tions to fund its work. The agency must pursue new recurring revenues to maintain its long-view perspec-tive as well as predictability for community partners, always in accordance with its 2015-2020 Strategic Plan and the goal of widely shared prosperity among all Portland residents.
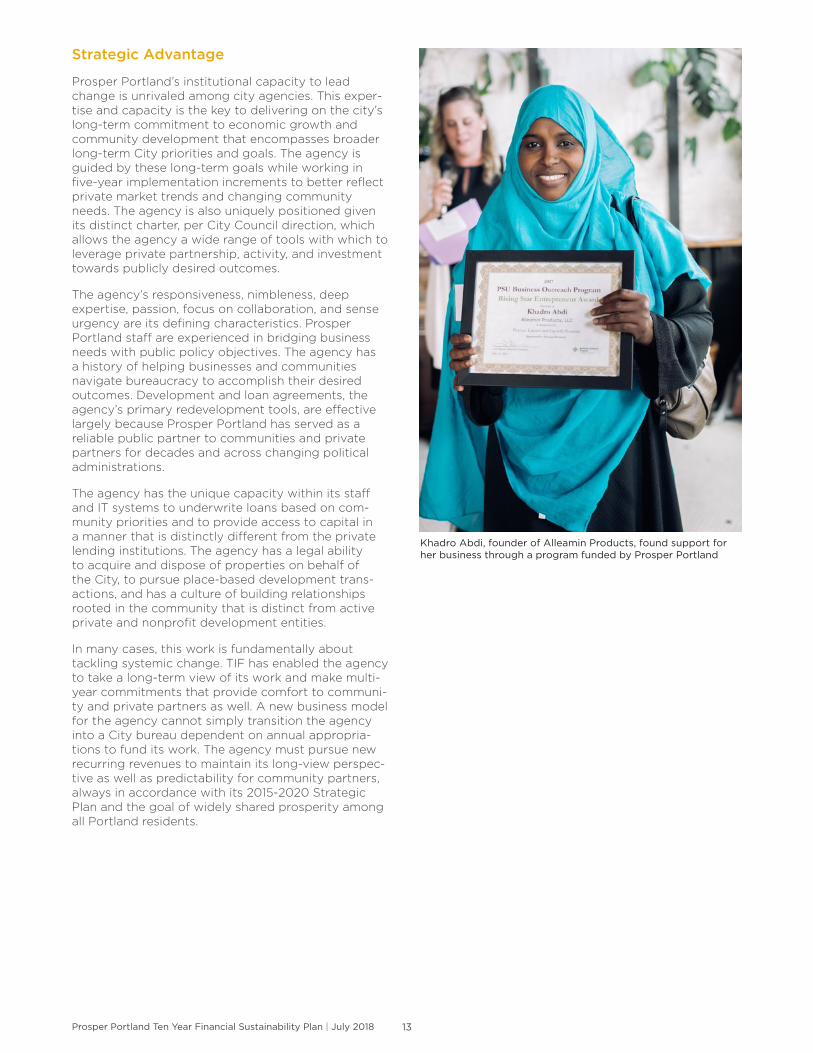
Khadro Abdi, founder of Alleamin Products, found support for her business through a program funded by Prosper Portland
Prosper Portland Ten Year Financial Sustainability Plan | July 2018 14
FINANCIAL CONTEXT
1 “Under Portland City Code (PCC), Chapter 15, PDC (now Prosper Portland) is chartered to “advance social equity and involve the constituencies of the City to create, maintain, and promote a diverse, sustainable community in which economic prosperity, and employment opportunities are made available to all [Portland] residents.” PDC is Portland’s only public agency assigned the dual responsibility of overseeing implementation of the City’s economic development strategies and managing the investment of urban renewal resources under ORS Chapter 457.
2 The City of Portland has created 21 URAs since Prosper Portland’s formation. The URAs that have retired are South Auditorium; St. Johns Riverfront, Northwest Front Avenue Industrial URA, and the Education URA. Seventeen areas remain active, including the six smaller districts included in the Neighborhood Prosperity Network: Airport Way, Central Eastside*, Convention Center, Downtown Waterfront, Gateway*, Interstate Corridor*, Lents Town Center*, NPI (6)*, North Macadam*, River District*, South Park Blocks. The twelve districts with * are still able to issue new debt in 2018.
3 Source: City of Portland Auditor Report: “Portland Development Commission: Indicators in Urban Renewal Aras suggest economic progress.” December, 2012. Auditor examined historical data in five URAs, focusing on economic indicators of jobs, wages, and real estate values. Methodology measures five URAs to three control areas and the city overall. The report concluded that compared other areas of the city and to the city as a whole, employment, average wages and real estate values in the URAs have grown during the study period (1996 through 2010). In the URAs studied, the number of private sector jobs increased by 18 percent and wages by 29 percent. This compares to job losses city-wide of 10 percent and 7 percent in the control areas. Real estate values in the URAs also increased almost twice as much as other parts of the city.
4 Forecast includes known or existing sources.
P rosper Portland’s portfolio of services today includes a suite of tools and programs to support community development and foster
economic opportunity in Portland. However, at a time when the agency demonstrates results in addressing the city’s most pressing economic disparities, Prosper Portland faces a sustained and precipitous decline in its traditional resource base. Moreover, the agency must develop and ap-ply a new array of more flexible financial sources and tools to support inclusive economic growth throughout the city. The changing financial con-text thus provides an opportunity to pursue new business practices in line with Prosper Portland’s strategic priorities.
Impact and Stewardship of Tax Increment Financing (TIF)Charged with implementing the vision and goals of the City relating to urban renewal since 19581, Tax Increment Financing (TIF), a property tax-based funding tool available to support capital improvements within Urban Renewal Areas (URAs), has served as the primary source of funding for Prosper Portland projects and operations. Of the seventeen active URAs today, twelve areas—in-cluding the six Neighborhood Prosperity Network dis-tricts—will be able to issue new debt resources into the early 2020s2. A December 2012 audit by the City Auditor confirmed that URAs experienced higher job and wage growth than communities outside URAs, and most URAs attracted more investment than areas outside URAs3.
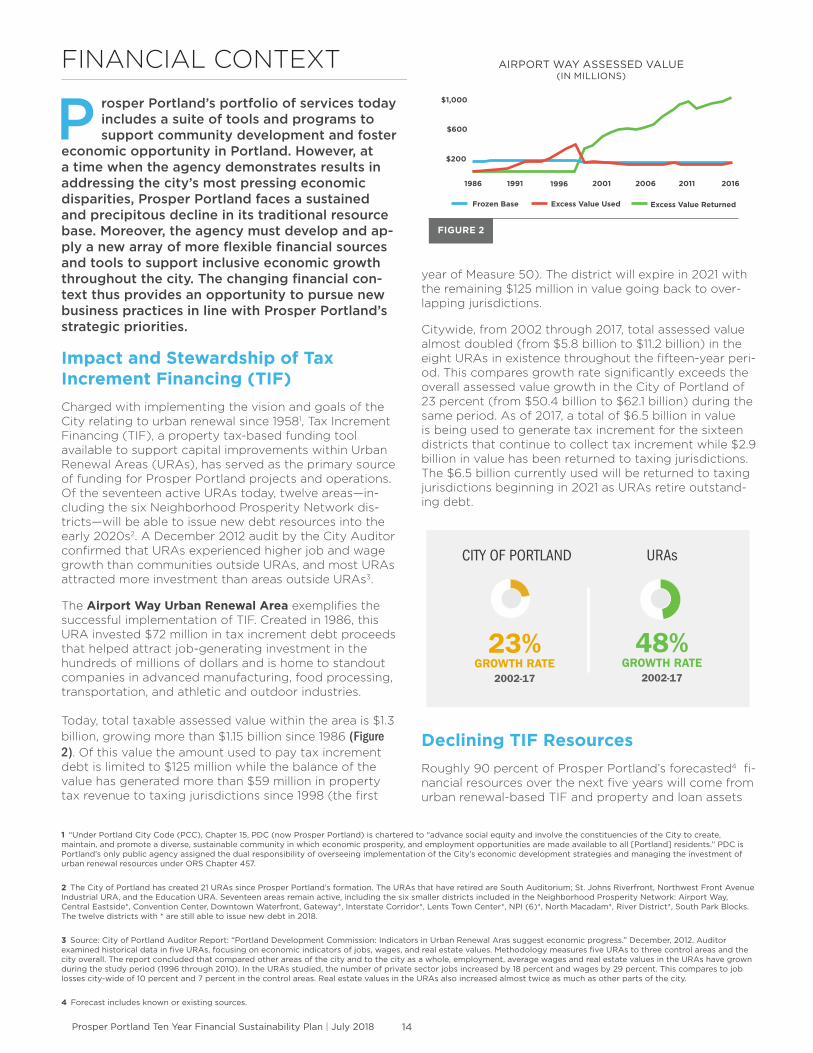
The Airport Way Urban Renewal Area exemplifies the successful implementation of TIF. Created in 1986, this URA invested $72 million in tax increment debt proceeds that helped attract job-generating investment in the hundreds of millions of dollars and is home to standout companies in advanced manufacturing, food processing, transportation, and athletic and outdoor industries. Today, total taxable assessed value within the area is $1.3 billion, growing more than $1.15 billion since 1986 (Figure 2). Of this value the amount used to pay tax increment debt is limited to $125 million while the balance of the value has generated more than $59 million in property tax revenue to taxing jurisdictions since 1998 (the first
year of Measure 50). The district will expire in 2021 with the remaining $125 million in value going back to over-lapping jurisdictions.
Citywide, from 2002 through 2017, total assessed value almost doubled (from $5.8 billion to $11.2 billion) in the eight URAs in existence throughout the fifteen-year peri-od. This compares growth rate significantly exceeds the overall assessed value growth in the City of Portland of 23 percent (from $50.4 billion to $62.1 billion) during the same period. As of 2017, a total of $6.5 billion in value is being used to generate tax increment for the sixteen districts that continue to collect tax increment while $2.9 billion in value has been returned to taxing jurisdictions. The $6.5 billion currently used will be returned to taxing jurisdictions beginning in 2021 as URAs retire outstand-ing debt.
Declining TIF ResourcesRoughly 90 percent of Prosper Portland’s forecasted4 fi-nancial resources over the next five years will come from urban renewal-based TIF and property and loan assets
CITY OF PORTLAND
23% GROWTH RATE
2002-17
48% GROWTH RATE
2002-17
URAs
$200
$600
$1,000
1986 1991 1996 2001 2006 2011 2016
Frozen Base Excess Value Used Excess Value Returned
FIGURE 2
AIRPORT WAY ASSESSED VALUE (IN MILLIONS)
Prosper Portland Ten Year Financial Sustainability Plan | July 2018 15
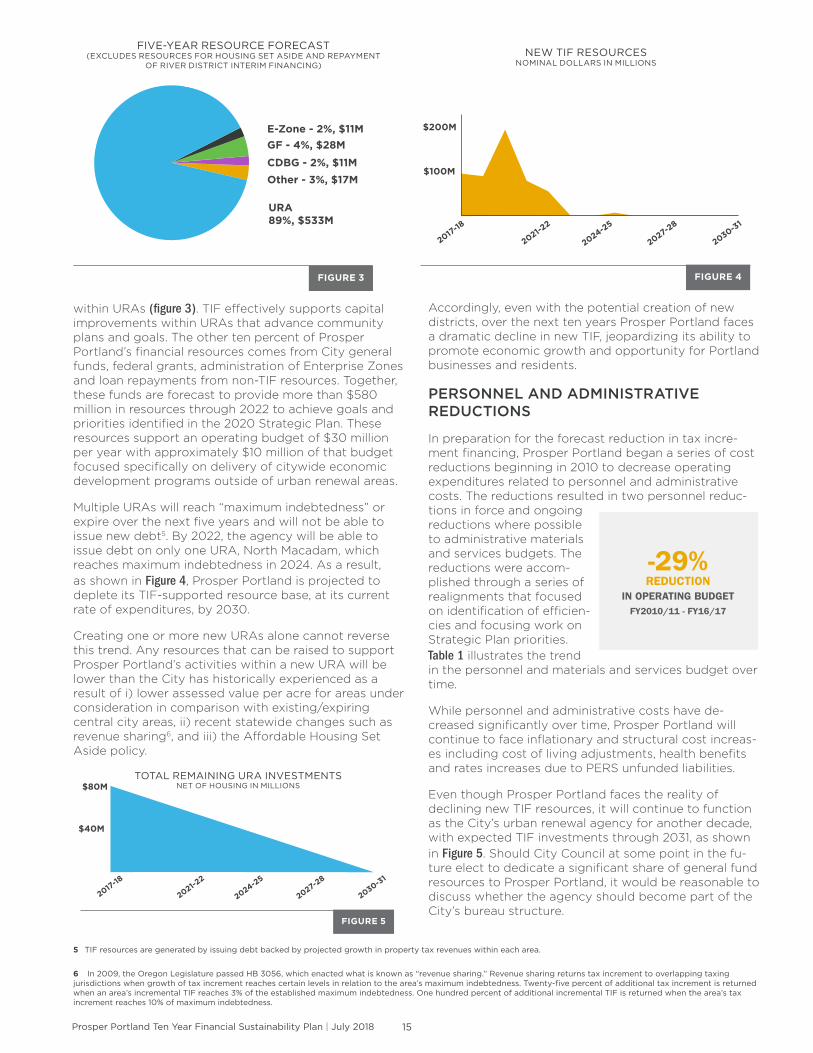
within URAs (figure 3). TIF effectively supports capital improvements within URAs that advance community plans and goals. The other ten percent of Prosper Portland’s financial resources comes from City general funds, federal grants, administration of Enterprise Zones and loan repayments from non-TIF resources. Together, these funds are forecast to provide more than $580 million in resources through 2022 to achieve goals and priorities identified in the 2020 Strategic Plan. These resources support an operating budget of $30 million per year with approximately $10 million of that budget focused specifically on delivery of citywide economic development programs outside of urban renewal areas.
Multiple URAs will reach “maximum indebtedness” or expire over the next five years and will not be able to issue new debt5. By 2022, the agency will be able to issue debt on only one URA, North Macadam, which reaches maximum indebtedness in 2024. As a result, as shown in Figure 4, Prosper Portland is projected to deplete its TIF-supported resource base, at its current rate of expenditures, by 2030.
Creating one or more new URAs alone cannot reverse this trend. Any resources that can be raised to support Prosper Portland’s activities within a new URA will be lower than the City has historically experienced as a result of i) lower assessed value per acre for areas under consideration in comparison with existing/expiring central city areas, ii) recent statewide changes such as revenue sharing6, and iii) the Affordable Housing Set Aside policy.
5 TIF resources are generated by issuing debt backed by projected growth in property tax revenues within each area.
6 In 2009, the Oregon Legislature passed HB 3056, which enacted what is known as “revenue sharing.” Revenue sharing returns tax increment to overlapping taxing jurisdictions when growth of tax increment reaches certain levels in relation to the area’s maximum indebtedness. Twenty-five percent of additional tax increment is returned when an area’s incremental TIF reaches 3% of the established maximum indebtedness. One hundred percent of additional incremental TIF is returned when the area’s tax increment reaches 10% of maximum indebtedness.
Accordingly, even with the potential creation of new districts, over the next ten years Prosper Portland faces a dramatic decline in new TIF, jeopardizing its ability to promote economic growth and opportunity for Portland businesses and residents.
PERSONNEL AND ADMINISTRATIVE REDUCTIONS
In preparation for the forecast reduction in tax incre-ment financing, Prosper Portland began a series of cost reductions beginning in 2010 to decrease operating expenditures related to personnel and administrative costs. The reductions resulted in two personnel reduc-tions in force and ongoing reductions where possible to administrative materials and services budgets. The reductions were accom-plished through a series of realignments that focused on identification of efficien-cies and focusing work on Strategic Plan priorities. Table 1 illustrates the trend in the personnel and materials and services budget over time.
While personnel and administrative costs have de-creased significantly over time, Prosper Portland will continue to face inflationary and structural cost increas-es including cost of living adjustments, health benefits and rates increases due to PERS unfunded liabilities.
Even though Prosper Portland faces the reality of declining new TIF resources, it will continue to function as the City’s urban renewal agency for another decade, with expected TIF investments through 2031, as shown in Figure 5. Should City Council at some point in the fu-ture elect to dedicate a significant share of general fund resources to Prosper Portland, it would be reasonable to discuss whether the agency should become part of the City’s bureau structure.
NEW TIF RESOURCES NOMINAL DOLLARS IN MILLIONS
FIGURE 4
$200M
$100M
2017-18
2021-22
2024-25
2030-31
2027-28
FIVE-YEAR RESOURCE FORECAST (EXCLUDES RESOURCES FOR HOUSING SET ASIDE AND REPAYMENT
OF RIVER DISTRICT INTERIM FINANCING)
FIGURE 3
-29% REDUCTION
IN OPERATING BUDGETFY2010/11 - FY16/17
Other
CDBG
GF
Ezone
URA
URA 89%, $533M
CDBG - 2%, $11MOther - 3%, $17M
E-Zone - 2%, $11MGF - 4%, $28M
TOTAL REMAINING URA INVESTMENTS NET OF HOUSING IN MILLIONS
FIGURE 5
$80M
$40M
2017-18
2021-22
2024-25
2030-31
2027-28

Prosper Portland Ten Year Financial Sustainability Plan | July 2018 16
Institutional Assets and CapacityResponsible for developing a variety of public/private partnerships on behalf of the City of Portland, Prosper Portland maintains both financial and institutional capacities beyond stewardship of new TIF debt.
LEGALLY STRUCTURED TO FACILITATE PUBLIC/PRIVATE PARTNERSHIPS
As7the designated urban renewal authority for Portland, Prosper Portland is granted a variety of pow-ers under state statute including the ability to create and manage URAs; identify and respond to “blight” (a frequently misunderstood term that includes underuti-lized real estate and poorly performing infrastructure); raise TIF to cure blight in URAs; and assemble and hold real estate for strategic redevelopment (e.g., U.S. Post Office site).
Prosper Portland may also form, finance, and manage special purpose entities to achieve strategic objec-tives. Recent examples include:
• 9101 LLC, formed upon notice that a developer was unable to complete a mixed-use affordable housing project in Lents due to constraints. Prosper Portland assumed the role of developer and contained legal and financial risks of the project within the LLC.
• The Portland Economic Investment Corporation (PEIC) a 501(c)(4) entity created to invest and take an ownership interest in early-stage Portland tech companies.
• Formation of the Portland Community Investment Fund to obtain New Market Tax Credit allocations to leverage resources, implementing City policy and the 2020 Strategic Plan.
Prosper Portland’s volunteer commissioners are appointed by the Mayor and approved by City Council. This structure reflects the best combination of public representation, by way of mayoral and City Council
7 2011 Reduction in Force resulted in reduction of 20 Full Time Equivalent positions between FY 2010-11 and FY 2011-12; 2 Limited Term Positions Ended. 2013 Reduction in Force resulted in net reduction of 21.6 Full Time Equivalent Positions between FY 2013-14 and FY 2014-15; 6 Limited Term Positions ended. 2015-16 Early Retirement Incentive Program resulted in reduction of 7.5 Full Time Equivalent Positions. FY 2014-15 and FY 2015-16 Administrative Materials and Services included $1.2 million in one-time costs associated with implemenation of Microsoft Dynamics ERP system.
appointments, and close alignment with the communi-ty and private sector, by way of individual commission-ers’ affiliations and professional backgrounds. Value is provided to Portland’s residents through swift and focused decision-making around defined city priori-ties. Within this structure, Prosper Portland is able to both support targeted community investments and upgrade public infrastructure as seen in projects like the Pacific Northwest College of Art (PNCA) renova-tion and Gateway streetscape improvements while ultimately maintaining accountability to the public through municipal law (e.g., public records, meetings, and contracting rules).
Additionally, in its current form as a City agency with unique legal structure, including an independent board, Prosper Portland’s structure provides an im-portant third-party perspective and oversight for City Council. Portland City Council exercises considerable influence over the direction of Prosper Portland while maintaining an arm’s length separation on individual agreements with private parties. In this way, City deci-sion-makers are separated from structuring of partner-ships with parties that might lobby or otherwise try to unduly influence agreements. This separation parallels the Portland Planning & Sustainability Commission or the State Land Use Board of Appeals, and cities around the U.S. have adopted similar structures for their economic development and redevelopment units.
REAL ESTATE MANAGEMENT AND REDEVELOPMENT
Historically, Prosper Portland’s property management and redevelopment approach has been guided by urban renewal plans and the strategic utilization of TIF for facilitating the acquisition, development and disposition of properties in support of those plans. Prosper Portland’s unique ability to purchase and dis-pose of properties without undertaking a proscriptive surplus property process continues to uniquely enable the agency to support public/private partnerships and to sell or redevelop properties to achieve community objectives.
TABLE 1
FY 2010-11 Actual FY 2011-12 Actual FY 2012-13 Actual FY 2013-14 Actual FY 2014-15 Actual FY 2015-16 Actual FY 2016-17 Actual
Positions 161 138 135 123 95 95 87
Salaries and Benefits 17,436,992 14,500,221 14,782,565 12,999,763 11,295,447 11,857,117 11,008,669
Total Salaries/Benefits 17,437,152 14,500,359 14,782,700 12,999,886 11,295,542 11,857,212 11,008,756
PERS Pension Obligation Bond Payments + Administrative Materials and Services
5,018,298 4,836,445 4,801,279 4,763,059 4,800,714 5,504,708 4,916,700
Grand Total 22,455,450 19,336,804 19,583,979 17,762,945 16,096,256 17,361,920 15,925,456
PERSONNEL AND ADMINISTRATIVE BUDGET7

Prosper Portland Ten Year Financial Sustainability Plan | July 2018 17
Today, Prosper Portland owns and maintains a sizable real estate portfolio. Currently valued at $322,600,3608, the portfolio consists of 54 properties including vacant land, retail, industrial, mixed-use, residential, and special purpose assets. The properties generated $4,677,191 in gross revenue in fiscal year (FY) 2016-17. In the last 12 months, staff has begun the process of identifying op-portunities to build on and improve asset management infrastructure. As a result, the agency selected a new software, Yardi Voyager, and will create individualized property plans, revised policies and procedures, and capital budgeting in 2018.
LENDING AND INVESTING
Experienced underwriters, diligent loan servicing staff and robust lending administration infrastructure support the agency’s lending priorities while manag-ing the portfolio to minimize risk and maximize loan repayment. Over the last several years, Prosper Portland has closed an average of 18 loans per year, almost equally split between loans invested in commercial real estate development projects and loans to busi-nesses. Prosper Portland holds a loan portfolio composed of 126 loans with an outstanding value of more than $77 million. The 88 loans to small businesses total $15 million, while the remaining 38 loans represent $62.2 million to finance commercial property development.
The agency’s ability to generate a robust loan pipeline has been hampered by the limited amount of non-TIF funds avail-able for businesses, many of which seek more flexible, working capital as well as fewer business development officers available to reach prospective customers following reductions in staff over the last five years. With additional unrestricted capital sources and connections to businesses in need of capital, agency underwriters and loan servicing staff have the capacity to process at least double the current amount of loan volume.
LENDING PARTNERSHIPS
In order to effectively deploy capital to underserved businesses and communities, Prosper Portland has recently developed productive partnerships with third parties. These partnerships support direct, technical assistance to businesses, leverage additional financial resources, and originate and service debt or equity that includes resources from Prosper Portland.
For example, Prosper Portland made resources avail-able to support “mini-micro” loans and 100 percent se-cured line of credit products. Micro Enterprise Services of Oregon (MESO) successfully proposed to administer those resources in 2015 and through this partnership, MESO has deployed more than 60 small business loans to underrepresented entrepreneurs with a lean, cost-effective, customer-centric infrastructure. Prosper
8 Multnomah County Real Market Value Estimate
Portland has also created or facilitated the creation of alternative vehicles for investment in growing business-es through the Portland Seed Fund, Elevate Inclusive Startup Fund, and Portland Economic Investment
Corporation.
Whether through direct loans or through partnerships with third parties, in order to support businesses not adequately served by traditional financial institutions the agency requires a steady source of non-TIF funds. These resources will support a critical mass of businesses that, in turn, leverage these funds to create jobs, grow their businesses, and invest back into their communities.
Need for New Financial Sources and Tools While the power of urban renewal as a tool is clear and a steep decline in TIF represents Prosper Portland’s most pressing financial challenge, the highly restrictive nature of TIF also poses challenges for the agency in fulfilling its mission. TIF has shortcomings as a tool for economic development. Limits due to the geography of URA plans and the use of
TIF debt proceeds (limited to capital purposes) pre-vents TIF from directly supporting key programs such as traded sector cluster development, business techni-cal assistance, entrepreneur programs and workforce development.
Furthermore, because TIF relies on making investments to generate increases in property taxes, this funding model’s success can also make neighborhoods less affordable for the residents and businesses Prosper Portland is attempting to serve. Consequently, even with a stable flow of TIF over the next decade Prosper Portland would still be seeking to diversify its resources in order to pursue its objectives.
The Ten Year Financial Sustainability Plan’s proposed shift away from a singular reliance on TIF to a more diversified funding stream is critical to improving Prosper Portland’s effectiveness in serving Portland’s most economically disconnected communities. Prosper Portland’s recent successes in community economic development reflect a reduced reliance on TIF and offer a model for the agency’s approach to its future work.
The first class of the Elevate Inclusive Startup Fund.
$323M REAL ESTATE PORTFOLIO
$4.7M REVENUE
FY2016-17
142 LOANS
$80M OUTSTANDING
VALUE

Prosper Portland Ten Year Financial Sustainability Plan | July 2018 18
Best Practice ReviewIn September 2015, Prosper Portland convened a Financial Sustainability Committee comprising stakeholders and experts in funding mechanisms for Prosper Portland and local governments. Prosper Portland also contracted with a national economic development consulting firm, HR&A Advisors, to con-duct a best practices survey of similar organizations throughout the country to make recommendations to the committee about potential long-term funding scenarios.
HR&A analyzed the impact and feasibility of a number of funding sources using case studies from peer or-ganizations and applied these findings as recommen-dations for Prosper Portland. One of the most striking findings of this research is Prosper Portland’s depen-dence on public funding, unique among its peer orga-nizations around the U.S. As Table 2 highlights, Prosper Portland’s peer agencies rely on revenue streams more diversified than local public funding, from sources such as real estate. While some peers, such as the Chicago Department of Planning and Development, relied substantially on public funds for both operating and capital budgets, others such as Invest Atlanta and the New York Economic Development Corporation derived both operating and capital resources from fees or real estate assets.
After thorough review of peer organizations, specific case studies and Portland’s opportunities, HR&A and the Financial Sustainability Committee recommended the agency pursue the following:
1. “Boomerang” Funds or property tax revenues that make their way back to the City of Portland and other taxing jurisdictions as individual URAs re-paying outstanding debt are terminated, or as tax increment is no longer collected for other reasons.
2. TIF Program Income including the potential for new URAs, project-specific “spot districts” with limited duration and/or limited scope and program income generated.
3. Real estate controlled by Prosper Portland, City agencies, or other public entities that may provide stable, long-term revenue.
The above topics were recommended as high priority sources due to being considered high impact and more feasible to implement. The FSC also considered but ultimately did not recommend substantial or immediate focus on either i) sources with high impact but challenges to implement, such as state and federal grants or ii) supplementary sources that may be more feasible but have lower financial or community impact. Finally, venture philanthropy and taxes and fees already dedicated to other purposes were consid-ered a low priority given low impact and challenging feasibility.
LOW
HIG
H
CHALLENGING ACCESSIBLE
Feasibility
Imp
act
TABLE 2
Federal Grants
State Grants
State Loans
Philanthropic Grants
Mission Related Investment (MRI)
Impact Investments (SRI)
Current TIF/New TIF (Spot Districts)
TIF Program Income (if unrestricted)
“Boomerang” Funds
Real Estate Owned Development
Parking
Return on Business Investments
Program Related Investment (PRI)
EB-5
New Market Tax Credits
Enterprise Zone
HIGH PRIORITY SOURCESSOURCES FOR FURTHER CONSIDERATION
Venture Philanthropy
Dedicated Taxes and Fees (already allocated for other purposes)
City-owned Real Estate
Business & Local Improvement Districts
Fees for New Services
Cost Recovery
SUPPLEMENTARY SOURCESLOW PRIORITY SOURCES
Prosper Portland Ten Year Financial Sustainability Plan | July 2018 19
NEW BUSINESS MODEL
F or Prosper Portland to fulfill the promise of its 2020 Strategic Plan, the agency must adopt a disciplined, diversified business model which strikes a balance between advancing its mission, sourcing new revenues to fund the agency’s work and preserving the agency’s position as a
driving force of economic progress and equity across the city. With the decline of TIF resources, the agency is pivoting away from a singular focus on property redevelopment to seek opportunities for income generating and commercial tenanting that further the agency’s strategic priorities and operational needs. The Ten Year Financial Sustainability Plan offers a high-level framework for the agency to fund its critical work for years to come.
The framework is informed by a New Business Model that incorporates four key components that are described below and illustrated in Scenario A (See Appendix C, Operating Budget Model). By implementing the four com-ponents, Scenario A generates $101 million in new revenue and helps fund a $27 million per year operating budget that would otherwise diminish as existing urban renewal areas expire. An additional Scenario B is included that stresses Scenario A and illustrates how the operating budget and long-term program outcomes may be impacted by not adopting or fully implementing different components of the New Business Model.
The New Business Model is composed of the following approaches and actions:
1. Optimize both public benefits and financial return of the remaining tax increment funds and existing real estate assets
a. Optimize use of remaining TIF funds available to the agency prior to end of each of the existing URAs.
b. Use the agency’s most valuable asset, its real estate and loan portfolio, as the basis for creat-ing a long-term revenue stream for the agency.
c. Plan for the conversion of TIF-funded assets to unrestricted funds when possible.
2. Secure additional public funding to support economic and community development programs
a. Identify an additional City funding stream to partially offset the loss of TIF; focus on the impending “boomerang” revenue stream to the City of Portland to provide operational capacity
b. Secure new public resources as needs and opportunities arise that align with the agency’s core economic and community development competencies
3. Partner with public agencies to deliver real estate development activities that achieve public priorities
a. Leverage real estate development expertise to pursue acquisition, redevelopment and other commercial development activities to deliver community development outcomes and secure financial return to the agency.
4. Seek additional revenues for capital and operations by leveraging core expertise
a. Maximize fee revenue and secure partnerships that align with the agency’s core economic, community and development competencies
b. Pursue new TIF districts in a strategic manner to provide capital funding to catalytic public/private projects
While implemented on different timelines, the com-ponents of the New Business Model complement each other and ultimately provide new operating and capital resources to replace the current level of tax increment resources by 2027. Optimization of the remaining tax increment funds and real estate assets is the most critical component, creating the largest source of new resources in the model. Work on this component began in preparation for the FY 2017-18 annual budget process and with Prosper Portland Board’s adoption of the Financial Investment Policy in June 2017.
Access to boomerang property tax revenue depends on a specific timeline driven by the retirement of URA debt. Other components—partnering with public agencies on real estate development and leverag-ing core expertise—require thoughtful planning by Prosper Portland, City Council and other partners to identify and commit to opportunities over the next ten years.

Prosper Portland Ten Year Financial Sustainability Plan | July 2018 20

Prosper Portland Ten Year Financial Sustainability Plan | July 2018 21
New Business Model Components
1. Optimize both public benefits and financial return of the remaining tax increment funds and existing real estate assets
A cornerstone of the New Business Model is the management of the agency’s asset and investment portfolio to generate a blended rate of return that is both consistent with agency values and informed by market performance. In the past, the agency measured public return on investment through long-term generation of new property tax revenues. Under this new framework, the public re-turn on investment is based on price performance, with the agency realizing a primary return through the direct financial performance of its investment.
The target return expectations are based on a current valuation of the agency’s portfolio and subject to review based on continuous evaluation of market dynamics and strategic priorities. Return expectations explicitly stated in this plan are on an annualized basis and based on a blended rate which accounts for the risks and costs associat-ed with the unique community-based nature of Prosper Portland investments and the assets in its portfolio.
1a. Optimize Public Benefit and Financial Return from Remaining TIF
Prosper Portland has roughly $470 million in TIF to invest over the remaining ten years of existing URAs. The way these funds are invested can have a profound impact on the agency’s financial future. Historically, Prosper Portland has invested TIF with the expecta-tion that the primary return on those funds occurred through an increased long-term property tax revenue stream. Based on this return model, investment was often made via grants and infrastructure rather than directly into the development project. This prior framework also relied on an outdated notion that achieving a public benefit and generating a financial development-based return—be-yond a property tax return—are incompatible objectives.
In recent years, new models of investment have emerged that marry the objectives of social impact and financial return to attract
new forms of capital to organizations trying to address the most pressing social issues of the time. Prosper Portland has the opportu-nity to benefit from this evolution in thinking by adopting an impact investment model for putting its remaining TIF to work in Portland communities. This shift in philosophy to accept both the possibility and appropriate-ness of securing a return acknowledges the relationship between risk and reward and advances the right of the public to receive gains commensurate with risk, rather than privatizing all the benefit.
In recognition of this new impact investment approach, the Prosper Portland Board ap-proved the following principles in the agen-cy’s updated Financial Investment Policy in June 2017:
• When investing public resources to achieve its 2020 Strategic Plan, Prosper Portland will apply sound financial guidelines and accountable and trans-parent processes.
• In general, all investments should seek public benefits and result in asset ownership or a financial return of and on capital.
• Investment should have a leverage target that maximizes the percentage of non-Prosper Portland resources in a project.
• Grants and infrastructure expenditures should be limited to annual agency-wide budgets that are consistent with Prosper Portland’s long-term plan for financial sustainability.
• Any forgiveness of loan principal will be considered a grant and count against the current or following fiscal year budget established for grants.

Prosper Portland Ten Year Financial Sustainability Plan | July 2018 22
Based on the agency’s annual budget process, knowledge of current market conditions in various URAs, and community input, Figure 6 shows the proposed distribution of TIF expenditures over the next five years across three categories of investment, each yielding different rates of return:
1. Grants and Infrastructure – no financial return; capped as a portion of the entire URA budget
2. Program Related Investments – Prosper Portland will seek a 2.5 percent rate of return on these activities
3. Mission Related Investments – the agency will seek a 6 percent return on equity left in these investments
With adoption of the Financial Investment Policy, Prosper Portland began limiting grants and infrastructure expenditures of agency-wide urban renewal budgets. Through 2022, up to $87 million or 24 percent of urban renewal resources are programmed to finalize key infrastructure commitments and provide for steady funding of Prosperity Investment Program and Community Livability grants across multiple urban renewal areas. Unspent grants and infrastructure resourc-es could be reallocated to the other category of investment as part of the agency’s annual budget and portfolio review with the community.
This approach maintains the agency’s ability to deliver on commitments articulated with com-munity action plans, unlock private development per development agreements, and support those priorities most in line with the agency’s strategic priorities that cannot occur without grant funds. This level of grant and infrastructure expenditures represents a decrease from trends over the last 10 years but is in line with expenditures over the last five years. Capping the level of grant and infrastructure funding also provides additional certainty regarding the level resources available for Program and Mission Related Investments.
Program Related Investments are assumed primarily in geographies with maturing market conditions and significant public benefit objec-tives. Through 2022, $173 million or 47 percent of the planned resources are allocated to support key community priorities and make an annual 2.5% return. In the near term, Program Related Investments are focused mostly on planned business and commercial lending programs using both TIF and non-TIF funds as well as a portion of resources reserved to implement development projects in Old Town/Chinatown (Downtown Waterfront and River District) and the Innovation Quadrant (Central Eastside and North Macadam).
Mission Related Investments apply to $105
million or 29 percent of planned investment over the next five years. Most of the investment is contained in the following four key Prosper Portland initiatives and projects in geographies currently experiencing robust real estate market conditions:
1. U.S. Postal Service site in the Broadway Corridor area
2. ODOT Blocks in the Central Eastside Industrial District
3. Oregon Convention Center investments, including the Rose Quarter
4. Old Town/Chinatown investments
Investments in these four projects and areas could yield $6.7 million per year alone after stabilization of operating revenues if a six percent return on the amount of TIF invested and the value of the property is achieved (see section 1.c. regarding property equity).
Using a portfolio approach, the agency has the ability to review an annualized rate of return and adjust allocation between—or performance targets within—categories based on changes in market dynamics and strategic priorities while maintaining a blended return target across investments. Within that process, the agency will consider overall performance of the portfolio as well as both short and long-term tradeoffs. For example, with more of Prosper Portland’s equity or investment being provided at low or no rate of return – or even granted – additional affordable space, park space, streets or community space could be funded with TIF. On the other hand, achieving a 6 percent return on these invest-ments could ultimately produce an additional $2.8 million per year on operating revenue that could fund ongoing workforce programming
CAPITAL SPENDING FY 2017-18 TO FY 2021-22
Program related
investments Impact
investments with below
market return (2.5%)
Grants & Infrastructure No Financial
return
Mission related investments
Financial first - market returns
(6%)
FIGURE 6
$173M
$106M
$87M
Prosper Portland Ten Year Financial Sustainability Plan | July 2018 23
service for at least 1,500 participants or program-ming for the Inclusive Business Resource Network to help grow hundreds of small businesses of color by the mid-2020s9.
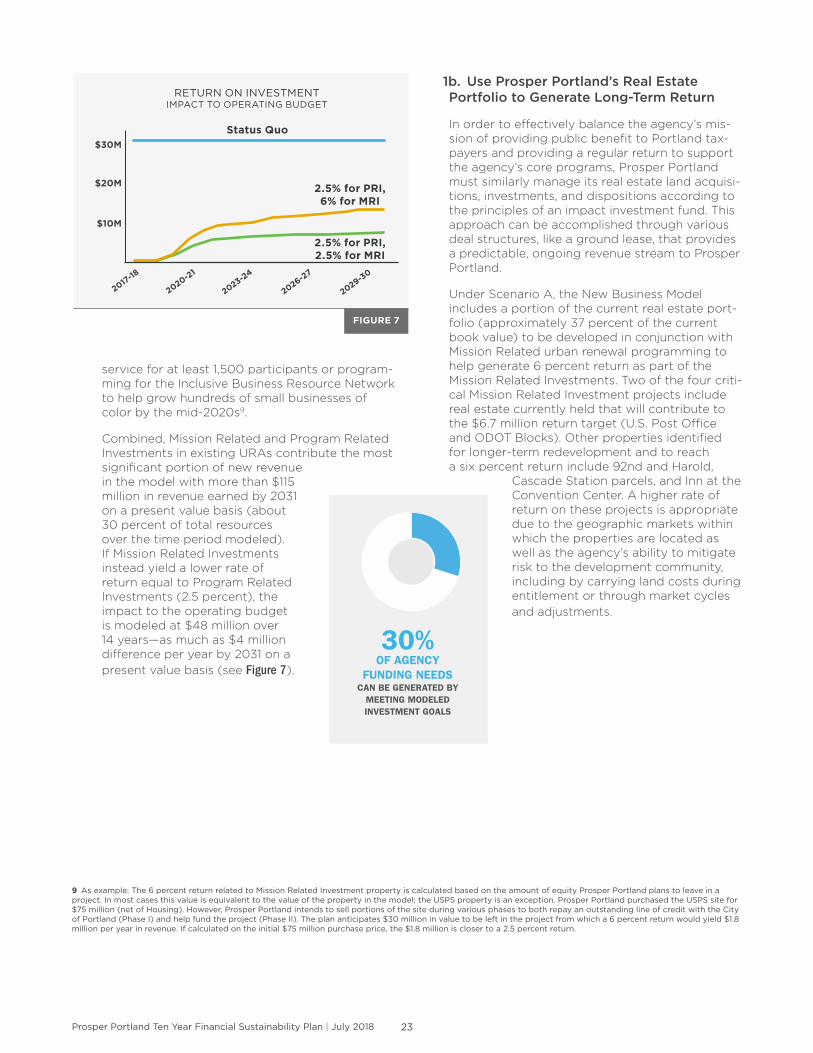
Combined, Mission Related and Program Related Investments in existing URAs contribute the most significant portion of new revenue in the model with more than $115 million in revenue earned by 2031 on a present value basis (about 30 percent of total resources over the time period modeled). If Mission Related Investments instead yield a lower rate of return equal to Program Related Investments (2.5 percent), the impact to the operating budget is modeled at $48 million over 14 years—as much as $4 million difference per year by 2031 on a present value basis (see Figure 7).
9 As example: The 6 percent return related to Mission Related Investment property is calculated based on the amount of equity Prosper Portland plans to leave in a project. In most cases this value is equivalent to the value of the property in the model; the USPS property is an exception. Prosper Portland purchased the USPS site for $75 million (net of Housing). However, Prosper Portland intends to sell portions of the site during various phases to both repay an outstanding line of credit with the City of Portland (Phase I) and help fund the project (Phase II). The plan anticipates $30 million in value to be left in the project from which a 6 percent return would yield $1.8 million per year in revenue. If calculated on the initial $75 million purchase price, the $1.8 million is closer to a 2.5 percent return.
1b. Use Prosper Portland’s Real Estate Portfolio to Generate Long-Term Return
In order to effectively balance the agency’s mis-sion of providing public benefit to Portland tax-payers and providing a regular return to support the agency’s core programs, Prosper Portland must similarly manage its real estate land acquisi-tions, investments, and dispositions according to the principles of an impact investment fund. This approach can be accomplished through various deal structures, like a ground lease, that provides a predictable, ongoing revenue stream to Prosper Portland.
Under Scenario A, the New Business Model includes a portion of the current real estate port-folio (approximately 37 percent of the current book value) to be developed in conjunction with Mission Related urban renewal programming to help generate 6 percent return as part of the Mission Related Investments. Two of the four criti-cal Mission Related Investment projects include real estate currently held that will contribute to the $6.7 million return target (U.S. Post Office and ODOT Blocks). Other properties identified for longer-term redevelopment and to reach a six percent return include 92nd and Harold,
Cascade Station parcels, and Inn at the Convention Center. A higher rate of return on these projects is appropriate due to the geographic markets within which the properties are located as well as the agency’s ability to mitigate risk to the development community, including by carrying land costs during entitlement or through market cycles and adjustments.
FIGURE 7
RETURN ON INVESTMENT IMPACT TO OPERATING BUDGET
$30M
2017-18
2020-21
2023-24
2029-30
2026-27
$20M
$10M
Status Quo
2.5% for PRI, 2.5% for MRI
2.5% for PRI, 6% for MRI
30% OF AGENCY
FUNDING NEEDS CAN BE GENERATED BY
MEETING MODELED INVESTMENT GOALS
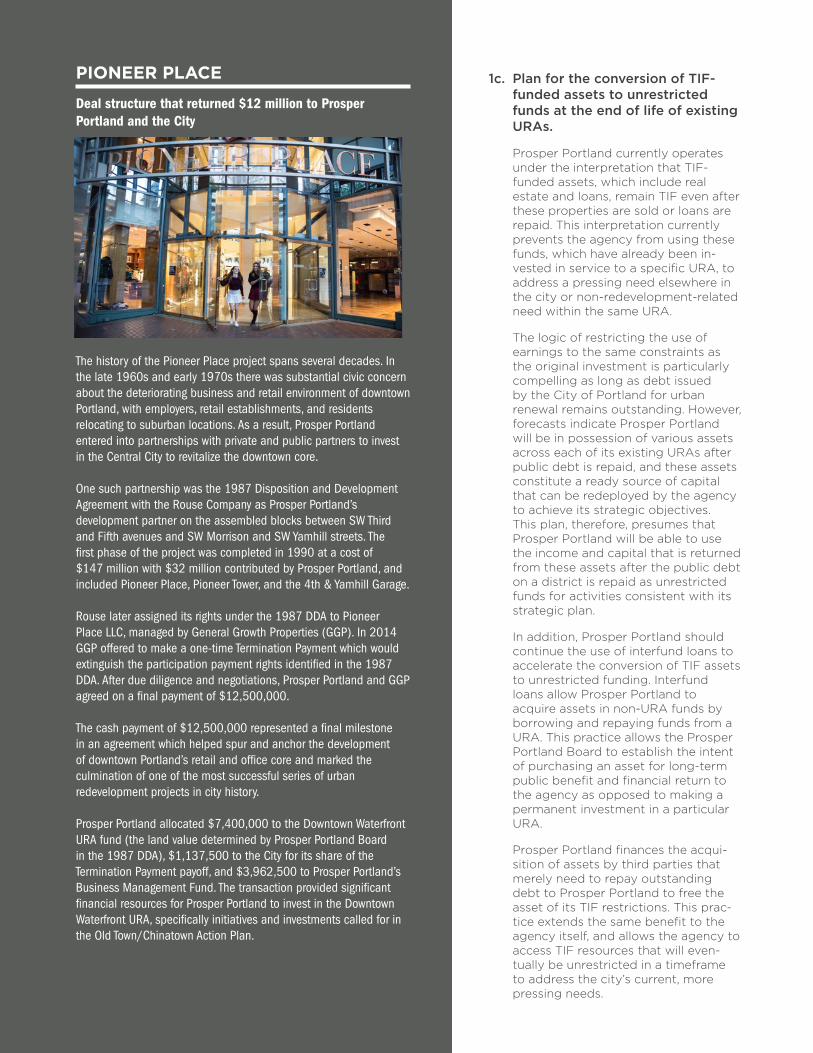
Prosper Portland Ten Year Financial Sustainability Plan | July 2018 24
PIONEER PLACE
Deal structure that returned $12 million to Prosper Portland and the City
The history of the Pioneer Place project spans several decades. In the late 1960s and early 1970s there was substantial civic concern about the deteriorating business and retail environment of downtown Portland, with employers, retail establishments, and residents relocating to suburban locations. As a result, Prosper Portland entered into partnerships with private and public partners to invest in the Central City to revitalize the downtown core.
One such partnership was the 1987 Disposition and Development Agreement with the Rouse Company as Prosper Portland’s development partner on the assembled blocks between SW Third and Fifth avenues and SW Morrison and SW Yamhill streets. The first phase of the project was completed in 1990 at a cost of $147 million with $32 million contributed by Prosper Portland, and included Pioneer Place, Pioneer Tower, and the 4th & Yamhill Garage.
Rouse later assigned its rights under the 1987 DDA to Pioneer Place LLC, managed by General Growth Properties (GGP). In 2014 GGP offered to make a one-time Termination Payment which would extinguish the participation payment rights identified in the 1987 DDA. After due diligence and negotiations, Prosper Portland and GGP agreed on a final payment of $12,500,000.
The cash payment of $12,500,000 represented a final milestone in an agreement which helped spur and anchor the development of downtown Portland’s retail and office core and marked the culmination of one of the most successful series of urban redevelopment projects in city history.
Prosper Portland allocated $7,400,000 to the Downtown Waterfront URA fund (the land value determined by Prosper Portland Board in the 1987 DDA), $1,137,500 to the City for its share of the Termination Payment payoff, and $3,962,500 to Prosper Portland’s Business Management Fund. The transaction provided significant financial resources for Prosper Portland to invest in the Downtown Waterfront URA, specifically initiatives and investments called for in the Old Town/Chinatown Action Plan.
1c. Plan for the conversion of TIF-funded assets to unrestricted funds at the end of life of existing URAs.
Prosper Portland currently operates under the interpretation that TIF-funded assets, which include real estate and loans, remain TIF even after these properties are sold or loans are repaid. This interpretation currently prevents the agency from using these funds, which have already been in-vested in service to a specific URA, to address a pressing need elsewhere in the city or non-redevelopment-related need within the same URA.
The logic of restricting the use of earnings to the same constraints as the original investment is particularly compelling as long as debt issued by the City of Portland for urban renewal remains outstanding. However, forecasts indicate Prosper Portland will be in possession of various assets across each of its existing URAs after public debt is repaid, and these assets constitute a ready source of capital that can be redeployed by the agency to achieve its strategic objectives. This plan, therefore, presumes that Prosper Portland will be able to use the income and capital that is returned from these assets after the public debt on a district is repaid as unrestricted funds for activities consistent with its strategic plan.
In addition, Prosper Portland should continue the use of interfund loans to accelerate the conversion of TIF assets to unrestricted funding. Interfund loans allow Prosper Portland to acquire assets in non-URA funds by borrowing and repaying funds from a URA. This practice allows the Prosper Portland Board to establish the intent of purchasing an asset for long-term public benefit and financial return to the agency as opposed to making a permanent investment in a particular URA.
Prosper Portland finances the acqui-sition of assets by third parties that merely need to repay outstanding debt to Prosper Portland to free the asset of its TIF restrictions. This prac-tice extends the same benefit to the agency itself, and allows the agency to access TIF resources that will even-tually be unrestricted in a timeframe to address the city’s current, more pressing needs.

Prosper Portland Ten Year Financial Sustainability Plan | July 2018 25
2. Secure additional public funding to support economic and community development programs
2a. Identify an additional City funding stream to partially offset the loss of TIF; focus on the impending “boomerang” revenue stream to the City of Portland to provide operational capacity
The expiration of TIF districts and repayment of outstanding bonds will return increasingly significant property tax revenues to the City of Portland. As Figure 8 below highlights, the annual taxes to the City will be roughly $20 million by FY 2024-25, and will grow to more than $45 million in FY 2034-35.
These increasing property tax revenues rep-resent the fulfillment of the promise of urban renewal. These future revenues offer the unique opportunity to increase City support for Prosper Portland without decreasing support for other City bureaus.
Given the uncertainties of the annual appropria-tion process, and the opportunity to tie Prosper
Portland support to a funding stream that reflects the performance of the economy, City Council should consider committing a portion of these recurring revenues to Prosper Portland.
A target of 18 percent of the boomerang funds (net of a reserve for the River District line of credit, estimated compression, discounts and delinquencies) could result in annual funding to Prosper Portland of more than $5 million by 2030 on a present value basis to provide the type of regular programmatic support needed to fund Prosper Portland’s ongoing economic develop-ment work. This represents $32 million in alloca-tion through 2031 on a present value basis that would support eight percent of overall operating resources during this time period. Combined with existing General Fund ongoing funding of $5 million, boomerang funds would provide a solid foundation for Prosper Portland’s economic development work.
$0
$5
$10
$15
$20
$25
$30
$35
$40
$45
$50
FY 2017-18 FY 2021-22 FY 2025-26 FY 2029-30
Mill
ions
Estimated General Fund Taxes Returned from URA Defeasance Nominal Dollars in Millions
ESTIMATED GENERAL FUND TAXES RETURNED FROM URA DEFEASANCE NOMINAL DOLLARS IN MILLIONS
2028-29 North Macadam2027-28
Lents Town
Center
2024-25 DowntownWaterfront,
South Park Blocks, Central Eastside
2023-24 Interstate Corridor
2022-23 River
District2020-21
Airport Way, Neighborhood
Prosperity Network
2025-26 Oregon Convention Center
Prosper Portland $51M
2031-32 Gateway Regional Center
FIGURE 8
Taxes returned
(net of compression
and discounts) $312M Taxes returned
(net of compression and discounts and
River District Reserve) $278M
Prosper Portland Ten Year Financial Sustainability Plan | July 2018 26
2b. Secure new public resources as needs and opportunities arise that align with agency’s core economic and community develop-ment competencies
A number of local, state, and federal sponsored programs and products have strong alignment with the agency’s key Strategic Plan priorities and offer additional opportunities to leverage additional new resources. With the exception of the Portland Community Investment Fund/New Market Tax Credits, these opportunities are not currently included in the revenue model, but can augment resources from real estate, boomerang and new urban renewal areas for both capital and operational purposes:
• The Regionally Significant Industrial Sites Program (RSIS), approved by the Oregon State Legislature in 2013, provides tax reim-bursements for private-public partnerships to cover the cost of development of indus-trial sites. The program identifies industrial sites of regional significance across the state and implements strategic action plans that bring critical infrastructure improvements to the sites that would likely not occur without targeted public assistance. Program assistance is provided via direct loans, loan forgiveness, and tax reimbursements for private-public partnerships in the develop-ment of the site. Once the administrative rules are approved by Business Oregon, Prosper Portland will request the Portland City Council for authorization to serve as the City’s RSIS administrator.
• With recent approval of a 10 percent sales tax on recreational marijuana sold in the City of Portland and subsequent City Council direction, the City’s Recreational Cannabis Sales Tax makes available proceeds that could complement and support Prosper Portland’s small business development and technical assistance services. Prosper Portland is working with the City of Portland to secure a portion of the Cannabis Sales Tax for small business technical assistance for local cannabis businesses owned by underserved populations.
• The PropertyFit program, a Commercial Property Assessed Clean Energy program, provides a property tax-based assessment as collateral to lending on energy efficiency and seismic retrofit projects. A partnership between Multnomah County and Prosper Portland, PropertyFit can use TIF to capital-ize initial projects and is also available and used nationally to attract private capital to real property improvement projects that would not normally meet traditional credit standards.
• Prosper Portland recently established a Community Development Entity (CDE), the Portland Community Investment Fund, for the purpose of accessing highly-competitive federal New Market Tax Credits (NMTCs) that can be used as capital for Prosper Portland projects. While the Portland market has existing CDEs that receive regular allo-cations, none of these entities is focused ex-clusively on the Portland market. A Prosper Portland-sponsored CDE will benefit from an early interface with the Prosper Portland project pipeline. The current model assumes $200 million in NMTC allocation over 14 years, which is estimated to yield $50 million in gap funding for capital projects. Fees from this activity due back to Prosper Portland for operational support provide $7 million over 14 years of activity (about two percent of the operating revenues in the New Business Model).
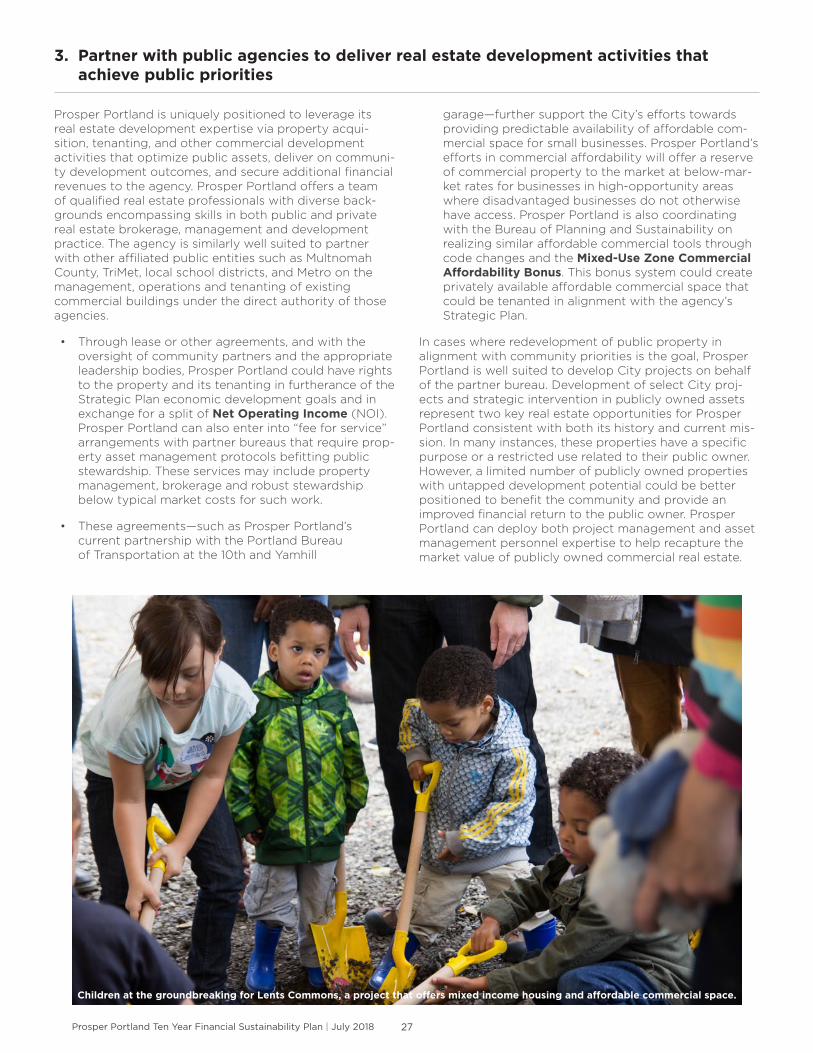
Prosper Portland Ten Year Financial Sustainability Plan | July 2018 27
3. Partner with public agencies to deliver real estate development activities that achieve public priorities
Prosper Portland is uniquely positioned to leverage its real estate development expertise via property acqui-sition, tenanting, and other commercial development activities that optimize public assets, deliver on communi-ty development outcomes, and secure additional financial revenues to the agency. Prosper Portland offers a team of qualified real estate professionals with diverse back-grounds encompassing skills in both public and private real estate brokerage, management and development practice. The agency is similarly well suited to partner with other affiliated public entities such as Multnomah County, TriMet, local school districts, and Metro on the management, operations and tenanting of existing commercial buildings under the direct authority of those agencies.
• Through lease or other agreements, and with the oversight of community partners and the appropriate leadership bodies, Prosper Portland could have rights to the property and its tenanting in furtherance of the Strategic Plan economic development goals and in exchange for a split of Net Operating Income (NOI). Prosper Portland can also enter into “fee for service” arrangements with partner bureaus that require prop-erty asset management protocols befitting public stewardship. These services may include property management, brokerage and robust stewardship below typical market costs for such work.
• These agreements—such as Prosper Portland’s current partnership with the Portland Bureau of Transportation at the 10th and Yamhill
garage—further support the City’s efforts towards providing predictable availability of affordable com-mercial space for small businesses. Prosper Portland’s efforts in commercial affordability will offer a reserve of commercial property to the market at below-mar-ket rates for businesses in high-opportunity areas where disadvantaged businesses do not otherwise have access. Prosper Portland is also coordinating with the Bureau of Planning and Sustainability on realizing similar affordable commercial tools through code changes and the Mixed-Use Zone Commercial Affordability Bonus. This bonus system could create privately available affordable commercial space that could be tenanted in alignment with the agency’s Strategic Plan.
In cases where redevelopment of public property in alignment with community priorities is the goal, Prosper Portland is well suited to develop City projects on behalf of the partner bureau. Development of select City proj-ects and strategic intervention in publicly owned assets represent two key real estate opportunities for Prosper Portland consistent with both its history and current mis-sion. In many instances, these properties have a specific purpose or a restricted use related to their public owner. However, a limited number of publicly owned properties with untapped development potential could be better positioned to benefit the community and provide an improved financial return to the public owner. Prosper Portland can deploy both project management and asset management personnel expertise to help recapture the market value of publicly owned commercial real estate.
Children at the groundbreaking for Lents Commons, a project that offers mixed income housing and affordable commercial space.

Prosper Portland Ten Year Financial Sustainability Plan | July 2018 28
4. Seek additional revenues for capital and operations by leveraging core expertise.
4a. Maximize fee revenue and secure part-nerships that align with agency’s core economic, community and development competencies
Leveraging existing partnerships, organizational strengths and new fee-for-service programs can augment operating resources. Prosper Portland has unmatched professional capacity to assist in economic development, development and asset management efforts to support the goals of local government across agencies.
• Fees for Service. As the City’s urban development agency, Prosper Portland’s knowledge base of how the City operates and how projects get from conception to execution could be monetized. The nature of the partnership that Prosper Portland’s development and asset management teams present to the market can be tailored to the specific projects. Similarly, the opportunity exists to increase fee income across a range of economic de-velopment program areas in which it adds value to stakeholders who might otherwise purchase these services in the open mar-ket. These opportunities include receiving a percentage of new international business obtained by companies assisted through Prosper Portland trade missions, sharing in permit fees obtained through facilitation of projects and fee-generating activities, and fee-based project management services offered to both public and private partners.
• Greater Membership Contributions. In other markets (e.g., World Business Chicago), the cost of operating economic development programs, such as programs that promote entrepreneurship or collab-orative activities among businesses in the same industrial sector, are shared between private and public sector. In Portland, these costs have been largely borne by Prosper Portland in an effort to encourage partici-pation, with some exceptions. In the future, Prosper Portland should test the willing-ness of private sector partners to help underwrite the cost of these programs, including staff time, to validate demand for these services.
4b. Pursue new TIF districts in strategic man-ner to provide capital funding to catalytic public/private projects
While there are statutory and political limits to using TIF, Prosper Portland will continue to explore extending or expanding existing URAs as well as creating new districts to deliver on specific economic development and urban development goals.
Tax increment financing districts remain a commonly used tool around the country to invest in catalytic public and private redevel-opment projects. Unlike the model used in Portland, however, TIF districts in other parts of the country are typically used to fund the public investment in individual projects rather than long-term neighborhood plans. The City will
NEW CAPITAL RESOURCES NOMINAL DOLLARS IN MILLIONS
FIGURE 9
$-
$20.00
$40.00
$60.00
$80.00
$100.00
$120.00
2017-18 2021-22 2025-26 2029-30
Mill
ions
New Capital Resources Nominal Dollars in Millions
Potential NMTC Funding for Projects New TIF (Existing URAs) Potential TIF (new URAs)
$-
$20.00
$40.00
$60.00
$80.00
$100.00
$120.00
Mill
ions
New Capital Resources Net of Housing Set Aside - Nominal Dollars in Millions
Potential NMTC Funding for Projects
New TIF (Existing URAs)
Potential TIF (new URAs)

Prosper Portland Ten Year Financial Sustainability Plan | July 2018 29
need to identify replacement sources of funding for the range of infrastructure projects that have been historically funded by Prosper Portland; but for large scale redevelopment projects with potential to generate significant new tax revenue for the City, TIF and variations of TIF that rely only on revenues to the City of Portland remain effective and appropriate tools.
As existing urban renewal areas expire over the next 10 years the opportunity will arise to create new urban renewal areas or expand existing areas under the 15 percent citywide assessed value and acreage caps. However, due to statutory changes such as revenue sharing, the amount that can be raised for urban renewal activities will be lower than historical urban renewal areas. Also, policy changes such as the Housing Set Aside policy, while raising additional funds for affordable hous-ing projects, further limit the amount of funding that could be raised for economic development programs and projects.
The revenue model in Scenario A includes maximizing available acreage and assessed value under the 15 percent caps over the 14-year period. With conservative assumptions on beginning assessed value per acre, assessed value growth, and maximum indebtedness, the model could annually yield more than $3 million on a present value basis to support operations (the portion of resources going to project staff and grant programs). This represents $26 million or seven percent of overall operating resources and an additional $40 million in potential capital resources (present value basis) during this time period (See Figure 9).
Scenario Outcomes
Under Scenario A, the New Business Model eventually restores Prosper Portland’s average $30 million per year operating budget by 2031 using a combination of boomerang resources, MRI and PRI returns, new URAs, and New Market Tax Credits. Over time, these new resources replace the portion of the operating budget currently funded by tax increment resources—better positioning Prosper Portland to accomplish its Strategic Plan goals. Based on activities and outcomes from programs currently supported by City General Funds, Community Development Block Grant and Enterprise Zone resources, the New Business Model estimate the level of activities and outcomes that could be achieved with future funding.
Under Scenario A, over the next 14 years, the following outcomes could be achieved (see Appendix C for greater detail):
• 13,700 new jobs through Cluster Development and Business Development programs
• $29.4 million in leveraged non-public resources and 402,000 volunteer hours supporting com-munity partners such as current Neighborhood Prosperity Network districts
• More than 17,700 workforce participants, including 12,000 people of color
• Support for 3,000 businesses of color through future funding of the Inclusive Business Resources Network
Risks in the Model
RISKS TO CURRENT RESOURCES IN MODEL
Although the decline of TIF poses a significant challenge, City General Funds, federal Community Development Block Grant, Enterprise Zone, and ded-icated revolving loan funds create the foundation for Prosper Portland’s initiative to create economic oppor-tunity. These resources provide Prosper Portland with flexible, citywide economic development resources that directly fund traded sector business development, small business technical assistance, entrepreneurship, community capacity building, and workforce devel-opment programs that cannot be funded by TIF. Over the life of the 10 Year Financial Sustainability Plan, risks to these non-TIF resources include recession-induced reduction to City General Funds or E- Zone applica-tions, changes to the property tax system, or federal budgetary decisions that would reduce or eliminate Community Development Block Grant funding.
Mayor Ted Wheeler with the team at EQC Home Care Agency, a small business within the Our 42nd Ave. Neighborhood Prosperity Initiative district.

Prosper Portland Ten Year Financial Sustainability Plan | July 2018 30
The operating budget model is dependent on con-servative estimates of current resources including current ongoing General Fund resources, Community Development Block Grant resources and Enterprise Zone resources. Current assumptions and risks to those assumptions include:
• Current General Fund: The model assumes con-stant funding on a nominal basis of $5.5 million per year (resulting in a present value reduction each year). Significant recession or major policy shifts reduce current General Fund ongoing resources.
• Community Development Block Grant: The model assumes funding over the next five years decreas-es by 22 percent. While current legislative draft budgets don’t include this reduction, this critical resource could be significantly reduced by future budget legislation.
• Enterprise Zone: The model assumes decreases in resources over time from future recessions. Major recessions or state legislation could further reduce resources.
RISKS TO NEW RESOURCES IN MODEL
The new business approach modeled under Scenario A includes new urban renewal area investment, a six percent return on Mission Related Investments, 18 percent of the boomerang funds and resources from New Market Tax Credit projects.
Stressed versions of the model illustrate reduced operating budgets and outcomes when components of the model are reduced or eliminated. Scenario B removes boomerang resources and new URA compo-nents as well as recognizing a 2.5% return instead of 6% on Mission Related Investments. As discussed in section 1.a the results shown in Scenario B erode long-term operating resources that can produce annual benefits through higher levels of funding for economic development programs. Without new public resources such as the boomerang funds, Prosper Portland’s operating budget will likely be reduced to half of the current budget, falling from $27.3 million annually to approximately $13.7 million. While specific program choices would need to be prioritized, outcomes relat-ed to the reduced budget would generally also be half of modeled outcomes (See Appendix C for details). Incrementally adding back resources have different impacts in bridging the gap between Scenario A and B. In the final year of the model (2030-31), reaching a 6% return on Mission Related Investments comprises $4.3 million (or 31% of the shortfall) on a present value basis. Boomerang resources totals $5.1 million (or 37%) of the shortfall. New URA operating resources and income from PRI and MRI investments in new URAs make up the balance of the shortfall.
Implementation of Scenario A instead of B depends on many variables. Some of the most critical risks to execution of the New Business Model are as follows:
Internal Risks:
• Failure for Prosper Portland to reach lending targets and general PRI returns as a result of mismatched financial products or other business processes.
• Failure to properly structure MRI projects to yield six percent returns.
• Direction from City Council limiting ability to yield six percent returns on specific projects (e.g., di-recting higher levels of infrastructure investments and reducing funding available for PRI and MRI projects).
• Redirection by City Council of boomerang funds to other City priorities.
• Failure by Prosper Portland to successfully se-cure or assign NMTC allocation to projects being implemented.
External risks
Changes to the Oregon Property Tax system impact-ing the return of boomerang resources.
• Further changes to the Oregon Property Tax system impacting future urban renewal plans.
• Major recession and recovery period impacting ability to reach anticipated MRI and PRI returns, significant constraints on City General Fund and/or reduction in E-Zone projects.
• Elimination or changes to the New Market Tax Credit program as part of federal tax legislation.
Keeping the above risks and opportunities in mind, the following section highlights key bodies of work necessary to implementing the New Business Model.
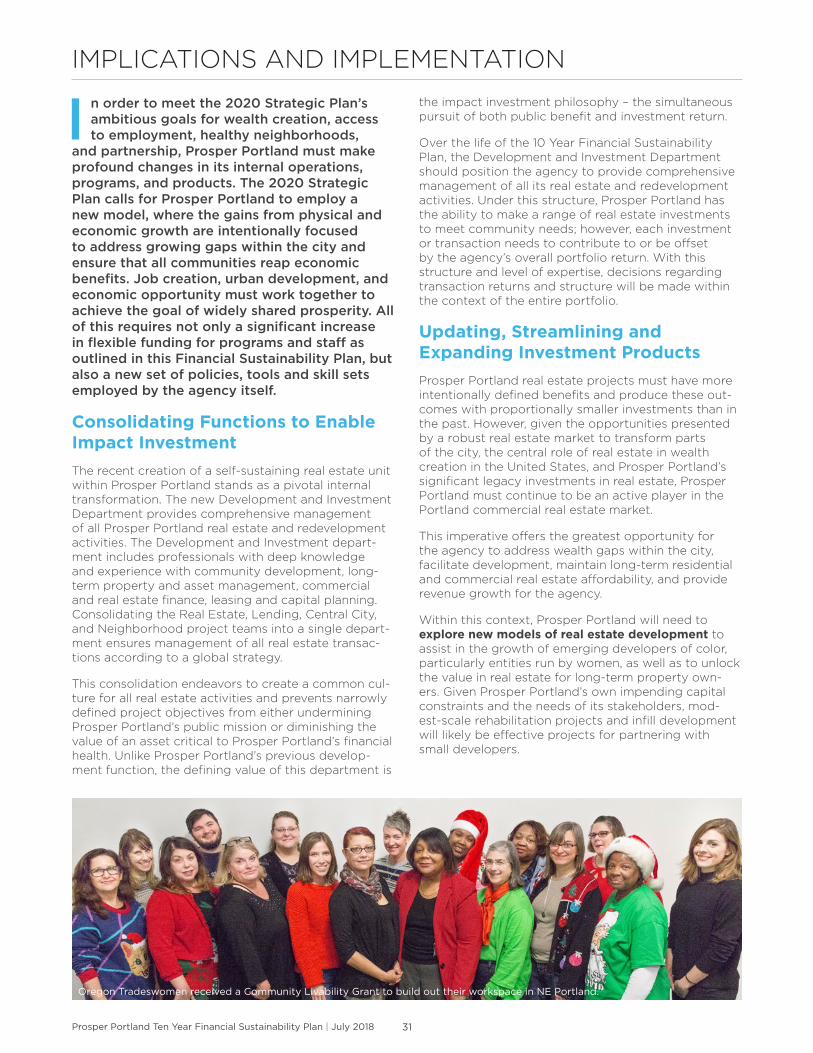
Prosper Portland Ten Year Financial Sustainability Plan | July 2018 31
IMPLICATIONS AND IMPLEMENTATION
I n order to meet the 2020 Strategic Plan’s ambitious goals for wealth creation, access to employment, healthy neighborhoods,
and partnership, Prosper Portland must make profound changes in its internal operations, programs, and products. The 2020 Strategic Plan calls for Prosper Portland to employ a new model, where the gains from physical and economic growth are intentionally focused to address growing gaps within the city and ensure that all communities reap economic benefits. Job creation, urban development, and economic opportunity must work together to achieve the goal of widely shared prosperity. All of this requires not only a significant increase in flexible funding for programs and staff as outlined in this Financial Sustainability Plan, but also a new set of policies, tools and skill sets employed by the agency itself.
Consolidating Functions to Enable Impact InvestmentThe recent creation of a self-sustaining real estate unit within Prosper Portland stands as a pivotal internal transformation. The new Development and Investment Department provides comprehensive management of all Prosper Portland real estate and redevelopment activities. The Development and Investment depart-ment includes professionals with deep knowledge and experience with community development, long-term property and asset management, commercial and real estate finance, leasing and capital planning. Consolidating the Real Estate, Lending, Central City, and Neighborhood project teams into a single depart-ment ensures management of all real estate transac-tions according to a global strategy.
This consolidation endeavors to create a common cul-ture for all real estate activities and prevents narrowly defined project objectives from either undermining Prosper Portland’s public mission or diminishing the value of an asset critical to Prosper Portland’s financial health. Unlike Prosper Portland’s previous develop-ment function, the defining value of this department is
the impact investment philosophy – the simultaneous pursuit of both public benefit and investment return.
Over the life of the 10 Year Financial Sustainability Plan, the Development and Investment Department should position the agency to provide comprehensive management of all its real estate and redevelopment activities. Under this structure, Prosper Portland has the ability to make a range of real estate investments to meet community needs; however, each investment or transaction needs to contribute to or be offset by the agency’s overall portfolio return. With this structure and level of expertise, decisions regarding transaction returns and structure will be made within the context of the entire portfolio.
Updating, Streamlining and Expanding Investment ProductsProsper Portland real estate projects must have more intentionally defined benefits and produce these out-comes with proportionally smaller investments than in the past. However, given the opportunities presented by a robust real estate market to transform parts of the city, the central role of real estate in wealth creation in the United States, and Prosper Portland’s significant legacy investments in real estate, Prosper Portland must continue to be an active player in the Portland commercial real estate market.
This imperative offers the greatest opportunity for the agency to address wealth gaps within the city, facilitate development, maintain long-term residential and commercial real estate affordability, and provide revenue growth for the agency.
Within this context, Prosper Portland will need to explore new models of real estate development to assist in the growth of emerging developers of color, particularly entities run by women, as well as to unlock the value in real estate for long-term property own-ers. Given Prosper Portland’s own impending capital constraints and the needs of its stakeholders, mod-est-scale rehabilitation projects and infill development will likely be effective projects for partnering with small developers.
Oregon Tradeswomen received a Community Livability Grant to build out their workspace in NE Portland.
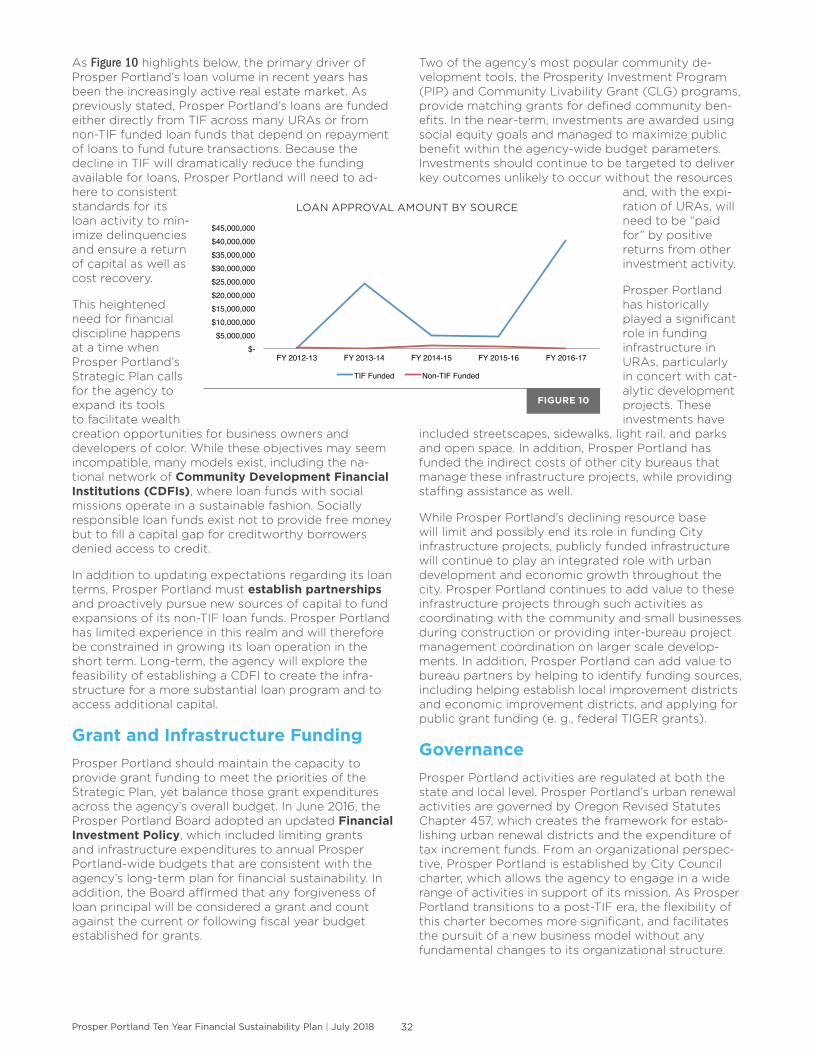
Prosper Portland Ten Year Financial Sustainability Plan | July 2018 32
As Figure 10 highlights below, the primary driver of Prosper Portland’s loan volume in recent years has been the increasingly active real estate market. As previously stated, Prosper Portland’s loans are funded either directly from TIF across many URAs or from non-TIF funded loan funds that depend on repayment of loans to fund future transactions. Because the decline in TIF will dramatically reduce the funding available for loans, Prosper Portland will need to ad-here to consistent standards for its loan activity to min-imize delinquencies and ensure a return of capital as well as cost recovery.
This heightened need for financial discipline happens at a time when Prosper Portland’s Strategic Plan calls for the agency to expand its tools to facilitate wealth creation opportunities for business owners and developers of color. While these objectives may seem incompatible, many models exist, including the na-tional network of Community Development Financial Institutions (CDFIs), where loan funds with social missions operate in a sustainable fashion. Socially responsible loan funds exist not to provide free money but to fill a capital gap for creditworthy borrowers denied access to credit.
In addition to updating expectations regarding its loan terms, Prosper Portland must establish partnerships and proactively pursue new sources of capital to fund expansions of its non-TIF loan funds. Prosper Portland has limited experience in this realm and will therefore be constrained in growing its loan operation in the short term. Long-term, the agency will explore the feasibility of establishing a CDFI to create the infra-structure for a more substantial loan program and to access additional capital.
Grant and Infrastructure FundingProsper Portland should maintain the capacity to provide grant funding to meet the priorities of the Strategic Plan, yet balance those grant expenditures across the agency’s overall budget. In June 2016, the Prosper Portland Board adopted an updated Financial Investment Policy, which included limiting grants and infrastructure expenditures to annual Prosper Portland-wide budgets that are consistent with the agency’s long-term plan for financial sustainability. In addition, the Board affirmed that any forgiveness of loan principal will be considered a grant and count against the current or following fiscal year budget established for grants.
Two of the agency’s most popular community de-velopment tools, the Prosperity Investment Program (PIP) and Community Livability Grant (CLG) programs, provide matching grants for defined community ben-efits. In the near-term, investments are awarded using social equity goals and managed to maximize public benefit within the agency-wide budget parameters. Investments should continue to be targeted to deliver key outcomes unlikely to occur without the resources
and, with the expi-ration of URAs, will need to be “paid for” by positive returns from other investment activity.
Prosper Portland has historically played a significant role in funding infrastructure in URAs, particularly in concert with cat-alytic development projects. These investments have
included streetscapes, sidewalks, light rail, and parks and open space. In addition, Prosper Portland has funded the indirect costs of other city bureaus that manage these infrastructure projects, while providing staffing assistance as well.
While Prosper Portland’s declining resource base will limit and possibly end its role in funding City infrastructure projects, publicly funded infrastructure will continue to play an integrated role with urban development and economic growth throughout the city. Prosper Portland continues to add value to these infrastructure projects through such activities as coordinating with the community and small businesses during construction or providing inter-bureau project management coordination on larger scale develop-ments. In addition, Prosper Portland can add value to bureau partners by helping to identify funding sources, including helping establish local improvement districts and economic improvement districts, and applying for public grant funding (e. g., federal TIGER grants).
GovernanceProsper Portland activities are regulated at both the state and local level. Prosper Portland’s urban renewal activities are governed by Oregon Revised Statutes Chapter 457, which creates the framework for estab-lishing urban renewal districts and the expenditure of tax increment funds. From an organizational perspec-tive, Prosper Portland is established by City Council charter, which allows the agency to engage in a wide range of activities in support of its mission. As Prosper Portland transitions to a post-TIF era, the flexibility of this charter becomes more significant, and facilitates the pursuit of a new business model without any fundamental changes to its organizational structure.
$- $5,000,000
$10,000,000 $15,000,000 $20,000,000 $25,000,000 $30,000,000 $35,000,000 $40,000,000 $45,000,000
FY 2012-13 FY 2013-14 FY 2014-15 FY 2015-16 FY 2016-17
LoanApprovalAmountbySource
TIF Funded Non-TIF Funded
LOAN APPROVAL AMOUNT BY SOURCE
FIGURE 10

Prosper Portland Ten Year Financial Sustainability Plan | July 2018 33
NEW CORPORATE ENTITIES
As with other public agencies in the State of Oregon, Prosper Portland is subject to the constitutional restriction on owning securities in a private company. To address this restriction, in 2013 Prosper Portland es-tablished Portland Economic Investment Corporation (PEIC), an affiliated not-for-profit organization, to al-low the organization to retain limited partner interests in the Portland Seed Fund. PEIC, which is governed by a three-person board, operates independently of Prosper Portland but has a mission similar to Prosper Portland’s and is supported by grants from Prosper Portland. Prosper Portland should expand the use of this entity to facilitate future Prosper Portland activ-ities that require the ownership of private securities or interests in real estate partnerships, but only when ownership on Prosper Portland’s balance sheet is not allowed by law or when loans are not the appropriate structure for Prosper Portland’s investment.
As previously highlighted, Prosper Portland re-cently established a CDE, the Portland Community Investment Fund (PCIF), for the purpose of attracting New Market Tax Credit allocations. PCIF was estab-lished as an Oregon non-profit organization in 2017, controlled by Prosper Portland, with an independent advisory board.
Operations and Staffing
REAL ESTATE DEVELOPMENT AND ASSET MANAGEMENT
Prosper Portland’s real estate assets have the potential to generate meaningful income for the agency and, as such, the agency must take measures necessary to manage the assets toward a return that optimizes both financial and mission goals. Staff will need the skills and experience to effectively steward the portfo-lio to the target return.
For Prosper Portland to make the transition to this model, it should establish its own investment strategy that incorporates the following elements:
• An overall portfolio return target for all real estate holdings and investments that accounts for the return on all projects, not simply the projects with positive returns.
• Investment plans for each property in the portfo-lio, as well as potential acquisitions, that highlight a path to expanded public benefit and long-term financial return to the agency.
• Return targets for each project or investment that allow for variability in return for each investment based on project type and market conditions.
• Updated disposition criteria that reflect the goal of long-term resource generation for the agency.
• A plan for achieving self-sufficient operations; i.e., the real estate operation should cover its own costs and contribute to the annual operating costs of the organization as well.
• Updated deal structure principles that incorporate infrequently used tools such as ground leases that allow Prosper Portland to retain ownership of real estate assets, as well as profit sharing tools to allow for a more balanced distribution of profits between Prosper Portland and its private partners.
• A plan for Prosper Portland to operate as a developer or owner on select projects on either Prosper Portland-owned real estate or other publicly owned real estate.
AGENCY-WIDE STAFFING
Since all scenarios assume Prosper Portland will need to continue to manage real estate investment and provide for asset management, as well as maintain a certain level of administrative functions, the level of new operating resources (boomerang, MRI and PRI resources) largely will determine the level of funding and staffing for economic development programs.
The plan under Scenario A assumes that Prosper Portland remains an organization of similar size and capacity. Given inflationary pressures on personnel and other fixed costs, this assumption results in an increas-ing percentage of Prosper Portland budget devoted to personnel costs, without a significant increase in staff capacity. This will require the agency to become more focused on the key challenges facing the community over the long term as well as through various market cycles. It will also require a staff that is appropriately balanced to deliver on Strategic Plan outcomes while maintaining skill sets and expertise needed to execute on the real estate investment and asset management requirements highlighted by this Plan.
Scenario A, with operating resources reaching the Prosper Portland’s current $30 million per year av-erage operating budget goal reduces staff from the current 86 positions to 75 positions over the next 14 years. Scenario A’s combination of boomerang resources, MRI and PRI returns, new URAs, and New Market Tax Credits maintains Economic Development staffing levels (increase of 1 FTE for a total of 24 FTE) and assumes slight reductions in other departments as the number of medium-to-large scale real estate development projects decline, but the need for ongoing real estate investment and asset management expertise remains.
As demonstrated in Scenario B’s operating budget roughly half of Scenario A, staffing levels will need to be reduced much further. Under Scenario B, positons are reduced from 86 to 46, with substantial reductions in development and administrative positions. However, the greatest reduction would come from economic development positions as a result of not recognizing new operating resources to continue supporting those programs.

AP
PE
ND
ICE
S
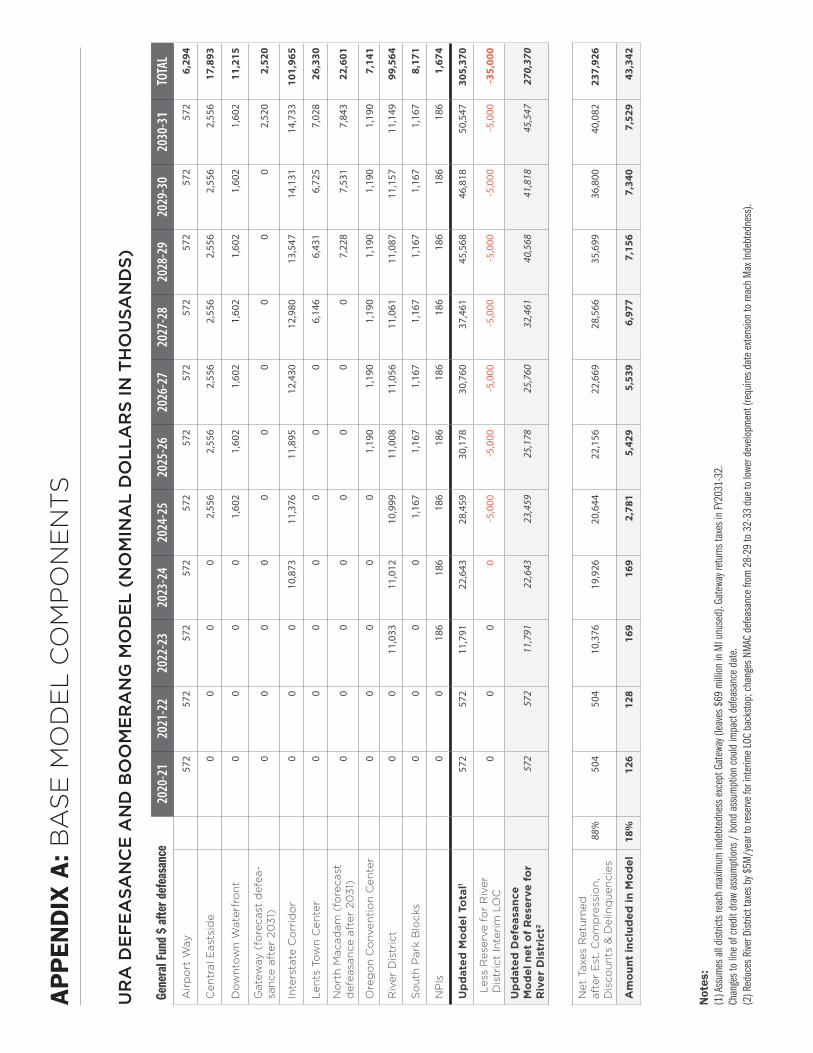
AP
PEN
DIX
A: B
AS
E M
OD
EL
CO
MP
ON
EN
TS
Gene
ral F
und
$ af
ter d
efea
sanc
e 20
20-2
120
21-2
220
22-2
320
23-2
420
24-2
520
25-2
620
26-2
720
27-2
820
28-2
920
29-3
020
30-3
1TO
TAL
Air
po
rt W
ay57
257
257
257
257
257
257
257
257
257
257
26,
294
Cen
tral
Eas
tsid
e0
00
02,
556
2,55
62,
556
2,55
62,
556
2,55
62,
556
17,8
93
Do
wn
tow
n W
ater
fro
nt
00
00
1,60
21,
602
1,60
21,
602
1,60
21,
602
1,60
211
,215
Gat
eway
(fo
reca
st d
efea
-sa
nce
aft
er 2
03
1)0
00
00
00
00
02,
520
2,52
0
Inte
rsta
te C
orr
ido
r0
00
10,8
7311
,376
11,8
9512
,430
12,9
8013
,547
14,1
3114
,733
101,
965
Len
ts T
ow
n C
ente
r0
00
00
00
6,14
66,
431
6,72
57,
028
26,3
30
No
rth
Mac
adam
(fo
reca
st
def
easa
nce
aft
er 2
03
1)0
00
00
00
07,
228
7,53
17,
843
22,6
01
Ore
go
n C
onv
enti
on
Cen
ter
00
00
01,
190
1,19
01,
190
1,19
01,
190
1,19
07,
141
Riv
er D
istr
ict
00
11,0
3311
,012
10,9
9911
,008
11,0
5611
,061
11,0
8711
,157
11,1
4999
,564
So
uth
Par
k B
lock
s0
00
01,
167
1,16
71,
167
1,16
71,
167
1,16
71,
167
8,17
1
NP
Is0
018
618
618
618
618
618
618
618
618
61,
674
Up
dat
ed M
od
el T
ota
l157
257
211
,791
22,6
4328
,459
30,1
7830
,760
37,4
6145
,568
46,8
1850
,547
305,
370
Les
s R
eser
ve f
or
Riv
er
Dis
tric
t In
teri
m L
OC
00
00
-5,0
00-5
,000
-5,0
00-5
,000
-5,0
00-5
,000
-5,0
00-3
5,00
0
Up
dat
ed D
efea
sanc
e M
od
el n
et o
f R
eser
ve f
or
Riv
er D
istr
ict2
572
572
11,7
9122
,643
23,4
5925
,178
25,7
6032
,461
40,5
6841
,818
45,5
4727
0,37
0
Net
Tax
es R
etu
rned
af
ter
Est
. Co
mp
ress
ion
, D
isco
un
ts &
Del
inq
uen
cies
88%
504
504
10,3
7619
,926
20,6
4422
,156
22,6
6928
,566
35,6
9936
,800
40,0
8223
7,92
6
Am
oun
t in
clud
ed in
Mo
del
18%
126
128
169
169
2,78
1 5,
429
5,53
9 6,
977
7,15
6 7,
340
7,52
9 43
,342
Not
es:
(1) A
ssum
es a
ll di
strict
s rea
ch m
axim
um in
debt
edne
ss e
xcep
t Gat
eway
(lea
ves $
69 m
illion
in M
I unu
sed)
. Gat
eway
retu
rns t
axes
in FY
2031
-32.
Ch
ange
s to
line
of c
redi
t dra
w as
sum
ptio
ns /
bon
d as
sum
ptio
n co
uld
impa
ct d
efea
sanc
e da
te.
(2) R
educ
es R
iver D
istric
t tax
es b
y $5M
/yea
r to
rese
rve fo
r int
erim
e LO
C ba
cksto
p; c
hang
es N
MAC
def
easa
nce
from
28-
29 to
32-
33 d
ue to
lowe
r dev
elopm
ent (
requ
ires d
ate
exte
nsio
n to
reac
h M
ax In
debt
edne
ss).
UR
A D
EF
EA
SAN
CE
AN
D B
OO
ME
RA
NG
MO
DE
L (N
OM
INA
L D
OLL
AR
S IN
TH
OU
SAN
DS)

AP
PEN
DIX
A: B
AS
E M
OD
EL
CO
MP
ON
EN
TS
(C
ON
T’D
)
2017
-18
2018
-19
2019
-20
2020
-21
2021
-22
2022
-23
2023
-24
2024
-25
2025
-26
2026
-27
2027
-28
2028
-29
2029
-30
2030
-31
Ou
tsta
nd
ing
Pri
nci
pal
Beg
inn
ing
- C
om
mer
cial
Pro
per
ty $
- $
- $
15,5
91
$28
,439
$
45,0
55
$48
,706
$
49,7
08
$49
,720
$
51,7
79
$54
,208
$
56,5
39
$58
,778
$
60,9
27
$62
,989
A
vera
ge
- C
om
mer
cial
Pro
per
ty -
- 2
2,01
5 3
6,74
7 4
6,88
0 4
9,20
7 4
9,71
4 5
0,74
9 5
2,99
3 5
5,37
3 5
7,65
8 5
9,85
2 6
1,95
8 6
3,98
0 Y
ear
En
d -
Co
mm
erci
al P
rop
erty
16,
955
15,
591
28,
439
45,
055
48,
706
49,
708
49,
720
51,
779
54,
208
56,
539
58,
778
60,
927
62,
989
64,
970
Beg
inn
ing
- B
usi
nes
s -
2,0
21
2,0
26
3,7
87
5,5
47
6,7
56
7,2
91
6,2
49
6,5
57
6,8
20
7,0
46
7,2
39
7,4
05
7,5
47
Ave
rag
e -
Bu
sin
ess
- 2
,023
2
,907
4
,667
6
,152
7
,023
6
,770
6
,403
6
,688
6
,933
7
,142
7
,322
7
,476
7
,608
Y
ear
En
d -
Bu
sin
ess
2,0
21
2,0
26
3,7
87
5,5
47
6,7
56
7,2
91
6,2
49
6,5
57
6,8
20
7,0
46
7,2
39
7,4
05
7,5
47
7,6
69
New
Lo
ans
- C
om
mer
cial
Pro
per
ty 1
6,95
5 1
5,59
1 1
3,47
2 1
7,75
3 5
,453
2
,951
2
,000
4
,048
4
,500
4
,500
4
,500
4
,500
4
,500
4
,500
A
mo
un
t P
er N
ew L
oan
1,5
00
1,5
00
2,0
00
5,0
00
5,0
00
1,5
00
Nu
mb
er N
ew L
oan
s 1
1 8
3
4
4
3
3
3
3
3
3
3
3
3
N
ew L
oan
s -
Bu
sin
ess
2,0
21
2,0
26
2,0
51
2,3
01
2,0
01
1,5
00
- 1
,200
1
,200
1
,200
1
,200
1
,200
1
,200
1
,200
A
mo
un
t P
er N
ew L
oan
120
N
um
ber
New
Lo
ans
17
17
17
19
17
10
10
10
10
10
10
10
10
10
Tota
l New
Lo
ans
18,
975
17,
617
15,
523
20,
054
7,4
54
4,4
51
2,0
00
5,2
48
5,7
00
5,7
00
5,7
00
5,7
00
5,7
00
5,7
00
In
com
eIn
tere
st In
com
e -
Co
mm
erci
al P
rop
erty
2.50
% -
- 5
50
919
1
,172
1
,230
1
,243
1
,269
1
,325
1
,384
1
,441
1
,496
1
,549
1
,599
In
tere
st In
com
e -
Bu
sin
ess
2.50
% -
51
73
117
1
54
176
1
69
160
1
67
173
1
79
183
1
87
190
In
tere
st L
oss
Pro
visi
on
20.0
0% -
(10)
(125
) (2
07)
(265
) (2
81)
(282
) (2
86)
(298
) (3
12)
(324
) (3
36)
(347
) (3
58)
Co
mm
itm
ent
& O
rig
inat
ion
Fee
s1.
00%
190
1
76
155
2
01
75
45
20
52
57
57
57
57
57
57
An
nu
al T
ran
sact
ion
Fee
s0.
10%
0
0
1
2
3
3
4
4
4
4
4
4
4
4
Tota
l Inc
om
e 1
90
217
6
55
1,0
31
1,1
38
1,1
73
1,1
53
1,1
99
1,2
54
1,3
07
1,3
57
1,4
05
1,4
50
1,4
93
Inte
rest
Exp
ense
1.25
% -
- -
- -
- -
% o
f P
rin
cip
al t
o B
orr
ow
0.00
%
Net
Inte
rest
Inco
me
$19
0 $
217
$65
5 $
1,03
1 $
1,13
8 $
1,17
3 $
1,15
3 $
1,19
9 $
1,25
4 $
1,30
7 $
1,35
7 $
1,40
5 $
1,45
0 $
1,49
3
Lo
an R
epay
men
ts -
Co
mm
erci
al P
rop
erty
- -
624
1
,138
1
,802
1
,948
1
,988
1
,989
2
,071
2
,168
2
,262
2
,351
2
,437
2
,520
Te
rm (
year
s) 2
5 L
oan
Rep
aym
ents
- B
usi
nes
s -
- 2
89
541
7
92
965
1
,042
8
93
937
9
74
1,0
07
1,0
34
1,0
58
1,0
78
Term
(ye
ars)
7
Pri
nci
pal
Lo
ss P
rovi
sio
n20
.00%
Lo
ss P
rovi
sio
n -
Co
mm
erci
al P
rop
erty
- -
(125
) (2
28)
(360
) (3
90)
(398
) (3
98)
(414
) (4
34)
(452
) (4
70)
(487
) (5
04)
Lo
ss P
rovi
sio
n -
Bu
sin
ess
- -
(58)
(108
) (1
58)
(193
) (2
08)
(179
) (1
87)
(195
) (2
01)
(207
) (2
12)
(216
)
Net
Pri
ncip
al R
epay
men
ts -
- 7
30
1,3
43
2,0
76
2,3
31
2,4
24
2,3
05
2,4
06
2,5
14
2,6
14
2,7
08
2,7
96
2,8
78
NE
W L
OA
NS
MO
DE
L (N
OM
INA
L D
OLL
AR
S IN
TH
OU
SAN
DS)

2017
-18
2018
-19
2019
-20
2020
-21
2021
-22
2022
-23
2023
-24
2024
-25
2025
-26
2026
-27
2027
-28
2028
-29
2029
-30
2030
-31
NM
TC A
lloca
tio
n (n
on-
cash
) $
- $
- $
- $
30,0
00
$20
,000
$
- $
30,0
00
$20
,000
$
30,0
00
$-
$20
,000
$
30,0
00
$-
$20
,000
B
egin
nin
g C
ash
1
00
435
(3
6) (4
25)
(100
) 9
4 (1
33)
352
7
02
1,3
61
1,3
97
1,8
95
2,5
66
2,5
24
Rev
enu
e -
- -
- -
- -
- -
- -
- -
-
NM
TC P
lace
men
t F
ees
(2%
) -
- -
600
4
00
- 6
00
400
6
00
- 4
00
600
-
400
Su
bsi
dar
y F
ees
(2%
) -
- -
600
4
00
- 6
00
400
6
00
- 4
00
600
-
400
Man
agem
ent
Fee
s (3
.5%
ove
r 8
yea
rs)
- -
- 1
31
219
2
19
350
4
38
569
5
69
656
6
56
569
6
56
Oth
er -
- -
- -
- -
- -
- -
- -
- To
tal C
ash
Rec
eip
ts
- -
- 7
31
619
2
19
950
8
38
1,1
69
569
1
,056
1
,256
5
69
1,0
56
To
tal C
ash
7
90
435
(3
6) 3
06
519
3
12
817
1
,189
1
,871
1
,930
2
,453
3
,151
3
,135
3
,580
Exp
ense
s -
- -
- -
- -
- -
- -
- -
-
Per
son
nel
& B
enefi
ts
285
2
99
314
3
30
346
3
64
382
4
01
421
4
42
464
4
87
512
5
37
In
sura
nce
an
d o
ther
Co
ntr
acts
7
0 1
72
74
76
79
81
84
86
89
91
94
97
100
1
03
Tota
l Exp
ense
s 3
55
471
3
88
406
4
25
445
4
66
487
5
10
533
5
58
584
6
12
640
N
et R
even
ue
(355
) (4
71)
(388
) 3
25
194
(2
26)
484
3
50
659
3
5 4
98
672
(4
3) 4
16
Net
Cas
h
435
(3
6) (4
25)
(100
) 9
4 (1
33)
352
7
02
1,3
61
1,3
97
1,8
95
2,5
66
2,5
24
2,9
40
Cu
mu
lati
ve A
lloca
tio
n$-
$-$-
$30,
000
$50,
000
$50,
000
$80,
000
$100
,000
$130
,000
$130
,000
$150
,000
$180
,000
$180
,000
$200
,000
Bal
ance
aft
er 8
yea
r A
sset
Mg
t P
erio
d0
00
00
00
013
0,00
013
0,00
015
0,00
015
0,00
013
0,00
015
0,00
0
NE
W M
AR
KE
T T
AX
CR
ED
IT M
OD
EL
(NO
MIN
AL
DO
LLA
RS
IN T
HO
USA
ND
S)C
DE
- A
nnua
l Rev
enue
and
Exp
ense
Sum
mar
y
AP
PEN
DIX
A: B
AS
E M
OD
EL
CO
MP
ON
EN
TS
(C
ON
T’D
)

RE
AL
EST
AT
E V
ALU
E A
ND
INV
EST
ME
NTS
(N
OM
INA
L D
OLL
AR
S IN
TH
OU
SAN
DS)
Plan
URA
Parc
el
#Pr
oper
ty
2017
Bo
ok
Valu
e
Amt
Retu
rn
Calc
2017
Op
Re
v
2017
Op
Ex
p20
17
NOI
Targ
et
Retu
rn
Year
Retu
rn
0.06
2017
-1
820
18
-19
2019
-2
020
20
-21
2021
-2
220
22
-23
2023
-2
420
24
-25
2025
-2
620
26
-27
2027
-2
820
28
-29
2029
-3
020
30
-31
Dis
po
se o
r TB
DA
irp
ort
Way
165
Cas
cade
Sta
tion
Parc
el G
3,63
90
026
-26
Co
nven
tio
n C
ente
r92
B&K
Car
Ren
tal S
ite87
60
015
-15
Dow
nto
wn
W
ater
fro
nt
183
One
Wat
erfr
ont S
outh
740
08
-8
256
Old
Tow
n Lo
fts
Park
ing
140
010
55
87SW
RIV
ER D
R &
M
ON
TGO
MER
Y-LO
T296
00
00
Gat
eway
198
106
NE
Hal
sey
2,06
80
00
019
9N
E 10
4th
& W
asco
1,15
30
00
0In
ters
tate
118
Alb
ina
Tria
ngle
60
00
026
4A
rgle
Lot
1,03
40
07
-7Le
nts
1257
28-5
808
SE 9
1st
437
00
00
NA
178
SOU
TH A
UD
ITO
RIU
M-P
ARK
BLK
C0
00
00
185
Boys
and
Girl
s C
lub
Lan
d47
00
00
78C
RNR
COU
PLET
-FST
R F&
W10
00
00
0N
MA
C12
5Ja
smin
e Bl
ock
747
00
00
60Lo
t 335
10
05
-561
Lot 4
1,89
30
09
-9R
iver
Dis
tric
t18
6St
atio
n Pl
ace
Lot 8
00
00
031
64t
h an
d Bu
rnsi
de1,
202
00
19-1
938
Old
Fire
Sta
tion
431
00
224
-224
46O
ne W
ater
fron
t Nor
th12
30
010
-10
509T
H &
NA
ITO
-TRI
AN
GLE
LO
TS38
00
00
Sou
th P
ark
Blo
cks
107
5th
and
Mon
tgom
ery
2,71
30
00
0D
isp
ose
or T
BD
To
tal
17,1
670
1032
7-3
17D
evel
op
or
Ho
ld
Co
nven
tio
n C
ente
r40
Con
vent
ion
Cen
ter H
otel
Gar
age
1,35
40
03
-370
Con
vent
ion
Cen
ter H
otel
Gar
age
1,74
80
00
0D
own
tow
n
Wat
erfr
on
t25
4O
TL C
omm
erci
al80
00
00
0
39U
nion
Sta
tion
632
00
00
Gat
eway
127
Gat
way
Par
k an
d Ri
de L
ot 1
739
00
00
167
Gat
way
Par
k an
d Ri
de L
ot 2
149
00
00
Inte
rsta
te26
1N
elso
n In
dust
rial
1,57
50
164
8480
263
Spar
-Tek
Bui
ldin
g1,
431
074
2450
8036
20 N
E M
LK62
00
18-1
8Le
nts
230
Bake
ry B
lock
2,15
10
166
6898
267
Met
ro A
uto
(Mer
cado
)1,
247
00
18-1
8N
MA
C29
1Ri
verp
lace
Gar
age
4,17
50
307
3627
2R
iver
Dis
tric
t15
3St
atio
n Pl
ace
Gar
age
9,28
20
1,01
837
364
630
451
1 N
W B
road
way
PN
CA
5,80
00
00
039
Uni
on S
tatio
n6,
865
01,
059
979
8074
Bloc
k Y
487
016
849
119
Dev
elo
p/H
old
To
tal
38,4
960
2,95
71,
652
1,30
5D
evel
op
/Ho
ld- 6
% M
RI R
tn T
arg
etA
irp
ort
Way
163
Cas
cade
Sta
tion
Parc
el D
2,31
64,
373
00
029
-30
262
00
00
00
00
00
00
262
262
164
Cas
cade
Sta
tion
Parc
el E
3,05
75,
569
00
029
-30
334
00
00
00
00
00
00
334
334
Bu
sin
ess
Mg
t Fu
nd
308
Post
Offi
ce70
,201
30,0
000
00
24-2
51,
800
00
00
00
01,
800
1,80
01,
800
1,80
01,
800
1,80
01,
800
Cen
tral
Eas
tsid
e31
7O
DO
T Bl
ocks
2,84
55,
114
063
-63
21-2
230
70
00
030
730
730
730
730
730
730
730
730
730
751
240
NE
MLK
BLV
D15
215
20
00
18-1
99
09
99
99
99
99
99
99
WIP
CLI
NTO
N S
T TR
IAN
GLE
570
00
00
00
00
00
00
00
00
00
Co
nven
tio
n C
ente
r10
Met
ro P
ark
(Siz
zler
)2,
784
6,00
00
00
21-2
236
00
00
036
036
036
036
036
036
036
036
036
036
013
591
0 N
E M
LK1,
920
2,75
00
29-2
921
-22
165
00
00
165
165
165
165
165
165
165
165
165
165
77In
n at
Con
vent
ion
Cen
ter
3,90
02,
081
2,61
72,
328
289
21-2
212
50
00
012
512
512
512
512
512
512
512
512
512
5
Len
ts18
5Le
nts
Litt
le L
eagu
e (9
2nd
and
Har
old)
1,25
27,
660
011
-10
20-2
146
00
00
460
460
460
460
460
460
460
460
460
460
460
213
Arc
hite
ctur
al Ir
on63
01,
309
014
-14
20-2
179
00
079
7979
7979
7979
7979
7979
229
Arc
hite
ctur
al Ir
on12
10
00
020
-21
00
00
00
00
00
00
00
0R
iver
Dis
tric
t30
8Po
st O
ffice
4,20
30
028
-28
00
00
00
00
00
00
00
036
Cen
tenn
ial M
ills
2,65
02,
650
059
-59
30-3
115
90
00
00
00
00
00
00
159
47Bl
ock
R72
8,39
646
165
-119
21-2
250
40
00
050
450
450
450
450
450
450
450
450
450
4D
evel
op
/Ho
ld-6
% T
ota
l96
,160
02,
662
2,69
7-3
40
99
547
2,00
82,
008
2,00
83,
808
3,80
83,
808
3,80
83,
808
4,40
44,
563
Gra
nd
To
tal
151,
824
05,
629
4,67
695
3
AP
PEN
DIX
A: B
AS
E M
OD
EL
CO
MP
ON
EN
TS
(C
ON
T’D
)

PLA
NN
ED
BU
DG
ET
ED
INV
EST
ME
NTS
(N
OM
INA
L D
OLL
AR
S IN
TH
OU
SAN
DS)
Inve
stm
ent C
ateg
ory
Fund
Proj
ect
Proj
ect N
ame
2017
-18
2018
-19
2019
-20
2020
-21
2021
-22
2022
-23
2023
-24
2024
-25
2025
-26
2026
-27
Infr
astr
uct
ure
/Gra
nt
310
A0
00
92
Nei
gh
bo
rho
od
Pro
sper
ity-
42A
V
200
5050
5012
00
00
0A
00
48
4N
PI S
har
e-4
2AV
9090
9090
9090
00
00
311
A0
00
93
Nei
gh
bo
rho
od
Pro
sper
ity-
CL
BV
10
010
075
7575
170
00
00
A0
04
86
NP
I Sh
are-
CL
BV
7575
100
100
100
50
00
03
12A
00
09
4N
eig
hb
orh
oo
d P
rosp
erit
y-P
KR
S
7510
010
010
010
010
00
00
0A
00
48
7N
PI S
har
e-P
KR
S50
7550
100
100
100
00
00
313
A0
00
95
Nei
gh
bo
rho
od
Pro
sper
ity-
RS
WD
75
7510
075
759
00
00
A0
04
88
NP
I Sh
are-
RS
WD
6060
7510
010
043
00
00
314
A0
00
96
Nei
gh
bo
rho
od
Pro
sper
ity-
DV
M
100
100
100
100
100
470
00
0A
00
48
9N
PI S
har
e-D
VM
7575
7510
010
030
00
00
315
A0
00
97
Nei
gh
bo
rho
od
Pro
sper
ity-
82D
V
200
8080
8080
800
00
0A
00
49
0N
PI S
har
e-8
2DV
4040
6575
7540
00
00
320
A0
03
89
CLG
-Gen
eral
-D
TW
200
100
100
100
00
00
00
A0
04
95
Pro
sper
ity
Inve
stm
ent
Pro
gra
m (
PIP
) G
ran
t-D
TW
200
300
300
300
00
00
00
325
A0
023
1B
on
d A
ven
ue-
NM
C
2,83
43,
650
00
00
00
00
A0
026
8E
co D
istr
ict-
NM
C
33
00
00
00
00
A0
051
0D
istr
ict
Par
tner
Gre
enw
ay-N
MC
990
100
8,15
03,
475
050
0029
,854
00
A0
051
9Ja
smin
e B
lock
-NM
C3,
637
00
00
00
00
03
30
A0
023
3U
nio
n S
tati
on
Gra
nt-
RV
D
09,
500
00
00
00
00
A0
028
4M
ult
no
mah
Co
un
ty-R
VD
728
2,09
557
00
00
00
00
A0
039
0C
LG-G
ener
al-R
VD
260
100
100
100
00
00
00
A0
04
83
Un
ion
Sta
tio
n G
ran
t-R
VD
2,
123
200
00
00
00
00
A0
04
97
Pro
sper
ity
Inve
stm
ent
Pro
gra
m (
PIP
) G
ran
t-R
VD
290
450
450
450
450
00
00
03
46
A0
029
6C
arp
oo
l Lo
t-S
PB
4,60
00
00
00
00
00
A0
04
98
Pro
sper
ity
Inve
stm
ent
Pro
gra
m (
PIP
) G
ran
t-S
PB
150
5050
5050
00
00
035
0A
00
298
Eco
Dis
tric
t-C
NV
3
30
00
00
00
0A
00
521
Su
lliva
n's
Cro
ssin
g B
rid
ge-
CN
V0
1,00
01,
000
00
00
00
035
5A
00
236
Lig
htw
ater
Cra
ft-C
ES
15
10
00
00
00
00
A0
04
21Tr
ans.
Imp
rovm
ents
-CE
S2,
000
2,50
01,
000
500
00
00
00
A0
04
25C
om
mu
nit
y C
ente
r-C
ES
00
985
00
00
00
0A
00
500
Pro
sper
ity
Inve
stm
ent
Pro
gra
m (
PIP
) G
ran
t-C
ES
425
425
425
425
425
00
00
0A
00
520
CLG
-Gen
eral
-CE
S12
512
512
512
512
50
00
00
36
0A
00
130
CLG
-Gen
eral
-LTC
25
025
025
025
025
025
90
00
0A
00
240
Lea
ch B
ota
nic
al G
rdn
s-LT
C
1,26
163
00
00
00
00
0A
00
243
Fo
ster
-52n
d t
o 8
2nd
-LTC
72
772
70
00
00
00
0A
00
501
Pro
sper
ity
Inve
stm
ent
Pro
gra
m (
PIP
) G
ran
t-LT
C87
587
587
587
587
597
40
00
037
0A
00
106
NP
I & M
ain
St
Net
wo
rk-I
SC
75
5050
5025
00
00
0A
00
131
CLG
-Gen
eral
-IS
C
640
500
500
500
500
00
00
0A
00
249
Kill
ing
swo
rth
Sts
cap
e-IS
C
791
00
00
00
00
0A
00
250
Lo
mb
ard
Inve
stm
ent-
ISC
0
1,00
00
00
00
00
0A
00
502
Pro
sper
ity
Inve
stm
ent
Pro
gra
m (
PIP
) G
ran
t-IS
C2,
332
1,20
01,
200
1,20
050
00
00
00
A0
051
5M
LK
Her
itag
e M
arke
rs-I
SC
250
00
00
00
00
03
80
A0
013
2C
LG-G
ener
al-G
TW
20
020
020
020
038
10
00
00
A0
015
2C
om
mer
ical
Dis
t P
ilot-
GT
W
250
00
00
00
00
0A
00
251
GT
W S
tree
t Im
pro
vem
ent-
GT
W0
1,86
70
00
00
00
0A
00
252
Gat
eway
Par
k P
roje
ct-G
TW
1,
200
00
00
00
00
0A
00
503
Pro
sper
ity
Inve
stm
ent
Pro
gra
m (
PIP
) G
ran
t-G
TW
350
350
350
350
659
00
00
04
70A
00
44
8N
PI O
pp
ort
un
ity
182
250
00
00
00
00
520
A0
035
5P
O R
elo
c S
vc A
gre
emen
t-B
MG
T
2,58
71,
587
252
252
252
252
00
00
Infr
astr
uctu
re/G
rant
To
tal
30,9
3730
,907
9,84
214
,922
8,97
42,
200
5,00
029
,854
00
AP
PEN
DIX
A: B
AS
E M
OD
EL
CO
MP
ON
EN
TS
(C
ON
T’D
)

Inve
stm
ent C
ateg
ory
Fund
Proj
ect
Proj
ect N
ame
2017
-18
2018
-19
2019
-20
2020
-21
2021
-22
2022
-23
2023
-24
2024
-25
2025
-26
2026
-27
Mis
sio
n R
elat
ed
Inve
stm
ents
320
A0
00
83
OT/
CT
Act
ion
Pla
n-D
TW
65
650
00
00
00
0
A0
010
8B
usi
nes
s D
evel
op
men
t-D
TW
10
00
00
00
00
0A
00
522
OT/
CT
Inve
stm
ent
& P
arki
ng
-DT
W0
14,5
260
00
01,
377
00
03
25A
00
273
Riv
erP
lace
Prk
ng
-N
MC
5
00
00
00
00
03
30
A0
00
84
OT/
CT
Act
ion
Pla
n-R
VD
65
650
00
01,
686
1,68
61,
686
23,0
37A
00
110
Bu
sin
ess
Dev
elo
pm
ent-
RV
D
5050
00
00
00
00
A0
027
6P
ost
Offi
ce-R
VD
0
7,00
011
,000
9,50
00
00
00
0A
00
279
Bro
adw
ay C
orr
ido
r-R
VD
19
10
00
00
00
00
A0
029
0S
tati
on
Pla
ce P
rkn
g-R
VD
20
020
020
020
020
020
00
00
03
46
A0
020
5B
L -
Gen
eral
-SP
B
287
600
00
00
00
00
350
A0
03
09
Inn
at
Co
nv C
tr M
gm
t-C
NV
0
00
561
561
561
00
00
A0
03
10B
lock
49
-CN
V
2,00
050
080
064
064
048
00
00
0A
00
311
Pro
ject
Dev
elo
pm
ent-
CN
V
55
55
55
00
00
A0
03
12R
eal E
stat
e M
gm
t-C
NV
15
,725
15,9
580
00
00
00
0A
00
437
Ho
tel G
arag
e-C
NV
1,50
04,
899
3,40
02,
200
2,00
080
01,
063
00
035
5A
00
314
Str
ateg
ic S
ite
Red
ev-C
ES
0
2525
00
00
00
03
85
A0
03
49
Cas
cad
e S
tati
on
-AP
W
162
530
530
3030
300
00
0A
00
350
Cas
cad
e S
tn-P
rcl G
-AP
W
1615
1515
1515
00
00
A0
035
1C
asca
de
Sta
tio
n-P
rcl K
-AP
W15
00
00
00
7,76
30
039
0A
00
06
3C
lust
er D
evel
op
men
t-W
LI
2020
200
00
00
00
A0
011
7B
usi
nes
s D
evel
op
men
t-W
LI
2020
200
00
00
00
A0
035
4P
roje
ct D
evel
op
men
t-W
LI
2020
200
00
3,80
90
00
Mis
sio
n R
elat
ed
Inve
stm
ents
To
tal
20,3
5544
,498
16,0
3513
,151
3,45
12,
091
7,93
59,
449
1,68
623
,037
PLA
NN
ED
BU
DG
ET
ED
INV
EST
ME
NTS
(N
OM
INA
L D
OLL
AR
S IN
TH
OU
SAN
DS)

PLA
NN
ED
BU
DG
ET
ED
INV
EST
ME
NTS
(N
OM
INA
L D
OLL
AR
S IN
TH
OU
SAN
DS)
Inve
stm
ent C
ateg
ory
Fund
Proj
ect
Proj
ect N
ame
2017
-18
2018
-19
2019
-20
2020
-21
2021
-22
2022
-23
2023
-24
2024
-25
2025
-26
2026
-27
Pro
gra
m R
elat
ed
Inve
stm
ents
101
A0
057
1B
row
nfi
eld
Pro
gra
m A
dm
in0
150
00
00
00
00
320
A0
020
2B
L -
Gen
eral
-DT
W
100
100
100
100
00
00
00
A0
025
8O
ld T
ow
n L
oft
s-A
ccel
4
44
44
40
00
0A
00
261
Blo
ck 8
- L
-DT
W
600
00
00
00
00
0A
00
359
CP
RL-
Gen
eral
-DT
W
00
1,06
94,
300
00
00
00
A0
052
2O
T/C
T In
vest
men
t &
Par
kin
g-D
TW
1,00
014
,526
00
00
00
00
325
A0
026
7L
inco
ln S
tati
on
-NM
C
2,00
03,
840
00
00
00
00
A0
027
0N
Dis
tr P
artn
ersh
p-N
MC
2,
500
00
00
00
00
0A
00
36
0C
PR
L-G
ener
al-N
MC
50
050
050
00
00
2,00
04,
048
00
A0
053
3U
niv
ersi
ty P
lace
-NM
C0
600
4,50
04,
500
00
00
00
33
0A
00
280
10th
& Y
amh
ill R
edev
-RV
D
2,00
03,
000
00
00
00
00
A0
027
6P
ost
Offi
ce-R
VD
16
70
00
00
00
00
A0
028
6U
nio
n S
tati
on
-RV
D
253
00
00
00
00
0A
00
288
Cen
ten
nia
l Mill
s-R
VD
46
250
00
00
00
00
A0
028
9S
tati
on
Pla
ce L
ot
5-R
VD
65
50
00
00
00
00
A0
029
3O
ld F
ire
Sta
tio
n M
gm
t-R
VD
54
80
00
00
00
00
A0
051
7O
T/C
T In
vest
men
t &
Par
kin
g-R
VD
1,00
07,
000
15,6
760
00
00
00
34
6A
00
297
Pro
ject
Dev
elo
pm
ent-
SP
B
080
080
080
080
080
00
00
035
0A
00
206
BL
-G
ener
al-C
NV
11
015
015
015
015
015
00
00
0A
00
30
1B
lock
47-
CN
V
40
00
00
00
00
A0
03
03
Ro
se Q
tr M
aste
r P
lan
-CN
V
025
050
01,
000
1,00
01,
000
00
00
A0
03
06
910
NE
ML
K B
uild
ing
-CN
V
30
00
00
00
00
A0
03
11P
roje
ct D
evel
op
men
t-C
NV
0
01,
700
1,36
01,
360
1,02
00
00
0A
00
36
3C
PR
L-G
ener
al-C
NV
50
050
050
050
050
050
00
00
035
5A
00
207
BL
-G
ener
al-C
ES
30
030
030
030
030
030
00
00
0A
00
36
4C
PR
L-G
ener
al-C
ES
60
160
160
160
160
160
10
00
03
60
A0
011
3B
usi
nes
s D
evel
op
men
t-LT
C
2020
2020
200
00
00
A0
012
1C
om
mu
nit
y D
evel
op
men
t-LT
C
5050
5050
500
00
00
A0
020
8B
L -
Gen
eral
-LTC
70
070
070
030
030
00
00
00
A0
03
26B
aker
y B
lock
-LTC
42
00
00
00
00
0A
00
329
Met
roA
uto
Bld
g &
Lo
t-LT
C
200
00
00
00
00
A0
03
30
Arc
htc
tIro
nP
rdct
Bld
g-L
TC
00
00
00
00
00
A0
03
31
Pro
ject
Dev
elo
pm
ent-
LTC
90
1,65
01,
650
1,65
01,
650
00
00
0A
00
36
5C
PR
L-G
ener
al-L
TC
13,0
047,
303
6,00
16,
001
1,00
10
00
00
A0
03
80
Lea
n M
anu
fact
uri
ng
-LTC
30
3030
3030
00
00
0A
00
548
Len
ts S
tab
iliza
tio
n/I
nd
ust
rial
Dev
-LTC
600
00
00
00
00
370
A0
012
2C
om
mu
nit
y D
evel
op
men
t-IS
C
210
200
200
200
200
00
00
0A
00
33
3M
LK
Alb
erta
-IS
C
363
412
00
00
00
00
A0
03
35N
elso
n B
ldg
-In
du
st-I
SC
54
00
00
00
00
00
A0
03
36
Sp
ar-T
ek B
uild
ing
-IS
C
40
00
00
00
00
A0
03
42
Rea
l Est
ate
Mg
mt-
ISC
5
55
55
00
00
0A
00
36
6C
PR
L-G
ener
al-I
SC
1,
000
3,43
51,
950
3,50
01,
300
1,30
00
00
0A
00
527
CP
RL-
PIP
Mat
ch-I
SC
1,35
01,
350
1,35
01,
350
550
550
00
00
38
0A
00
115
Bu
sin
ess
Dev
elo
pm
ent-
GT
W
2020
2020
200
00
00
A0
012
3C
om
mu
nit
y D
evel
op
men
t-G
TW
20
2020
2020
00
00
0A
00
210
BL
-G
ener
al-G
TW
30
030
030
020
020
00
00
00
A0
03
46
Pro
ject
Dev
elo
pm
ent-
GT
W
150
100
100
100
100
01,
842
11,0
003,
342
0A
00
36
7C
PR
L-G
ener
al-G
TW
0
1,90
21,
502
1,50
21,
502
00
00
0A
00
38
2L
ean
Man
ufa
ctu
rin
g-G
TW
10
1010
1010
00
00
0A
00
526
Hal
sey
106
CP
RL-
GT
W0
6,83
30
00
00
00
03
85
A0
021
1B
L -
Gen
eral
-AP
W0
200
020
00
00
00
0A
00
38
3L
ean
Man
ufa
ctu
rin
g-A
PW
55
3030
00
00
00
039
0A
00
212
BL
-G
ener
al-W
LI
5050
500
00
00
00
410
A0
021
7S
BL
F-G
ener
al-S
BL
60
7515
035
035
035
00
00
04
63
A0
021
3B
DL
F-G
ener
al-B
DL
50
100
200
500
500
500
00
00
46
7A
00
218
Wo
rkin
g C
apit
al-W
CF
35
050
100
200
200
200
00
00
520
A0
052
810
th &
Yam
hill
-BM
GT
033
00
00
00
00
0P
rog
ram
Rel
ated
Inve
stm
ents
To
tal
31,4
4657
,746
40,8
3829
,823
12,7
237,
275
3,84
215
,048
3,34
20
Gra
nd T
ota
l82
,737
133,
151
66,7
1557
,896
25,1
4811
,566
16,7
7754
,350
5,02
823
,037
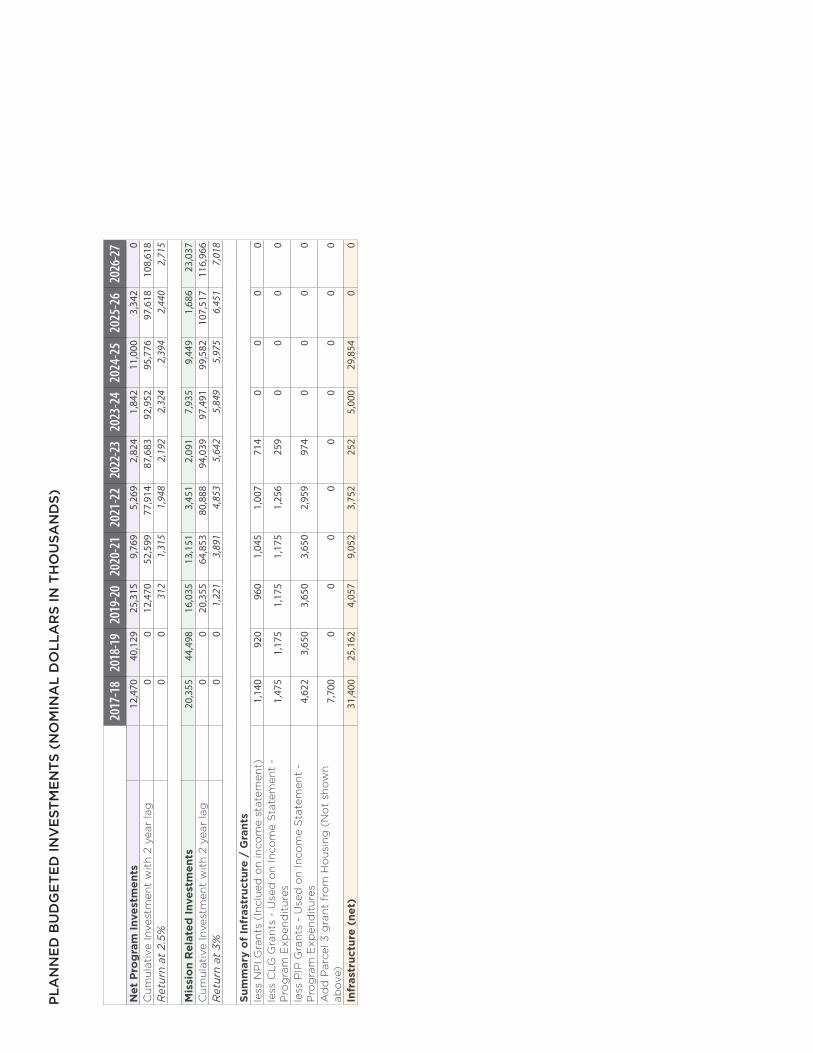
2017
-18
2018
-19
2019
-20
2020
-21
2021
-22
2022
-23
2023
-24
2024
-25
2025
-26
2026
-27
Net
Pro
gra
m In
vest
men
ts12
,470
40,1
2925
,315
9,76
95,
269
2,82
41,
842
11,0
003,
342
0C
um
ula
tive
Inve
stm
ent
wit
h 2
yea
r la
g0
012
,470
52,5
9977
,914
87,6
8392
,952
95,7
7697
,618
108,
618
Ret
urn
at 2
.5%
00
312
1,31
51,
948
2,19
22,
324
2,39
42,
440
2,71
5
Mis
sio
n R
elat
ed In
vest
men
ts20
,355
44,4
9816
,035
13,1
513,
451
2,09
17,
935
9,44
91,
686
23,0
37C
um
ula
tive
Inve
stm
ent
wit
h 2
yea
r la
g0
020
,355
64,8
5380
,888
94,0
3997
,491
99,5
8210
7,51
711
6,96
6R
etur
n at
3%
00
1,22
13,
891
4,85
35,
642
5,84
95,
975
6,45
17,
018
Sum
mar
y o
f In
fras
truc
ture
/ G
rant
sle
ss N
PI G
ran
ts (
Incl
ued
on
inco
me
stat
emen
t)1,
140
920
960
1,04
51,
007
714
00
00
less
CLG
Gra
nts
- U
sed
on
Inco
me
Sta
tem
ent
- P
rog
ram
Exp
end
itu
res
1,47
51,
175
1,17
51,
175
1,25
625
90
00
0
less
PIP
Gra
nts
- U
sed
on
Inco
me
Sta
tem
ent
- P
rog
ram
Exp
end
itu
res
4,62
23,
650
3,65
03,
650
2,95
997
40
00
0
Ad
d P
arce
l 3 g
ran
t fr
om
Ho
usi
ng
(N
ot
sho
wn
ab
ove
)7,
700
00
00
00
00
0
Infr
astr
uctu
re (
net)
31,4
0025
,162
4,05
79,
052
3,75
225
25,
000
29,8
540
0
PLA
NN
ED
BU
DG
ET
ED
INV
EST
ME
NTS
(N
OM
INA
L D
OLL
AR
S IN
TH
OU
SAN
DS)
AP
PEN
DIX
B: F
IVE
YE
AR
ME
TR
ICS
JOB
S C
RE
ATE
DC
ON
STR
UC
TIO
N J
OB
S
15,
391
10
,213
Sp
on
sore
d P
roje
cts
Job
s C
reat
ed
99
6
Co
nst
ruct
ion
Jo
bs
6,6
60
Ezo
ne
No
n C
lust
er J
ob
s C
reat
ed
59
4
Co
nst
ruct
ion
Jo
bs
3,5
53
Trad
ed S
ecto
r
Rec
ruit
men
t/E
xpan
sio
n
2,0
59
Clu
ster
Jo
bs
Cre
ated
via
Ezo
ne
1,7
59
Clu
ster
Gro
wth
Jo
bs
7,4
72
PE
IC
Job
s C
reat
ed
372
NP
I/M
S
Job
s C
reat
ed
439
Lo
ans
and
Gra
nts
Job
s C
reat
ed
1,16
9
WF
Nav
igat
or
Job
s C
reat
ed
41
Sm
all B
iz
Job
s C
reat
ed
49
0
Sp
on
sore
d P
roje
cts
Tota
l Sp
end
123
,428
,656
Tota
l Pro
ject
89
8,17
2,6
14
Lev
erag
e 7
JOB
S A
ND
LE
VE
RA
GE
2011
-12
2012
-13
2013
-14
2014
-15
2015
-16
Spo
nso
red
Pro
ject
s
Co
nst
ruct
ion
Sp
end
23,
168,
600
232
,087
,673
2
5,95
1,77
4 3
50,2
11,9
84
176
,050
,114
Co
nst
ruct
ion
Jo
bs
164
1
,644
1
83
2,4
80
1,2
47
Job
s C
reat
ed21
619
570
725
N/A
Lev
erag
e7
DM
WE
SB
wh
en E
P a
pp
lies,
co
nst
ruct
ion
co
mp
lete
d19
.1%
/$53
,011
,975
Wo
rkfo
rce
26%
min
orit
y (6
06,4
82 h
ours
), 8%
fem
ale
(174
,448
)
Inco
me
Res
tric
ted
Un
its
217
Set
Asi
de
Co
nst
ruct
ion
Sp
end
259,
665,
792
Co
nst
ruct
ion
Jo
bs
1,46
7
Job
s C
reat
edN
/A
Lev
erag
e 4
/7
DM
WE
SB
26%
/$66
,632
,031
Wo
rkfo
rce
N/A
Aff
ord
able
Un
its
1,98
6
IGA
s
Co
nst
ruct
ion
Sp
end
$21,
356,
600
Co
nst
ruct
ion
Jo
bs
116
Job
s C
reat
edN
/A
Lev
erag
e2
1/2
DM
WE
SB
63%
/$13
,543
,095
Wo
rkfo
rce
N/A
Aff
ord
able
Un
its
N/A
RE
DE
VE
LOP
ME
NT
AP
PEN
DIX
B: F
IVE
YE
AR
ME
TR
ICS
(C
ON
T’D
)
EC
ON
OM
IC D
EV
ELO
PM
EN
T
2011
-12
2012
-13
2013
-14
2014
-15
2015
-16
Ent
erp
rise
Zo
ne
Co
nst
ruct
ion
Sp
end
23,
168,
600
232
,087
,673
2
5,95
1,77
4 3
50,2
11,9
84
176
,050
,114
Co
nst
ruct
ion
Jo
bs
164
1
,644
1
83
2,4
80
1,2
47
Clu
ster
Jo
bs
Cre
ated
216
195
7072
5N
/A
No
n C
lust
er J
ob
s C
reat
ed3
151
141
6923
0
Tota
l Inv
estm
ent
111
,822
,245
1
45,3
50,0
00
392
,110
,000
4
8,47
5,00
0 1
25,0
08,0
80
Trad
ed S
ecto
r
Rec
ruit
men
t/E
xpan
sio
n10
336
411
0648
6
"Gro
wth
" Jo
bs
7147
Loan
s/G
rant
s
Clu
ster
Jo
bs
Cre
ated
531
No
n C
lust
er J
ob
s C
reat
ed63
8
PE
IC
Clu
ster
Jo
bs
Cre
ated
372
Nei
ghb
orh
oo
d P
rosp
erit
y In
itia
tive
/Mai
n St
reet
Job
s C
reat
ed43
9
Smal
l Bus
ines
s
Job
s C
reat
ed49
0
Wo
rkfo
rce
Nav
igat
or
Job
s C
reat
ed41
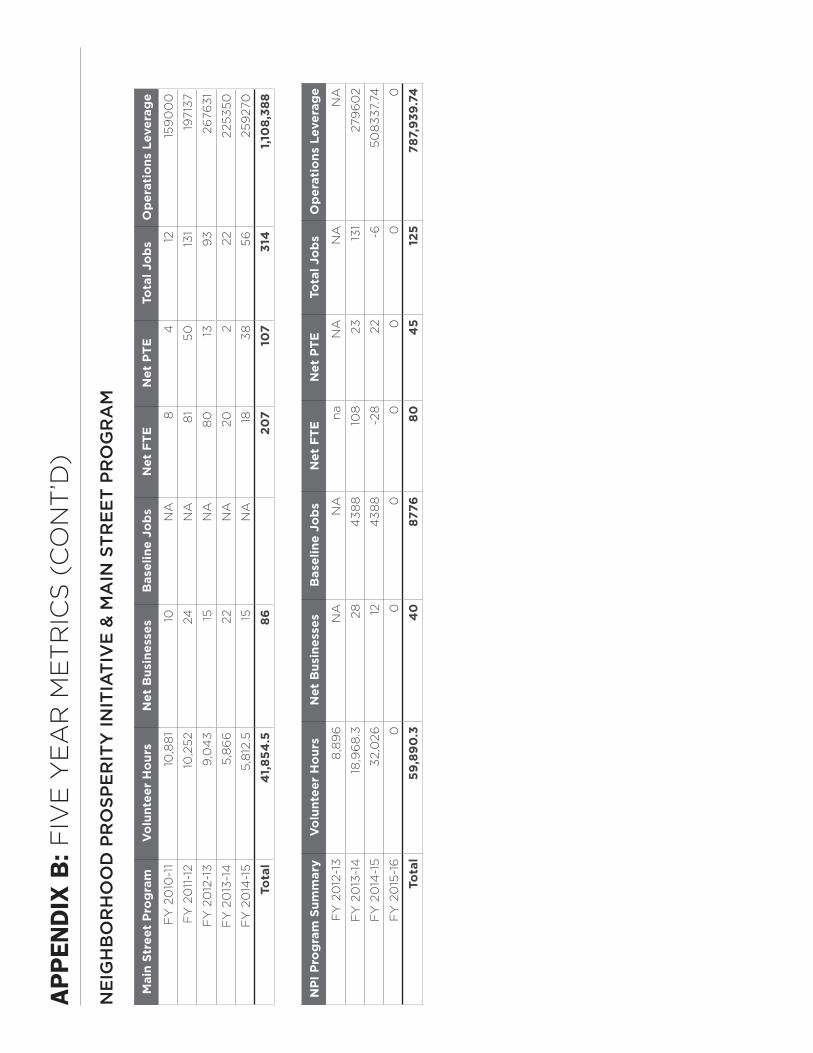
NE
IGH
BO
RH
OO
D P
RO
SPE
RIT
Y IN
ITIA
TIV
E &
MA
IN S
TR
EE
T P
RO
GR
AM
Mai
n St
reet
Pro
gra
mV
olu
ntee
r H
our
sN
et B
usin
esse
sB
asel
ine
Job
sN
et F
TEN
et P
TETo
tal J
ob
sO
per
atio
ns L
ever
age
FY
20
10-1
110
,88
110
NA
84
1215
90
00
FY
20
11-1
210
,252
24N
A8
150
131
1971
37
FY
20
12-1
39
,04
315
NA
80
139
326
763
1
FY
20
13-1
45,
86
622
NA
202
2222
5350
FY
20
14-1
55,
812
.515
NA
183
856
259
270
Tota
l4
1,85
4.5
8620
710
731
41,
108,
388
NP
I Pro
gra
m S
umm
ary
Vo
lunt
eer
Ho
urs
Net
Bus
ines
ses
Bas
elin
e Jo
bs
Net
FTE
Net
PTE
Tota
l Jo
bs
Op
erat
ions
Lev
erag
e
FY
20
12-1
38
,89
6N
AN
An
aN
AN
AN
A
FY
20
13-1
418
,96
8.3
284
38
810
823
131
279
60
2
FY
20
14-1
53
2,0
2612
43
88
-28
22-6
508
337
.74
FY
20
15-1
60
00
00
00
Tota
l59
,89
0.3
40
8776
804
512
578
7,93
9.74
AP
PEN
DIX
B: F
IVE
YE
AR
ME
TR
ICS
(C
ON
T’D
)
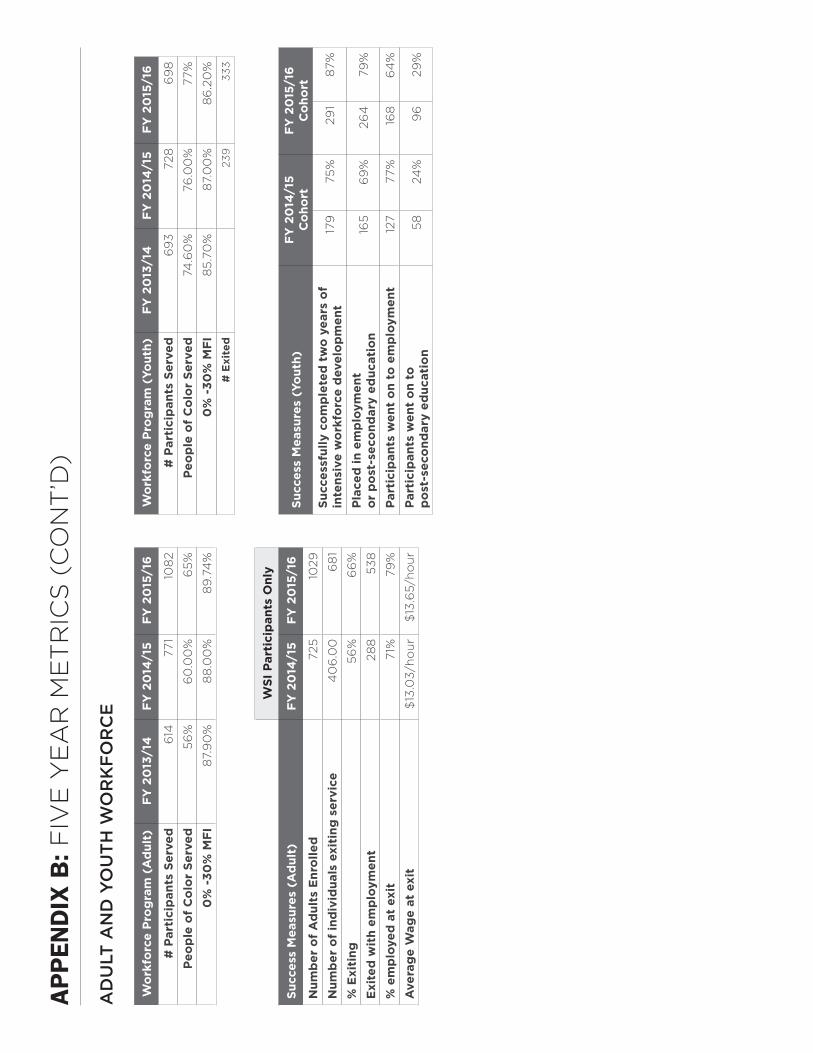
AD
ULT
AN
D Y
OU
TH
WO
RK
FO
RC
E
Wo
rkfo
rce
Pro
gra
m (
Ad
ult)
FY 2
013
/14
FY 2
014
/15
FY 2
015
/16
# P
arti
cip
ants
Ser
ved
614
771
108
2
Peo
ple
of
Co
lor
Serv
ed56
%6
0.0
0%
65%
0%
-30
% M
FI8
7.9
0%
88
.00
%8
9.7
4%
Wo
rkfo
rce
Pro
gra
m (
Yout
h)FY
20
13/1
4FY
20
14/1
5FY
20
15/1
6
# P
arti
cip
ants
Ser
ved
69
372
86
98
Peo
ple
of
Co
lor
Serv
ed74
.60
%76
.00
%77
%
0%
-30
% M
FI8
5.70
%8
7.0
0%
86
.20
%
# E
xite
d 2
39
33
3
WSI
Par
tici
pan
ts O
nly
Succ
ess
Mea
sure
s (A
dul
t)FY
20
14/1
5FY
20
15/1
6
Num
ber
of
Ad
ults
Enr
olle
d72
510
29
Num
ber
of
ind
ivid
uals
exi
ting
ser
vice
40
6.0
06
81
% E
xiti
ng56
%6
6%
Exi
ted
wit
h em
plo
ymen
t28
853
8
% e
mp
loye
d a
t ex
it71
%79
%
Ave
rag
e W
age
at e
xit
$13
.03/
ho
ur
$13
.65/
ho
ur
Succ
ess
Mea
sure
s (Y
out
h)FY
20
14/1
5 C
oho
rtFY
20
15/1
6
Co
hort
Succ
essf
ully
co
mp
lete
d t
wo
yea
rs o
f in
tens
ive
wo
rkfo
rce
dev
elo
pm
ent
179
75%
291
87%
Pla
ced
in e
mp
loym
ent
o
r p
ost
-sec
ond
ary
educ
atio
n 16
56
9%
264
79%
Par
tici
pan
ts w
ent
on
to e
mp
loym
ent
127
77%
168
64
%
Par
tici
pan
ts w
ent
on
to
po
st-s
eco
ndar
y ed
ucat
ion
5824
%9
629
%
AP
PEN
DIX
B: F
IVE
YE
AR
ME
TR
ICS
(C
ON
T’D
)

MIC
RO
EN
TE
RP
RIS
E A
ND
SM
ALL
BU
SIN
ESS
DE
VE
LOP
ME
NT
Dir
ect
Met
rics
(O
utp
uts)
FY
2015
-16
%
# B
usi
nes
ses
Ser
ved
30
9
Tech
nic
al A
ssis
tan
ce H
ou
rs 1
0,5
13
Bu
sin
esse
s o
f C
olo
r S
erve
d24
98
1%
Bu
sin
ess
Ow
ner
s w
ith
lim
ited
En
glis
h p
rofi
cien
cy10
53
4%
0%
-3
0%
MF
I11
337
%
31%
- 5
0%
MF
I9
83
2%
51%
- 8
0%
MF
I8
628
%
Lo
w In
com
e: 0
-80
% M
FI
297
96
%
81%
- 1
20%
MF
I11
4%
Ove
r 12
0%
MF
I1
0%
Ove
rall
Clie
nt
Sat
isfa
ctio
n (
1-5)
4.6
7
Val
ue
to C
lien
ts (
1-4
)3
.72
Lik
lines
s to
Rec
om
men
d P
rog
ram
(1-
5)4
.76
Res
po
nse
Rat
e35
%
Offi
ce H
ou
rs S
ervi
ce R
ecip
ien
ts4
66
Offi
ce H
ou
rs S
ervi
ce R
ecip
ien
ts T
A H
ou
rs P
rovi
ded
2,18
0
Ind
irec
t M
etri
cs (
Out
com
es)
FY
2015
-16
%
Su
cces
sfu
l Exi
ts6
1
Rep
ort
ing
on
gro
ss s
ales
incr
ease
fro
m E
nro
llmen
t to
dat
e58
Ave
rag
e G
ross
Sal
es in
crea
se f
rom
en
rollm
ent
to d
ate
$6
9,2
45
Job
s C
reat
ed d
uri
ng
fisc
al y
ear
148
.75
Bu
sin
ess
clo
sed
du
rin
g F
Y7
Rep
ort
ed a
s h
avin
g "
incr
ease
d e
con
om
ic s
tab
ility
"4
675
%
AP
PEN
DIX
B: F
IVE
YE
AR
ME
TR
ICS
(C
ON
T’D
)

2017
-18
2018
-19
2019
-20
2020
-21
2021
-22
2022
-23
2023
-24
2024
-25
2025
-26
2026
-27
2027
-28
2028
-29
2029
-30
2030
-31
Tota
lO
per
atin
g S
our
ces
Rev
enue
s E
xist
ing
Rev
enue
Eco
no
mic
Dev
elo
pm
ent/
Cit
ywid
eG
ener
al F
un
d6,
145
6,06
0 4,
965
4,91
6 4,
868
4,72
6 4,
589
4,45
5 4,
325
4,19
9 4,
077
3,95
8 3,
843
3,73
1 $
64,8
56
CD
BG
- E
OI
2,13
9 2,
235
1,85
8 1,
713
1,58
0 1,
534
1,49
0 1,
446
1,40
4 1,
363
1,32
4 1,
285
1,24
8 1,
211
$21
,830
N
PI C
ou
nty
/Cit
y R
even
ue
Sh
are
419
581
667
587
173
0 0
0 0
0 0
0 0
0 $
2,42
7 E
zon
e R
even
ue
1,30
8 1,
513
1,42
2 1,
405
1,39
0 1,
445
775
640
562
620
630
601
515
397
$13
,223
Su
bto
tal E
cono
mic
Dev
elo
pm
ent/
Cit
ywid
e10
,011
10
,389
8,
912
8,62
2 8,
012
7,70
6 6,
853
6,54
1 6,
291
6,18
3 6,
030
5,84
4 5,
605
5,34
0 $
102,
337
TIF
/Res
tric
ted
T
IF/C
ash
Bal
ance
21,4
82
17,4
36
15,8
19
9,19
4 7,
251
4,73
1 1,
582
0 0
0 0
0 0
0 $
77,4
95
Exi
stin
g L
oan
Inte
rest
Inco
me
842
1,28
1 89
4 2,
101
804
759
724
435
183
190
103
54
47
40
$8,
456
Rea
l Est
ate
NO
I 69
0 94
4 93
5 92
6 91
7 90
8 89
9 89
0 88
2 87
3 86
5 85
6 84
8 84
0 $
12,2
71
Sub
tota
l TIF
/Res
tric
ted
23,0
13
19,6
61
17,6
48
12,2
21
8,97
1 6,
397
3,20
5 1,
326
1,06
4 1,
063
967
911
895
880
$98
,222
Su
bto
tal E
xist
ing
Rev
enue
33,0
24
30,0
50
26,5
60
20,8
43
16,9
83
14,1
03
10,0
58
7,86
7 7,
355
7,24
5 6,
998
6,75
4 6,
500
6,22
0 $
200,
558
New
Rev
enue
New
UR
A T
IF f
or
Op
erat
ion
s0
0 23
3 46
0 68
0 89
3 3,
444
3,38
7 3,
338
2,86
0 2,
775
2,69
4 2,
615
2,69
8 $
26,0
77
New
Pu
blic
Fu
nd
ing
0 0
0 11
5 11
4 14
6 14
1 2,
261
4,28
6 4,
245
5,19
2 5,
170
5,14
8 5,
127
$31
,944
M
issi
on
Rel
ated
Inve
stm
ent
Inco
me
0 9
1,16
0 4,
062
6,10
3 6,
619
6,61
9 8,
018
8,25
9 8,
551
8,47
3 9,
307
9,60
5 9,
580
$86
,365
P
rog
ram
Rel
ated
Inve
stm
ent
Inco
me
190
211
911
2,14
7 2,
742
2,90
2 2,
912
2,92
2 2,
917
3,08
3 3,
092
3,03
7 2,
980
2,92
3 $
32,9
69
New
UR
A M
RI
0 0
0 66
9 55
0 18
9 79
6 68
1 92
3 43
6 78
6 90
8 39
9 71
9 $
7,05
4 N
ew U
RA
PR
I19
0 21
9 2,
304
7,45
3 10
,188
10
,749
13
,912
17
,269
19
,722
19
,175
20
,318
21
,115
20
,748
21
,047
$
184,
409
PC
IF F
ees
$33
,214
$
30,2
69
$28
,864
$
28,2
96
$27
,171
$
24,8
51
$23
,970
$
25,1
36
$27
,077
$
26,4
20
$27
,315
$
27,8
69
$27
,248
$
27,2
67
$38
4,96
7 Su
bto
tal N
ew R
even
ue91
7 1,
703
4,02
1 8,
165
11,1
47
13,4
31
13,9
35
17,4
77
20,2
43
20,0
28
21,1
42
21,9
80
21,7
44
21,6
90
$19
7,62
5 To
tal S
our
ces
$32
,948
$
31,6
19
$28
,356
$
27,6
10
$25
,884
$
26,6
00
$26
,185
$
26,7
07
$27
,435
$
27,0
86
$28
,040
$
28,6
47
$28
,169
$
27,8
24
$39
3,11
0
Op
erat
ing
Use
s Su
mm
ary
Pro
gra
ms
(Dir
ect
Inve
stm
ent)
$15
,562
$
12,7
99
$11
,406
$
11,0
18
$10
,091
$
7,26
4 $
7,63
2 $
8,02
9 $
9,24
5 $
9,75
9 $
10,3
10
$10
,903
$
11,5
39
$11
,812
$
147,
369
Sta
ffin
g 1
2,36
1 1
2,28
3 1
2,74
1 1
2,69
9 1
2,63
4 1
3,27
1 1
2,14
7 1
2,29
0 1
2,65
1 1
2,54
4 1
2,73
3 1
2,83
6 1
2,73
0 1
2,63
6 $
176,
557
Ad
min
istr
ativ
e O
verh
ead
4,2
91
4,1
51
3,6
70
3,5
63
3,4
59
3,3
58
3,2
61
3,1
66
3,0
73
2,9
84
2,8
97
2,8
13
2,7
31
2,6
51
$46
,068
P
ER
S P
OB
s (r
equ
ired
) 8
57
897
9
12
886
8
60
835
8
11
787
-
- -
- -
- $
6,84
5 U
RA
Deb
t M
gt
142
1
38
134
1
30
127
1
23
119
1
16
55
54
52
51
49
48
$1,
338
Tota
l Use
s $
33,2
14
$30
,269
$
28,8
64
$28
,296
$
27,1
71
$24
,851
$
23,9
70
$24
,387
$
25,0
25
$25
,340
$
25,9
93
$26
,602
$
27,0
49
$27
,147
$
378,
177
Bal
ance
/Defi
cit
$-
$-
$-
$-
$-
$-
$-
$74
9 $
2,05
2 $
1,07
9 $
1,32
3 $
1,26
7 $
199
$12
0
Pro
gra
m D
etai
lE
cono
mic
Dev
elo
pm
ent
Pro
gra
mm
ing
Trad
ed S
ecto
r/C
lust
er51
3 66
8 36
7 36
6 40
9 57
9 61
8 66
0 70
5 75
3 80
4 85
9 91
7 97
9 $
9,19
7 S
mal
l Bu
sin
ess/
En
trep
ren
uer
ship
3,31
4 2,
553
2,13
9 1,
999
1,92
0 1,
725
1,84
2 1,
968
2,49
6 2,
666
2,84
7 3,
040
3,24
7 3,
263
$35
,020
W
ork
forc
e D
evel
op
men
t3,
174
2,84
5 2,
602
2,45
9 2,
326
1,96
2 2,
096
2,23
8 2,
785
2,97
4 3,
176
3,39
2 3,
623
3,66
5 $
39,3
18
Co
mm
un
ity
Cap
acit
y B
uild
ing
2,28
4 1,
868
1,75
0 1,
777
1,69
1 1,
704
1,81
9 1,
943
2,07
5 2,
216
2,36
7 2,
528
2,69
9 2,
883
$29
,604
C
om
mu
nit
y R
edev
elo
pm
ent
Gra
nts
(P
IP o
nly
)4,
622
3,54
4 3,
440
3,34
0 2,
629
1,07
0 1,
256
1,22
0 1,
184
1,15
0 1,
116
1,08
4 1,
052
1,02
1 $
27,7
29
Gra
nts
and
Sp
ons
ors
hip
sC
om
mu
nit
y L
ivab
lity
Gra
nts
1,47
5 1,
141
1,10
8 1,
075
1,11
6 22
4 0
0 0
0 0
0 0
0 $
6,13
8 O
rgan
izat
ion
al S
po
nso
rsh
ips
181
182
0 0
0 0
0 0
0 0
0 0
0 0
$36
3 To
tal P
rog
ram
s15
,562
12
,799
11
,406
11
,018
10
,091
7,
264
7,63
2 8,
029
9,24
5 9,
759
10,3
10
10,9
03
11,5
39
11,8
12
147,
369
AP
PEN
DIX
C: B
US
INE
SS
PL
AN
OP
ER
AT
ING
BU
DG
ET
- S
CE
NA
RIO
A P
V

2017
-18
2018
-19
2019
-20
2020
-21
2021
-22
2022
-23
2023
-24
2024
-25
2025
-26
2026
-27
2027
-28
2028
-29
2029
-30
2030
-31
Tota
lO
per
atin
g S
our
ces
Rev
enue
s E
xist
ing
Rev
enue
Eco
no
mic
Dev
elo
pm
ent/
Cit
ywid
eG
ener
al F
un
d6,
145
6,06
0 4,
965
4,91
6 4,
868
4,72
6 4,
589
4,45
5 4,
325
4,19
9 4,
077
3,95
8 3,
843
3,73
1 $
64,8
56
CD
BG
- E
OI
2,13
9 2,
235
1,85
8 1,
713
1,58
0 1,
534
1,49
0 1,
446
1,40
4 1,
363
1,32
4 1,
285
1,24
8 1,
211
$21
,830
N
PI C
ou
nty
/Cit
y R
even
ue
Sh
are
419
581
667
587
173
0 0
0 0
0 0
0 0
0 $
2,42
7 E
zon
e R
even
ue
1,30
8 1,
513
1,42
2 1,
405
1,39
0 1,
445
775
640
562
620
630
601
515
397
$13
,223
Su
bto
tal E
cono
mic
Dev
elo
pm
ent/
Cit
ywid
e10
,011
10
,389
8,
912
8,62
2 8,
012
7,70
6 6,
853
6,54
1 6,
291
6,18
3 6,
030
5,84
4 5,
605
5,34
0 $
102,
337
TIF
/Res
tric
ted
T
IF/C
ash
Bal
ance
21,4
82
17,4
36
15,8
19
9,19
4 7,
251
4,73
1 1,
582
0 0
0 0
0 0
0 $
77,4
95
Exi
stin
g L
oan
Inte
rest
Inco
me
842
1,28
1 89
4 2,
101
804
759
724
435
183
190
103
54
47
40
$8,
456
Rea
l Est
ate
NO
I 69
0 94
4 93
5 92
6 91
7 90
8 89
9 89
0 88
2 87
3 86
5 85
6 84
8 84
0 $
12,2
71
Sub
tota
l TIF
/Res
tric
ted
23,0
13
19,6
61
17,6
48
12,2
21
8,97
1 6,
397
3,20
5 1,
326
1,06
4 1,
063
967
911
895
880
$98
,222
Su
bto
tal E
xist
ing
Rev
enue
33,0
24
30,0
50
26,5
60
20,8
43
16,9
83
14,1
03
10,0
58
7,86
7 7,
355
7,24
5 6,
998
6,75
4 6,
500
6,22
0 $
200,
558
New
Rev
enue
New
Pu
blic
Fu
nd
ing
0 0
0 0
0 0
0 0
0 0
0 0
0 0
$-
Mis
sio
n R
elat
ed In
vest
men
t In
com
e0
4 48
3 1,
692
2,54
0 2,
750
2,74
2 3,
314
3,37
4 3,
457
3,38
8 3,
705
3,80
1 3,
764
$35
,015
P
rog
ram
Rel
ated
Inve
stm
ent
Inco
me
190
211
911
2,14
7 2,
742
2,90
2 2,
912
2,92
2 2,
917
3,08
3 3,
092
3,03
7 2,
980
2,92
3 $
32,9
69
PC
IF F
ees
0 0
0 66
9 55
0 18
9 79
6 68
1 92
3 43
6 78
6 90
8 39
9 71
9 $
7,05
4 Su
bto
tal N
ew R
even
ue19
0 21
4 1,
395
4,50
9 5,
832
5,84
1 6,
449
6,91
7 7,
214
6,97
6 7,
266
7,64
9 7,
180
7,40
6 $
75,0
38
Tota
l So
urce
s $
33,2
14
$30
,264
$
27,9
54
$25
,352
$
22,8
15
$19
,943
$
16,5
07
$14
,784
$
14,5
69
$14
,221
$
14,2
64
$14
,404
$
13,6
81
$13
,626
$
275,
596
Op
erat
ing
Use
s Su
mm
ary
Pro
gra
ms
(Dir
ect
Inve
stm
ent)
$15
,562
$
12,7
96
$10
,859
$
9,27
7 $
7,61
2 $
4,82
9 $
3,78
0 $
3,00
8 $
3,63
3 $
3,60
3 $
3,75
4 $
3,97
8 $
3,73
1 $
3,77
3 $
90,1
95
Sta
ffin
g 1
2,36
1 1
2,09
5 1
2,36
6 1
1,73
6 1
1,12
4 1
1,11
4 9
,250
8
,683
8
,466
8
,036
8
,119
8
,032
7
,686
7
,678
$
136,
744
Ad
min
istr
ativ
e O
verh
ead
3,9
07
3,5
70
3,3
77
3,2
38
3,1
06
3,2
33
2,5
87
2,5
46
2,4
51
2,4
12
2,4
67
2,3
16
2,2
88
2,2
94
$39
,789
P
ER
S P
OB
s (r
equ
ired
) 8
57
897
9
12
886
8
60
835
8
11
787
-
- -
- -
- $
6,84
5 U
RA
Deb
t M
gt
142
1
38
134
1
30
127
1
23
119
1
16
55
54
52
51
49
48
$1,
338
Tota
l Use
s $
32,8
29
$29
,496
$
27,6
49
$25
,268
$
22,8
28
$20
,133
$
16,5
46
$15
,139
$
14,6
05
$14
,104
$
14,3
92
$14
,376
$
13,7
54
$13
,792
$
274,
911
Bal
ance
/Defi
cit
$38
4 $
768
$30
5 $
84
$(1
3) $
(189
) $
(39)
$(3
55)
$(3
7) $
117
$(1
28)
$28
$
(73)
$(1
66)
Pro
gra
m D
etai
lE
cono
mic
Dev
elo
pm
ent
Pro
gra
mm
ing
Trad
ed S
ecto
r/C
lust
er51
3 66
8 34
7 30
2 29
6 37
9 30
6 24
7 27
7 27
8 29
3 31
3 29
7 31
3 $
4,82
8 S
mal
l Bu
sin
ess/
En
trep
ren
uer
ship
3,31
4 2,
472
1,84
1 1,
369
988
672
349
88
375
380
454
557
473
489
$13
,821
W
ork
forc
e D
evel
op
men
t3,
174
2,84
4 2,
464
2,02
9 1,
684
1,28
4 1,
038
839
1,09
4 1,
098
1,15
7 1,
238
1,17
1 1,
171
$22
,283
C
om
mu
nit
y C
apac
ity
Bu
ildin
g2,
284
1,94
7 1,
842
1,74
7 1,
626
1,57
1 1,
464
1,37
7 1,
421
1,42
3 1,
444
1,47
5 1,
450
1,47
4 $
22,5
44
Co
mm
un
ity
Red
evel
op
men
t G
ran
ts (
PIP
on
ly)
4,62
2 3,
543
3,25
8 2,
756
1,90
3 70
0 62
2 45
7 46
5 42
4 40
6 39
5 34
0 32
6 $
20,2
18
Gra
nts
and
Sp
ons
ors
hip
sC
om
mu
nit
y L
ivab
lity
Gra
nts
1,47
5 1,
141
1,10
8 1,
075
1,11
6 22
4 0
0 0
0 0
0 0
0 $
6,13
8 O
rgan
izat
ion
al S
po
nso
rsh
ips
181
182
0 0
0 0
0 0
0 0
0 0
0 0
$36
3 To
tal P
rog
ram
s15
,562
12
,796
10
,859
9,
277
7,61
2 4,
829
3,78
0 3,
008
3,63
3 3,
603
3,75
4 3,
978
3,73
1 3,
773
90,1
95
AP
PEN
DIX
C: B
US
INE
SS
PL
AN
OP
ER
AT
ING
BU
DG
ET
- S
CE
NA
RIO
B P
V

prosperportland.us