protective effects of aqueous extract from gei herba on
TRANSCRIPT
RSC Advances
PAPER
Ope
n A
cces
s A
rtic
le. P
ublis
hed
on 1
0 M
arch
202
0. D
ownl
oade
d on
4/4
/202
2 4:
10:2
8 PM
. T
his
artic
le is
lice
nsed
und
er a
Cre
ativ
e C
omm
ons
Attr
ibut
ion-
Non
Com
mer
cial
3.0
Unp
orte
d L
icen
ce.
View Article OnlineView Journal | View Issue
Protective effect
aSchool of Pharmacy, Zunyi Medical UniversbKey Lab Basic Pharmacology of Ministry o
Laboratory of Ethnomedicine of Ministry
Zunyi 563000, China. E-mail: duancanca
126.comcSchool of Medicine, Shangqiu Institute of T
Cite this: RSC Adv., 2020, 10, 10167
Received 4th December 2019Accepted 20th February 2020
DOI: 10.1039/c9ra10143h
rsc.li/rsc-advances
This journal is © The Royal Society o
s of aqueous extract from GeiHerba on blood-deficiency mice: insights gained bya metabolomic approach
Ruru Zhao,abc Wenbi Mu,ab Xiaoning Wang,ab Sha Yang,ab Cancan Duan*ab
and Jianyong Zhang *ab
With increasing tumor incidence, anemia (categorized as a blood deficiency in traditional Chinesemedicine)
caused by chemotherapy has become a major side effect worldwide. Gei Herba, a traditional Miao nation
herb, has a prominent effect on the treatment of blood deficiency (BD). However, its application is limited
owing to little fundamental research. Therefore, a GC-MS metabolomic approach was used to study the
protective effect of aqueous extract from Gei Herba (AEG) on BD mice and its putative mechanism. In
this study, 32 male mice were divided into four groups: a control group, a BD model group, and two
groups subjected to AEG treatment at a daily dose of 0.15 or 0.30 g kg�1 for 8 d. After AEG treatment,
the HGB and HCT levels in the blood of BD mice were significantly increased, the activity of superoxide
dismutase was increased, and the histomorphology of the liver was improved. Furthermore, compared
with those in the model group, the levels of eight significant metabolites [phosphoric acid, glycine, L-
proline, ribitol, (Z,Z)-9,12-octadecadienoic acid, oleic acid, uridine and 4B2H-carbamic acid] in the liver
were significantly changed by AEG. The findings of this study provide sound evidence regarding the
protective effects of AEG in BD mice from both classical and metabolomic perspectives. The
mechanisms of action of AEG could be related to regulation of linoleic acid metabolism and that of
glycine, serine, and threonine metabolism.
1. Introduction
Currently, with the increasing incidence of tumors, more andmore patients are treated with chemotherapy, and, anemia hasemerged as a primary side effect of chemotherapy. Anemia iscategorized as a blood deciency in traditional Chinese medi-cine (TCM).1 Blood deciency (BD) is a common clinicalsyndrome of TCM, which generally refers to the deciency ofblood and loss of nourishing viscera.2 At present, the primarystrategies for treating anemia induced by chemotherapy includeblood transfusion, iron supplementation, and erythropoietin.3
However, clinical drugs are limited owing to the need forfrequent repetition, their inherent toxicity, and adverse reac-tions.4 Therefore, it would be valuable to nd new drugs thatcan effectively cure BD induced by chemical injury. TCM hasdemonstrated substantial effects against BD because of itsmultitarget characteristics, which will provide a new approachto treat BD. In TCM, the liver is believed to store blood, prevent
ity, Zunyi 563000, China
f Education, Joint International Research
of Education, Zunyi Medical University,
[email protected]; zhangjianyong2006@
echnology, Shangqiu 476000, China
f Chemistry 2020
bleeding, and regulate blood volume. Modern pharmacologyhas shown that the liver can regulate blood via metabolism,detoxication, the immune system (macrophages), and themodulation of blood circulation function.5 The apoptosis ofhepatocytes was signicantly increased in BD mice.6 Therefore,the protection of the liver may be an important strategy forpreventing and treating BD.
Gei Herba (Chinese name: Lanbuzheng) is the dried wholegrass of Geum japonicum Thunb. var. chinese Bolle and Geumaleppicum Jacq, which is included in the Chinese Pharmaco-poeia (2015 edition). According to the TCM theory, the channeltropism of Gei Herba is the liver, and Gei Herba has also beenused as a folk medicine for treating dizziness and BD in parts ofChina particularly inhabited by ethnic minorities.7 Chemicalanalysis showed that tannins, lignans, and volatile oils are itsmain components.8 Modern pharmacological studies have alsoshown that Gei Herba has various pharmacological effects,including antiapoptotic, cardiogenic, anti-inammatory, andantistress effects.9–11 In addition, Gei Herba has been reportedto enhance blood function in mice.12 However, there have beenonly limited studies on the effects of Gei Herba on BD. Itscomprehensive effects and the related mechanisms of actionremain unclear.
Metabolomics is a technique of analyzing metabolicnetworks, which explores the quantities, and dynamic changes
RSC Adv., 2020, 10, 10167–10177 | 10167

RSC Advances Paper
Ope
n A
cces
s A
rtic
le. P
ublis
hed
on 1
0 M
arch
202
0. D
ownl
oade
d on
4/4
/202
2 4:
10:2
8 PM
. T
his
artic
le is
lice
nsed
und
er a
Cre
ativ
e C
omm
ons
Attr
ibut
ion-
Non
Com
mer
cial
3.0
Unp
orte
d L
icen
ce.
View Article Online
in endogenous metabolites (molecular weight of # 1000) oforganisms stimulated by exogenous environment.13 Therefore,the changes of endogenous metabolites can represent thetrends of physiological and pathological changes induced bydrug intervention in organisms. This holistic approach ofmetabolomics is similar to the holistic regulation of TCM; sothe effect of TCM can thus be reected with metabolic prole,and the characteristics and mechanism of the action of TCMcan be studied by identifying differentially expressed metabo-lites and pathways.14,15
To sum up the above background, a chemical-inducedmodeling method was proposed to develop a mouse model ofBD in this study. Then, the protective effect of Gei Herba onmice was analyzed by a biochemical method and nontargetedmetabolomics based on GC-MS.
2. Experiment section2.1 Materials and reagents
Acetyl phenylhydrazine (APH) was purchased from ShanghaiShenggong Biological Engineering Co., Ltd. Cyclophosphamide(CTX) was obtained from Jiangsu Shengdi Pharmaceutical Co.,Ltd. Superoxide dismutase (SOD) and malondialdehyde (MDA)kits were provided by Beyotime Ltd. Methoxyamine hydrochlo-ride (Aladdin), pyridine (chemical reagent of Sinopharmaceut-ical Group), N-heptane (Chengdu Cologne Chemical ReagentFactory), methanol (chromatographic purity) (Sweden Ocean-pak Company), TMCS (Shanghai Chemical Industry, lot no. 75-77-4), MSTFA (MACHEREY-NA Co.), and xylitol (Tokyo Chemica)were chemical reagents.
Mice were purchased from the Experimental Animal Centerof Chongqing Daping Hospital [SCXK (Yu) 2012-0005]. Then
Fig. 1 Gei Herba (Geum japonicum Thunb. var. chinense Bolle).
10168 | RSC Adv., 2020, 10, 10167–10177
mice were housed in a 12 h light/dark and temperature-controlled room and given access to food and water ad libi-tum. All mice were acclimated to their environment for at least 7d before treatment. All animal experiments were carried out inaccordance with the National Institutes of Health guide for thecare and use of Laboratory animals. And all animal experimentsprotocols were approved by the Institutional Committee onAnimal Care and Use of Zunyi Medical University.
2.2 Preparation and quality control of AEG
Gei Herba (Fig. 1) was collected from Zunyi City, GuizhouProvince, China. The authentication of plant was identied byDr Nie Xuqiang (Department of Pharmacy, Zunyi MedicalUniversity, China) as Geum japonicum Thunb. var. chinenseBolle.
The crude Gei herba was soaked for 30min, then, boiled witheight volumes of water twice for 30 min to obtain the decoctedliquids. The decocted liquids were decompressed andcondensed, concentrated into a powder, and labeled as aqueousextract from Gei Herba (AEG). The qualitative analyticalapproach was as follows: 0.1 g of AEG was accurately weighedand placed in a 50 mL corked conical ask; then, 30 mL ofhydrochloric acid solution (4 mol L�1) was added. The sampleswere bathed in 80 �C water for 2 h and then ltered for HPLCanalysis. The gallic acid content was determined in AEG byHPLC with Agilent ZORBAX SB-C18 (4.6 � 250 mm, 5 mm):mobile phase: methanol/0.1% phosphoric acid aqueous solu-tion (12 : 88). Flow rate was set to 1 mL min�1 with 5 mL. Thecolumn temperature was set at 30 �C. The detection wavelengthwas set to 273 nm. Total sugars were determined by the phenol–sulphuric acid assay using glucose as standard.16 The totalavonoid content of the extract was determined by colorimetricassay,17 then the compounds of total avonoid was identied byHPLC-MS method with standard substance.
2.3 Experimental grouping and AEG administration
In accordance with a method reported in the literature (Jia et al.,2016), the BDmodel was performed as follows: Model (Mod) andAEG treatment groups of mice were established on the secondday of gavage with subcutaneous injection (s.c.) of 20 mg kg�1
APH; s.c. administration of 10 mg kg�1 APH was performed onthe h day and intraperitoneal injection (i.p.) of 40 mg kg�1
CTX was performed 4 h later. In addition, 40 mg kg�1 CTX wasadministered on days 6, 7, and 8. Simultaneously, themice in thecontrol group (Con) were administered saline solution. Mice inthe groups with high-dose AEG (AEG-H) and low-dose AEG (AEG-L) were given 0.15 or 0.30 g kg�1 AEG by gavage from the rst dayfor 8 days, respectively, whereas the Con and Mod mice wereadministered the same amount of steam.
2.4 Routine blood analysis and organ index detection
Aer the last day of administration, mice were fasted for 12 hand anesthetized. Whole blood was then collected from the eyesfor routine blood analysis. Hemoglobin (HGB), red blood count(RBC), white blood count (WBC), hematocrit (HCT), and plate-lets (PLT) were determined using an automated hematology
This journal is © The Royal Society of Chemistry 2020

Paper RSC Advances
Ope
n A
cces
s A
rtic
le. P
ublis
hed
on 1
0 M
arch
202
0. D
ownl
oade
d on
4/4
/202
2 4:
10:2
8 PM
. T
his
artic
le is
lice
nsed
und
er a
Cre
ativ
e C
omm
ons
Attr
ibut
ion-
Non
Com
mer
cial
3.0
Unp
orte
d L
icen
ce.
View Article Online
analyzer (Sysmex XE-500). The liver index (LI) was calculated bythe following formula: LI ¼ (liver weight/mouse weight) � 10.
2.5 Measurement of oxidative stress factors in liver
The liver tissue was obtained and stored in liquid nitrogen.Then, this tissue was homogenized, followed by the analysis ofSOD and MDA of liver homogenate using a commercial kit.
2.6 Histomorphological and ultrastructural observations
Aer the hepatic portal vein had been perfused with PBS,a hepatic lobule sample of 0.5–1 mm3 was obtained and rinsedwith mixed 4% paraformaldehyde. Routine embedding andultrathin sectioning were performed, followed by hematoxylin–eosin staining. Finally, the histopathological changes in theliver were observed under an optical microscope.
For ultrastructural observation, the liver of mice wasperfused with normal saline and 4% paraformaldehyde; then,two pieces of liver tissue were put into 2.5% glutaraldehyde,aer the ultrastructure of liver was observed using transmissionelectron microscope.
2.7 Liver metabolomic analysis by GC-MS
2.7.1 Preparation of liver samples. A total of 50 mg of livertissue was weighed, followed by the addition of 500 mL of normalsaline to each sample and rapid homogenization in an ice bath.Next, 100 mL of homogenate was placed in a 1.5 mL centrifugetube and subjected to ultrasound in an ice bath for 15 min.Subsequently, 10 mL of internal standard (xylitol, 1.0 mg mL�1)and 400 mL of pre-cooled methanol were added, followed by vor-texing the homogenate liquid for 1 min and storaging for 15 minat 4 �C. Subsequently, the homogenate liquid was centrifuged at12 000 rpm for 10 min. A total of 400 mL of supernatant was takenand blown dry with nitrogen gas. Then, 40 mL of methoxyl aminehydrochloride pyridine solution (15 mg mL�1) was added to theresidue, followed by oximation for 1 h at 70 �C; 40 mL of MSTFAwith 1% TMCS was then added and the sample was derivatized atroom temperature for 1 h. Finally, 75 mL of n-heptane was added,the sample was centrifuged at 12 000 rpm for 10 min, and 100 mLof supernatant was used for GC-MS analysis. To test the dataquality and process variations, quality control (QC) was per-formed until GC-MS analysis. Precision was evaluated byanalyzing six independently processed parallel samples.
Fig. 2 HPLC chromatogram of AEG. Note: (A) gallic acid; (B) sample; “#
This journal is © The Royal Society of Chemistry 2020
Reproducibility was also determined by analyzing six indepen-dent QC samples. Sample stability was evaluated by analyzing oneQC sample at 0, 2, 4, and 8 h. Thirty-seven representative ions oftotal ion chromatography covering ion intensity were chosen tocompute the relative standard deviation.
2.7.2 GC-MS analysis. GC-MS analysis was performed usingAgilent 6890N/5973 series GC-MS (Agilent Corporation, California,USA) equipped with Zebron ZB-5MSi (30 m � 0.25 mm � 0.25mm). The solvent delay was set to 4 min. To achieve good separa-tion, the column temperature was optimized as follows: the initialtemperature was set to 60 �C; increased from 60 �C to 115 �C ata rate of 5 �C min�1; increased to 117 �C at a rate of 15 �C min�1;increased to 185 �C at a rate of 5 �C min�1; increased to 240 �C ata rate of 8 �C min�1; increased to 260 �C at a rate of 5 �C min�1;increased to 280 �C at a rate of 15 �C min�1; and then held for5 min. The injection temperature was set to 260 �C, and the ionsource temperature was 230 �C. Helium was used as a carrier gas(purity 99.999%) with a ow rate of 1.0 mL min�1. The tempera-tures of the interface and ion source were set at 270 �C and 230 �C,respectively. The ionization voltage was set at 71 eV. The injectionvolume was 1 mL with a mass spectrometer with electron impaction source, the mass spectra were acquired in full scan mode withrepetitive scanning from 50 to 600 m/z in 1 s.
2.7.3 Data processing and pattern recognition analysis. Alloriginal data were exported to analytical Instrument Associationformat and processed by Xcalibur soware. R soware was usedfor peak picking, peak matching, and internal standard cali-bration. Subsequently, data variables were mean-centered andpareto-scaled, and the data were further analyzed by principalcomponent analysis (PCA) and orthogonal partial least-squaresdiscriminant analysis (OPLS-DA) for observing the metabolicdifferences between groups using SIMCA-P+14.1 soware. Theinuence of AEG on the liver metabolic network was analyzedbased on the changes in metabolic prole. Different metabo-lites were selected according to the parameters of variableimportance in projection (VIP) value (VIP > 1) from OPLS-DAand t-test (P < 0.05) using SPSS 20.0 soware. Furthermore,the different metabolites were input into MetPA to identify theaffected metabolic pathways.
2.8 Statistical analysis
The results are expressed as mean � standard error (�x � SEM).IBM SPSS Statistics 20.0 soware was used to perform inter-
” represents gallic acid.
RSC Adv., 2020, 10, 10167–10177 | 10169

Table 1 The effect of AEG on the blood routine index of blood deficiency micea
Group Dose HGB HCT WBC RBC PLT
Control 154.75 � 2.19 0.57 � 0.01 4.89 � 0.74 10.74 � 0.20 830.75 � 29.43Model 105.50 � 2.01** 0.31 � 0.01** 1.30 � 0.11** 6.12 � 0.21** 1557.38 � 176.64*AEG-L 0.15 g kg�1 124.75 � 2.24## 0.37 � 0.01## 1.85 � 0.21 7.52 � 0.16 1223.13 � 124.72AEG-H 0.30 g kg�1 137.63 � 2.96## 0.39 � 0.01## 1.84 � 0.27 7.54 � 0.08 1338.75 � 147.54
a Note: �x � SEM, n ¼ 8; *P < 0.05, **P < 0.01 vs. control group; #P < 0.05, ##P < 0.01 vs. model group.
RSC Advances Paper
Ope
n A
cces
s A
rtic
le. P
ublis
hed
on 1
0 M
arch
202
0. D
ownl
oade
d on
4/4
/202
2 4:
10:2
8 PM
. T
his
artic
le is
lice
nsed
und
er a
Cre
ativ
e C
omm
ons
Attr
ibut
ion-
Non
Com
mer
cial
3.0
Unp
orte
d L
icen
ce.
View Article Online
group single-factor statistical analysis on data from multiplegroups. P < 0.05 was considered to indicate that a difference wasstatistically signicant. GraphPad Prism 6 soware was used toconstruct graphs.
3. Results3.1 Chemical analysis of AEG
The chromatogram graph is shown in Fig. 2. The content ofgallic acid in AEG was determined and calculated by an externalstandard method as 16.64 � 10�3 g g�1. The total sugar contentof AEG was determined as 41%. The total avonoid content ofAEG was determined to be 0.83 mg rutin equivalents per gramextract, and catechin, epicatechin hesperidin, quercetin, quer-citrin, isoquercitrin and hyperoside were identied in totalavonoid of AEG.
3.2 Blood routine test
As shown in Table 1, compared with those in the Con group, theHGB, HCT, WBC, and RBC levels of mice in the Mod group weresignicantly decreased (P < 0.01) and the PLT level was signi-cantly increased (P < 0.05). The HGB and HCT levels in the AEG-
Table 2 The effect of AEG on liver indicesa
Group Dose Liver index
Control 401.97 � 6.63Model 495.04 � 5.28**AEG-L 0.15 g kg�1 477.93 � 3.16AEG-H 0.30 g kg�1 474.66 � 6.53
a Note: �x � SEM, n ¼ 8; *P < 0.05, **P < 0.01 vs. control group; #P < 0.05,##P < 0.01 vs. model group.
Table 3 The effect of AEG on the oxidative stress of blood deficiencymicea
Group Dose MDA SOD
Control 33.31 � 3.60 11.88 � 0.73Model 48.93 � 5.04 8.71 � 0.33*AEG-L 0.15 g kg�1 40.13 � 1.42 9.55 � 0.39AEG-H 0.30 g kg�1 43.43 � 4.15 10.79 � 0.32##
a Note: �x � SEM, n ¼ 8; *P < 0.05, **P < 0.01 vs. control group; #P < 0.05,##P < 0.01 vs. model group.
10170 | RSC Adv., 2020, 10, 10167–10177
L and AEG-H groups showed signicant increases comparedwith those in the Mod group (P < 0.01).
3.3 Changes in organ index
As shown in Table 2, compared with that in the Con group, theLI of mice in the Mod group was increased (P < 0.01). Moreover,compared with that in the Mod group, the LI in the AEG-L andAEG-H groups showed a decreasing trend.
3.4 Oxidative stress status test
As shown in Table 3, the SOD activity of mice in the Mod groupwas signicantly lower than that in the Con group (P < 0.05).Compared with that in the Mod group, the SOD activity in AEG-H was signicantly increased (P < 0.01).
3.5 Histomorphological and ultrastructural changes of livertissue
As shown in Fig. 3, the hepatocytes in the Con group wereclosely arranged with greater number of and larger nuclei. Theliver in the Mod group showed balloon degeneration of hepa-tocytes (red arrow) and inltration of inammatory cells (blackarrow). Compared with that in the Mod group, the arrangementof hepatocytes in the two dose groups of AEG was signicantlyimproved.
Fig. 3 Themorphology of liver in mice (HE,�400; scale bar¼ 50 mm),(A) control group; (B) model group; (C) AEG-L group; (D) AEG-Hgroup; “Y” red arrow represent “ballooming degeneration of liver cell”;“Y” black arrow represent “Inflammatory cell infiltration”.
This journal is © The Royal Society of Chemistry 2020
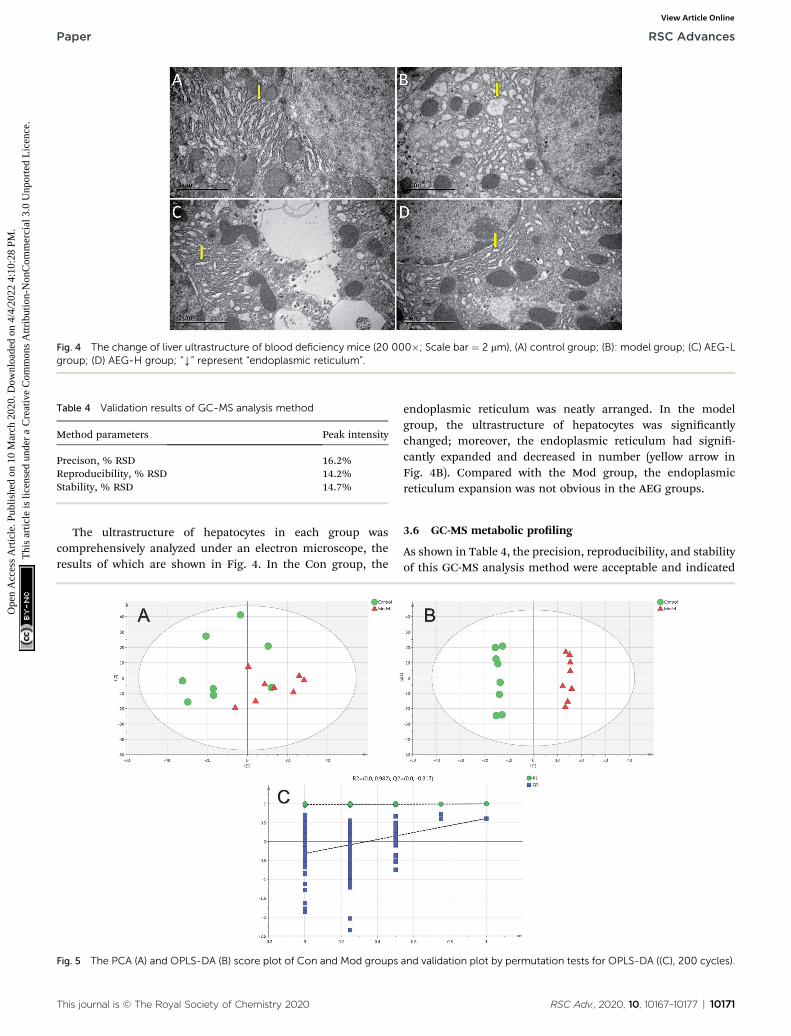
Fig. 4 The change of liver ultrastructure of blood deficiency mice (20 000�; Scale bar ¼ 2 mm), (A) control group; (B): model group; (C) AEG-Lgroup; (D) AEG-H group; “Y” represent “endoplasmic reticulum”.
Table 4 Validation results of GC-MS analysis method
Method parameters Peak intensity
Precison, % RSD 16.2%Reproducibility, % RSD 14.2%Stability, % RSD 14.7%
Paper RSC Advances
Ope
n A
cces
s A
rtic
le. P
ublis
hed
on 1
0 M
arch
202
0. D
ownl
oade
d on
4/4
/202
2 4:
10:2
8 PM
. T
his
artic
le is
lice
nsed
und
er a
Cre
ativ
e C
omm
ons
Attr
ibut
ion-
Non
Com
mer
cial
3.0
Unp
orte
d L
icen
ce.
View Article Online
The ultrastructure of hepatocytes in each group wascomprehensively analyzed under an electron microscope, theresults of which are shown in Fig. 4. In the Con group, the
Fig. 5 The PCA (A) and OPLS-DA (B) score plot of Con and Mod groups
This journal is © The Royal Society of Chemistry 2020
endoplasmic reticulum was neatly arranged. In the modelgroup, the ultrastructure of hepatocytes was signicantlychanged; moreover, the endoplasmic reticulum had signi-cantly expanded and decreased in number (yellow arrow inFig. 4B). Compared with the Mod group, the endoplasmicreticulum expansion was not obvious in the AEG groups.
3.6 GC-MS metabolic proling
As shown in Table 4, the precision, reproducibility, and stabilityof this GC-MS analysis method were acceptable and indicated
and validation plot by permutation tests for OPLS-DA ((C), 200 cycles).
RSC Adv., 2020, 10, 10167–10177 | 10171

Fig. 6 The OPLS-DA score plot of Mod and AEG-L groups (A) and validation plot by permutation tests ((B), 200 cycles).
Fig. 7 The OPLS-DA score plot of Mod and AEG-H groups (A) and validation plot by permutation tests (200 cycles) (B).
RSC Advances Paper
Ope
n A
cces
s A
rtic
le. P
ublis
hed
on 1
0 M
arch
202
0. D
ownl
oade
d on
4/4
/202
2 4:
10:2
8 PM
. T
his
artic
le is
lice
nsed
und
er a
Cre
ativ
e C
omm
ons
Attr
ibut
ion-
Non
Com
mer
cial
3.0
Unp
orte
d L
icen
ce.
View Article Online
that this robust method can be applied to analyze largenumbers of liver samples.
3.7 Multivariate statistical analysis
Firstly, as shown in Fig. 5A, the difference between the Con andMod groups was analyzed by PCA. The results showed that thesetwo groups differed but could not be completely separated onthe score plot. To clarify the differences in liver metabolitesbetween the Con andMod groups, the OPLS-DAmodel was used
Table 5 Differential metabolites (GC-MS, model vs. control)
No. trpm MetabolitesMatching score(%) Trend
1 13.752 Phosphoric acid 96 Y2 14.452 Glycine 91 Y3 19.125 Butanedioic acid 99 Y4 19.745 L-proline 90 Y5 24.41 Ribitol 93 Y6 28.011 D-glucose 87 Y7 31.730 (Z,Z)-9,12-Octadecadienoic acid 99 Y8 31.794 Oleic acid 99 Y9 32.104 Octadecianoic acid 99 Y10 34.886 Uridine 93 Y11 38.534 4B2H-Carbamic acid 93 Y12 44.034 Cholesterol 99 Y
10172 | RSC Adv., 2020, 10, 10167–10177
by tting between the Con andMod groups, as shown in Fig. 5B.The stability of the OPLS-DA model was investigated bya permutation test, as shown in Fig. 5C, and the results showedthat both R2 and Q2 obtained through substitution vericationwere less than the original model values, which indicated thatthe OPLS-DA model in this study was stable and showed a gooddegree of tting and prediction ability. The results also showedthat liver metabolites of mice with BD were signicantlychanged. Then, the OPLS-DA model was used to further clarifythe differences in metabolic proles between the Mod groupand the AEG-L group as well as between the Mod group and theAEG-H group (Fig. 6A and 7A). The parameters of OPLS-DAmodel quality and permutation tests indicated good tnessand predictability (Fig. 6B and 7B). These results indicated that,aer BDmice were administered AEG, the changed endogenousmetabolites were called backed to control.
3.8 Screening and identication of differential metabolites
Aer OPLS-DA analysis between the Con and Mod groups, thedifferent fragments of MS were further conrmed usingHMDB (http://www.hmdb.ca/), KEGG (http://www.genome.jp/kegg/), and METLIN (http://www.metlin.scipps.edu/) data-bases. Finally, 12 different metabolites were obtained, asshown in Table 5. The peak intensities of the differentmetabolites in each group were shown in Fig. 8 and integratedusing a heatmap in Fig. 9. Compared with the Con group, the
This journal is © The Royal Society of Chemistry 2020
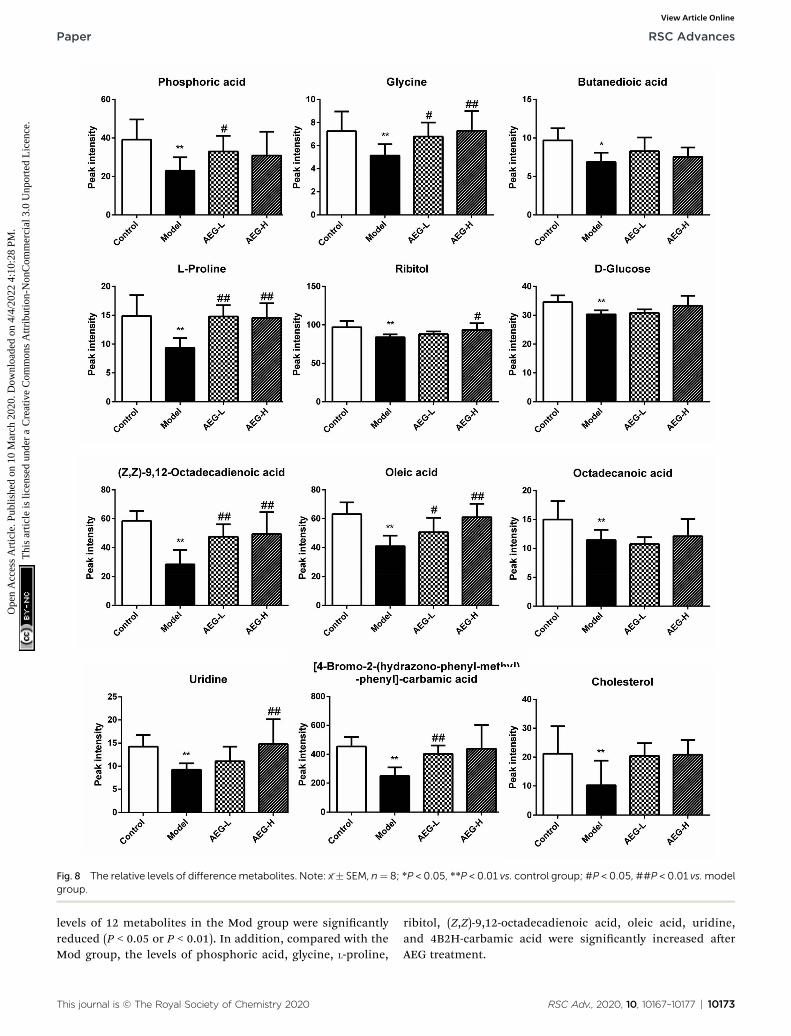
Fig. 8 The relative levels of differencemetabolites. Note: x�� SEM, n¼ 8; *P < 0.05, **P < 0.01 vs. control group; #P < 0.05, ##P < 0.01 vs.modelgroup.
Paper RSC Advances
Ope
n A
cces
s A
rtic
le. P
ublis
hed
on 1
0 M
arch
202
0. D
ownl
oade
d on
4/4
/202
2 4:
10:2
8 PM
. T
his
artic
le is
lice
nsed
und
er a
Cre
ativ
e C
omm
ons
Attr
ibut
ion-
Non
Com
mer
cial
3.0
Unp
orte
d L
icen
ce.
View Article Online
levels of 12 metabolites in the Mod group were signicantlyreduced (P < 0.05 or P < 0.01). In addition, compared with theMod group, the levels of phosphoric acid, glycine, L-proline,
This journal is © The Royal Society of Chemistry 2020
ribitol, (Z,Z)-9,12-octadecadienoic acid, oleic acid, uridine,and 4B2H-carbamic acid were signicantly increased aerAEG treatment.
RSC Adv., 2020, 10, 10167–10177 | 10173

Fig. 9 Heatmap analysis based on the levels of difference metabolites in Con, Mod, AEG-L and AEG-H groups.
Fig. 10 Summary of pathway associated with mice model of blooddeficiency (a) linoleic acid metabolism (b) glycine, serine and threoninemetabolism (c) arginine and proline metabolism (d) primary bile acidbiosynthesis and (e) steroid biosynthesis (f) Starch and sucrosemetabolism (g) galactose metabolism.
Fig. 11 Summary of pathway associatedwith effect of AEG. (a) Linoleicacid metabolism (b) glycine, serine and threonine metabolism (c)arginine and proline metabolism (d) primary bile acid biosynthesisArginine.
RSC Advances Paper
Ope
n A
cces
s A
rtic
le. P
ublis
hed
on 1
0 M
arch
202
0. D
ownl
oade
d on
4/4
/202
2 4:
10:2
8 PM
. T
his
artic
le is
lice
nsed
und
er a
Cre
ativ
e C
omm
ons
Attr
ibut
ion-
Non
Com
mer
cial
3.0
Unp
orte
d L
icen
ce.
View Article Online
3.9 Metabolic pathway analysis
To obtain the key pathway involved in AEG treatment, thedifferential metabolites associated with pathways were subjectedto enrichment analysis by MetPA. Seven signicant pathwaysassociated with the BD mouse model were identied: (a) linoleicacid metabolism; (b) glycine, serine, and threonine metabolism;(c) arginine and proline metabolism; (d) primary bile acidbiosynthesis; (e) steroid biosynthesis; (f) starch and sucrosemetabolism; and (g) galactosemetabolism (Fig. 10). In this study,the metabolic changes related to AEG treatment were analyzed.Compared with the status in the Mod group, the levels of eight
10174 | RSC Adv., 2020, 10, 10167–10177
different metabolites were reversed to normal (Fig. 8). Accordingto the MetPA analysis (Fig. 11), (a) linoleic acid metabolism; (b)glycine, serine, and threonine metabolism; (c) arginine andproline metabolism; and (d) primary bile acid biosynthesis argi-nine were signicantly associated with the effect of AEG on BDmice. These potential metabolic pathways may explain how AEGprotects against BD in mice.
4. Discussion
In the current study, basic pharmacological analysiscombined with nontargeted liver metabolomics was used to
This journal is © The Royal Society of Chemistry 2020
Paper RSC Advances
Ope
n A
cces
s A
rtic
le. P
ublis
hed
on 1
0 M
arch
202
0. D
ownl
oade
d on
4/4
/202
2 4:
10:2
8 PM
. T
his
artic
le is
lice
nsed
und
er a
Cre
ativ
e C
omm
ons
Attr
ibut
ion-
Non
Com
mer
cial
3.0
Unp
orte
d L
icen
ce.
View Article Online
explore the protective effect of AEG and the related mecha-nism in BD mice. The basic pharmacological analysis wasperformed by routine blood analysis, organ index, oxidativestress factor, and the ultrastructure and histomorphologicalchanges of liver tissue. These analyses showed that AEG hada protective effect on the liver of BD mice. Furthermore, theresults of metabolomic GC-MS analysis showed that AEGcould regulate the endogenous metabolic network to protectthe liver.
According Chinese Pharmacopoeia (2015 edition), gallic acidcontent determination was a major method of Gei herba. Forgetting more curative pharmacological results, gallic acid ofAEG was determined, the content of gallic acid was 1.66%,which could give a quality control for AEG on later experimentstudy. And The total sugar content of AEG was 41%, which maya important therapeutic material basis.
4.1 Basic pharmacological analysis of the protective effect ofAEG
In this study, a composite modelling method in mice was per-formed by APH and CTX, the red blood cell membrane of micecould been destroyed by APH oxidative injury and then hemolyticanemia was induced.18 At the same time, CTX could inducehematopoietic dysfunction in body.19 And the modelling methodhave been used to assess efficacy of hematinic TCM.20,21 TheHGB,HCT, WBC, and RBC levels of BD mice were signicantlydecreased and the PLT counts were signicantly increased,indicating that the BD modeling was associated with certaindamage to the hematopoietic function of the mice. The levels ofHGB and HCT were signicantly increased in the two AEG dosegroups, indicating that AEG exerted a blood tonic effect. Lipidperoxidation is a reaction of the liver under oxidative stress, andour experimental results showed that the SOD activity of BDmicewas signicantly decreased, indicating that their liver had beendamaged. Aer AEG treatment, the level of SOD was signicantlyincreased, indicating that AEG had a regulatory effect on oxida-tive stress. Finally, liver micromorphological results showed thatthe BD mice showed balloon degeneration of liver cells andinltration of inammatory cells. The lesions were pronouncedand serious, indicating that the hepatocytes of BD mice weredamaged. The arrangement of hepatocytes in the AEG treatmentgroups was improved and the changes in mice in the AEG-Hgroup were better than those in AEG-L group mice. Insummary, all of these results suggested that the intake of AEG isuseful for preventing liver injury in BD mice.
4.2 Metabolic analysis of AEG protective effect
To explore the mechanism underlying the protective effect ofAEG on BD mice based on metabolic levels, nontargeted livermetabolomics were performed by GC-MS. The metabolomicanalysis indicated that AEG effectively regulated the perturbedmetabolism by reversing the changes of eight metabolites andfour metabolic pathways (linoleic acid metabolism; glycine,serine, and threonine metabolism; arginine and prolinemetabolism; and primary bile acid biosynthesis arginine).
This journal is © The Royal Society of Chemistry 2020
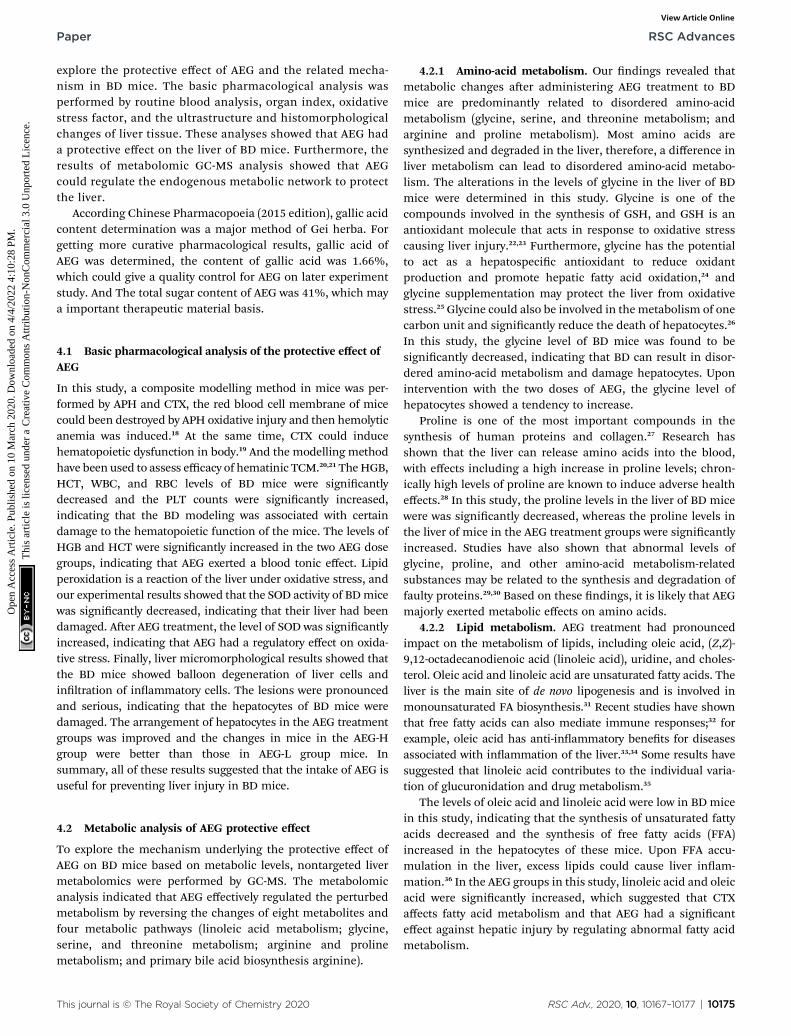
4.2.1 Amino-acid metabolism. Our ndings revealed thatmetabolic changes aer administering AEG treatment to BDmice are predominantly related to disordered amino-acidmetabolism (glycine, serine, and threonine metabolism; andarginine and proline metabolism). Most amino acids aresynthesized and degraded in the liver, therefore, a difference inliver metabolism can lead to disordered amino-acid metabo-lism. The alterations in the levels of glycine in the liver of BDmice were determined in this study. Glycine is one of thecompounds involved in the synthesis of GSH, and GSH is anantioxidant molecule that acts in response to oxidative stresscausing liver injury.22,23 Furthermore, glycine has the potentialto act as a hepatospecic antioxidant to reduce oxidantproduction and promote hepatic fatty acid oxidation,24 andglycine supplementation may protect the liver from oxidativestress.25 Glycine could also be involved in the metabolism of onecarbon unit and signicantly reduce the death of hepatocytes.26
In this study, the glycine level of BD mice was found to besignicantly decreased, indicating that BD can result in disor-dered amino-acid metabolism and damage hepatocytes. Uponintervention with the two doses of AEG, the glycine level ofhepatocytes showed a tendency to increase.
Proline is one of the most important compounds in thesynthesis of human proteins and collagen.27 Research hasshown that the liver can release amino acids into the blood,with effects including a high increase in proline levels; chron-ically high levels of proline are known to induce adverse healtheffects.28 In this study, the proline levels in the liver of BD micewere was signicantly decreased, whereas the proline levels inthe liver of mice in the AEG treatment groups were signicantlyincreased. Studies have also shown that abnormal levels ofglycine, proline, and other amino-acid metabolism-relatedsubstances may be related to the synthesis and degradation offaulty proteins.29,30 Based on these ndings, it is likely that AEGmajorly exerted metabolic effects on amino acids.
4.2.2 Lipid metabolism. AEG treatment had pronouncedimpact on the metabolism of lipids, including oleic acid, (Z,Z)-9,12-octadecanodienoic acid (linoleic acid), uridine, and choles-terol. Oleic acid and linoleic acid are unsaturated fatty acids. Theliver is the main site of de novo lipogenesis and is involved inmonounsaturated FA biosynthesis.31 Recent studies have shownthat free fatty acids can also mediate immune responses;32 forexample, oleic acid has anti-inammatory benets for diseasesassociated with inammation of the liver.33,34 Some results havesuggested that linoleic acid contributes to the individual varia-tion of glucuronidation and drug metabolism.35
The levels of oleic acid and linoleic acid were low in BD micein this study, indicating that the synthesis of unsaturated fattyacids decreased and the synthesis of free fatty acids (FFA)increased in the hepatocytes of these mice. Upon FFA accu-mulation in the liver, excess lipids could cause liver inam-mation.36 In the AEG groups in this study, linoleic acid and oleicacid were signicantly increased, which suggested that CTXaffects fatty acid metabolism and that AEG had a signicanteffect against hepatic injury by regulating abnormal fatty acidmetabolism.
RSC Adv., 2020, 10, 10167–10177 | 10175
RSC Advances Paper
Ope
n A
cces
s A
rtic
le. P
ublis
hed
on 1
0 M
arch
202
0. D
ownl
oade
d on
4/4
/202
2 4:
10:2
8 PM
. T
his
artic
le is
lice
nsed
und
er a
Cre
ativ
e C
omm
ons
Attr
ibut
ion-
Non
Com
mer
cial
3.0
Unp
orte
d L
icen
ce.
View Article Online
Cholesterol is a component of synthetic hepatocytes, and itslevel can reect the physiological function of the liver.37
Cholesterol can combine to maintain its normal operation andmetabolism of liver. When cholesterol combine with certainsaturated fatty acids, resulting in the development of metabolicdisorders.38
Previous study showed that decrease linoleic acid couldinduce nutritional imbalances and anemia.39,40 In this study,the level of linoleic acid was signicantly reduced in BD mice,and the decreased levels of linoleic acid of the liver weresignicantly increased aer AEG treatment. This suggested thatAEG could regulate liver cholesterol metabolism and protect theliver.
Uridine is a pyrimidine nucleoside composed of pyrimidineand ribose. It can prevent fatty liver caused by certain drugs.Studies have shown that uridine is involved in fat metabolism-related pathways.41 In addition, uridine can be decomposedinto alanine and acetylcoenzyme A, which plays an importantrole in cellular energy metabolism and synthesis of the neuro-transmitter acetylcholine.42 In this study, the level of uridinewas signicantly reduced in the liver of BD mice, suggestingdisordered hepatic fat metabolism in these mice. However, thelevel of uridine in the liver of mice in the AEG-H group wassignicantly increased, indicating that AEG can improve liverfat metabolism and other processes and protect the liver.
4.2.3 Energy metabolism. Among the metabolites, phos-phoric acid, ribose, and D-glucose are intermediate products ofenergy metabolism. Phosphoric acid is an important interme-diate metabolite and participates in the regulation of signalingpathways by activating certain protein kinases. Therefore,phosphoric acid is an important compound in the liver. In thisstudy, phosphoric acid in BD mice was signicantly reduced,indicating the impairment of liver function. Ribose and D-glucose are two important energy components.43 Their levelswere decreased in BD mice, which indicated an increase inenergy demand and may be related to the observed alterationsin the levels of metabolites participating in the Krebs cycle. Thedecrease in hepatic glycogen could also be related to theincrease in glycogen phosphorylase activity, probably associatedwith the damage to cell membranes. Moreover, impaired energyreserves were increased by intervention with AEG in the BDmice.
This nding is mostly associated with disrupted energymetabolism in BD mice, and it is speculated that the effect oftreatment of BD mice with AEG is related to abnormalities inglucose metabolism for protecting the liver.
5. Conclusions
In this study, investigation of the protection against BD wassystematically conducted based on biochemical analysis,histopathological observation, and metabolomics. Moreover,eight signicantly disrupted biomarkers in mouse liver wereidentied and shown to be involved in linoleic acidmetabolism;glycine, serine, and threoninemetabolism; arginine and prolinemetabolism; and primary bile acid biosynthesis arginine. Thesepotential biomarkers and their corresponding pathways may
10176 | RSC Adv., 2020, 10, 10167–10177
help to obtain a deeper understanding of the mechanism ofAEG intervention on the liver of BD mice. This study alsoshowed that the established liver GC-MS metabolomic methodis promising for exploring the complex mechanisms of action ofChinese herbal medicines.
Conflicts of interest
All authors report no conict of interest.
Acknowledgements
RZ, CD, and JZ conceived and designed the experiment. RZ,WM, XW and SY performed the experiments. RZ, CD, and JZanalyzed the data. RZ, CD, and JZ wrote the paper. The work wasnancially supported by the National Natural Science Founda-tion of China (Grants no. 81560736), Education Department ofGuizhou Province of China (GNYL[2017]006), ProvincialDepartment of Education Youth Talent Support Program(qiankehe KY[2017]078); 2011 Collaborative Inovation Center ofGuizhou Traditional Chinese Medicine and Ethnic medicine(No. Qianjiaokeyanfa [2012]311).
References
1 P. Vaupel and A. Mayer, Transfus. Clin. Biol., 2005, 12(1), 5–10.
2 T. J. Chien, Y. L. Song, C. P. Lin, C. H. Hsu and C. Medicine,Journal of Traditional and Complementary Medicine, 2012,2(3), 204–210.
3 J. E. Groopman and L. M. Itri, J. Natl. Cancer Inst., 1999,91(19), 1616.
4 A. R. Garzotto, O. Heine, M. Turner, F. R. Laserna andA. J. Lorenz, J. Blood Med., 2014, 5, 43–48.
5 L. T. Hoekstra, W. D. Graaf, G. A. A. Nibourg, M. Heger,R. J. Bennink, B. Stieger and T. M. V. Gulik, Ann. Surg.,2012, 257(1), 27–36.
6 Z. Y. Wang, M. Z. Guo and S. J. Quan, China J. Tradit. Chin.Med. Pharm., 2015, 30(6), 2219–2222, in Chinese.
7 D. Qiu, Zhonghua bencao-Miaoyaojuan, Guizhou Sci TechnicPublish, 2005, pp. 330–331.
8 X. Cheng, J. Qin, Q. Zeng, S. Zhang, F. Zhang, S. Yan, H. Jinand W. M. Zhang, Planta Med., 2011, 77(18), 2061–2065.
9 L. Dimitrova, M. M. Zaharieva, M. Popova, N. Kostadinova,I. Tsvetkova, V. Bankova and H. Najdenski, Chem. Cent. J.,2017, 11(1), 113.
10 V. Neshati, S. Mollazadeh, B. S. F. Bazzaz, M. Iranshahi,M. Mojarrad, H. Naderi-Meshkin and M. A. Kerachian,Biochem. Cell Biol., 2018, 96(5), 610–618.
11 B. J. Ou, W. Tao, S. B. Yang, J. T. Feng, J. F. Wang, T. Yang,H. Y. Wu, Y. G. Huang, L. J. Tan, W. F. Huang, Z. T. Fengand Z. G. Mei, J. Evidence-Based Complementary Altern.Med., 2018, 2018(1), 1–13.
12 Z. P. Peng, H. Wang, X. H. Zhou and H. M. Tang, Journal ofQiannan Medical College for Nationalities, 2011, 24(3), 161–163, in Chinese.
13 F. X. Zhang and G. D. Wang, Hereditas, 2019, 41, 883–892.
This journal is © The Royal Society of Chemistry 2020

Paper RSC Advances
Ope
n A
cces
s A
rtic
le. P
ublis
hed
on 1
0 M
arch
202
0. D
ownl
oade
d on
4/4
/202
2 4:
10:2
8 PM
. T
his
artic
le is
lice
nsed
und
er a
Cre
ativ
e C
omm
ons
Attr
ibut
ion-
Non
Com
mer
cial
3.0
Unp
orte
d L
icen
ce.
View Article Online
14 N. Aa, J. H. Guo, B. Cao, R. B. Sun, X. H. Ma, Y. Chu,S. P. Zhou, J. Y. Aa, Z. J. Yang, H. Sun and G. J. Wang,Metabolomics, 2019, 15(10), 128–134.
15 T. Tao, T. He, X. Wang and X. Liu, Front. Pharmacol., 2019,10, 985.
16 J. Hu, W. Pang, J. Chen, S. Bai and X. Wu, BMCComplementary Altern. Med., 2013, 13(1), 267.
17 L. Soares, L. Silva and B. R. Pezzini, Pharmacogn. Mag., 2015,11(41), 96–101.
18 C. C. Winterbourn and R. W. Carrell, Br. J. Haematol., 1972,23, 499.
19 L. Sefc, O. Psenak, V. Sykora, K. Sulc and E. Necas, J.Hematother. Stem Cell Res., 2003, 12(1), 47–61.
20 H. Zhang, H. F. Wang, Y. Liu, L. J. Huang, Z. F. Wang andY. Li, J. Ethnopharmacol., 2014, 154(3), 818–824.
21 H. Y. Liu, J. Pan, Y. Yang, X. M. Cui and Q. Yuan, Molecules,2018, 23(6), 1243.
22 M. Gaggini, F. Carli, C. Rosso, E. Buzzigoli, M. Marietti,V. Della Latta, D. Ciociaro, M. L. Abate, R. Gambino,M. Cassader, E. Bugianesi and A. Gastaldelli, Hepatology,2018, 67(11), 145–158.
23 C. Koliaki, J. Szendroedi, K. Kaul, T. Jelenik, P. Nowotny,F. Jankowiak, C. Herder, M. Carstensen, M. Krausch,W. T. Knoefel, M. Schlensak and M. Roden, Cell Metab.,2015, 21(5), 739–746.
24 M. F. Mccarty, Med. Hypotheses, 2011, 77(4), 550–556.25 M. El-Hadi, M. Franco, A. R. Ramirez, J. S. Sosa,
J. A. P. Flores, O. L. Acosta, M. C. Salgado and G. Cardoso-Saldana, Oxid. Med. Cell. Longevity, 2018, 2018, 1–12.
26 M. Brecht and H. Groot, Amino Acids, 1994, 6(1), 25–35.27 H. Sakamoto, K. Watanabe, A. Koto, G. Koizumi,
T. Satomura, S. Watanabe, S. I. J. S. Suye andB. S. Research, Sensing and Bio-Sensing Research, 2015, 4,37–39.
28 H. Mitsubuchi, K. Nakamura, S. Matsumoto and F. Endo,Pediatr. Int., 2014, 56(4), 492–496.
29 A. L. Goldberg, Nature, 2003, 426(6968), 895–899.
This journal is © The Royal Society of Chemistry 2020
30 A. Zira, S. Kostidis, S. Theocharis, F. Sigala, S. B. Engelsen,I. Andreadou and E. Mikros, Toxicology, 2013, 303, 115–124.
31 M. S. Strable and J. M. Ntambi, Crit. Rev. Biochem. Mol. Biol.,2010, 45(3), 199–214.
32 M. Viladomiu, R. Hontecillas and J. Bassaganya-Riera, Eur. J.Pharmacol., 2016, 785(15), 87–95.
33 C. Chen, Y. M. Shah, K. Morimura, K. W. Krausz,M. Miyazaki, T. A. Richardson, E. T. Morgan, J. M. Ntambi,J. R. Idle and F. J. Gonzalez, Cell Metab., 2008, 7(2), 135–147.
34 F. Tacke, T. Luedde and C. Trautwein, Clin. Rev. AllergyImmunol., 2009, 36(1), 4–12.
35 Z. Z. Fang, R. R. He, Y. F. Cao, N. Tanaka, C. Jiang,K. W. Krausz, Y. Qi, P. P. Dong, C. Z. Ai, X. Y. Sun,M. Hong, G. B. Ge, F. J. Gonzalez, X. C. Ma and H. Z. Sun,J. Lipid Res., 2013, 54(12), 3334–3344.
36 T. Eslamparast, S. Eghtesad, H. Poustchi andA. Hekmatdoost, World J. Gastroenterol., 2015, 7(2), 204–212.
37 R. Kleemann, L. Verschuren, M. J. van Erk, Y. Nikolsky,N. H. Cnubben, E. R. Verheij, A. K. Smilde, H. F. Hendriks,S. Zadelaar, G. J. Smith, V. Kaznacheev, T. Nikolskaya,A. Melnikov, E. Hurt-Camejo, J. van der Greef, B. vanOmmen and T. Kooistra, Genome Biol., 2007, 8(9), R200.
38 D. F. Horrobin and Y. S. Huang, Int. J. Cardiol., 1987, 17(3),241–255.
39 S. C. Cunnane, S. Ganguli, C. Menard, A. C. Liede,M. J. Hamadeh, Z. Y. Chen, T. M. Wolever andD. J. Jenkins, Br. J. Nutr., 1993, 69(2), 443–453.
40 K. Vijaimohan, M. Jainu, K. E. Sabitha, S. Subramaniyam,C. Anandhan and C. S. Shyamala Devi, Life Sci., 2015,79(3), 448–454.
41 T. T. Le, A. Ziemba, Y. Urasaki, E. Hayes, S. Brotman andG. Pizzorno, J. Lipid Res., 2013, 54(4), 1044–1057.
42 K. E. Wellen and C. B. Thompson, Nat. Rev. Mol. Cell Biol.,2012, 13(4), 270–276.
43 P. Addis, L. M. Shecterle and J. A. St Cyr, J. Diet. Suppl., 2012,9(3), 178–182.
RSC Adv., 2020, 10, 10167–10177 | 10177