protein lc-ms using slip flow chromatography
TRANSCRIPT
Purdue UniversityPurdue e-Pubs
Open Access Dissertations Theses and Dissertations
8-2016
Protein LC-MS Using Slip Flow ChromatographyXimo ZhangPurdue University
Follow this and additional works at: https://docs.lib.purdue.edu/open_access_dissertations
Part of the Chemistry Commons
This document has been made available through Purdue e-Pubs, a service of the Purdue University Libraries. Please contact [email protected] foradditional information.
Recommended CitationZhang, Ximo, "Protein LC-MS Using Slip Flow Chromatography" (2016). Open Access Dissertations. 893.https://docs.lib.purdue.edu/open_access_dissertations/893

�������� ���� ��� ���������� �����������
PURDUE UNIVERSITY GRADUATE SCHOOL
Thesis/Dissertation Acceptance
��� � !" #$%!�&' !�(! !�$ !�$ � )*� $%!(!�"+ ,%$,(%$*
-'
.+!�!/$*
0"% !�$ *$1%$$ "&
2 (,,%"3$* 4' !�$ &�+(/ $5(6�+�+1 #"66�!!$$7
8,,%"3$* 4' 9(:"% ;%"&$ "%< =7 >>>>>>>>>>>>>>>>>>>>>>>>>>>>>>>>>>>>
>>>>>>>>>>>>>>>>>>>>>>>>>>>>>>>>>>>>
8,,%"3$* 4'7
?��� �@ �� A���B�C�D� �������� E��F��� G���
To the best of my knowledge and as understood by the student in the Thesis/Dissertation Agreement, Publication Delay, and Certification/Disclaimer (Graduate School Form 32), this thesis/dissertation adheres to the provisions of Purdue University’s “Policy on Integrity in Research” and the use of copyrighted material.
Ximo Zhang
PROTEIN LC-MS USING SLIP FLOW CHROMATOGRAPHY
Doctor of Philosophy
Mary J. Wirth
Scott A. McLuckey
Chittaranjan Das
Mary J. Wirth
Angeline Lyon
Tim Zwier 07/18/2016


ii
To My Family

iii
ACKNOWLEDGEMENTS
I would like to thank my research advisor, Prof. Mary Wirth, for her guidance and
support during my graduate study. She led me to the field of chromatography, showed me
the charm of science, guided me through the journey of graduate school and taught me to
become an independent ‘thinker’. I enjoyed the time of being her student. It was also a lot
of fun of climbing the Great Wall with her. I would like to my thesis committee members,
Prof. Scott McLuckey, Prof. Chitta Das and Prof. Angeline Lyon for their valuable
advice and insights on my graduate research. Thank our collaborator, Prof. Neil Kelleher
at Northwestern University, for the discussions and support on my research project of
histones separation. It was also my great pleasure of visiting his lab. Dr. Zhen Wu and Dr.
Bingchuan Wei helped me with the science and technologies in our research group when
I first started my own projects. I would like to thank them and all other Wirth group
members for their help during my graduate study.
Last but not least, thank my family and friends for their love and accompany to
help me through the past four years.
iv
TABLE OF CONTENTS
Page
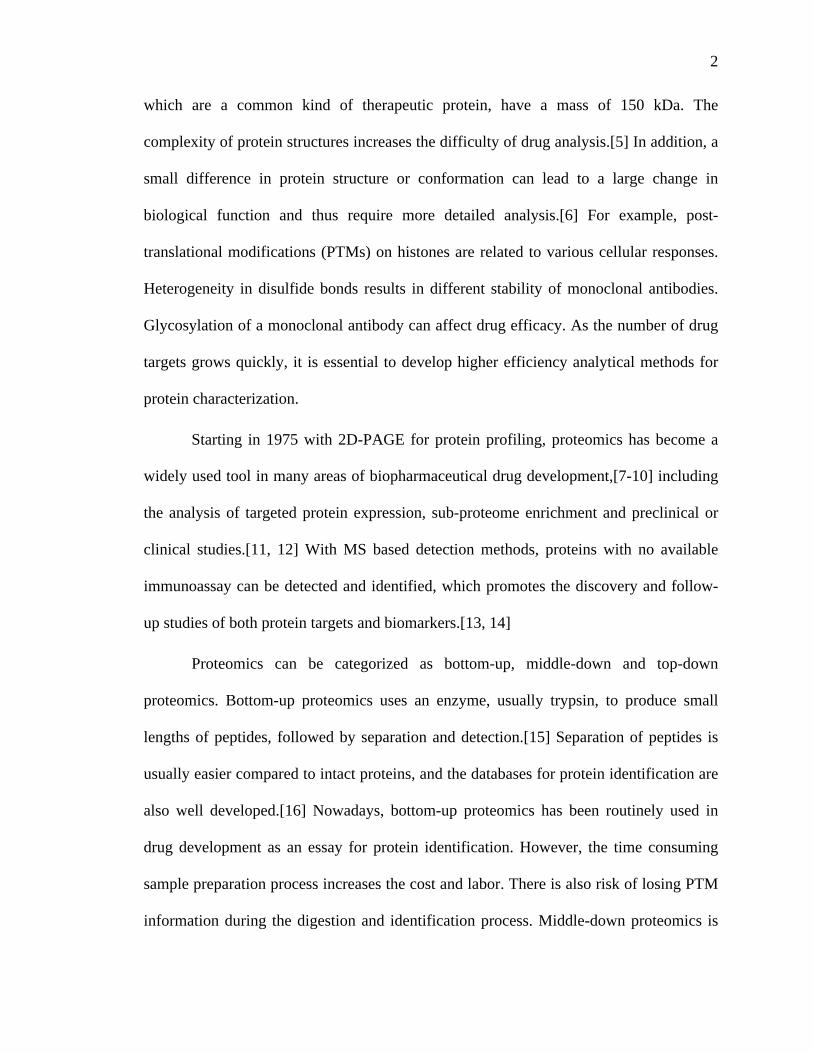
LIST OF FIGURES ........................................................................................................... vi
LIST OF ABBREVIATIONS ..............................................................................................x
ABSTRACT ...................................................................................................................... xii
CHAPTER 1: INTRODUCTION ........................................................................................1
1.1 Challenges in Biopharmaceutical Research and Development ...............................1 1.2 Protein Separation Technologies .............................................................................3 1.3 Research Objective ..................................................................................................5 1.4 References ................................................................................................................7
CHAPTER 2: SUBMICROMETER PARTICLES FOR PROTEIN SEPARATION .......11
2.1 Nonporous Silica Particles .....................................................................................11 2.2 Smaller Particle Size Reduces Plate Height ...........................................................12 2.3 Slip Flow Effect Alleviated Back Pressure ............................................................15 2.4 Nano-LC-MS of Intact Proteins .............................................................................17 2.5 Instrument Contribution to Protein Separation ......................................................18 2.6 References ..............................................................................................................20
CHAPTER 3: LC-MS OF INTACT HISTONES USING SLIP FLOW CHROMATOGRAPHY ............................................................................26
3.1 Introduction ............................................................................................................26 3.2 Materials and Methods ...........................................................................................27
3.2.1 Materials .......................................................................................................27 3.2.2 Capillary with Packed Silica Colloidal Crystals ...........................................28 3.2.3 Nano-LC-MS and LC-MS of Histones .........................................................28 3.2.4 LC Separation of Histones ............................................................................29
3.3 Results and Discussion ..........................................................................................30 3.4 Concluding Remarks ..............................................................................................34 3.5 References ..............................................................................................................36

v
Page
CHAPTER 4: NANO-RPLC-MS OF PROTEIN DIGESTS USING SUBMICRON NONPOROUS PARTICLES .....................................................................46
4.1 Introduction ............................................................................................................46 4.2 Materials and Methods ...........................................................................................47
4.2.1 Materials .......................................................................................................47 4.2.2 Preparation of Capillaries .............................................................................48 4.2.3 Measurement of Diffusion Coefficient in Mobile Phase ..............................48 4.2.4 NanoLC-MS of Peptide Separation ..............................................................49 4.2.5 Measurement of Diffusion Coefficient on Stationary Phase ........................49
4.3 Results and Discussion ..........................................................................................50 4.4 Concluding Remarks ..............................................................................................54 4.5 References ..............................................................................................................55
CHAPTER 5: APPLICATION OF SLIP FLOW CHROMATOGRAPHY ON INTACT PROTEINS ................................................................................................63
5.1 Ubiquitin Characterization .....................................................................................63 5.2 Separation of RRM2 Monomer and Aggregates ...................................................65 5.3 References ..............................................................................................................67
CHAPTER 6: CONCLUSION AND FUTURE DIRECTION ..........................................74 6.1 Conclusion .............................................................................................................74 6.2 Future Direction .....................................................................................................75
6.2.1 Histones Separation ......................................................................................75 6.2.2 Reducing Noise of Nano-ESI ........................................................................77 6.2.3 Development of New Stationary Phases .......................................................78
6.3 References ..............................................................................................................80
VITA ..................................................................................................................................86
PUBLICATION .................................................................................................................87

vi
LIST OF FIGURES
Figure Page
2.1 Schematic depiction of the three common particle morphologies used in chromatography. ..........................................................................................................22
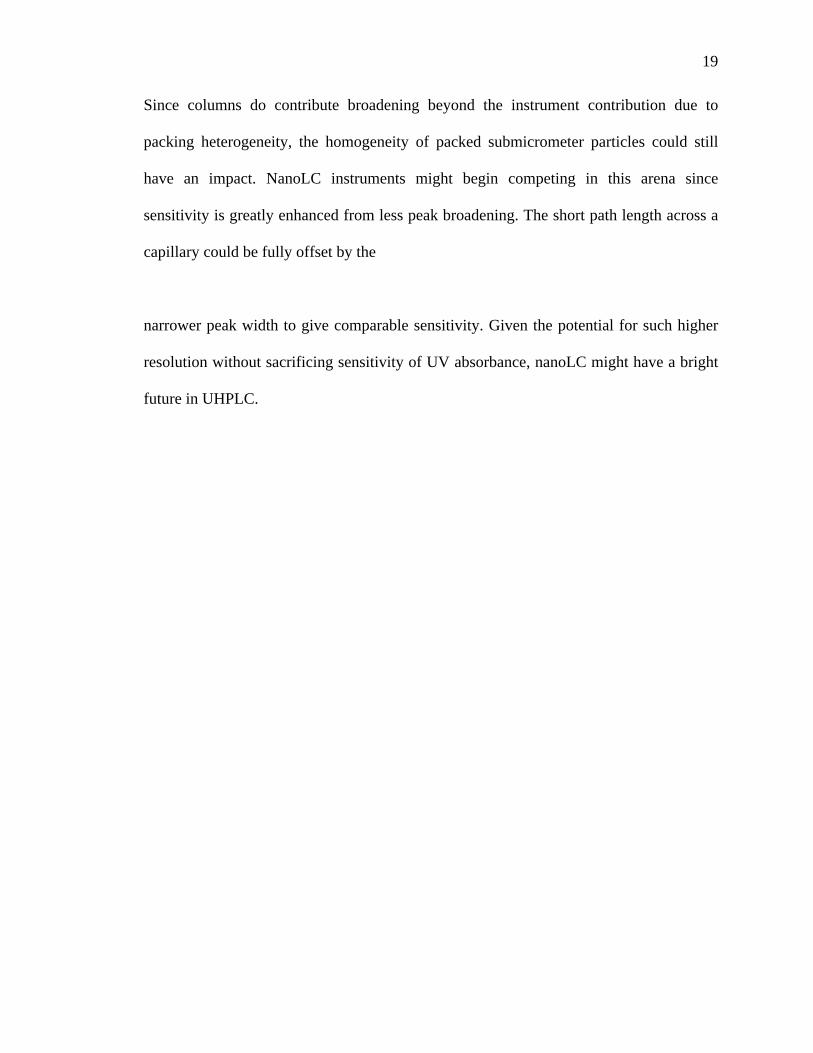
2.2 Calculated van Deemter plots are shown as a function of particle diameter, dp, for two different molecular size scales: (a) small-molecule and (b) protein. The magenta dot in each panel for the 0.5 μm particle diameter is at the velocity currently achievable, without slip flow, by commercial instruments for a 5 cm column length and random packing. The entire velocity range is achievable with all of the larger particle sizes. These graphs help to explain that conventional chromatographic theory predicts an advantage with submicrometer particles only for protein separations.. ................................................23
2.3 Illustration of slip flow concept for the case of reversed phase liquid chromatography, where hydrophilic walls give zero velocity of fluid at the wall, and hydrophobic walls give a nonzero velocity ..................................................24
2.4 Illustration of how much broadening is currently imparted by commercial instruments. These are plots of Gaussians to help visualize (1) the 64 μm base width for no instrument contribution vs (2) the 400 μm base width in typically images observed using a nanoLC for injection with MS for detection vs (3) the 2.5 mm base width calculated for the current best-performing UHPLC instrument with a 5.5 μL dispersion volume, considering no contribution from the column. All base widths are for peaks inside the medium ........................................................................................................................25
3.1 Dependence of HPLC of histones on the choice of acid modifier: (A) 0.1% TFA, (B) 0.5% FA and 0.02% TFA, (C), 0.1% DFA ..................................................38
3.2 Optimization of the gradient for the slip flow column. A fixed flow rate of 100 nL/min was used, giving t0=0.8 min. The gradient time was varied from 10 to 60 min for 25-50% acetonitrile in water. All are acceptable, with k* over a reasonable range; 20 min has the most sensitivity and allows for high speed .............39

vii
Figure Page
3.3 Gradient optimization for Discovery column – fixed tG of 60 min, vary Q. ..............40
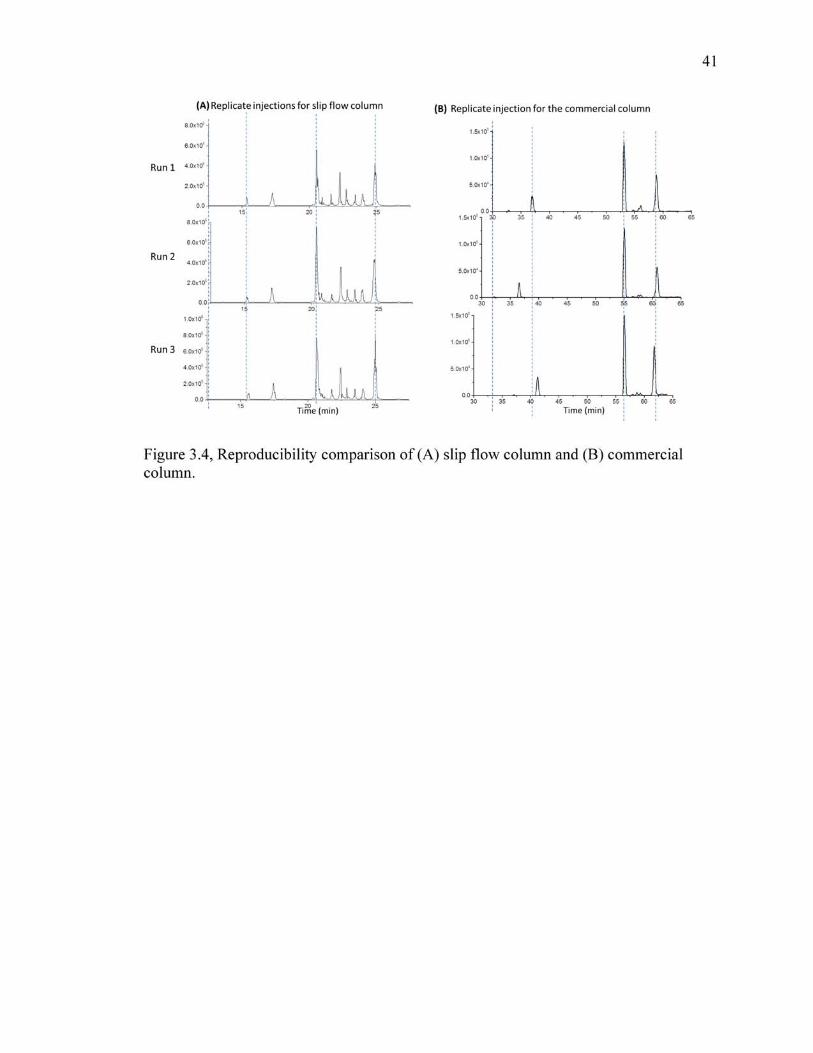
3.4 Reproducibility comparison of (A) slip flow column and (B) commercial column.. ........................................................................................................................41
3.5 Dependence of amount injected for (A) slip flow capillary, (B) Discovery column. .........................................................................................................................42
3.6 Comparison of peak capacities for EIC for same tG/t0. The chromatograms on top are for commercial column, and the bottom chromatograms are for slip flow column. Flow rate for Discovery column is 12.5 μL/min. ..................................43
3.7 Comparison of peak capacities for EIC for same tG/t0. The chromatograms on top are for commercial column, and the bottom chromatograms are for slip flow column. Flow rate for Discovery column is 25 μL/min ......................................44
4.1 (A) difference of peak width variance vs. time after turning off the mobile phase flow rate. Red line is linear fitting of data points for calculation of diffusion coefficient; (B) mass spectrum of the peptide used in measurement of diffusion coefficient .................................................................................................58
4.2 Separation of BSA tryptic digests by slip flow capillary with different acid modifiers in mobile phases. (A) 0.1% formic acid, (B) 0.5% formic acid, (C) 0.5% formic acid and 0.02% TFA, (D) 0.5% formic acid and 0.04% TFA. Gradient conditions: 1-40% acetonitrile in 20 min. Flow rate: 200 nL/min.. ..............59
4.3 Separation of BSA tryptic digests by slip flow capillary with fast and slow gradient. (A) Gradient of 1-40% acetonitrile in 17 min, (B) Gaussian fitting of widths for peaks from 18.25 to 19.75 min in (A), (C) Gradient of 1-40% acetonitrile in 34 min. (D) Gaussian fitting of widths for peaks from 25.50 to 28.50 min in (C) Flow rate: 200 nL/min. .....................................................................60
4.4 (A) Measurement of peptides diffusion on stationary phase, (B) Gaussian fitting of widths for the three injection bands in (A). The capillary was filled with 1% acetonitrile to mimic the stacking condition. The injection bands of labeled peptides were almost the same after four minutes of stacking ........................61
4.5 separation of Hela cell lysate tryptic digests by slip flow capillary with fast and slow gradient. (A) Gradient of 1-40% acetonitrile in 17 min, (B) Gaussian fitting of the narrowest peak in (A), (C) mass spectrum of peak 1, (D) gradient of 1-40% acetonitrile in 34 min. (E) Gaussian fitting of the narrowest peak in (D), (F) mass spectrum of peak 1. Flow rate: 200 nL/min. .........................................62

viii
Figure Page
5.1 (A) Nano-LC-ESI-MS of Ubiquitin by a 5 cm C18 slip flow capillary, (B) mass spectrum of Ub-1, (C) Mass spectrum of Ub-2, (D) Deconvoluted mass spectrum of Ub-1 and (E) deconvoluted mass spectrum of Ub-2. Instruments: Dionex Utimate 3000 NanoLC and Thermo LTQ Velos. Gradient conditions: 25-50% acetonitrile in 10 min. Flow rate: 100 nL/min. ..............................................69
5.2 (A) Nano-LC-ESI-MS of Ubiquitin-APDR by a 5 cm C18 slip flow capillary, (B) mass spectrum of Ub-APDR-1, (C) mass spectrum of Ub-APDR-2, (D) deconvoluted mass spectrum of Ub-APDR-1 and (E) deconvoluted mass spectrum of Ub-APDR-2. A second type of Ubiquitin APDR complex was found in the mass spectrum of both peaks. Instruments: Dionex Utimate 3000 NanoLC and Thermo LTQ Velos. Gradient conditions: 25-50% acetonitrile in 10 min. Flow rate: 100 nL/min. ...................................................................................70
5.3 (A) Nano-LC-ESI-MS of RRM2 in pure water by a 4 cm C18 slip flow capillary. This is the control sample without any H2O2 treatment. (B) Masses of peak1-10. Deconvolution was completed by MagTran. Peak 1-7 are isoforms of RRM2 monomer, peak 8 is a dimer and peak 9, 10 might be fragments of dimer. Instruments: Dionex Utimate 3000 NanoLC and Thermo LTQ Velos. Gradient conditions: 30-55% acetonitrile in 20 min. Flow rate: 200 nL/min.. .................................................................................................................71
5.4 (A) Nano-LC-ESI-MS of RRM2 with 1-hour H2O2 treatment by a 4 cm C18 slip flow capillary, (B) masses of peak1-9. Deconvolution was completed by MagTran. Peak 1-6 are isoforms of RRM2 monomer, peak 7 is a dimer and peak 8, 9 might be dimer fragments. Instruments: Dionex Utimate 3000 NanoLC and Thermo LTQ Velos. Gradient conditions: 30-55% acetonitrile in 20 min. Flow rate: 200 nL/min.. ..................................................................................72
5.5 (A) Nano-LC-ESI-MS of RRM2 with 24-hour H2O2 treatment by a 4 cm C18 slip flow capillary. (B) Masses of peak1-12. Deconvolution was completed by MagTran. Peak 1-7 are isoforms of RRM2 monomer, peak 8, 10 and 11 are dimer and peak 8, 9 might be dimer fragments. Large amount of dimer was found in this sample, which means the H2O2 treatment can cause dimerization of RRM2. Instruments: Dionex Utimate 3000 NanoLC and Thermo LTQ Velos. Gradient conditions: 30-55% acetonitrile in 20 min. Flow rate: 200 nL/min. .........................................................................................................................73
6.1 Separation of H4 histones fraction using slip flow capillary. H4 and contamination of H2A were marked in blue rectangle and collected for subsequent slip flow capillary separation. Gradient conditions: 40-50% acetonitrile in 20 min. Flow rate: 200 nL/min. This project was in collaboration with Dr. Yupeng Zheng..... ....................................................................82

ix
Figure Page
6.2 Comparison of capillary fabricated with (A) packed tip and (B) conventional methods for histones separation. Gradient conditions: 25-50% acetonitrile in 20 min. Flow rate: 100 nL/min ....................................................................................83
6.3 Comparison of (A) capillary with integrated tip and (B) capillary with extra emitter.... ......................................................................................................................84
6.4 Separation of Ribonuclease B by HILIC capillary. Gradient condition: 75-60% acetonitrile in 30 min. Flow rate: 200 nL/min. ............................................................85

x
LIST OF ABRREVIATIONS
AAm Acrylamide
BC (chloromethyl)phenylethyl trichlorosilane
C1 Methyltrichlorosilane
C4 n-butyldimethylchlorosilane
C18 Octadecyltrichlorosilane
cIEF Capillary isoelectric focusing
DFA Difluoroacetic acid
DNA Deoxyribonucleic acid
FCC Face centered cubic
FDA Food and Drug Administration
HIC Hydrophobic interaction liquid chromatography
HILIC Hydrophilic interaction liquid chromatography
IEF Isoelectric focusing
IEX Ion exchange chromatography
IgG Immunoglobulin G
mAb Monoclonal antibody

xi
Me6TREN Tris 2-(dimethylamino) ethyl amine
MS Mass Spectrometry
PAAm Polyacrylamide
PAGE Polyacrylamide gel electrophoresis
pI Isoelectric point
PTM Post translational modification
R.S.D. Relative Standard Deviation
RPLC Reversed phase liquid chromatography
RRM2 RNA recognition motif-2
SDS Sodium dodecyl sulfate
SEM Scanning electron microscope
S/N Signal to noise ratio
TDP Trichlorodiphenylsilane
TFA Trifluoroacetic acid
UHPLC Ultra high performance liquid chromatography

xii
ABSTRACT
Zhang, Ximo. Ph.D., Purdue University, August 2016. Protein LC-MS Using Slip Flow Chromatography. Major Professor: Mary J. Wirth.
Histones are essential chromosomal proteins with large numbers of variants and
post-translational modifications (PTMs). PTM levels of histones are known to correlate
with different stages of cancer. Due to the lack of resolution on intact histone separations,
conventional methods for histone analysis require time-consuming digestion, which often
leads to the loss of PTM information. Slip flow chromatography with orderly packed
nonporous silica particles has been shown to greatly increase the efficiency of protein
separation by reducing eddy diffusion and resistance to mass transfer. In this work,
higher resolution for intact histones separation was achieved by using a 5 cm capillary
with 470 nm particle size and C18 bonded phase. The levels of histone phosphorylation
and other PTMs were verified by deconvoluted MS spectra. This methodology was also
applied to the separation of a complex mixture of protein digests. A peak capacity of 500
was achieved by using a 30 min gradient elution. Other bonded phases such as C4 and
TDP were also developed to separate different protein samples. This dissertation also
includes 1) separation of intact monoclonal antibodies by RPLC; 2) characterization of
reduced monoclonal antibodies by nano-RPLC-MS; 3) analysis of ubiquitin and ubiquitin

xiii
linker in a new pathway of ubiquitination; 4) separation of RRM2 monomer and
aggregates. Above results demonstrated the effectiveness of slip flow capillary for the
separation of both protein and peptide separation for proteomic studies.

1
CHAPTER 1: INTRODUCTION
1.1 Challenges in Biopharmaceutical Research and Development
The biopharmaceutical industry has become one of the fastest growing divisions
in global market in the past two decades. From 2000 to 2012, many large pharmaceutical
companies had an increasing percentage of revenue contributed from
biopharmaceuticals.[1] Common biopharmaceutical drugs, also known as biologics,
include engineered antibodies,[2] recombinant therapeutic proteins and genetic materials.
Compared to traditional small molecule drugs, biopharmaceutical drugs provide higher
efficacy and fewer side effects. In addition, the structural complexity of
biopharmaceutical drugs makes it difficult to manufacture generic products and therefore
protects brand-name drugs. These favorable features assure the continuous growth of
biologics in the pharmaceutical market in the future.
The development of biopharmaceuticals is not without challenges. [2] One major
obstacle is the detailed characterization of drug candidates. Before sending any
therapeutic drugs to clinical trials, many aspects of chemical and physical properties of
the candidate drugs must be fully characterized and controlled, including the drug
efficacy, purity and stability.[2, 3] For biopharmaceutical drug development, proteins are
the major targets. Unlike small molecule drugs, proteins have much larger molecular
weights and more complexed three dimensional structures.[4] Monoclonal antibodies,
2
which are a common kind of therapeutic protein, have a mass of 150 kDa. The
complexity of protein structures increases the difficulty of drug analysis.[5] In addition, a
small difference in protein structure or conformation can lead to a large change in
biological function and thus require more detailed analysis.[6] For example, post-
translational modifications (PTMs) on histones are related to various cellular responses.
Heterogeneity in disulfide bonds results in different stability of monoclonal antibodies.
Glycosylation of a monoclonal antibody can affect drug efficacy. As the number of drug
targets grows quickly, it is essential to develop higher efficiency analytical methods for
protein characterization.
Starting in 1975 with 2D-PAGE for protein profiling, proteomics has become a
widely used tool in many areas of biopharmaceutical drug development,[7-10] including
the analysis of targeted protein expression, sub-proteome enrichment and preclinical or
clinical studies.[11, 12] With MS based detection methods, proteins with no available
immunoassay can be detected and identified, which promotes the discovery and follow-
up studies of both protein targets and biomarkers.[13, 14]
Proteomics can be categorized as bottom-up, middle-down and top-down
proteomics. Bottom-up proteomics uses an enzyme, usually trypsin, to produce small
lengths of peptides, followed by separation and detection.[15] Separation of peptides is
usually easier compared to intact proteins, and the databases for protein identification are
also well developed.[16] Nowadays, bottom-up proteomics has been routinely used in
drug development as an essay for protein identification. However, the time consuming
sample preparation process increases the cost and labor. There is also risk of losing PTM
information during the digestion and identification process. Middle-down proteomics is

3
to reduce the proteins to relatively larger fragments compared to peptides, and then
perform the analysis. This method is especially useful for large protein analysis, such as
monoclonal antibodies. Top-down proteomics is the analysis of intact proteins.
Theoretically, all PTMs including their localization information are well preserved with
top-down proteomics.[17, 18] Moreover, since there is very little sample preparation
required, top-down proteomics can be considered as a high-throughput analytical method.
The bottleneck of top-down proteomics is separation technology.[19, 20] Currently a
protein separation requires long analysis time and large sample size, or suffers from poor
resolution and sensitivity.[21] Therefore, it is essential to improve separation
technologies for analysis of proteins.
1.2 Protein Separation Technologies
Current protein separation technologies used in biopharmaceutical industry and
related academic areas are mainly based on immunoprecipitation[22], HPLC and
electrophoresis.[4, 23-27] Different separation technologies are applied to meet the
requirements of different stages of drug development.[21] Immunoprecipitation is
commonly used for protein extraction and purification, while HPLC and electrophoresis
are used in almost every aspects of biopharmaceuticals, including drug discovery, process
development and quality control. [28]
LC based technologies are suitable for various stages of protein separation based
on different mechanisms.[29, 30] Reversed phase liquid chromatography (RPLC) is the
most widely used method for protein separation since the denatured proteins are
hydrophobic in acidic mobile phases.[31] Based on the difference of overall

4
hydrophobicity, proteins can be separated by interacting with the hydrophobic stationary
phases. Hydrophobic interaction chromatography (HIC) is another method that also based
on hydrophobicity. The advantage of HIC is that it does not denature the proteins since
the mobile phases used for HIC are water based, giving orthogonal selectivity compared
to RPLC by separating based on the outer amino acids. The major application of HIC is
separation of antibody-drug-conjugates due to the non-covalent binding among antibody
subunits.[32, 33] Ion exchange chromatography (IEX) is a charged based separation
method for analysis of protein charge heterogeneity.[34] Hydrophilic interaction
chromatography (HILIC) is usually used for separation of proteins with glycosylation.[35,
36] In order to achieve higher resolution for protein separations, current strategies are to
combine two separation methods with different mechanisms to perform 2D separation.
Therefore the peak capacity can be greatly enhanced. In addition to being used as
detector for protein identification, mass spectrometer can be considered as another
separation dimension for complexed sample analysis.[37, 38] In this case, the separation
methods with salt-containing mobile phases, such as HIC and IEX, are often used as the
first dimension of separation to avoid immiscibility of solvents. [39]
Electrophoresis, including 2D-PAGE[40], CZE[41-44] and cIEF[45, 46], has been
widely used for protein separation with the well-developed automated instrumentation.
[47, 48] Electrophoresis can also be combined with LC for 2D separation of proteins and
provide very high resolution.[49, 50] However, the analysis time of traditional
electrophoresis, such as 2D-PAGE is much longer than common LC separation, which
limits the use of electrophoresis in industry.
5
Fast development of biopharmaceutical industry calls for better separation
technologies. With the growing number and complexity of protein samples, it is essential
to develop separation methods with higher resolution and throughput. Beyond increasing
the number of dimensions for protein separation, the separation power and speed of each
dimension has to be improved.
1.3 Research Objective
The objective of this research is to develop highly efficient LC-MS methods for
protein separations. The approach is to use modified submicrometer nonporous silica
particles as stationary phase to reduce the plate height of protein peaks. The low plate
height of protein peaks leads to high resolution, which enables the use of a shorter
column length for separation while still providing higher resolution. Therefore, the
analysis time is shortened in addition to resolution improving.
This study was conducted in three phases. The first phase is to improve and adapt
slip flow capillary column for LC-MS of proteins, then develop methods for a specific
group of proteins. Histones are chromatin proteins with double-stranded DNA wrapped
around. The post-translational modifications (PTMs) of histones are reported to relate to
various epigenetic diseases. In order to utilize histones PTMs as biomarker and develop
treatments for epigenetic diseases, high-resolution separation of histone variants is
essential for further study of the PTMs on histones. In this work, the first focus will be to
develop LC-MS methods for histones with the use of C18 slip flow capillary, which is
described in Chapter 3. The second phase is to demonstrate the capability of C18 slip
flow capillary on peptides separation due to the necessity of peptides separation as an

6
assay in drug development. Chapter 4 discussed the fundamental theory and the
experimental results of peptides separation. The last phase is to develop LC-MS methods
for other protein samples with masses ranging from 8 kDa to 150 kDa. Multiple kinds of
bonded phases are adapted for the separation of different samples. The separation of these
protein samples, including ubiquitin, RNA recognition motif (RRM2), reduced and intact
monoclonal antibodies (mAbs), is detailed in Chapter 5. In Chapter 6, the possibility of
packing longer columns and adding emitters at the end of capillary for future work is
discussed.

7
1.4 References
1. Otto, R., Santagostino, A. and Schrader, U., Rapid growth in biopharma: Challenges and opportunities. 2014, McKinsey & Co.
2. Gad, S.C. and I. ebrary, Handbook of pharmaceutical biotechnology. 2007,
Hoboken, N.J.: Hoboken, N.J. : Wiley-Interscience. 3. Sandra, P., Advances in Biopharmaceutical Analysis. LC-GC Europe, 2015: p. 6-
7. 4. Staub, A., et al., Intact protein analysis in the biopharmaceutical field. Journal of
Pharmaceutical and Biomedical Analysis, 2011. 55(4): p. 810-822. 5. Ren, D., et al., Reversed-phase liquid chromatography–mass spectrometry of site-
specific chemical modifications in intact immunoglobulin molecules and their fragments. Journal of Chromatography A, 2008. 1179(2): p. 198-204.
6. Zhang, T.Y., C. Quan, and M.W. Dong, HPLC for characterization and quality
control of therapeutic monoclonal antibodies.(PERSPECTIVES IN MODERN HPLC). LC-GC North America, 2014. 32(10): p. 796.
7. Chen, G., U. Mirza, and B. Pramanik, Macromolecules in Drug Discovery: Mass
Spectrometry of Recombinant Proteins and Proteomics, in Adv. Chromatogr.2009. p. 1-29.
8. Knudsen, G.M., Proteomics for Biological Discovery, 2007. p. 467-469. 9. Ohtsuki, S., Pharmacoproteomic Approach by Quantitative Targeted Proteomics,
in Yakugaku Zasshi-J. Pharm. Soc. Jpn.2012. p. 479-487. 10. Yoshida, M., Proteomics as a tool in the pharmaceutical drug design process.
Current Pharmaceutical Design, 2001. 7(4): p. 291. 11. Hachey, D.L. and P. Chaurand, Proteomics in reproductive medicine: the
technology for separation and identification of proteins. Journal of Reproductive Immunology, 2004. 63(1): p. 61-73.
12. Anderson, L., et al., Pharmaceutical proteomics. Electrophoresis, 2000. 21(11): p.
2095-2095. 13. Cagney, G., industrial proteomics: applications for biotechnology and
pharmaceuticals, 2005. p. 353-355.

8
14. van den Broek, I., Bioanalytical LC– MS/MS of protein-based biopharmaceuticals. Journal of Chromatography B: Analytical Technologies in the Biomedical & Life Sciences, 2013. 929: p. 161-180.
15. Cutler, P., Proteomics in pharmaceutical research and development. Biochemical
Society Transactions, 1999. 27(4): p. 555. 16. Fekete, S., J. Veuthey, and D. Guillarme, New trends in reversed-phase liquid
chromatographic separations of therapeutic peptides and proteins: Theory and applications, in J. Pharm. Biomed. Anal.2012. p. 9-27.
17. Erba, E.B., Investigating macromolecular complexes using top� down mass
spectrometry, 2014. p. 1259-1270. 18. Lanucara, F. and C.E. Eyers, Top� down mass spectrometry for the analysis of
combinatorial post�translational modifications, 2013: Hoboken. p. 27-42. 19. Armirotti, A. and G. Damonte, Achievements and perspectives of top� down
proteomics, C. Huber and L. Huber, Editors. 2010: Weinheim. p. 3566-3576. 20. Gregorich, Z.R. and Y. Ge, Top� down proteomics in health and disease:
Challenges and opportunities, 2014. p. 1195-1210. 21. Issaq, H.J., Application of Separation technologies to Proteomics Research.
Advances in Protein Chemistry, 2003. 65: p. 249-269. 22. Wild, D.G., The Immunoassay Handbook Theory and applications of ligand
binding, ELISA and related techniques. 4th ed.. ed. Immunoassay Handbook - Theory and Applications of Ligand Binding ELISA and Related Techniques. 2013, Burlington: Burlington : Elsevier Science.
23. Berkowitz, S.A., Analytical tools for characterizing biopharmaceuticals and the
implications for biosimilars. Nature Reviews Drug Discovery, 2012. 11(7): p. 527-541.
24. Challener, C.A., Emerging Analytical Technologies Advance Biopharma
Development. Pharmaceutical Technology Europe, 2016. 28(3): p. 16-20. 25. Desai, M.A., Downstream processing of proteins methods and protocols. 2000,
Totowa, N.J.: Totowa, N.J. : Humana Press. 26. Fekete, S. and D. Guillarme, Ultra-high-performance liquid chromatography for
the characterization of therapeutic proteins. Trends in Analytical Chemistry, 2014. 63: p. 76.
9
27. Hamdan, M., Proteomics today : protein assessment and biomarkers using mass spectrometry, 2D electrophoreses, and microaray technology, ed. M. Hamdan, et al. 2005, Hoboken, N.J.: Hoboken, N.J. : John Wiley & Sons.
28. Cielecka-Piontek, J., et al., UHPLC: The Greening Face of Liquid
Chromatography. Chromatographia, 2013. 76(21): p. 1429-1437. 29. de Villiers, A., et al., Evaluation of ultra performance liquid chromatography -
Part I. Possibilities and limitations. Journal Of Chromatography A, 2006. 1127(1-2): p. 60-69.
30. Hopfgartner, G., A. Lesur, and E. Varesio, Analysis of biopharmaceutical
proteins in biological matrices by LC- MS/ MS II. LC- MS/ MS analysis. Trends in Analytical Chemistry, 2013. 48: p. 52-61.
31. Bingchuan, W., Slip Flow in Colloidal Crystals for Ultraefficient
Chromatography. Journal of the American Chemical Society, 2012. 134(26): p. 10780-10783.
32. Birdsall, R.E., et al., A rapid on-line method for mass spectrometric confirmation
of a cysteine-conjugated antibody-drug-conjugate structure using multidimensional chromatography. mAbs, 2015. 7(6): p. 1036-1044.
33. Debaene, F., et al., Innovative native MS methodologies for antibody drug
conjugate characterization: High resolution native MS and IM-MS for average DAR and DAR distribution assessment. Analytical chemistry, 2014. 86(21): p. 10674.
34. Fekete, S., et al., Ion-exchange chromatography for the characterization of
biopharmaceuticals. Journal of Pharmaceutical and Biomedical Analysis, 2015. 113: p. 43-55.
35. Di Palma, S., et al., Zwitterionic hydrophilic interaction liquid chromatography
(ZIC- HILIC and ZIC-cHILIC) provide high resolution separation and increase sensitivity in proteome analysis. Analytical chemistry, 2011. 83(9): p. 3440.
36. Wang, P.G., Hydrophilic Interaction Liquid Chromatography (HILIC) and
Advanced Applications. Chromatographic Science, ed. W. He. 2011, Hoboken: Hoboken : Taylor and Francis.
37. Carr, S.A., Recent advances in the analysis of peptides and proteins by mass
spectrometry. Advanced Drug Delivery Reviews, 1989. 4(2): p. 113-147.

10
38. van de Merbel, N.C., Advances in Liquid Chromatography–Tandem Mass Spectrometry ( LC– MS– MS)-Based Quantitation of Biopharmaceuticals in Biological Samples. LC-GC Europe, 2015: p. 38-44.
39. McCarthy, S.M. and K. Yu, Multidimensional LC approaches for intact protein biopharmaceutical characterization. LCGC North America, 2012. 30(9): p. 834-840.
40. Nebija, D., et al., Quality Control and Stability Studies with the Monoclonal
Antibody, Trastuzumab: Application of 1D- vs. 2D- Gel Electrophoresis. International Journal of Molecular Sciences, 2014. 15(4): p. 6399-6411.
41. Alahmad, Y., et al., A new CZE method for profiling human serum albumin and
its related forms to assess the quality of biopharmaceuticals. Electrophoresis, 2011. 32(2): p. 292.
42. Al-Ghobashy, M., et al., CZE with On-line Micellar Sample Stacking for
Determination of Protein Concentration of Biopharmaceuticals. Chromatographia, 2011. 73(11): p. 1145-1153.
43. Birdsall, R.E., et al., Modeling of protein electrophoresis in silica colloidal
crystals having brush layers of polyacrylamide. ELECTROPHORESIS, 2013. 34(5): p. 753-760.
44. Sekhon, B., An overview of capillary electrophoresis: Pharmaceutical,
biopharmaceutical and biotechnology applications. Journal of Pharmaceutical Education and Research, 2011. 2(2): p. 2-36.
45. Meert, C., et al., Evaluation of pI Marker Sources for cIEF Characterization of a
Therapeutic Antibody.(Author abstract)(Report). Chromatographia, 2007. 66(11 12): p. 963.
46. Silvertand, L.H.H., et al., Development and characterization of cIEF�MALDI�
TOF MS for protein analysis. ELECTROPHORESIS, 2009. 30(10): p. 1828-1835.
47. Bush, D.R., et al., High Resolution CZE-MS Quantitative Characterization of
Intact Biopharmaceutical Proteins: Proteoforms of Interferon- 1. Analytical chemistry, 2016. 88(2): p. 1138.
48. Zhu, Z., J.J. Lu, and S. Liu, Protein separation by capillary gel electrophoresis: A
review. Analytica Chimica Acta, 2011.
11
CHAPTER 2: SUBMICROMETER PARTICLES FOR PROTEIN SEPARATION
Part of this Chapter is adapted from
B.A. Rogers, Z. Wu, B. Wei, X. Zhang, X. Cao, O. Alabi, M. J. Wirth, Anal. Chem.
2015, 87(5), 2520-2526
2.1 Nonporous Silica Particles
The efficiency of liquid chromatographic separations has continuously improved
over the last 2 decades, giving higher speed and resolution.[1, 2] Two advances have
contributed. The first is the use of porous particles as small as 1.7 μm, which reduces the
distance over which mass transport occurs. These smaller particles have necessitated
higher pressure pumps,[3] which ushered in the term “ultra-performance liquid
chromatography”, UHPLC. The other advance is the use of core shell particles, which
have a solid core having a thin shell of porous particles on the outside.[4] The fully
porous and the core shell particles are depicted schematically for comparison in Figure
1, showing that each is comprised of uniform, nonporous colloidal silica particles
aggregated to achieve the desired morphology. A shell thickness of half of 1.7 μm gives a
comparable advantage to that of the 1.7 μm fully porous particles but without the need for
the higher pressure pump. Sub-2-μm core shell particles give even higher efficiency,
with thinner shells giving higher speed and better resolution. The core shell particles

12
have been widely adopted by the pharmaceutical industry for analysis of small-molecule
drugs. Figure 2.1 also depicts a nonporous silica particle, and this article discusses how
nonporous particles promise a further advance when they are submicrometer in diameter.
As exciting as the sub-2-μm and core shell particles have been for separations of
small molecules, they do not fully address what is perhaps the most pressing need in
separations: proteins.[5] Protein drugs, particularly therapeutic monoclonal antibodies,
represent the fastest growing segment of the pharmaceutical industry.[6] Liquid
chromatography is indispensable for characterizing composition of small-molecule drug
substances, and for proteins the task is all the more difficult due to the multiplicity of
post-translational modifications, oxidation of methionine groups, disulfide scrambling,
fragmentation, aggregation, and other processes that change the protein sample. Top-
down proteomics is another area where better separations of intact proteins are needed[7]
because insufficient resolution requires multiple dimensions of separations. This chapter
explores why smaller particles and thinner shells have not impacted protein separations
more significantly than they have and how the nonporous submicrometer particles
2.2 Smaller Particle Size Reduces Plate Height
The gradual development of smaller particles and thinner shells has been guided
by the role these play is reducing the broadening of peaks. The van Deemter equation is a
simple way of describing this role. The plate height, H, is a measure of peak variance
normalized for separation length. Smaller H is thus better. The van Deemter equation is
expressed as H vs. velocity, , which is the mobile phase inside the separation medium.

13
2C2 2
A d p eecp
or s pdDH v Hv D
= + + +
The equation illustrates that smaller particle diameter, dp, gives a smaller plate
height by affecting both the first and third terms. Diffusion is described by the diffusion
coefficient, D. The term A is a measure of the radial heterogeneity of the packing density.
The term 2 D is referred to as the B term, where is the factor by which the diffusion
along the separation axis is obstructed by the solid particles, and D is the diffusion
coefficient. The term Cpores is the factor by which the diffusion in and out of the porous
medium is obstructed by the solid particles. There are also extra-column contributions,
e.g., the nonzero injection and detection volumes, the parabolic flow profile through the
tubing, and any broadening from the frits and the geometric effects of the column itself.
Two other C terms can contribute but are neglected. One is Cm, which results from the
parabolic flow profile between particles. It plays the same role with respect to particle
size as Cpores. The other is Cs, which is related to the desorption time of the analyte from
the stationary phase. These terms are left out because they usually give smaller effects
that would needlessly complicate the discussion of why smaller particle diameter reduces
broadening in liquid chromatography.
To illustrate how much can be gained from smaller particle diameter, or thinner
shell of a core shell particle, van Deemter plots for varying particle sizes are provided in
Figure 2.2 a for the case of small-molecule separations. The curves were generated by
fitting published van Deemter plots for 5 μm particles to recover A, B, and C.[8] The
synthetic curves show that the minimum plate heights are on the order of twice the
particle diameter, hence the advantage of smaller particles. The magenta line is the

14
projected curve for the hypothetical case of fully porous particles of 0.5 μm in diameter,
calculated using the Kozeny Carman equation.[9] While it reduces plate height by
another factor of 2, the pressure is unreachable. Current UHPLC instruments would give
a mobile phase velocity of less 0.2 cm/s for the 0.5 μm particles in a column of these
dimensions, thus giving no advantage over the 1.7 μm particles currently used. These
curves also depict the general behavior of core shell particles having shell thicknesses of
half the particle diameter. In other words, the diffusion distance for a 0.5 μm shell
thickness is equivalent to a 1 μm fully porous particle. The shell can be arbitrarily thin
without adding to the pump pressure, but ultimately, the surface area of the stationary
phase would give insufficient retention. It should be noted again that equation to generate
these curves does not include any broadening from the instrument, Hec, in eq 1, and it
does not include slow kinetics of desorption that might occur with some samples. The
curves suggest that current technology is approaching the optimum for both porous and
core shell particles in separations of small molecules; little is to be gained in going with
smaller diffusion distances.
For proteins, the picture is changed markedly because of the much larger
molecular size of the protein, slowing the diffusion by an order of magnitude. Synthetic
van Deemter curves for a protein with a 10-fold slower diffusion coefficient than the
small-molecule are shown in Figure 2.2 b. The optimal flow rate is now much lower,
giving a potentially huge advantage in using 0.5 μm particles. The achievable pressure of
modern instruments, which is 17500 psi, would give a velocity of 0.05 cm/s for 0.5 μm
particles and these column dimensions, resulting in about a 5-fold smaller plate height.
For core shell particles, a shell thickness of 0.25 μm is projected to give this same
15
advantage, and longer column lengths could be used because back-pressure is much less
of an issue.
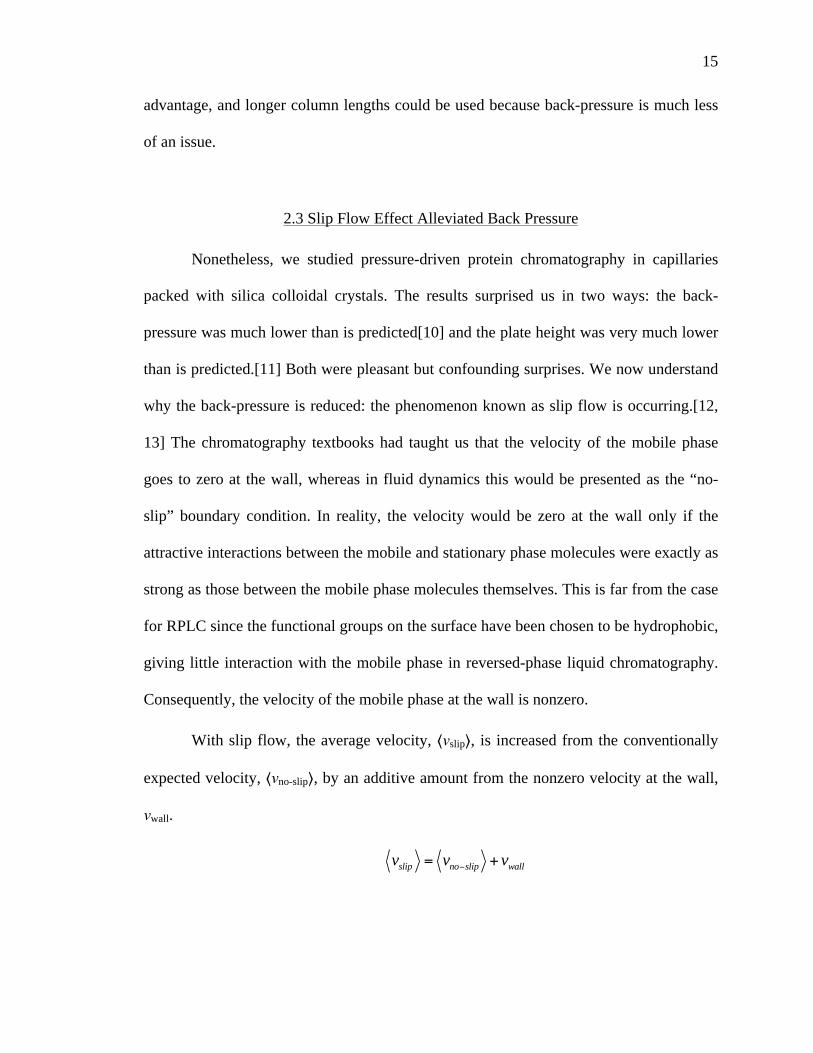
2.3 Slip Flow Effect Alleviated Back Pressure
Nonetheless, we studied pressure-driven protein chromatography in capillaries
packed with silica colloidal crystals. The results surprised us in two ways: the back-
pressure was much lower than is predicted[10] and the plate height was very much lower
than is predicted.[11] Both were pleasant but confounding surprises. We now understand
why the back-pressure is reduced: the phenomenon known as slip flow is occurring.[12,
13] The chromatography textbooks had taught us that the velocity of the mobile phase
goes to zero at the wall, whereas in fluid dynamics this would be presented as the “no-
slip” boundary condition. In reality, the velocity would be zero at the wall only if the
attractive interactions between the mobile and stationary phase molecules were exactly as
strong as those between the mobile phase molecules themselves. This is far from the case
for RPLC since the functional groups on the surface have been chosen to be hydrophobic,
giving little interaction with the mobile phase in reversed-phase liquid chromatography.
Consequently, the velocity of the mobile phase at the wall is nonzero.
With slip flow, the average velocity, slip , is increased from the conventionally
expected velocity, no-slip , by an additive amount from the nonzero velocity at the wall,
wall.
slip no slip wallv v v= +

16
This additive relation is illustrated in Figure 2.3 a. Note that the velocity profile is
parabolic profile for both the slip and no-slip cases and that there is simply an additive
term in the slip case due to the velocity at the wall. For the case depicted in Figure 2.3 a,
the average velocity is a factor of 4 higher than that for the no-slip case. Because the
parabolic profiles are the same for the slip and no-slip cases, the relative velocity
distribution is narrower for the slip case.
Submicrometer particles can give high flow enhancements because of the nonzero
wall velocity. Figure 2.3 b shows the experimentally measured flow enhancements for a
wide variety of particle diameters, ranging from 0.12 to 1.3 μm, all for nonporous
particles with C4 bonded phases and a mobile phase of water.[9] The data show that the
flow rate enhancement depends on particle diameter, and the enhancement becomes small
for particle diameters about a micrometer. This may seem perplexing at first because the
wall velocity is related to the fluid surface interactions, not the particle size. In fact, the
wall velocity is the same regardless of particle size, but wall velocity has a bigger impact
on the overall flow rate when the velocity in the middle of the stream is smaller.
Consequently, slip flow is only noticed when the walls are very close together. The
relation between interstitial dimension and flow enhancement is described
mathematically by the geometry depicted in Figure 2.3 a, where a tangent is drawn to the
parabola at the fluid surface boundary. This tangent is (d /dr)wall, and the red triangle in
the figure shows that this is the ratio of the velocity at the wall to the so-called slip
length, Ls.
wall
wall s
ddr L
=
17
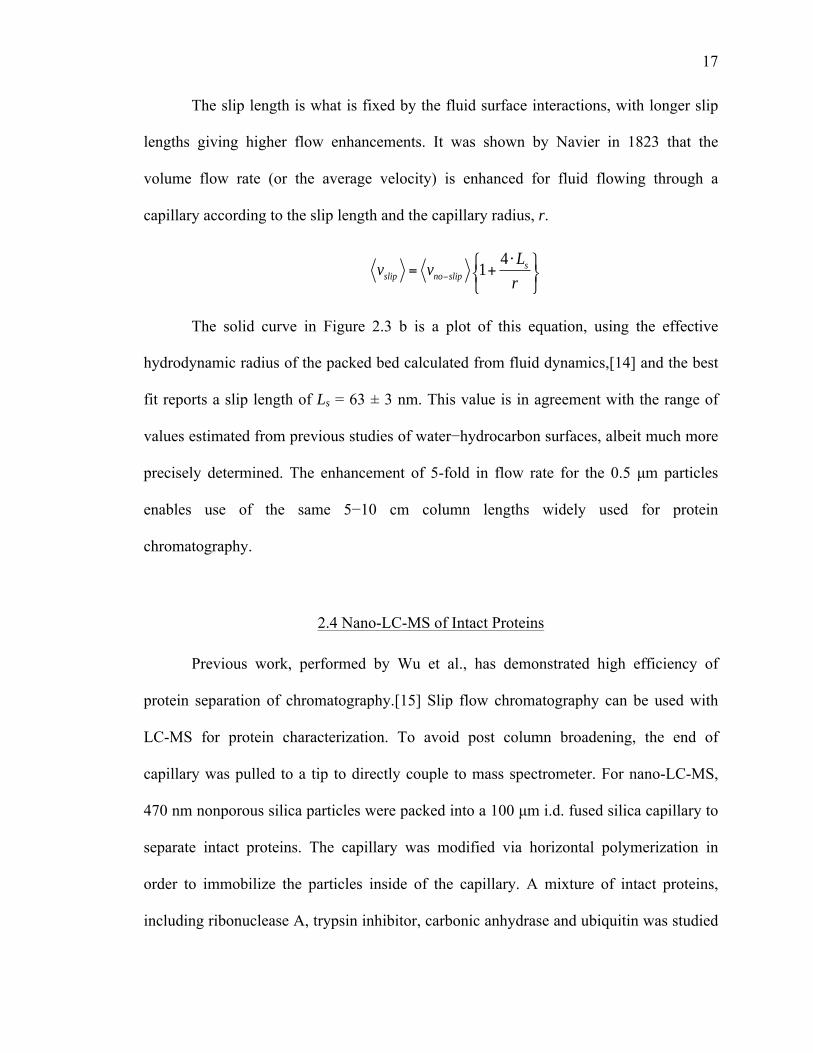
The slip length is what is fixed by the fluid surface interactions, with longer slip
lengths giving higher flow enhancements. It was shown by Navier in 1823 that the
volume flow rate (or the average velocity) is enhanced for fluid flowing through a
capillary according to the slip length and the capillary radius, r.
41 sslip no slip
Lv v
r= +
The solid curve in Figure 2.3 b is a plot of this equation, using the effective
hydrodynamic radius of the packed bed calculated from fluid dynamics,[14] and the best
fit reports a slip length of Ls = 63 ± 3 nm. This value is in agreement with the range of
values estimated from previous studies of water hydrocarbon surfaces, albeit much more
precisely determined. The enhancement of 5-fold in flow rate for the 0.5 μm particles
enables use of the same 5 10 cm column lengths widely used for protein
chromatography.
2.4 Nano-LC-MS of Intact Proteins
Previous work, performed by Wu et al., has demonstrated high efficiency of
protein separation of chromatography.[15] Slip flow chromatography can be used with
LC-MS for protein characterization. To avoid post column broadening, the end of
capillary was pulled to a tip to directly couple to mass spectrometer. For nano-LC-MS,
470 nm nonporous silica particles were packed into a 100 μm i.d. fused silica capillary to
separate intact proteins. The capillary was modified via horizontal polymerization in
order to immobilize the particles inside of the capillary. A mixture of intact proteins,
including ribonuclease A, trypsin inhibitor, carbonic anhydrase and ubiquitin was studied

18
as a standard protein sample. Results showed the fast speed and narrow peak widths of
proteins. With a 10 min gradient, a peak capacity of 195 was obtained by a 4 cm capillary.
Besides peak capacity, high sensitivity and reproducibility were also achieved. The
injection amounts were as low
as 1 fmol while high signal to noise ratio was still shown for the mass spectra of proteins,
and all protein peaks showed less than 0.3% RSD for peak width. [15] This high
efficiency of protein separation indicates the potential of using slip flow capillary on top
down proteomics.
2.5 Instrument Contribution to Protein Separation
Most chromatographic columns are commercialized in stainless steel format for
UV visible detection. This format is widely used for quality control in the
pharmaceutical industry because most organic drugs impurities will give absorbance at
210 nm. Further, not all impurities are detectable by mass spectrometry, and UV
detection gives better quantitative reproducibility. Capillaries have short path lengths,
limiting the sensitivity of UV detection. This raises the question of whether one can gain
any advantage with submicrometer particles in stainless steel columns. The best UHPLC
instruments contribute approximately 10 μL in dispersion volume, giving a 5.6 mm base
width for a 2.1 mm i.d. column. This is enormous compared to the broadening from
capillaries. The comparison is summarized visually in Figure 2.4 to illustrate how much
is lost in going from capillaries to stainless steel columns. Contributions from the
instrument include the parabolic flow profile through the tubing and the detector volume.
19
Since columns do contribute broadening beyond the instrument contribution due to
packing heterogeneity, the homogeneity of packed submicrometer particles could still
have an impact. NanoLC instruments might begin competing in this arena since
sensitivity is greatly enhanced from less peak broadening. The short path length across a
capillary could be fully offset by the
narrower peak width to give comparable sensitivity. Given the potential for such higher
resolution without sacrificing sensitivity of UV absorbance, nanoLC might have a bright
future in UHPLC.

20
2.6 References
1. Fekete, S., D. Guillarme, and M.W. Dong, Superficially porous particles: perspectives, practices, and trends.(PERSPECTIVES IN MODERN HPLC). LC-GC North America, 2014. 32(6): p. 420.
2. Fekete, S., J. Veuthey, and D. Guillarme, New trends in reversed-phase liquid
chromatographic separations of therapeutic peptides and proteins: Theory and applications, in J. Pharm. Biomed. Anal.2012. p. 9-27.
3. Macnair, J., K. Lewis, and J. Jorgenson, Ultrahigh-pressure reversed-phase liquid
chromatography in packed capillary columns. Analytical Chemistry, 1997. 69(6): p. 983-989.
4. Destefano, J.J., T.J. Langlois, and J.J. Kirkland, Characteristics of superficially-
porous silica particles for fast HPLC: some performance comparisons with sub-2-microm particles. Journal of chromatographic science, 2008. 46(3): p. 254.
5. Zhang, T.Y., C. Quan, and M.W. Dong, HPLC for characterization and quality
control of therapeutic monoclonal antibodies.(PERSPECTIVES IN MODERN HPLC). LC-GC North America, 2014. 32(10): p. 796.
6. An, Z. and I. Wiley, Therapeutic monoclonal antibodies from bench to clinic.
2009, Hoboken, N.J.: Hoboken, N.J. : John Wiley & Sons. 7. Xiu, L., et al., Effective Protein Separation by Coupling Hydrophobic Interaction
and Reverse Phase Chromatography for Top-down Proteomics. Anal. Chem., 2014. 86(15): p. 7899-7906.
8. de Villiers, A., et al., Evaluation of ultra performance liquid chromatography -
Part I. Possibilities and limitations. Journal Of Chromatography A, 2006. 1127(1-2): p. 60-69.
9. Rogers, B.J. and M.J. Wirth, Slip flow through colloidal crystals of varying
particle diameter. ACS Nano, 2013. 7(1): p. 725-731. 10. Schure, M.R., Simulation of ordered packed beds in chromatography. Journal Of
Chromatography. A, 2004. 1031(1-2): p. 79. 11. Majors, R.E., Erratum to Column Watch (LCGC North Am., (2013), 31, 4 (280-
298)). LCGC North America, 2013. 31(7): p. 537. 12. Xingcai, Q., Measurement of the Rate of Water Translocation through Carbon
Nanotubes. Nano Letters, 2011. 11(5): p. 2173-2178.

21
13. Wu, Z., Insights from theory and experiments on slip flow in chromatography. Journal Of Separation Science, 2013. 36(12): p. 1871.
14. Bird, R.B., Transport phenomena. Rev. 2nd ed.. ed, ed. W.E. Stewart and E.N.
Lightfoot. 2007, New York: New York : J. Wiley. 15. Wu, Z., Intact protein separations by using slip flow with nano-liquid
chromatography-mass spectrometry, J.W. Mary, Editor 2014, Purdue University.

22
Figure 2.1. Schematic depiction of the three common particle morphologies used in chromatography.


25
Figure 2.4. Illustration of how much broadening is currently imparted by commercial instruments. These are plots of Gaussians to help visualize (1) the 64 μm base width for no instrument contribution vs (2) the 400 μm base width in typically images observed using a nanoLC for injection with MS for detection vs (3) the 2.5 mm base width calculated for the current best-performing UHPLC instrument with a 5.5 μL dispersion volume, considering no contribution from the column. All base widths are for peaks inside the medium.
26
CHAPTER 3: LC-MS OF INTACT HISTONES USING SLIP FLOW CHROMATOGRAPHY
3.1 Introduction
Histones, including core histones (H2A, H2B, H3 and H4) and linker histones
(H1), are basic chromosomal proteins that are involved in many physiological processes
mostly through its post-translational modifications (PTMs).[1, 2] These PTMs, which
chiefly include phosphorylation, methylation, acetylation and ubiquitination,[3] can work
individually or in concert to generate a ‘histone code’ that participates in the regulation of
various cellular responses such as gene transcription and DNA repair.[1, 4, 5] Recent
studies showed that the levels of histone PTMs can be correlated to different stages of
cancer.[6, 7] Therefore, understanding the function and mechanism of histones PTMs
could benefit early diagnosis and treatment for various diseases. However, the analysis of
PTMs in intact histones is difficult due to the large number of histone variants that may
differ by only a few amino acid sequences.[2] On the other hand, conventional methods
such as bottom-up proteomics risk losing PTMs information in the digestion processes.[8,
9] Therefore, characterization of intact histones is essential to fully understand and utilize
histone PTMs as biomarkers for cancer diagnosis.
Top-down proteomics has been proven to be an effective method for intact
histones analysis because one must characterize multiple PTMs on the same protein.[9,
10] Kelleher and coworkers discovered 42 forms of H4 histones through the use of an

27
offline RPLC-HILIC-FTMS.[11] With RPLC-MS, Su et al. completed the profiling of
whole histones and the PTMs including methylation and acetylation.[12] Contrepois et al.
developed a method to characterize core histone variants and PTMs in 20 min via RPLC-
LTQ-Orbitrap.[13] However, owing to the poor chromatographic resolution of histone
variants, these LC-MS methods suffer from laborious fractionation and long analysis
time. Methods that use a faster gradient to reduce analysis tine would otherwise sacrifice
the resolution and increase the complexity of mass spectra. Hence, higher efficiency of
separations are desired for intact histones in top-down proteomics.
With uniformly packed 0.5 μm silica nanoparticles, slip flow chromatography has
significantly advanced the efficiency of intact protein separations via reduced particle
size and slip flow enhancement.[14-16] The purpose of this work is to test whether this
advance benefits top-down proteomics analysis of intact histones.
3.2 Material and Methods
3.2.1 Materials
HPLC grade water, acetonitrile, formic acid, TFA, DFA and histones from bovine
calf thymus were purchased from Sigma-Aldrich (St. Louis, MO, USA). 0.5-μm bare
silica particles were purchased from Superior Silica (Temple, AZ). Methyltrichlorosilane
(C1) and Octadecyltrichlorosilane (C18) were from Gelest (Morrisville, PA).
Phosphorylated histone H1 sample was extracted from MDA-MB-231 cells treated with
nocodazole.

28
3.2.2 Capillary with Packed Silica Colloidal Crystals
The capillary for separation was prepared as follows.[15] Briefly, 0.5-μm bare
silica particles (Superior Silica, Temple, AZ) were calcined at 600 °C for 10 hours for
three times and then annealed at 1050 °C for 3 hours. The annealed particles were
rehydroxylated in 0.1 M nitric acid for 3 hours and then suspended in water to form the
slurry with 30% wt. concentration. Empty capillary (Polymicro, Phoenix, AZ) was
washed by 0.1 M NaOH for 1 hour and rinsed by distilled water for 10 min. The slurry
was injected to the empty capillary by a syringe and then packed with a high-pressure
pump under sonication. The packed capillaries were vertically placed until dry. For
surface modification, the dry capillaries were put into a humidity chamber at 50%
humidity for an hour, then transferred into 20 mL dry toluene with 2% C1 and 16% C18
for 5 hours. These modified capillaries were washed by dry toluene to remove free silane,
and put in 120 °C oven for 4 hours. A P-2000 laser tip puller (Sutter instruments, Novato,
CA) was used to pull the end of capillaries.
3.2.3 NanoLC-MS and LC-MS of Histone
A separation of histones was performed using a Thermo Dionex Ultimate 3000
nano-UHPLC coupled to a Thermo LTQ Velos mass spectrometer. A Supleco
Discovery C18 column (1 mm* 15 cm, 5 m, 300 Å) was purchased from Supelco (St.
Louis, MO) and used for comparison. The experiments with the Discovery column were
performed using a Thermo Accela UHPLC and the above-mentioned mass spectrometer.

29
Mobile phases A and B were water and acetonitrile, respectively. Two sets of
modifiers were used: the first was 0.5% formic acid and 0.02% TFA and the second was
0.1% DFA. The gradient started at 1% B for 2 min, then increased from 20% to 65% B in
20 min and was maintained at 70% B for 1 min, and then re-equilibrated back at 1% B
for 8 min to prepare for the next injection. Flow rate was varied from 30 nL/min to 150
nL/min. For the phosphorylated H1 separation, the gradient was run from 30% B to 40%
B over 20 min, and the flow rate was fixed at 100 nL/min.
For nanoLC-MS, analytes were directly sprayed from the tip of capillary to the
mass spectrometer. For LC-MS, analytes were ionized via ESI. Spray voltage was kept at
2.4 kV for both nanoLC-MS and LC-MS. All spectra were obtained under positive ion
mode over the mass range from 500 to 2000 m/z. The deconvolution of all mass spectra
was performed with MagTran 1.0 software.
3.2.4 LC Separation of Histones
Histones for LC separation were from the same stock sample as was used in the
nano-LC-MS experiments. An Agilent 300SB core-shell column was used for evaluating
the acidic modifiers for the histone separations. These separations were performed on a
Waters I-Class UPLC (Milford, MA) and detected by UV absorbance spectroscopy.
Water and acetonitrile were used as mobiles phase A and B, respectively. Three sets of
acid modifiers were used for comparison: 0.1% TFA, 0.5% FA and 0.02% TFA, and 0.1%
DFA. Gradient was from 25 to 50% B in 60 min. Flow rate was kept at 0.067 mL/min in
order to have the same average retention factor. Column temperature was 30 °C.
30
Wavelength of UV detection was 210 nm for the solvent with 0.1% TFA and 0.1% DFA,
and 280 nm for the solvent with 0.5% FA and 0.02% TFA.
3.3 Results and Discussion
RPLC of proteins requires an acidic modifier to minimize peak tailing, and
histones are especially sensitive to acid modifiers because their high abundances of
lysines invite interactions with silanols. The modifier best for RPLC is trifluoroacetic
acid (TFA), whereas the best modifier for efficient electrospray is 0.5% formic
acid/0.02% TFA. For LCMS, the high surface activity of TFA leads to ineffective spray
formation during ESI, resulting in inadequate sensitivity.[17] Formic acid give lower
chromatographic resolution due to its high pKa.[18] A compromise is difluoroacetic acid
(DFA), which has a lower pKa than formic acid and less surface activity than TFA.[19]
To gauge how much chromatographic efficiency is at stake in selecting the modifier,
RPLC with UV detection was used for the histone separation. The use of UV detection
avoids issues in the electrospray process in assessing the chromatographic resolution.
Figure 1 compares the chromatograms for the three different modifiers in the separation
of the histones: A) 0.1% acid (TFA), B) 0.5% formic acid (FA) plus 0.02% TFA, and C)
0.1% DFA. All three modifiers easily allow the H1 histones, which are peaks 1 and 2, to
be separated. The TFA modifier allows close to baseline resolution of the core histones,
which are peaks 3-7. The other modifiers give distinctly lower resolution and more peak
tailing, as expected from their lower acidities. For FA+TFA, only three core histone
peaks are resolved, instead of five. For DFA, four of the five core histone peaks are
resolved, with the fifth peak appearing as a shoulder. DFA is thus a reasonable

31
compromise, as the results show that only half of the resolution is lost in going from TFA
to DFA.
The peaks in the chromatograms of Figure 1A were identified by collecting
fractions from the chromatograph, exchanging the 0.1% TFA for 0.5% formic acid, and
directly electrospraying into the mass spectrometer. The mass spectra and deconvoluted
mass spectra for all seven peaks are provided in the supporting information. Table 1
provides a summary of the assignments. Except for peak 4, the peaks are mixtures of
histones with differing molecular weights, but these are similar enough to be attributed to
post-translational modifications. Hence, peak 3, for example, is assigned to a mixture of
post-translational modifications of the core histone H2B. The one exception is peak 7,
whose molecular weight is ambiguous: it can either be H2A or H3. Some post-
translational modifications give separable species, e.g., peaks 5 and 6 are both from H2A.
Subscripts are designated to facilitate referring to these in the discussions.
The gradient for LC separation of the histones by the slip flow capillary was
optimized by varying the gradient time for a fixed flow rate of 100 nL/min. This flow rate
corresponds to a linear velocity of 0.7 mm/s, which is sufficiently slow for good
efficiency in protein separations. For gradient elution, it is the ratio of the gradient time,
tG, to the column dead time, t0, that is optimized to give an average retention factor, k*,
for the analyte as it travels through the column. [20]
(1) 0
1*1.15 %
Gtkt B S
=
Optimal gradients are expected to be those that have k* between 1 and 10. The gradient
was for 25% to 50% acetonitrile, giving a gradient range, , of 25%. The parameter S is

32
the slope of log(k) vs. , which depends on the protein. For lysozyme, which is also a
strongly basic protein, S~25 (REF DOI 10.1016/S0021-9673(01)96400-3), which would
estimate that gradient lengths of 10 to 85 min would give k* in the range of 1 to 10 for
histones. Figure 2 shows the chromatograms for varying gradient time from 10 min to 60
min for the slip flow capillary. The peak intensities change with gradient time, which is
likely due to bias in the electrospray. Based on the widths of the largest peak in the
chromatograms, gradients longer than 10 min give better resolution, which is consistent
with the estimate. For the gradients of 20, 40 and 60 min, longer gradients give somewhat
better resolution, but this is offset by the lower S/N. The 20 min gradient is the choice for
overall optimal performance and speed.
To reference the results with those of a commercial column, separations were also
performed with a commercial microbore column, Supelco Discovery, which has been
used for histone proteomics. [1] As with the slip-flow capillary, the Discovery column
also has a C18 bonded phase. The particles are 5 μm in diameter and fully porous, with
300 Å pore size. For gradient optimization, since the column is three-fold longer (15 cm),
for the same linear flow rate as the slip flow column, the gradient time needs to be three-
fold longer. The inner diameter is ten-fold larger: 1 mm i.d., compared to 100 μm i.d. for
the slip flow capillary, thus necessitating 100x more moles injected for comparison of
equivalent conditions. The chromatogram for the case of equal tG/t0 and mobile phase
velocity, and equivalent injected amount, is shown in Figure 3A. The chromatogram
shows that fewer peaks are observed. This could be a consequence of the electrospray
interface using a two-fold wider diameter orifice. It is important to note that the flow rate
can be made higher for the commercial column because of its lower resistance to flow.

33
Higher flow rate gives a higher value of tG/t0, which is potentially advantageous since
resolution improves with (tG/t0)1/2. There is an optimum because higher flow rate will
eventually decrease the plate number due to the mass transport term. To explore the
optimum, higher flow rates, 25 and 50 μL/min, were studied for the 60 min gradient, and
the chromatograms are shown in Figure 3B and 3C. The values of tg/t0 for these
chromatograms in comparison to the slip flow chromatograms as well as mobile phase
velocities, are summarized in Table 2, showing that these two chromatograms have linear
flow rates exceeding that of the slip flow column by 2x and 4x, and that tG/t0 exceeds that
of the slip flow column also by 2X and 4x. The result shows that resolution is negligibly
affected by either flow rate or the variations in tG/t0.
Before exploring a detailed comparison, it is worth checking both the dependence
of the chromatograms of loading and the reproducibility of the chromatograms. This is
important since the number of peaks change when gradient conditions change. Figure 4
shows chromatograms for varying amounts injected. Equivalent amounts are injected into
the respective columns, as they have 100x different cross-sectional areas. For both
columns, more peaks are evident as the injected amount is increased. Again, this is likely
from the nonlinearity of the electrospray process.
Figure 5 shows replicate chromatograms for the two types of columns. The time
axes have small shifts for both chromatograms, perhaps from the imprecision of the flow
controls of each of the two chromatographs. The intensities also vary, as expected in
using electrospray. Nonetheless, the differences among the replicates for a given column
are smaller than the differences between columns, allowing a comparison. The gradient
optimization had shown that there are different peaks for different gradient conditions,

34
whereas Figure 5 shows that a given gradient exhibits a set number of peaks and relative
peak heights. Both are sufficiently reproducible for comparisons to be made.
In studying column efficiency, any effect of partial overlap of peaks on the
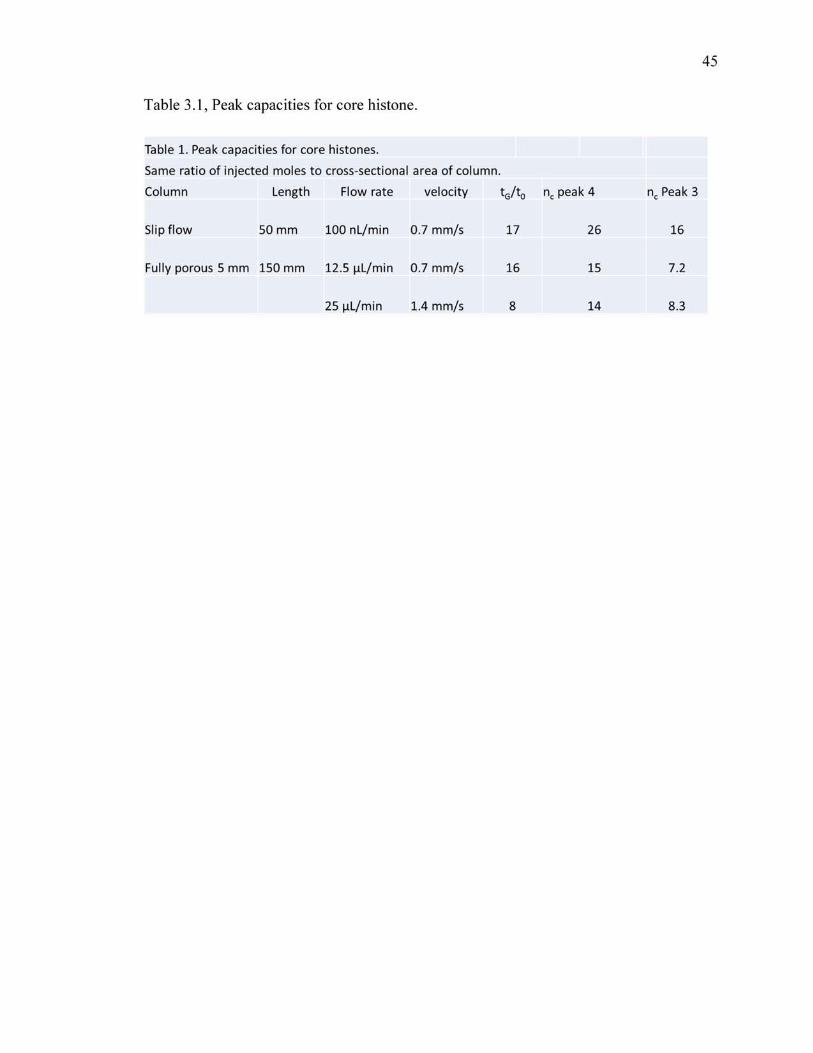
apparent peak capacity can be decreased by comparing extracted ion chromatograms.
Figure 6 shows a comparison of the extracted ion chromatograms for the slip flow
column for a 20 min gradient with tG/t0 =17 and the commercial column for a 60 min
gradient and tG/t0=16. The peaks labeled 3 and 4, were fit to Gaussian to determine the
standard deviations, and these were used to calculate the local peak capacities for just the
core histones. , which are x and y for the slip flow and commercial column, and the
range of retention times for the peaks from H2B2 to H2A3, the peak capacity is Z fold
higher for the slip flow column. Further, Figure 6 shows that the width of the H4 peaks
for the slip flow column is limited by the smoothing algorithm used to reduce
electrospray noise, whereas this is not a limitation for the commercial column since it is
broader. Specifically, the standard deviation of the H4 peak for the slip flow column is
1.56 s while the standard deviation of the smoothing function is 1.13 s, thus giving a 50%
increase in the peak width. Considering this broadening, the peak capacity for the slip
flow column is actually Z1 fold higher than the commercial column. Regardless of
whether the smoothing is taken into account, the slip flow column delivers higher
resolution in addition to the three-fold faster separation time.
3.4 Concluding Remarks
Separation efficiency was studied for histones using a slip-flow capillary column
with sub-0.5 μm nonporous silica particles for LCMS. The slip flow column gives both
35
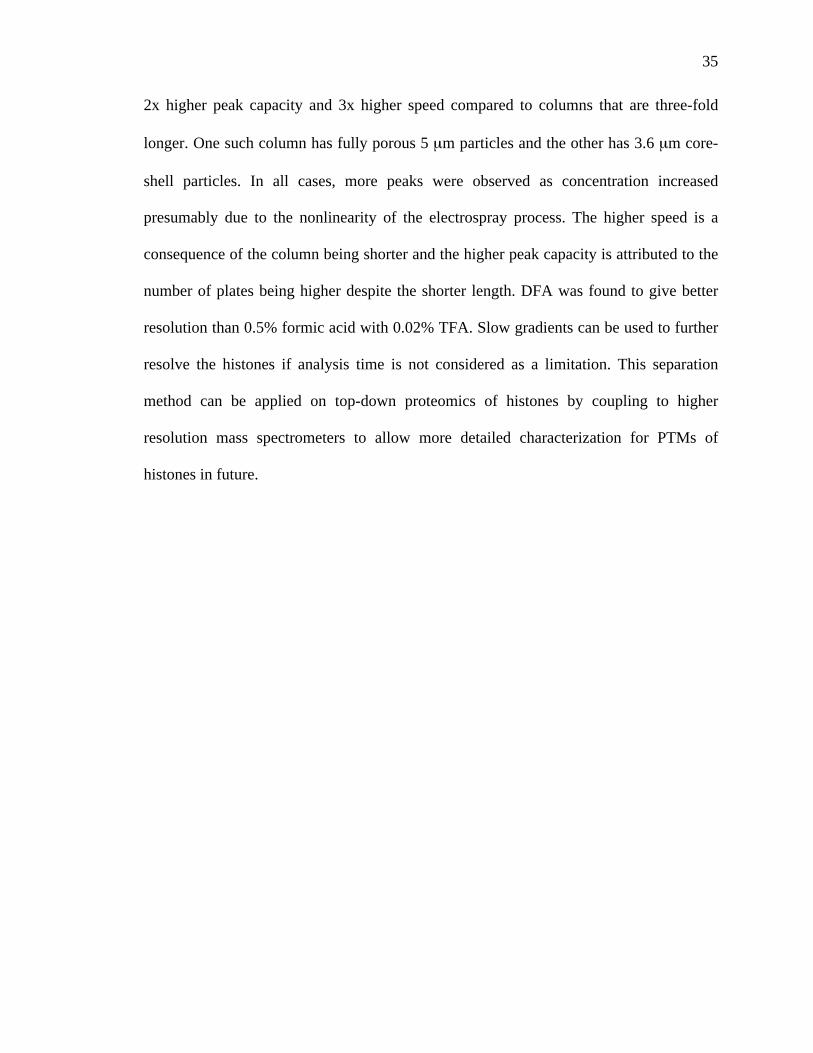
2x higher peak capacity and 3x higher speed compared to columns that are three-fold
longer. One such column has fully porous 5 μm particles and the other has 3.6 μm core-
shell particles. In all cases, more peaks were observed as concentration increased
presumably due to the nonlinearity of the electrospray process. The higher speed is a
consequence of the column being shorter and the higher peak capacity is attributed to the
number of plates being higher despite the shorter length. DFA was found to give better
resolution than 0.5% formic acid with 0.02% TFA. Slow gradients can be used to further
resolve the histones if analysis time is not considered as a limitation. This separation
method can be applied on top-down proteomics of histones by coupling to higher
resolution mass spectrometers to allow more detailed characterization for PTMs of
histones in future.

36
3.5 References
1. Strahl, B.D., Allis, D. D., The language of covalent histone modifications. Nature, 2000. 403(6765): p. 41-45.
2. Biterge, B., and Schneider, J.J. , Histone variants: key players of chromatin. Cell
Tissue Res, 2014. 356: p. 457–466. 3. Thorslund, T., Ripplinger, A., Hoffmann, S., Wild, T., Uckelmann. M.,
Villumsen, B., Narita, T., Sixma, T. K., Choudhary, C., Bekker-Jensen, S., and Mailand, N., Histone H1 couples initiation and amplification of ubiquitin signalling after DNA damage. Nature, 2015. 527: p. 389-393.
4. Jenuwein, T.a.A., C. D., Translating the Histone Code. Science, 2001. 293(5532):
p. 1074-1080. 5. Kurat, C., Recht, J., Radovani, E., Durbic, T., Andrews, B., and Fillingham, J,
Regulation of histone gene transcription in yeast. Cellular and Molecular Life Sciences, 2014. 71(4): p. 599-613.
6. Telu, K.H., Abbaoui, B., homas-Ahner�, J. M., Zynger, D. L., Clinton�, S. K.,
Freitas, M. A. and Mortazavi, A., Alterations of histones H1 phosphorylation during bladder carcinogenesis. J. Proteome Res., 2013. 12(7): p. 3317–3326.
7. Harshman, S.W., Hoover, M. E., Huang, C., Branson, O. E., Chaney, S. B.,
Cheney, C. M., Rosol, T. J., Shapiro, C. L., Wysocki, V. H., Huebner, K., and Freitas, M. A., Histone H1 phosphorylation in breast cancer. J. Proteome Res., 2014. 13(5): p. 2453-2467.
8. Garcia, B.A., Mollah, S., Ueberheide, B.M., Busby, S.A., Muratore, T.L.,
Shabanowitz, J., and Hunt, D.F., Chemical derivatization of histones for facilitated analysis by mass spectrometry. Nat Protoc. , 2007. 2(4): p. 933-938.
9. Moradian, A., Kalli, A., Sweredoski, M. J. and Hess. S., The top-down, middle-
down, and bottom-up massspectrometry approaches for characterization of histonevariants and their post-translational modifications. Proteomics, 2014. 14: p. 489–497
10. Britton, L.M., Gonzales-Cope, M., Zee, Z. M., and Garcia, B. A., Breaking the
histone code with quantitative mass spectrometry. Expert Rev. Proteomics, 2011. 8(5): p. 631–643.

37
11. Pesavento, J.J., Bullock C.R., LeDuc, R.D., Mizzen, C.A., Kelleher, N.L., Combinatorial modification of human histone H4 quantitated by two-dimensional liquid chromatography coupled with top down mass spectrometry. J. Biol. Chem., 2008. 283(22): p. 14927-14937.
12. Su, X., Jacob, N. K., Amunugama, R., Lucas, D. M., Knapp, A. R., Ren, C.,
Davis, M. E., Marcucci, G., Parthun, M. R., Byrd, J. C., Fishel, R., and Freitas, M. A., Liquid chromatography mass spectrometry profiling of histones. Journal of Chromatography B, 2007. 850(1-2): p. 440–454.
13. Contrepois, K., Ezan, E., Mann, C., and Fenaille, F., Ultra-high performance
liquid chromatography-mass spectrometry for the fast profiling of histone post-translational modifications. J. Proteome Res., 2010. 9(10): p. 5501–5509.
14. Wei, B., Rogers, B. J., and Wirth, M. J., Slip flow in colloidal crystals for
ultraefficient chromatography. J. Am. Chem. Soc., 2012. 134(26): p. 10780-10782.
15. Wu, Z., Wei, B., Zhang, X., and Wirth, M. J., Efficient separations of intact
proteins using slip-flow with nano-liquid chromatography-mass spectrometry. Anal. Chem., 2014. 86(3): p. 1592-1598.
16. Rogers, B.A., Wu, Z., Wei, B., Zhang, X., Cao, X., Alabi, O., and Wirth, M. J.,
Submicrometer particles and slip flow in liquid chromatography. Anal. Chem., 2015. 87(5): p. 2520–2526.
17. Eshraghi, J.a.C., S. K., Factors affecting electrospray ionization of effluents
containing trifluoroacetic acid for high-performance liquid chromatography/mass spectrometry. Anal. Chem., 1993. 65(23): p. 3528-3533.
18. You, J., Wang, L., Saji, M., Olesik, S. V., Ringel, M.D., Lucas, D.M., Byrd, J.C.,
and Freitas, M.A., High-sensitivity TFA-free LC-MS for profiling histones. Proteomics, 2011. 11(16): p. 3326-3334.
19. Boyes, B.E., Libert, B.P., Schuster, S.A., and Kirkland, J.J. , Submitted to J.
Chromatogr. A.
20. Snyder, L.R., Kirkland, J.J., and Dolan, J.W., Introduction to Modern Liquid Chromatography. 2010, Hoboken, New Jersey, Wiley.


46
CHAPTER 4: NANO-LC-MS OF PROTEIN DIGESTS USING NONPOROUS SUBMICRON PARTICLES
4.1 Introduction
LC-MS of peptides has been widely used as an assay for protein identification in
both proteomic research and pharmaceutical industry.[1, 2] The difficulty of intact
protein characterization is reduced by using enzyme digestion and LC-MS or LC/MS/MS
on the digested protein sample. By comparing the detected mass spectra with the
signature peptides of proteins in the database, intact proteins can be identified. However,
proteins sample might contain more than 1000 peptides after tryptic digestion.[3] The
large number of peptides results in co-elution, which taxes the analysis by the mass
spectrometer. More efficient separation of peptides would increase the number of
proteins identified.
Peak capacity is one of the criteria to evaluate the separation of peptides.[4, 5] It
represents the theoretical number of peaks that can be separated in a certain analysis time.
Higher peak capacity of peptides means more proteins can be identified.[6] Various
strategies, such as increased separation length and analysis time, have been used to
increase peak capacity for peptides separation.[7-12] With a 200 cm long column, Shen
et al. achieved a peak capacity of 1000-1500 using a 2000 min gradient.[13] Long
columns with monolithic structure or core-shell particles were also developed to increase
the peak capacity in peptides separation. [14-19] De Vos used a 2.6 um core-shell column

47
and obtained peak capacity of 1360 with 480 min gradient and 1200 bar operating
pressure.[20] All these methods provided high peak capacity for peptides separation.
However, the long analysis time used in these methods to achieve high peak capacity
makes it less desirable for routine use. High efficiency and speed of peptides separation is
desired.
In the previous chapter, slip flow chromatography had shown faster and more
efficient separation of histones and other intact proteins due to the smaller, orderly
packed particles and the horizontally polymerized bonded phase.[21-23] The current
chapter discusses the application of slip flow chromatography on peptides separation. In
this work, 500 nm silica particles were packed into a 150 μm i.d. capillary and modified
to generate a C18 bonded stationary phase, with a pulled tip to directly couple to the mass
spectrometer. Bovine serum albumin (BSA) tryptic digest and HeLa cell lysate tryptic
digest were used as samples to test the ability of slip flow column for complexed sample
separation.
4.2 Material and Methods
4.2.1 Materials
0.5-μm nonporous silica particles were purchased from Superior Silica (Temple,
AZ). HPLC grade water, acetonitrile, formic acid and trifluoroacetic acid were purchased
from Sigma-Aldrich (St. Louis, MO). Trypsin digested bovine serum albumin was from

48
Waters Corporation (Milford, MA). HeLa cell digest was purchased from Life
technologies.
4.2.2 Preparation of Capillaries
The capillary was prepared as described previously.[22] Briefly, 0.5-μm
nonporous silica particles were calcined at 600 °C three time and annealed at 1050 °C
once, followed by rehydroxylation with 0.1 M nitric acid at 250 °C. The rehydroxylated
particles were suspended in water to form a 30% wt. slurry. After overnight sonication,
the slurry was injected into a 150 μm i.d. fused silica capillary (Polymicro, Phoenix, AZ)
which had been rinsed by 0.1 M NaOH and water previously. With a high-pressure
pump, the capillary was packed with ethanol under sonication. After dry, a match was
used to burn the polyamide coating of capillary off near the end of packed bed. A
monolayer of C18 bonded phase was put onto the silica by dipping capillary in 20 mL
toluene with 2% Methyltrichlorosilane and 8% Octadecyltrichlorosilane (Gelest,
Morrisville, PA) for 5 hours. The modified capillary was rinsed with toluene and placed
in 120 °C oven until dry. The end of capillary was pulled by a P-2000 laser tip-puller
(Sutter instruments, Novato, CA) in order to couple to mass spectrometer.
4.2.3 Measurement of Diffusion Coefficient in Mobile Phase
A 1.5-kDa synthesized peptide was used in the experiment. The peptide for
measurement was purchase from AnaSpec (Fremont, CA). The measurement was
performed on a Thermo Dionex Ultimate 3000 nanoLC and detected by a fluorescence
49
microscopy. The procedures of measurement were as follows. At 100 nL/min mobile
phase flow rate, the peptide was injected to the capillary in 1% acetonitrile and eluted at
50% acetonitrile. The length from the head of capillary column to detection window was
4 cm. When the peptide peak appeared on the middle of detection window, the flow was
stopped for varying amounts of time to allow diffusion of peptides. Incubation time and
widths of peptide peak were recorded for linear fitting and calculation. After 100 s, the
flow was started again to elute the peptide peak from capillary.
4.2.4 NanoLC-MS of Peptide Separation
Peptides were separated with Thermo Dionex Ultimate 3000 nano-UHPLC and
ionized via electrospray ionization before entering a Thermo LTQ Velos mass
spectrometer. HPLC grade water and acetonitrile with 0.5% formic acid and 0.02% TFA
were used as mobile phase A and B, respectively. The gradient conditions for both BSA
digest and HeLa cell digest were as below. Acetonitrile in mobile phase was held at 1%
for 2 min, and then increased from 1% to 40% in 17 min for fast gradient and 34 min for
slow gradient, followed by increasing to 70% in 2 min and decreasing to 1% in 1 min.
Then the capillary was equilibrated at 1% acetonitrile for 8 min. The flow rate was kept
at 200 nL/min. The electrospray ionization of peptides was performed at 2.5 kV spray
voltage under positive ion mode. The mass range of detection was set as 400-2000 m/z.

50
4.2.5 Measurement of Diffusion Coefficient on Stationary Phase
The peptide from AnaSpec (Fremont, CA) was used for measurement. The
polyamide coating at end of a C18 capillary was burned off to allow fluorescence
detection. After equilibrating with 1% acetonitrile, the capillary was dipped into the
peptide sample for 10 seconds for diffusion injection. The injection band was imaged
every 2 min to record peak widths. Then the solvent composition was changed to 50%
mobile phase B to elute the peptides. The measurement was also performed at 5%, 10%
and 15% mobile phase B to compare the diffusion on stationary phase under different
solvent conditions.
4.3 Results and Discussion
For chromatographic separation, the plate height H, is usually described by van
Deemter equation as a function of mobile phase velocity (v):
�
In this equation, A term is eddy diffusion that depends on the particle size and
packing quality of column. The second term, longitudinal diffusion, is determined by the
mobile phase velocity and obstructed diffusion coefficient of analyte ( D) in the mobile
phase. The last term is resistance to mass transfer, while dP is particle size and w is a
constant. Our group has demonstrated that the A term is negligible resulting from small
particle size and homogeneous packing of stationary phase. [24] However, the
broadening from longitudinal diffusion still remains unknown for peptide separation.
51
To calculate how much the longitudinal diffusion term contributes to total plate
height, the obstructed diffusion coefficient of peptides in mobile phase was measured.
Based on the peak widths of peptides and incubation time after stopping the mobile phase
flow, the diffusion coefficient can be calculated by the equation
�
As shown in figure 4.1 (A), the change of peak width variance ( 2) linearly
increased with the incubation time (t). As a result of the linear fitting, the obstructed
diffusion coefficient of peptides was found to be 6.19 10-7 cm2/s. The longitudinal
diffusion contribution to plate height, HB, was calculated to be 347�52 nm based on
above equation.
The plate height can be expressed as a function of peak variance ( 2) and
separation length (L):
In a separation length of 3.5 cm, the plate height was 277�74 nm for this peptide
peak, given the initial peak width was 98 μm. Therefore, the total plate height was almost
entirely contributed by the longitudinal diffusion, which means that the separation was
limited by peptide diffusion. To minimize diffusion, the mobile phase flow rate for the
peptide separation was kept at 200 nL/min, which is the maximum flow rate due to the
pressure limit of LC instrument.
TFA is the most widely used mobile phase modifier in chromatography due to its
excellent ion-pairing ability. However, with the commonly used concentration (0.1%),
52
the high surface tension of TFA suppresses the MS signal. Formic acid is commonly used
to replace TFA in online LC-MS applications. However, the commonly used
concentration (0.1%) of formic acid can cause peak tailing and poor chromatographic
resolution. To study the influence of modifier concentration on peptides separation,
mobile phases with different percentage of formic acid and TFA were tested for peptides
separation to achieve the highest resolution.
Figure 4.2 showed the separation of BSA tryptic digests by using 0.1% formic
acid, 0.5% formic acid, 0.5% formic acid/0.02% TFA, and 0.5% formic acid/0.04% TFA.
Generally speaking, the resolution of peptides was increased as the acid concentration
was increased, especially for the two peaks labeled in blue rectangle. However, the
addition of TFA in mobile phase decreased the S/N (signal to noise ratio) of the
chromatogram. Intensity of the most abundant peak was dropped from 6.0 106 to 1.6 106
and 1.2 106 while adding 0.02% and 0.05% TFA in 0.5% formic acid. As a compromise,
0.5% formic acid and 0.02% TFA was used as acid modifier for the following
experiments.
With the optimized mobile phase, slip flow capillary was applied to the separation
of a BSA tryptic digest for the calculation of peak capacity. Peak capacity represents the
theoretical number of peaks that can be separated in a certain long gradient. Here we use
this equation to define peak capacity PC:
In this equation, tf and ti are the retention time for the last and first eluted peaks,
so tf - ti is the length of eluting window of peptides. Term w is the base width of the

53
narrowest baseline resolved peak. In figure 4.3 (A), with a 17 min gradient, half widths of
the peaks were as small as 2 s. The separation and Gaussian fitting of the peaks at
expanded scales showed the narrowest peak was only 0.9 s for half width, resulting in a
peak capacity of 380. The peak capacity per min was calculated to be 33, which was
higher compared to other works using similar gradient time. Similarly, with a 34 min
gradient, the peak capacity was calculated to be 500. This high peak capacity
demonstrated the efficient and fast separation of peptides by slip flow capillaries.
In order to pursue higher peak capacity, a longer gradient is necessary. One factor
needs to be considered while using a long gradient is the possible diffusion of peptides on
the stationary phase. The measurement of diffusion coefficient of peptides on stationary
phase was described in 4.2.5. According to the results (figure 4.4), the diffusion
coefficient on stationary phase was found to be 9 10-11 cm2/s, which is three orders of
magnitude smaller than in mobile phase. This gives a negligible percentage of peak
broadening as long as tG exceeds t0 by less than a factor of 1,000. For a 60 min gradient,
the width caused by broadening on stationary phase for the last eluted peak would be
only 8 μm, which is about 1/40 of the overall peak width.
The slow diffusion on stationary phase enables the separation by longer gradients
for peptide separations. A more complex sample, the tryptic digest of a HeLa cell lysate,
was used for separation with a longer gradient. For the separation with 17 min gradient,
the peak capacity was 380, which was similar to previous BSA tryptic digests separation.
With a four times longer gradient, more peaks were found in the 68 min separation. The
narrowest peak was only 0.96 s for half width, which leads to a peak capacity of 1400.

54
This high peak capacity is partly attributed to the new peaks being baseline resolved by
the use of the long gradient.
4.4 Concluding Remarks
In this chapter, the application of slip flow capillary on peptide separations was
discussed. The measurement of the obstructed diffusion coefficient of a peptide in mobile
phase showed that the separation was limited by peptide diffusion. A peak capacity of
380 was obtained in a 17 min gradient for protein tryptic digests. For a 68 min gradient,
the peak capacity was increased to 1400, which is sufficient for routine separation of
peptide samples. The further increase of peak capacity would require either a longer
gradient or a faster flow rate since the diffusion of peptides in mobile phase can be
reduced via the increase of linear mobile phase velocity. One can expect that the peak
capacity will be further enhanced in the future with an instrument that has higher pressure
limit.
55
4.5 References
1. Hachey, D.L. and P. Chaurand, Proteomics in reproductive medicine: the technology for separation and identification of proteins. Journal of Reproductive Immunology, 2004. 63(1): p. 61-73.
2. Camerini, S., The role of protein and peptide separation before mass
spectrometry analysis in clinical proteomics. Journal of Chromatography A, 2015. 1381: p. 1-13.
3. Eeltink, S., et al., Optimizing the peak capacity per unit time in one-dimensional
and off-line two-dimensional liquid chromatography for the separation of complex peptide samples. Journal of Chromatography A, 2009. 1216(44): p. 7368-7374.
4. Neue, U., Theory of peak capacity in gradient elution. Journal Of
Chromatography A, 2005. 1079(1-2): p. 153-161. 5. Gilar, M., BioSuite™ Peptide Analysis Columns: Importance of Peak Capacity on
Complex Peptide Separations. LC-GC Europe, 2004. 17: p. 19-21. 6. Fairchild, J., et al., Correlation between peak capacity and protein sequence
coverage in proteomics analysis by liquid chromatography-mass spectrometry/mass spectrometry. Journal Of Chromatography A, 2010. 1217(29): p. 4779-4783.
7. Sarrut, M., Optimization of conditions in on-line comprehensive two-dimensional
reversed phase liquid chromatography. Experimental comparison with one-dimensional reversed phase liquid chromatography for the separation of peptides. Journal of Chromatography A, 2015. 1421: p. 48-60.
8. Wang, H., et al., An off-line high pH reversed-phase fractionation and nano-
liquid chromatography–mass spectrometry method for global proteomic profiling of cell lines. Journal of Chromatography B, 2015. 974: p. 90-95.
9. Wang, X., et al., Peak capacity optimization of peptide separations in reversed-
phase gradient elution chromatography: Fixed column format. Analytical Chemistry, 2006. 78(10): p. 3406-3416.
10. Hsieh, E., et al., Effects of Column and Gradient Lengths on Peak Capacity and
Peptide Identification in Nanoflow LC-MS/MS of Complex Proteomic Samples. J. Am. Soc. Mass Spectrom., 2013. 24(1): p. 148-153.
56
11. Lauber, M.A., High-Resolution Peptide Mapping Separations with MS-Friendly Mobile Phases and Charge-Surface-Modified C18. Analytical Chemistry, 2013. 85(14): p. 6936-6945.
12. Liu, H., et al., Effects of column length, particle size, gradient length and flow
rate on peak capacity of nano-scale liquid chromatography for peptide separations. Journal of Chromatography A, 2007. 1147(1): p. 30-36.
13. Shen, Y., Automated 20 kpsi RPLC-MS and MS/MS with Chromatographic Peak
Capacities of 1000-1500 and Capabilities in Proteomics and Metabolomics. Analytical Chemistry, 2005. 77(10): p. 3090-3101.
14. Luo, Q., Preparation of 20-μm-i.d. Silica-Based Monolithic Columns and Their
Performance for Proteomics Analyses. Analytical Chemistry, 2005. 77(15): p. 5028-5036.
15. Liang, Y., Recent advances in monolithic columns for protein and peptide
separation by capillary liquid chromatography. Analytical & Bioanalytical Chemistry, 2013. 405(7): p. 2095-2107.
16. Rogeberg, M., et al., High efficiency, high temperature separations on silica
based monolithic columns. Journal of Chromatography A, 2011. 1218(41): p. 7281-7288.
17. Marchetti, N. and G. Guiochon, High peak capacity separations of peptides in
reversed-phase gradient elution liquid chromatography on columns packed with porous shell particles. Journal of Chromatography A, 2007. 1176(1): p. 206-216.
18. Schuster, S.A., et al., Fast high performance liquid chromatography separations
for proteomic applications using Fused-Core.sup.[R] silica particles.(Report). Journal of Chromatography A, 2012. 1228: p. 232.
19. Van de Meent, M.H.M., Improvement of the liquid-chromatographic analysis of
protein tryptic digests by the use of long-capillary monolithic columns with UV and MS detection. Analytical & Bioanalytical Chemistry, 2007. 388(1): p. 195-201.
20. De Vos, J., High-resolution separations of tryptic digest mixtures using core–
shell particulate columns operated at 1200bar. Journal of Chromatography A, 2012. 1264: p. 57-63.
21. Rogers, B.A., Submicrometer Particles and Slip Flow in Liquid Chromatography.
Analytical Chemistry, 2015. 87(5): p. 2520-2527.

57
22. Wu, Z., Intact protein separations by using slip flow with nano-liquid chromatography-mass spectrometry, J.W. Mary, Editor 2014, Purdue University.
23. Bingchuan, W., Slip Flow in Colloidal Crystals for Ultraefficient
Chromatography. Journal of the American Chemical Society, 2012. 134(26): p. 10780-10783.
24. Wei, B., D.S. Malkin, and M.J. Wirth, Plate Heights below 50 nm for Protein
Electrochromatography Using Silica Colloidal Crystals. Anal. Chem., 2010. 82(24): p. 10216-10221.


63
CHAPTER 5: APPLICATIONS OF SLIP FLOW CHROMATOGRAPHY ON INTACT PROTEINS
5.1 Ubiquitin Characterization
This project is an ongoing collaboration with Prof. Chittaranjan Das.
Ubiquitin plays an important role in many biological processes.[1-3] Proteins can
be linked to ubiquitin from multiple sites of lysine or arginine groups. By binding to
substrate proteins, ubiquitin can regulate various cellular responses, such as protein
degradation[4] and DNA repair[5-7]. This binding process is called ubiquitination.
Common ubiquitination includes three steps: activation, conjugation and ligation, with
the corresponding enzymes as E1, E2 and E3.[8, 9] Recently, it was reported that one
enzyme (SdeA) from infectious bacterium, legionella pneumophioa can catalyze the
ligation of ubiquitin and protein substrate without ATP or enzymes like E1 and E2.[10,
11, 19] The linker and pathway between ubiquitin and these proteins still remain
unknown. One hypothesis is a two-step pathway from ubiquitin to ubiquitin-protein
complex. First, the ubiquitin goes through ADP-ribosylation at Arg-42 to form an
intermediate ubiquitin-ADP-Ribose (Ub-ADPR) under enzyme catalysis. The second step
is the reaction between Ub-ADPR and a nucleophilic acceptor on a side chain of the
substrate protein. To confirm this pathway, LC-MS of the intact protein would reveal the
mass of the linker. A mass difference of 954 Da between Ubiquitin and ubiquitin-ADP-

64
Ribose would be a confirmation for the first step of this pathway. The purpose of this
work is to determine the masses of the intact ubiquitin, the intermediate ubiquitin-ADP-
Ribose, and the ubiquitin-linker-protein complex by using LC-MS with slip flow
chromatography. [12, 13]
Using a 5-cm C18 slip flow capillary, two peaks for an ubiquitin sample was
resolved in a 10 min gradient (figure 5.1). The first peak (Ub-1) has a mass of 8587 Da,
and the second peak (Ub-2) has a mass of 8571 Da. By comparing with the calculation
results, Ub-1 was attributed to either a colonial fragment or addition of a water molecule.
Using the same separation method for the ubiquitin-linker complex (Ub-ADPR), the
results showed two peaks in the chromatogram (Figure 5.2). The prolonged retention time
of Ub-ADPR indicates increased hydrophobicity upon adding the linker to ubiquitin. In
each chromatographic peak, two species were found based on the mass spectra and
deconvoluted mass spectra. The mass of 9525 Da confirmed the linker mass to be
Ubiquitin-ADPR, which is consistent with the hypothetic mass of ubiquitin-ADPR.
Similarly, the mass of 9542 could be due to water molecular addition to Ubiquitin-
ADPR. Rab 33 is selected to be the substrate protein as a proof of concept. Next step of
experiment is to characterize the Rab33 and Rab33-linker-ubiquitin complex. By
subtracting the mass of Ubiquitin-ADPR and Rab33 from Rab33-linker-ubiquitin
complex, the molecular weight of the linker can be calculated.

65
5.2 Separation of RRM2 Monomer and Dimer
This project was collaborated with Prof. Nikolai Skrynnikov.
RRM protein is a RNA binding platform that plays important role in regulating
post-translational gene expression.[14, 15] RRM2, or RNA recognition motif 2, is an 8.7
kDa polypeptide that belongs to the RRM protein family.[16-18] NMR is a common
method to study RRM proteins. Previous study showed peak distortion and disappearance
of NMR spectrum for hydrogen peroxide treated RRM2. One possibility is the
dimerization of RRM2. Under the presence of hydrogen peroxide, the one cysteine on the
surface of RRM2 is possible to react with the cysteine on another RRM2 protein and
form a dimer. Therefore, the NMR spectrum would be different compared to the RRM2
monomer. To test this hypothesis, RPLC-MS is applied to the separation of both
controlled and hydrogen peroxide treated sample.
Using nano-LC-MS, three sets of samples were analyzed, including the controlled
sample, 1-hour H2O2 treated RRM2 sample and 24-hour H2O2 treated RRM2 sample.
With a C18 slip flow capillary, more than 10 monomer and dimer peaks were separated
for all samples. In figure 5.3, the RRM2 sample without any treatment showed one most
abundant monomer peak with the mass of 8705 Da. There were also six other monomer
peaks and one dimer peak (peak 8). The intensity of the dimer peak was quite low
compared to the monomers. Two other peaks with the mass of 11.7 kDa (peak 9 and 10)
were eluted after the dimer peak, which could be the fragments of the dimer. Similarly,
the RRM2 sample with 1 hour H2O2 treatment showed 6 monomer peaks, 1 dimer peak
and 2 fragment peaks. However, only small amount of dimer was found in H2O2 treated
sample, while major fraction still remained as monomer (figure 5.4). To further study

66
whether H2O2 treatment can cause dimerization of RRM2, the third set of sample, RRM2
with 24-hour H2O2 treatment were tested. In figure 5.5, both the number and intensity of
dimer peaks were increased compared to previous results, while the relative intensity of
monomer peaks was decreased. This supports the hypothesis that dimerization of RRM2
is caused by H2O2 treatment. However, the RRM2 used in NMR study was treated by
H2O2 for only one hour, which only contained a small amount of dimer. To conclude,
although H2O2 treatment can cause dimerization of RRM2, it was not the main reason of
the attenuation of NMR spectrum.

67
5.3 References
1. Husnjak, K. and I. Dikic, Ubiquitin-Binding Proteins: Decoders of Ubiquitin-Mediated Cellular Functions, in Annu. Rev. Biochem.2012. p. 291-322.
2. Komander, D. and M. Rape, The Ubiquitin Code, in Annu. Rev. Biochem.2012. p.
203-229. 3. Smith, H.T., Ubiquitin, 1988. p. 787. 4. De, A., Ubiquitin chains : degradation and beyond. 2015: Cham : Springer. 5. Helchowski, C.M., A small ubiquitin binding domain inhibits ubiquitin-dependent
protein recruitment to DNA repair foci. Cell Cycle (Georgetown, Tex.), 2013. 12(24): p. 3749.
6. Thorslund, T., Histone H1 couples initiation and amplification of ubiquitin
signalling after DNA damage. Nature, 2015. 527(7578): p. 389. 7. Ulrich, H.D., Timing and spacing of ubiquitin-dependent DNA damage bypass.
FEBS Letters, 2011. 585(18): p. 2861-2867. 8. Martin, S., N. Ulrike, and M.H. Jon, Protein ubiquitination involving an E1– E2–
E3 enzyme ubiquitin thioester cascade. Nature, 1995. 373(6509): p. 81. 9. Yihong, Y., Building ubiquitin chains: E2 enzymes at work. Nature Reviews
Molecular Cell Biology, 2009. 10(11): p. 755-765. 10. Qiu, J., et al., Ubiquitination independent of E1 and E2 enzymes by bacterial
effectors. Nature, 2016. 533(7601): p. 120. 11. Shigi, N., Posttranslational modification of cellular proteins by a ubiquitin-like
protein in bacteria. The Journal Of Biological Chemistry, 2012. 287(21): p. 17568.
12. Rogers, B.A., Submicrometer Particles and Slip Flow in Liquid Chromatography.
Analytical Chemistry, 2015. 87(5): p. 2520-2527. 13. Wu, Z., Intact protein separations by using slip flow with nano-liquid
chromatography-mass spectrometry, J.W. Mary, Editor 2014, Purdue University. 14. Crawford, D.W., An Evolved RNA Recognition Motif That Suppresses HIV-1
Tat/TAR-Dependent Transcription. ACS Chemical Biology, 2016.
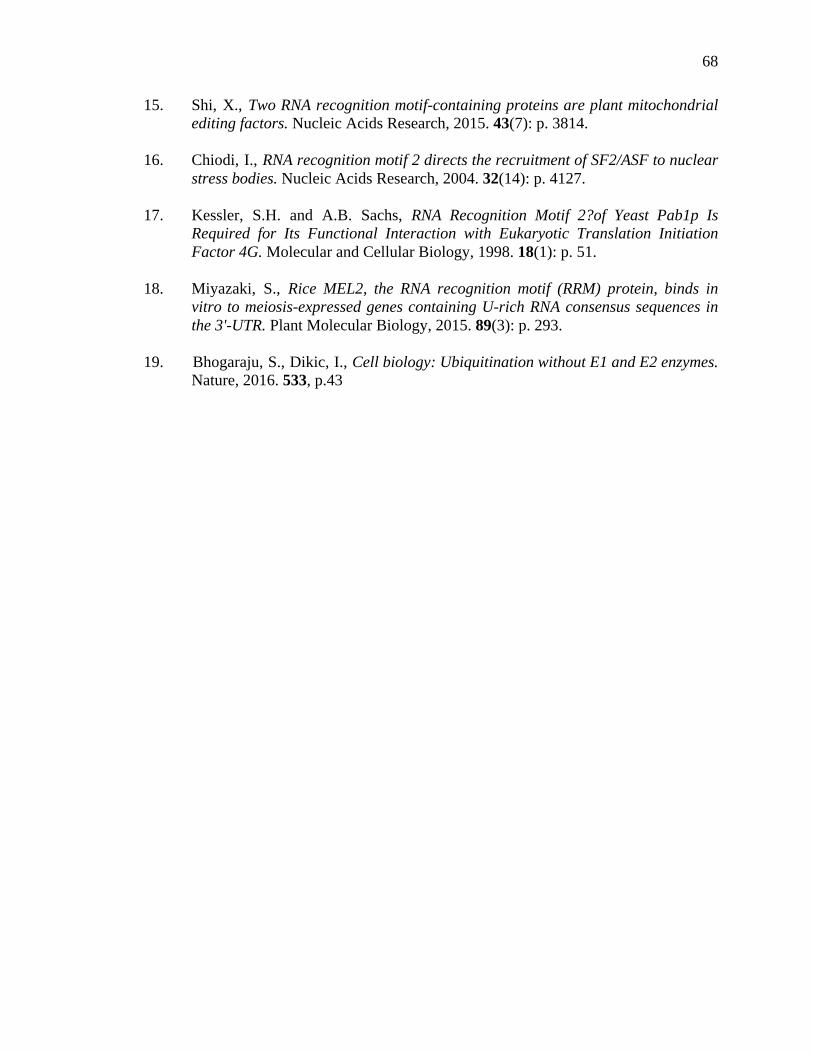
68
15. Shi, X., Two RNA recognition motif-containing proteins are plant mitochondrial editing factors. Nucleic Acids Research, 2015. 43(7): p. 3814.
16. Chiodi, I., RNA recognition motif 2 directs the recruitment of SF2/ASF to nuclear
stress bodies. Nucleic Acids Research, 2004. 32(14): p. 4127. 17. Kessler, S.H. and A.B. Sachs, RNA Recognition Motif 2?of Yeast Pab1p Is
Required for Its Functional Interaction with Eukaryotic Translation Initiation Factor 4G. Molecular and Cellular Biology, 1998. 18(1): p. 51.
18. Miyazaki, S., Rice MEL2, the RNA recognition motif (RRM) protein, binds in
vitro to meiosis-expressed genes containing U-rich RNA consensus sequences in the 3'-UTR. Plant Molecular Biology, 2015. 89(3): p. 293.
19. Bhogaraju, S., Dikic, I., Cell biology: Ubiquitination without E1 and E2 enzymes.
Nature, 2016. 533, p.43
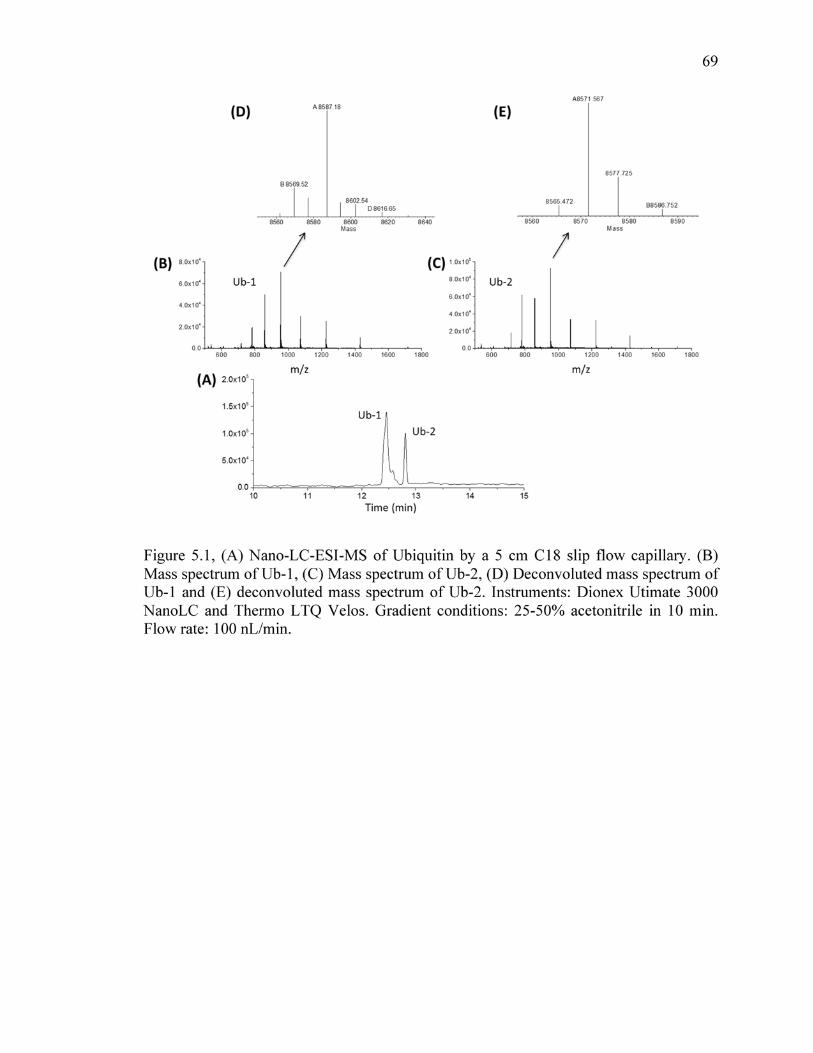

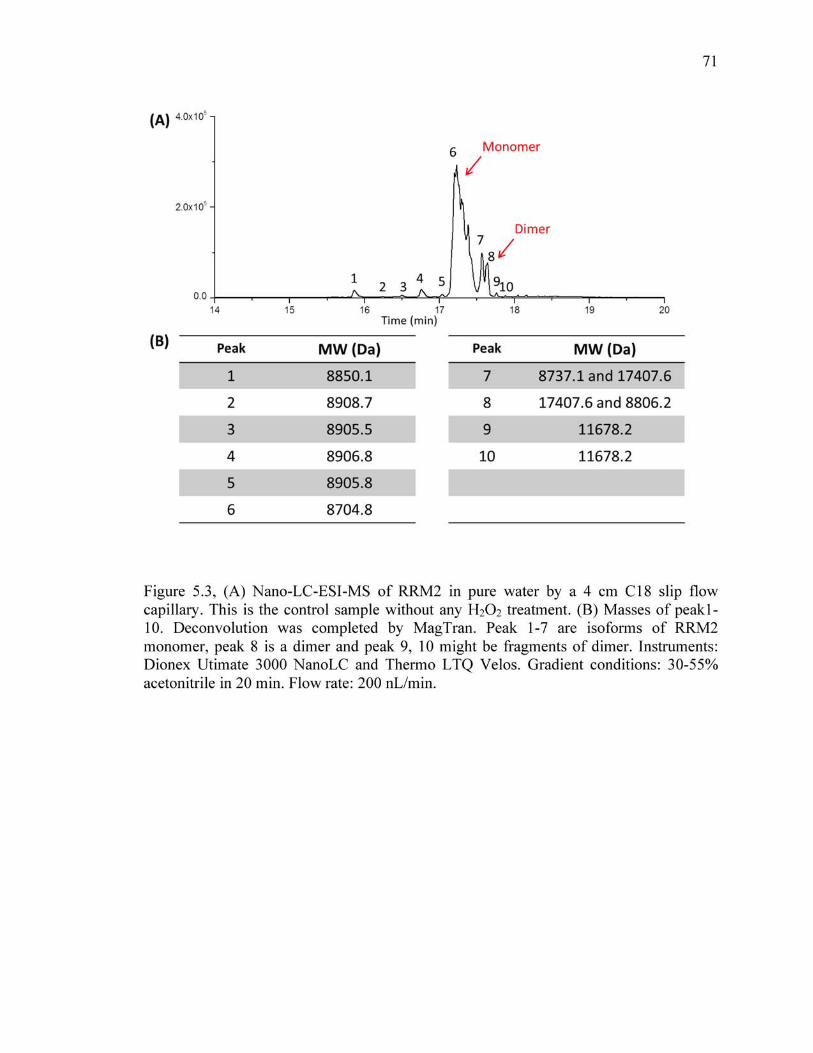


74
CHAPTER 6: CONCLUSION AND FUTURE DIRECTION
6.1 Conclusion
This dissertation discussed the development of both technology and methods of
protein separation using slip flow chromatography. Slip flow chromatography is based on
the stationary phase of nonporous submicrometer silica particles. The small particle size
reduces eddy diffusion and resistance to mass transfer while nonporous particles
eliminate the intra-particle diffusion. Slip flow effect reduces the back pressure of using
small particles and enables the usage of commercial UHPLC instruments.
With slip flow chromatography, the capillary with C18 bonded phase was
successfully applied on LC-MS of intact proteins. One application of slip flow capillary
is the separation of histones. Histones are basic proteins to form nucleosomes. The PTMs
on histones participate in regulating biological processes and correlate to different stages
of multiple cancers. The separation of histones can promote the characterization of
histone PTMs with top-down proteomics, and therefore help understanding the
mechanisms of histone PTMs for diagnosis and treatment of diseases. With a 5 cm C18
slip flow capillary, resolution of histones was greatly enhanced compared to commercial
columns. The analysis time of using slip flow capillary was three times shorter while the
peak capacity was twice higher than commercial column at the same k* condition. High
efficiency was also achieved when applying slip flow capillary on peptides separation.

75
With a 17 min gradient, a peak capacity of 380 was reached for the mixture of BSA
peptides. By changing the silane reagents to form the horizontal polymer surfaces,
different selectivity was developed for the separation of other protein samples, such as
monoclonal antibodies. Using a column with TDP bonded phase, comparable resolution
was obtained for IgG1 separation compared to commercial core-shell column. Other
bonded phases, such as C4, can be also used for intact and reduced antibody separation.
This dissertation also discussed the application of slip flow capillary on other intact
proteins, such as ubiquitin and RRM2. These LC-MS results demonstrate the high
efficiency of intact protein separation by using slip flow capillary.
6.2 Future Direction
6.2.1 Histones Separation
Slip flow capillary provides high resolution and sensitivity of histones in short
analysis time. However, the presence of the large number of variants in each histones
family and PTMs on different histones makes the analysis of histone PTMs very
complicated.[1-4] In order to obtain detailed PTM information for each individual
histone, resolution of histones separation needs to be further enhanced.
One way to achieve higher resolution is to decrease the gradient slope[5], and also
the flow rate at the same time in order to keep the k* constant.[6] The resolution among
the peaks might be different because the C term is different for each type of histones.
Overall, the resolution will increase as the gradient time increases.[7] To illustrate, a
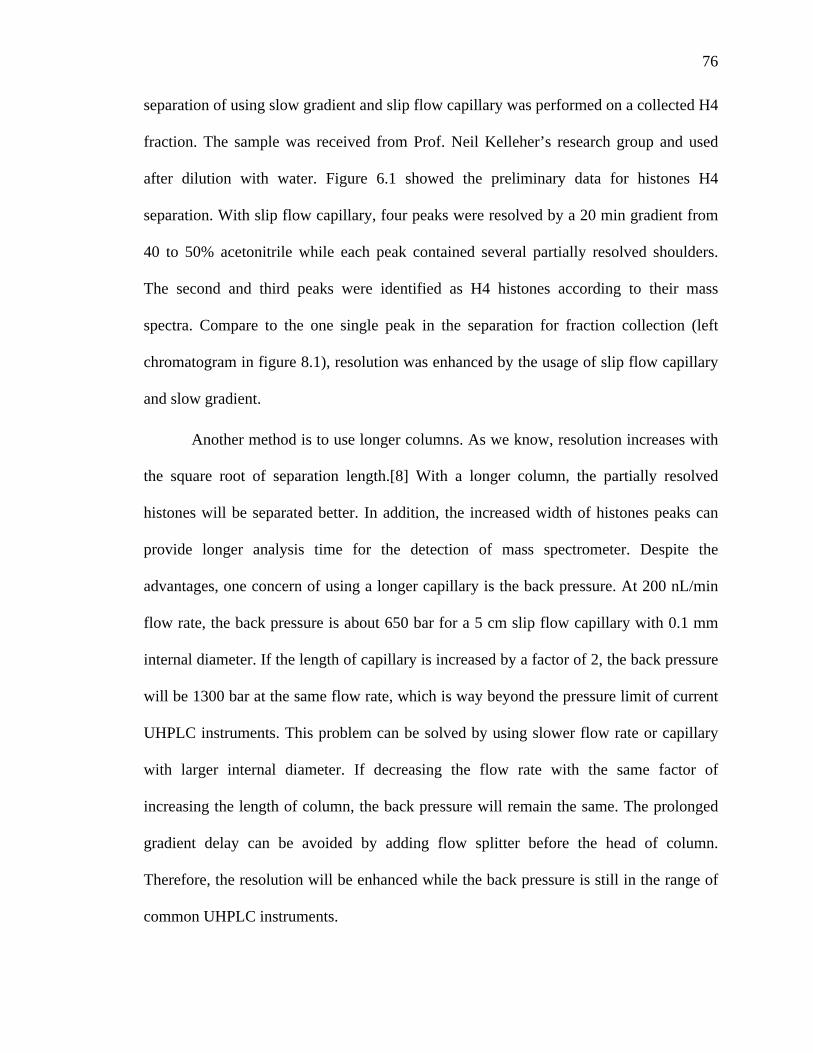
76
separation of using slow gradient and slip flow capillary was performed on a collected H4
fraction. The sample was received from Prof. Neil Kelleher’s research group and used
after dilution with water. Figure 6.1 showed the preliminary data for histones H4
separation. With slip flow capillary, four peaks were resolved by a 20 min gradient from
40 to 50% acetonitrile while each peak contained several partially resolved shoulders.
The second and third peaks were identified as H4 histones according to their mass
spectra. Compare to the one single peak in the separation for fraction collection (left
chromatogram in figure 8.1), resolution was enhanced by the usage of slip flow capillary
and slow gradient.
Another method is to use longer columns. As we know, resolution increases with
the square root of separation length.[8] With a longer column, the partially resolved
histones will be separated better. In addition, the increased width of histones peaks can
provide longer analysis time for the detection of mass spectrometer. Despite the
advantages, one concern of using a longer capillary is the back pressure. At 200 nL/min
flow rate, the back pressure is about 650 bar for a 5 cm slip flow capillary with 0.1 mm
internal diameter. If the length of capillary is increased by a factor of 2, the back pressure
will be 1300 bar at the same flow rate, which is way beyond the pressure limit of current
UHPLC instruments. This problem can be solved by using slower flow rate or capillary
with larger internal diameter. If decreasing the flow rate with the same factor of
increasing the length of column, the back pressure will remain the same. The prolonged
gradient delay can be avoided by adding flow splitter before the head of column.
Therefore, the resolution will be enhanced while the back pressure is still in the range of
common UHPLC instruments.

77
6.2.2 Reducing Noise of Nano-ESI
Slip flow capillary provides highly efficient separation for intact proteins.[9-11]
Horizontal polymerization not only provides a high quality bonded phase for protein
separation, but also stabilizes the surface and structure of the capillary.[12] Therefore, the
lifetime for slip flow capillary is fairly long. The resolution of proteins remains almost
the same after more than one year of usage and hundreds of injections. However, for LC-
MS with slip flow capillary, the spectrum became noisy after the capillary was heavily
used for a few weeks. One hypothesis is the buildup of lump pieces in the small pores
created by melted particles in the tip. To fabricate one slip flow capillary, the end of
capillary was pulled by a laser tip puller after the silica particles were packed into the
fused silica capillary and modified with silane reagents. During the tip pulling process,
the temperature of laser beam is as high as 1200 °C, which can melt both quartz and
silica particles. The melted silica particles glue together and make the flow channels
smaller. In addition, the bonded phase is also burned off in this process and thus making
the surface more sticky. With this method, the tip can be easily blocked by the lump
pieces eluted from the column, such as proteins, bacteria and dusts.
Two methods can be used to avoid the melt of particles. One is to change the
fabricating procedure and pack particles after pulling tip of capillary. To move the tip-
pulling step to the first, the following procedures have to be operated carefully to not
break the tip. Figure 6.2 showed the comparison of capillaries fabricated with this method
and the conventional slip flow capillary. The noise of electrospray was greatly reduced
compared to the conventional slip flow capillary. Next step is to optimize the packing and
modification of silica particles to improve the resolution of protein separation.

78
The second method is to use an emitter after the column. Figure 6.3 showed the
comparison of the diagrams for capillaries with integrated tip and extra emitter. The
addition of an emitter can increase the reproducibility of electrospray since the emitter
can be replaced once it is blocked. However, the disadvantage of this method is the post
column broadening created by the emitter. The commercially available emitters have
internal diameter of as small as 10 μm. The void volume brought by a 2 cm emitter is 1.6
nL, which is negligible. The broadening is then mainly from the transition of analytes
traveling from a large internal diameter to a channel of small internal diameter. Therefore,
a balance between the sacrifice of resolution and the enhancement of S/N needs to be
found with this method.
6.2.3 Development of New Stationary Phases
Current surfaces of slip flow capillary for proteins separation include C4, C18 and
TDP.[13] With these bonded phases, high efficiency of separation has been achieved for
histones, peptides, intact and reduced antibodies. In order to improve the resolution of
more analytes, other bonded phases need to be developed for slip flow capillary. Two
possible methods are listed as below.
The first method is to vary the carbon chain length. The influence of carbon chain
length of silane reagents on proteins separation has been discussed.[14] It is possible to
use silane reagents with longer carbon chains for the formation of bonded phase to
improve the resolution of small analytes, such as peptides.[15] Also, C8 bonded phase
was proved to be effective on histones and intact antibody separation.[16] One can expect

79
the slip flow capillary with C8 bonded phase can further improve the resolution of intact
antibodies.
Another possible direction is to generate a polyacrylamide brush layer on the
BC/C1 surface of slip flow capillary for hydrophilic interaction chromatography. Column
with polyacrylamide brush layer has achieved high resolution on Ribonuclease B and
prostate specific antigen (PSA) separation.[17] The methodology of fabricating HILIC
capillary with polyacrylamide surface was also developed before. Figure 6.4 showed the
separation of Ribonuclease B by using HILIC capillary. Five isomers of ribonuclease B
were resolved in a 30 min gradient. Combining with the easy integration to MS, the
HILIC capillary can be used for the separation of more glycoproteins, such as antibody
with N-glycosylation, or as a second dimension for the separation of complex mixtures to
provide higher resolution and sensitivity.
80
6.3 References
1. Berger, S.L., O. Nakanishi, and B. Haendler, The histone code and beyond new approaches to cancer therapy. 2006, Berlin ; New York: Berlin ; New York : Springer.
2. Su, X., Mass spectrometry-based strategies for characterization of histones and
their post-translational modifications. Expert Review Of Proteomics, 2007. 4(2): p. 211.
3. Thorslund, T., Histone H1 couples initiation and amplification of ubiquitin
signalling after DNA damage. Nature, 2015. 527(7578): p. 389. 4. Wood, C., Post-translational modifications of the linker histone variants and their
association with cell mechanisms. FEBS Journal, 2009. 276(14): p. 4109-4122. 5. Dolan, J.W., Gradient Elution, Part II: Equivalent Separations. LC-GC Europe,
2013. 26(4): p. 210-214. 6. Dolan, J.W., Gradient Elution, Part III: Surprises. LC-GC Europe, 2013. 26(5): p.
260-264. 7. Jandera, P., Gradient Elution in Column Liquid Chromatography Theory and
Practice. Gradient Elution in Column Liquid Chromatography: Theory and Practice, ed. J. Churácék. 1985, Burlington: Burlington : Elsevier Science.
8. Hsieh, E., et al., Effects of Column and Gradient Lengths on Peak Capacity and
Peptide Identification in Nanoflow LC-MS/MS of Complex Proteomic Samples. J. Am. Soc. Mass Spectrom., 2013. 24(1): p. 148-153.
9. Bingchuan, W., Slip Flow in Colloidal Crystals for Ultraefficient
Chromatography. Journal of the American Chemical Society, 2012. 134(26): p. 10780-10783.
10. Rogers, B.J., et al., RPLC of intact proteins using sub-0.5 μm particles and
commercial instrumentation. Analytical chemistry, 2013. 85(14): p. 6820. 11. Wu, Z., Intact protein separations by using slip flow with nano-liquid
chromatography-mass spectrometry, J.W. Mary, Editor 2014, Purdue University.

81
12. Rogers, B.A., Submicrometer Particles and Slip Flow in Liquid Chromatography. Analytical Chemistry, 2015. 87(5): p. 2520-2527.
13. Alabi, O., et al., Reversed-phase liquid chromatography of monoclonal antibody
aggregates using submicron silica particles. Abstracts Of Papers Of The American Chemical Society, 2014. 248.
14. Bell, C.M., et al., Synthesis and characterization of extended length alkyl
stationary phases for liquid chromatography with application to the separation of carotenoid isomers. Journal of Chromatography A, 1996. 753(1): p. 37-45.
15. Tanaka, N., et al., Performance of wide-pore silica- and polymer-based packing
materials in polypeptide separation: effect of pore size and alkyl chain length. Journal of Chromatography A, 1990. 535: p. 13-31.
16. Sandra, K., I. Vandenheede, and P. Sandra, Modern chromatographic and mass
spectrometric techniques for protein biopharmaceutical characterization. Journal of Chromatography A, 2014. 1335: p. 81-103.
17. Zhang, Z., Polyacrylamide brush layer for hydrophilic interaction liquid
chromatography of intact glycoproteins. Journal of Chromatography A, 2013. 1301: p. 156-162.
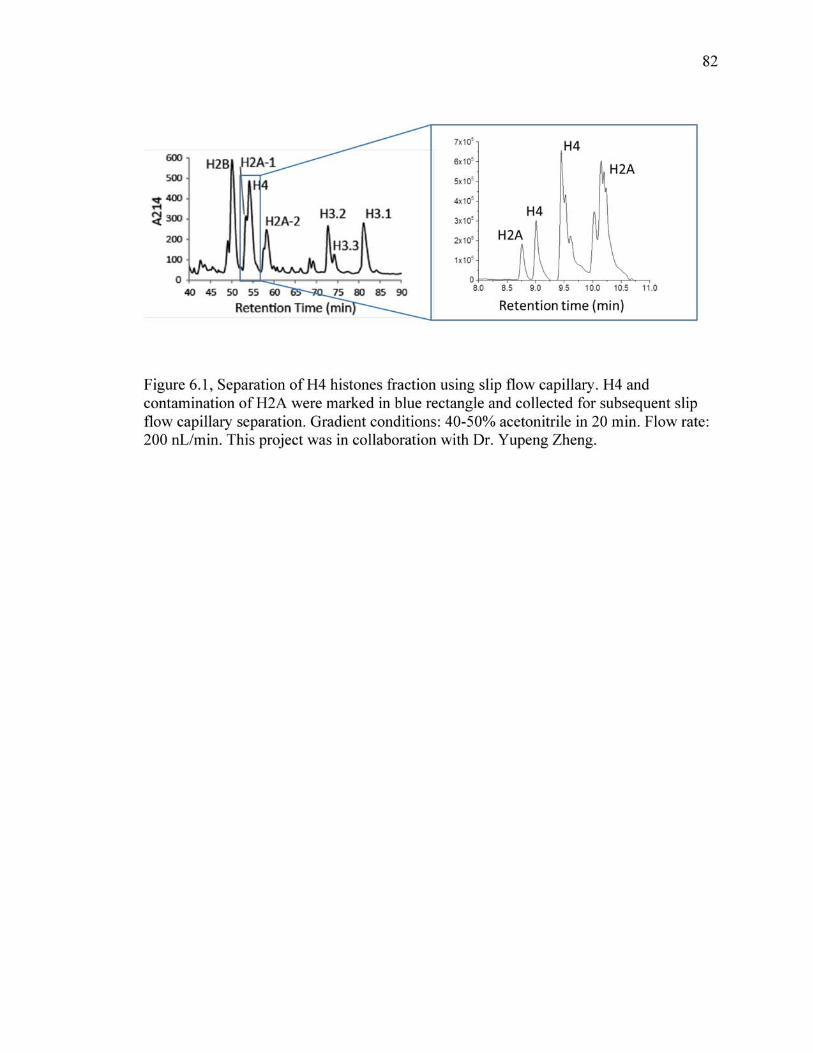


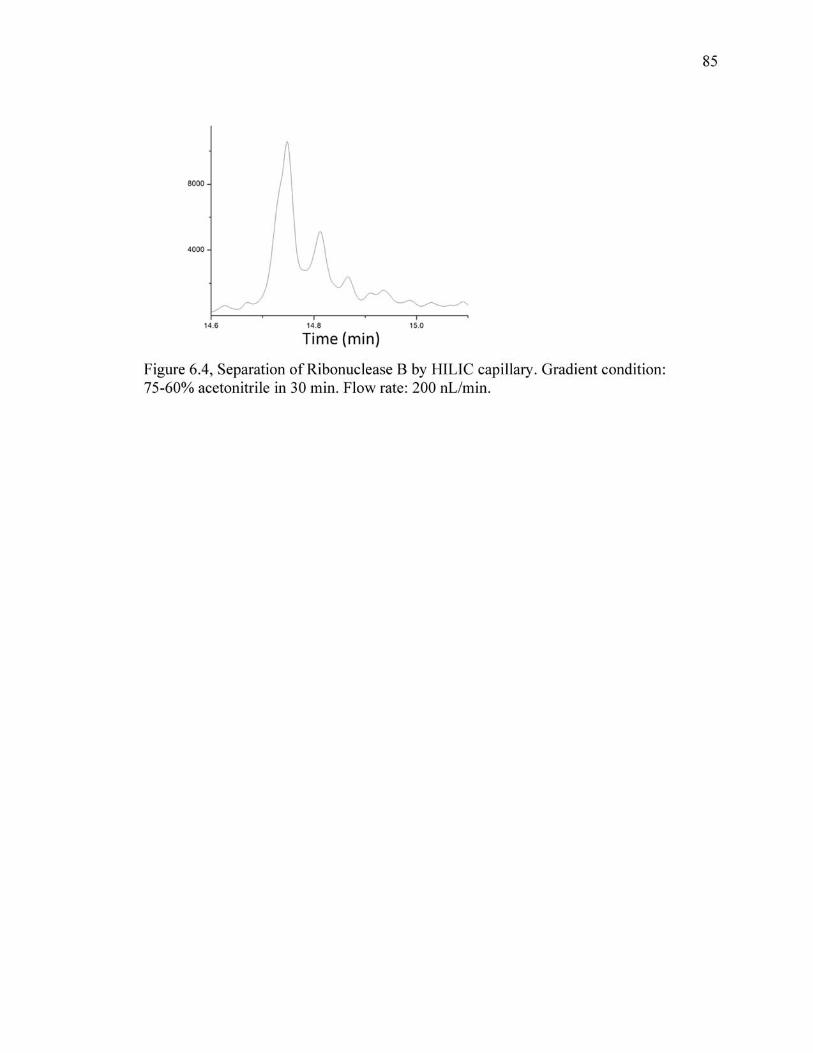

VITA

86
VITA
In 2007, Ximo entered University of Science and Technology of China as an
undergraduate student majoring in Chemistry. With the passion in material science, Ximo
joined Prof. Shuhong Yu’s research group to study the synthesis of nanoparticles with
novel structures. After two years of research, both symmetric and asymmetric
colloidosomes were successfully synthesized for novel drug delivery methods. During
this process, Ximo found her interest in analytical chemistry and decided to pursue a
doctoral degree in United States.
In 2012, Ximo joined the Ph.D program in Department of Chemistry at Purdue
University with a major in the division of Analytical Chemistry. In Prof. Mary Wirth’s
research group, Ximo developed various LC-MS methods for protein characterization
and achieved highly efficient separation with slip flow chromatography. After graduation,
Ximo decided to work as a senior scientist in Biopharmaceutical Group at Waters
Corporation and continue to pursue the science and technology in the field of
bioseparation.

PUBLICATION

87
PUBLICATION
To be submitted for publication.
Submicrometer Silica Particles for Top-down Proteomics of Histones
Ximo Zhang,1 Luca Fornelli,2 Philip D. Compton,2 Neil Kelleher,2 Mary J. Wirth1*
1Department of Chemistry, Purdue University
2Department of Molecular Virology, Immunology and Medical Genetics, The Ohio State
University
3Department of Chemistry, Northwestern University
*Email: [email protected]
ABSTRACT
For top-down proteomics, more efficient separations are needed for intact histones and
their variants, including both linker and core histones. A 4-cm capillary packed with
nonporous 470 nm silica particles was found to exhibit two-fold higher peak capacity for
the separation of histones, compared with a 15-cm long commercial microLC column
packed with 5 μm particles. Each used the same gradient of water/acetonitrile with
difluoroacetic acid, and a C18 bonded phase. In addition, the signal-to-background ratio
was more than two-fold higher for the capillary packed with submicrometer particles.
This enabled peaks as low in abundance as 0.1% of the highest peak to be characterized

88
by the mass spectrometer. The peak at 0.1% abundance corresponds to <500 amole (<10
pg) of histone. Histone phosphorylation and other PTMs were identifiable even for the
peaks of 0.1% in abundance, which is not possible for the commercial column. This
allows for more subtle differences in diseased vs. healthy tissue to be discerned.
INTRODUCTION
Histones, including core histones (H2A, H2B, H3 and H4) and linker histones (H1), are
basic chromosomal proteins that are involved in many physiological processes mostly
through its post-translational modifications (PTMs).[1, 2] These PTMs, including
phosphorylation, methylation, acetylation and ubiquitination,[3] can work individually or
covalently to generate a ‘histone code’ that participates in the regulation of various
cellular responses such as gene transcription and DNA repair.[1, 4, 5] Recent studies
showed that the levels of histone PTMs are correlated to different stages of cancer.[6, 7]
Therefore, understanding the function and mechanism of histones PTMs could benefit
early diagnosis and treatment for various diseases. However, the analysis of PTMs in
intact histones is difficult due to the large number of histone variants that may differ by
only a few amino acid sequences.[2] On the other hand, conventional methods such as
bottom-up proteomics risk losing PTMs information in the digestion processes.[8, 9]
Therefore, characterization of intact histones is essential to fully understand and utilize
histone PTMs as biomarkers for cancer diagnosis.
Top-down proteomics has been proven to be an effective method for intact histones
analysis because one must characterize multiple PTMs on the same protein.[9, 10]
Kelleher and coworkers discovered 42 forms of H4 histones through the use of an offline
RPLC-HILIC-FTMS.[11] With RPLC-MS, Su et al. completed the profiling of whole

89
histones and the PTMs including methylation and acetylation.[12] Contrepois et al.
developed a method to characterize core histone variants and PTMs in 20 min via RPLC-
LTQ-Orbitrap.[13] However, owing to the poor chromatographic resolution of histone
variants, these LC-MS methods suffer from laborious fractionation and long analysis time.
Methods that use a faster gradient to reduce analysis tine would otherwise sacrifice the
resolution and increase the complexity of mass spectra. Hence, higher efficiency of
separations are desired for intact histones in top-down proteomics.
With uniformly packed 0.5 μm silica nanoparticles, slip flow chromatography has
significantly advanced the efficiency of intact protein separations via reduced particle
size and slip flow enhancement.[14-16] The purpose of this work is to test whether this
advance benefits top-down proteomics analysis of intact histones.
MATERIALS AND METHODS
Materials
HPLC grade water, acetonitrile, formic acid, TFA, DFA and histones from bovine calf
thymus were purchased from Sigma-Aldrich (St. Louis, MO, USA). 0.5-μm bare silica
particles were purchased from Superior Silica (Temple, AZ). Methyltrichlorosilane (C1)
and Octadecyltrichlorosilane (C18) were from Gelest (Morrisville, PA). Phosphorylated
histone H1 sample was extracted as previously reported.
Capillary with packed silica colloidal crystals
The capillary for separation was prepared as follows.[15] Briefly, 0.5-μm bare silica
particles (Superior Silica, Temple, AZ) were calcined at 600 °C for 10 hours for three
times and then annealed at 1050 °C for 5 hours. The annealed particles were rehydrolized

90
by 0.1 M nitric acid for 3 hours and then suspended in water to form the slurry with 30%
wt. concentration. Empty capillary (Polymicro, Phoenix, AZ) was washed by 0.1 M
NaOH for 1 hour and rinsed by distilled water for 10 min. The slurry was injected to the
empty capillary by a syringe and then packed with a high-pressure pump under sonication.
The packed capillaries were vertically placed until dry. For surface modification, the dry
capillaries were put into a humidify chamber under 50% humidity for an hour, then
transferred into 20 mL dry toluene with 2% C1 and 16% C18 for 5 hours. These modified
capillaries were washed by dry toluene to remove free silane, and put in 120 °C oven for
4 hours. A P-2000 laser tip puller (Shutter instruments, Novato, CA) was used to pull the
end of capillaries.
NanoLC-MS and LC-MS of histone separation
Separation of histones was performed on a Thermo Dionex Ultimate 3000 nano-UHPLC
coupled to a Thermo LTQ Velos mass spectrometer. A discovery C18 column (1 mm* 15
cm, 5 um, 300 A) was purchased from Supelco (St. Louis, MO) and used for comparison.
The experiments with discovery column were performed on a Thermo Accela UHPLC.
Mobile phase A and B were water and acetonitrile, respectively. Two sets of modifiers
were used: the first was 0.5% formic acid and 0.02% TFA and the second was 0.1% DFA.
Gradient started at 1% B for 2 min, then increased from 20% to 65% B in 20 min and
maintained at 70% B for 1 min and equilibrate at 1% B for 8 min. Flow rate was set from
30 nL/min to 150 nL/min. For phosphorylated H1 separation, gradient started from 30%
B to 40% B within 20 min, and the flow rate was 100 nL/min.
For nanoLC-MS, analytes were directly sprayed from the tip of capillary to the mass
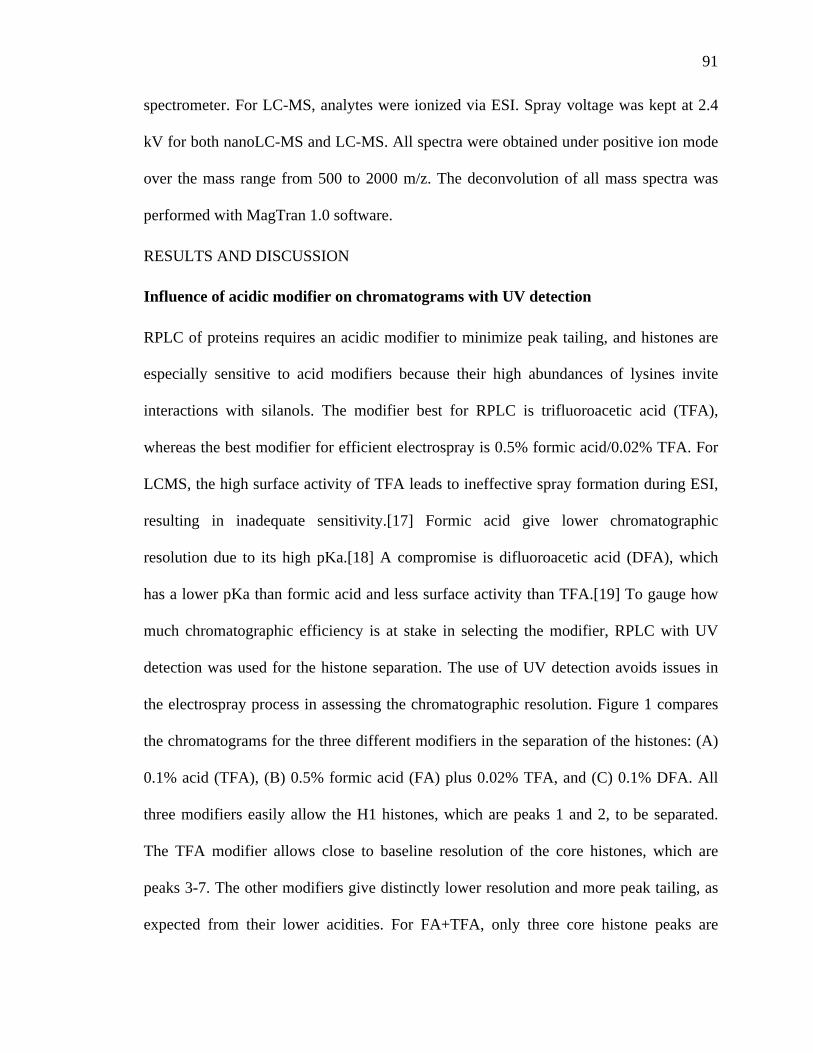
91
spectrometer. For LC-MS, analytes were ionized via ESI. Spray voltage was kept at 2.4
kV for both nanoLC-MS and LC-MS. All spectra were obtained under positive ion mode
over the mass range from 500 to 2000 m/z. The deconvolution of all mass spectra was
performed with MagTran 1.0 software.
RESULTS AND DISCUSSION
Influence of acidic modifier on chromatograms with UV detection
RPLC of proteins requires an acidic modifier to minimize peak tailing, and histones are
especially sensitive to acid modifiers because their high abundances of lysines invite
interactions with silanols. The modifier best for RPLC is trifluoroacetic acid (TFA),
whereas the best modifier for efficient electrospray is 0.5% formic acid/0.02% TFA. For
LCMS, the high surface activity of TFA leads to ineffective spray formation during ESI,
resulting in inadequate sensitivity.[17] Formic acid give lower chromatographic
resolution due to its high pKa.[18] A compromise is difluoroacetic acid (DFA), which
has a lower pKa than formic acid and less surface activity than TFA.[19] To gauge how
much chromatographic efficiency is at stake in selecting the modifier, RPLC with UV
detection was used for the histone separation. The use of UV detection avoids issues in
the electrospray process in assessing the chromatographic resolution. Figure 1 compares
the chromatograms for the three different modifiers in the separation of the histones: (A)
0.1% acid (TFA), (B) 0.5% formic acid (FA) plus 0.02% TFA, and (C) 0.1% DFA. All
three modifiers easily allow the H1 histones, which are peaks 1 and 2, to be separated.
The TFA modifier allows close to baseline resolution of the core histones, which are
peaks 3-7. The other modifiers give distinctly lower resolution and more peak tailing, as
expected from their lower acidities. For FA+TFA, only three core histone peaks are

92
resolved, instead of five. For DFA, four of the five core histone peaks are resolved, with
the fifth peak appearing as a shoulder. DFA is thus a reasonable compromise, as the
results show that only half of the resolution is lost in going from TFA to DFA.
The peaks in the chromatograms of Figure 1A were identified by collecting fractions
from the chromatograph, exchanging the 0.1% TFA for 0.5% formic acid, and directly
electrospraying into the mass spectrometer. The mass spectra and deconvoluted mass
spectra for all seven peaks are provided in the supporting information. Table 1 provides a
summary of the assignments. Except for peak 4, the peaks are mixtures of histones with
differing molecular weights, but these are similar enough to be attributed to post-
translational modifications. Hence, peak 3, for example, is assigned to a mixture of post-
translational modifications of the core histone H2B. The one exception is peak 7, whose
molecular weight is ambiguous: it can either be H2A or H3. Some post-translational
modifications give separable species, e.g., peaks 5 and 6 are both from H2A. Subscripts
are designated to facilitate referring to these in the discussions.
Gradient optimizations
The gradient for LC separation of the histones by the slip flow capillary was optimized
by varying the gradient time for a fixed flow rate of 100 nL/min. This flow rate
corresponds to a linear velocity of 0.7 mm/s, which is sufficiently slow for good
efficiency in protein separations. For gradient elution, it is the ratio of the gradient time,
tG, to the column dead time, t0, that is optimized to give an average retention factor, k*,
for the analyte as it travels through the column.
(1) 0
1*1.15 %
Gtkt B S
=

93
Optimal gradients are expected to be those that have k* between 1 and 10. The gradient
was for 25% to 50% acetonitrile, giving a gradient range, Df, of 25%. The parameter S is
the slope of log(k) vs. f, which depends on the protein. For lysozyme, which is also a
strongly basic protein, S~25, which would estimate that gradient lengths of 10 to 85 min
would give k* in the range of 1 to 10 for histones. Figure 2 shows the chromatograms for
varying gradient time from 10 min to 60 min for the slip flow capillary. The peak
intensities change with gradient time, which is likely due to bias in the electrospray.
Based on the widths of the largest peak in the chromatograms, gradients longer than 10
min give better resolution, which is consistent with the estimate. For the gradients of 20,
40 and 60 min, longer gradients give somewhat better resolution, but this is offset by the
lower S/N. The 20 min gradient is the choice for overall optimal performance and speed.
To reference the results with those of a commercial column, separations were also
performed with a commercial microbore column, Supelco Discovery, which has been
used for histone proteomics. [12] As with the slip-flow capillary, the Discovery column
also has a C18 bonded phase. The particles are 5 μm in diameter and fully porous, with
300 Å pore size. For gradient optimization, since the column is three-fold longer (15 cm),
for the same linear flow rate as the slip flow column, the gradient time needs to be three-
fold longer. The inner diameter is ten-fold larger: 1 mm i.d., compared to 100 μm i.d. for
the slip flow capillary, thus necessitating 100x more moles injected for comparison of
equivalent conditions. The chromatogram for the case of equal tG/t0 and mobile phase
velocity, and equivalent injected amount, is shown in Figure 3A. The chromatogram
shows that fewer peaks are observed. This could be a consequence of the electrospray
interface using a two-fold wider diameter orifice. It is important to note that the flow rate

94
can be made higher for the commercial column because of its lower resistance to flow.
Higher flow rate gives a higher value of tG/t0, which is potentially advantageous since
resolution improves with (tG/t0)1/2. There is an optimum because higher flow rate will
eventually decrease the plate number due to the mass transport term. To explore the
optimum, higher flow rates, 25 and 50 μL/min, were studied for the 60 min gradient, and
the chromatograms are shown in Figure 3B and 3C. The values of tg/t0 for these
chromatograms in comparison to the slip flow chromatograms as well as mobile phase
velocities, are summarized in Table 2, showing that these two chromatograms have linear
flow rates exceeding that of the slip flow column by 2x and 4x, and that tG/t0 exceeds that
of the slip flow column also by 2X and 4x. The result shows that resolution is negligibly
affected by either flow rate or the variations in tG/t0.
Dependence of chromatograms on column loading
Before exploring a detailed comparison, it is worth checking both the dependence of the
chromatograms of loading and the reproducibility of the chromatograms. This is
important since the number of peaks change when gradient conditions change. Figure 4
shows chromatograms for varying amounts injected. Equivalent amounts are injected into
the respective columns, as they have 100x different cross-sectional areas. For both
columns, more peaks are evident as the injected amount is increased. Again, this is likely
from the nonlinearity of the electrospray process.
Figure 5 shows replicate chromatograms for the two types of columns. The time axes
have small shifts for both chromatograms, perhaps from the imprecision of the flow
controls of each of the two chromatographs. The intensities also vary, as expected in
using electrospray. Nonetheless, the differences among the replicates for a given column

95
are smaller than the differences between columns, allowing a comparison. The gradient
optimization had shown that there are different peaks for different gradient conditions,
whereas Figure 5 shows that a given gradient exhibits a set number of peaks and relative
peak heights. Both are sufficiently reproducible for comparisons to be made.
Extracted ion chromatograms for comparing resolution
In studying column efficiency, any effect of partial overlap of peaks on the apparent peak
capacity can be decreased by comparing extracted ion chromatograms. Figure 6 shows a
comparison of the extracted ion chromatograms for the slip flow column for a 20 min
gradient with tG/t0 =17 and the commercial column for a 60 min gradient and tG/t0=16.
The peaks labeled 3 and 4, were fit to Gaussian to determine the standard deviations, and
these were used to calculate the local peak capacities for just the core histones. , which
are x and y for the slip flow and commercial column, and the range of retention times for
the peaks from H2B2 to H2A3, the peak capacity is 2 fold higher for the slip flow column.
Further, Figure 6 shows that the width of the H4 peaks for the slip flow column is limited
by the smoothing algorithm used to reduce electrospray noise, whereas this is not a
limitation for the commercial column since it is broader. Specifically, the standard
deviation of the H4 peak for the slip flow column is 1.56 s while the standard deviation of
the smoothing function is 1.13 s, thus giving a 50% increase in the peak width.
Considering this broadening, the peak capacity for the slip flow column is actually Z1
fold higher than the commercial column. Regardless of whether the smoothing is taken
into account, the slip flow column delivers higher resolution in addition to the three-fold
faster separation time.
CONCLUSION

96
Separation efficiency was studied for histones using a slip-flow capillary column with
sub-0.5 μm nonporous silica particles for LCMS. The slip flow column gives both 2x
higher peak capacity and 3x higher speed compared to columns that are three-fold longer.
One such column has fully porous 5 μm particles and the other has 3.6 μm core-shell
particles. In all cases, more peaks were observed as concentration increased presumably
due to the nonlinearity of the electrospray process. The higher speed is a consequence of
the column being shorter and the higher peak capacity is attributed to the number of
plates being higher despite the shorter length. DFA was found to give better resolution
than 0.5% formic acid with 0.02% TFA. Slow gradients can be used to further resolve the
histones if analysis time is not considered as a limitation. This separation method can be
applied on top-down proteomics of histones by coupling to higher resolution mass
spectrometers to allow more detailed characterization for PTMs of histones in future.
REFERENCES
1. Strahl, B.D., Allis, D. D., The language of covalent histone modifications. Nature, 2000. 403(6765): p. 41-45.
2. Biterge, B., and Schneider, J.J. , Histone variants: key players of chromatin. Cell Tissue Res, 2014. 356: p. 457–466.
3. Thorslund, T., Ripplinger, A., Hoffmann, S., Wild, T., Uckelmann. M., Villumsen, B., Narita, T., Sixma, T. K., Choudhary, C., Bekker-Jensen, S., and Mailand, N., Histone H1 couples initiation and amplification of ubiquitin signalling after DNA damage. Nature, 2015. 527: p. 389-393.
4. Jenuwein, T.a.A., C. D., Translating the Histone Code. Science, 2001. 293(5532):
p. 1074-1080.
5. Kurat, C., Recht, J., Radovani, E., Durbic, T., Andrews, B., and Fillingham, J, Regulation of histone gene transcription in yeast. Cellular and Molecular Life Sciences, 2014. 71(4): p. 599-613.

97
6. Telu, K.H., Abbaoui, B., homas-Ahner�, J. M., Zynger, D. L., Clinton�, S. K.,
Freitas, M. A. and Mortazavi, A., Alterations of histones H1 phosphorylation during bladder carcinogenesis. J. Proteome Res., 2013. 12(7): p. 3317�3326.
7. Harshman, S.W., Hoover, M. E., Huang, C., Branson, O. E., Chaney, S. B., Cheney, C. M., Rosol, T. J., Shapiro, C. L., Wysocki, V. H., Huebner, K., and Freitas, M. A., Histone H1 phosphorylation in breast cancer. J. Proteome Res., 2014. 13(5): p. 2453-2467.
8. Garcia, B.A., Mollah, S., Ueberheide, B.M., Busby, S.A., Muratore, T.L.,
Shabanowitz, J., and Hunt, D.F., Chemical derivatization of histones for facilitated analysis by mass spectrometry. Nat Protoc. , 2007. 2(4): p. 933-938.
9. Moradian, A., Kalli, A., Sweredoski, M. J. and Hess. S., The top-down, middle-
down, and bottom-up massspectrometry approaches for characterization of histonevariants and their post-translational modifications. Proteomics, 2014. 14: p. 489–497
10. Britton, L.M., Gonzales-Cope, M., Zee, Z. M., and Garcia, B. A., Breaking the
histone code with quantitative mass spectrometry. Expert Rev. Proteomics, 2011. 8(5): p. 631–643.
11. Pesavento, J.J., Bullock C.R., LeDuc, R.D., Mizzen, C.A., Kelleher, N.L.,
Combinatorial modification of human histone H4 quantitated by two-dimensional liquid chromatography coupled with top down mass spectrometry. J. Biol. Chem., 2008. 283(22): p. 14927-14937.
12. Su, X., Jacob, N. K., Amunugama, R., Lucas, D. M., Knapp, A. R., Ren, C., Davis,
M. E., Marcucci, G., Parthun, M. R., Byrd, J. C., Fishel, R., and Freitas, M. A., Liquid chromatography mass spectrometry profiling of histones. Journal of Chromatography B, 2007. 850(1-2): p. 440–454.
13. Contrepois, K., Ezan, E., Mann, C., and Fenaille, F., Ultra-high performance liquid chromatography-mass spectrometry for the fast profiling of histone post-translational modifications. J. Proteome Res., 2010. 9(10): p. 5501–5509.
14. Wei, B., Rogers, B. J., and Wirth, M. J., Slip flow in colloidal crystals for ultraefficient chromatography. J. Am. Chem. Soc., 2012. 134(26): p. 10780-10782.
15. Wu, Z., Wei, B., Zhang, X., and Wirth, M. J., Efficient separations of intact proteins using slip-flow with nano-liquid chromatography-mass spectrometry. Anal. Chem., 2014. 86(3): p. 1592-1598.

98
16. Rogers, B.A., Wu, Z., Wei, B., Zhang, X., Cao, X., Alabi, O., and Wirth, M. J., Submicrometer particles and slip flow in liquid chromatography. Anal. Chem., 2015. 87(5): p. 2520–2526.
17. Eshraghi, J.a.C., S. K., Factors affecting electrospray ionization of effluents containing trifluoroacetic acid for high-performance liquid chromatography/mass spectrometry. Anal. Chem., 1993. 65(23): p. 3528-3533.
18. You, J., Wang, L., Saji, M., Olesik, S. V., Ringel, M.D., Lucas, D.M., Byrd, J.C., and Freitas, M.A., High-sensitivity TFA-free LC-MS for profiling histones. Proteomics, 2011. 11(16): p. 3326-3334.
19. Boyes, B.E., Libert, B.P., Schuster, S.A., and Kirkland, J.J. , Submitted to J. Chromatogr. A.


