proteininteractionsinvestigatedbytheramanspectroscopyfor...
TRANSCRIPT

Hindawi Publishing CorporationInternational Journal of SpectroscopyVolume 2012, Article ID 462901, 7 pagesdoi:10.1155/2012/462901
Research Article
Protein Interactions Investigated by the Raman Spectroscopy forBiosensor Applications
R. P. Kengne-Momo,1, 2 Ph. Daniel,1 F. Lagarde,1 Y. L. Jeyachandran,1 J. F. Pilard,3
M. J. Durand-Thouand,4 and G. Thouand4
1 Laboratoire PEC, UMR CNRS 6087, Universite du Maine, A.O. Messiaen, 72085 Le Mans, France2 Laboratoire de Chimie Organique, Universite de Yaounde I, B.P 812, Yaounde, Cameroon3 Laboratoire UCO2M, UMR CNRS 6011, Universite du Maine, A.O. Messiaen, 72085 Le Mans, France4 Laboratoire CBAC, UMR CNRS GEPEA 6144, IUT Universite de Nantes, 85035 La Roche Sur Yon, France
Correspondence should be addressed to Ph. Daniel, [email protected]
Received 24 November 2011; Revised 27 January 2012; Accepted 10 February 2012
Academic Editor: Jaan Laane
Copyright © 2012 R. P. Kengne-Momo et al. This is an open access article distributed under the Creative Commons AttributionLicense, which permits unrestricted use, distribution, and reproduction in any medium, provided the original work is properlycited.
Interaction and surface binding characteristics of staphylococcal protein A (SpA) and an anti-Escherichia coli immunoglobulinG (IgG) were studied using the Raman spectroscopy. The tyrosine amino acid residues present in the α-helix structure of SpAwere found to be involved in interaction with IgG. In bulk interaction condition the native structure of proteins was almostpreserved where interaction-related changes were observed in the overall secondary structure (α-helix) of SpA. In the adsorbedstate, the protein structure was largely modified, which allowed the identification of tyrosine amino acids involved in SpA andIgG interaction. This study constitutes a direct Raman spectroscopic investigation of SpA and IgG (receptor-antibody) interactionmechanism in the goal of a future biosensor application for detection of pathogenic microorganisms.
1. Introduction
Creating protein-protein and protein-surface interactions isthe primary step of biological processes in bioimplants, bio-fouling, immunoassays, and biosensors [1]. Therefore, in thepast few years, a great deal for research has been focussedon the understanding of the fundamental structure andphysicochemical properties involved in these interactions[2, 3], because the applications are strongly connected inthe good knowledge of these mechanisms. Structure andorientation changes are often a part of proteins interactiondue to various factors such as specific/nonspecific attach-ment, hydration/dehydration, steric hindrance, competitiveadsorption/desorption processes, and experimental condi-tions [4, 5].
However it appears that the protein interactions andtheir resulting structural conformations are very complicatedprocesses. Facing protein interaction complexity, variousanalytical tools have been developed to characterize theexhibited different phenomena, physico-chemical behaviors,
and interaction structures [4, 6–8]. Among these tools, thevibrational spectroscopic techniques, such as Raman spec-troscopy, are considered as extremely useful tools to chemi-cally and structurally investigate all material compounds, ofwhich protein analysis now constitute a possible and inter-esting field of applications, more particularly, to determinesecondary conformations and interaction structures [9–11].Actually the Raman scattering technique is a vibrationalmolecular spectroscopy which, derives from an inelastic lightscattering process. With the Raman spectroscopy, a laserphoton is scattered by a sample molecule and loses (or gains)energy during the process. The amount of energy lost is seenas a change in energy (wavelength) of the irradiating photon.This energy loss is characteristic for a particular bond in themolecule. The Raman signal is producing a precise spectralsample fingerprint, unique to each atom, group of atoms orindividual molecule. In this respect it is similar to the morecommonly found FT-IR spectroscopy. However, unlike FT-IR, there are a distinct number of advantages when usingthe Raman: for instance (i) Raman can be used to analyse

2 International Journal of Spectroscopy
aqueous solutions, (ii) the intensity of spectral features isdirectly proportional to the concentration of the particularspecies, (iii) Raman requires little or no sample preparation,and (iv) the use of a Raman microscope provides very highlevel of spatial resolution and depth discrimination. Theseadvantages and its highly specific nature mean that Ramanhas become a very powerful tool for analysis and chemicalmonitoring.
Indeed, the recent technological improvements in Ramanspectroscopy, especially in lasers, optics, detectors, and dataanalysis, make this type of investigation easier. More preciselythe sensitivity has increased several orders of magnitudebecause of advances in optical filters and phonon detectors[12]. For instance single-channel detectors were replacedby CCD detectors whose main advantage is to obtain thespectral information in a single recording. Additionallyfluorescence is now minimized by using red/IR excitationin the 630–850 nm excitation, which became possible by thenew photon detectors with high efficiency in this region[13]. Finally problems with interpreting Raman data havebeen reduced with the avaiability of powerful software whichare able to discriminate throughout statistical methods [14].Raman has the main advantage of being a nondestructiveand noninvasive method which will not disturb the studiedsystem, which is a major asset. Finally this optical techniquecan provide rapid, objective, and reproducible measurementson biological samples. Moreover, the Raman spectroscopy isparticularly suitable for detection and analysis of the changesin molecular polarizability of biomolecules, changes involvedin the modifications of proteins conformation in bindingor interaction mechanisms [9–11, 15, 16]. For instance,the well-resolved amide III band in the Raman spectrumhas been used to determine precisely the secondary con-formation of protein [17]. The spectral changes associatedwith aromatic amino acids such as tyrosine, phenylalanine,and tryptophan residues were also used to track someinteractions induced by structural modifications [15, 16].
SpA and IgG systems were studied because of theirimportance in affinity biosensor applications. By bindingto specific proteins, the fragment crystallizable regionsensure that each antibody generates an appropriate immuneresponse for a given antigen. In the present work, the Ramanspectroscopy was used to study the native and interactionstructures of a staphylococcal protein A (SpA) and animmunoglobulin G (IgG) and their complex on pure gold(p-Au) and self-assembled monolayer (SAM) functionalizedgold (SAM-Au) surfaces. This study is of major impor-tance in the goal of a future bacteria immobilization anddetection in the frame of a biosensor design using Ramanspectroscopy. Actually one possible biosensing method canbe the functionalization of dedicated surfaces in order tospecifically detect and fix microorganisms like pathogenicbacteria. The biological elements could be then controlledby a fingerprint technique of which Raman or infraredspectroscopies are possible tools. However, the efficiency ofbiomolecules detection depends strongly on the success ofsurface functionalization and on the nature of biomoleculesimmobilization. The sequence of functionalization includesgenerally 3 steps: (i) the first step is to functionalize a selected
surface (could be gold as in our case) by a chemical way forinstance [18], (ii) the second step is bind linker or spaceronto the functionalized polymer surface, and (iii) the finalstep is then to covalently attach a bioactive compound tothe functionalized surface. The second step is actually themore complex one because it includes the fixation of proteinsby a covalent way before the immobilization of antibodywhich is then specific of bioelements that we wish to detect.The full knowledge of protein-antibody interaction is thenvery important, especially with investigation of the Ramanspectroscopy since it is one possible fingerprint techniqueused in alternative biosensing equipment.
The protein A (SpA) and antibody (IgG) are well knownfor a long time from a structural point of view, and theirinteractions were intensively studied as it could be seen in theabundant literature (see for instance the book chapters 19,20, 21 and some selected examples of articles 22–27). How-ever there are only few Raman spectroscopic investigationpublished at our knowledge concerning protein A (SpA) andIgG (see for instance [19–22]), and consequently it appearsoriginal to understand from a spectroscopic point of view,by a Raman study, the interaction of these both moleculessince the potential applications for future biosensors areimportant.
2. Experimental Details
2.1. Materials. Gold films of thickness and surface roughnessaround 100 nm and 15 nm, respectively, sputter coated on(100) silicon wafer, were used as substrates. SpA (Cat. no.p6031) purchased from Sigma and an anti-E. coli IgG (Cat.no. GTX40640) purchased from Interchim were used asreceived without further purification. Sterilised phosphate-buffered saline (PBS) of pH 7.42 was used as protein solvent.Millipore water (18.2 MΩ·cm) was used throughout theexperiment.
2.2. Substrate Preparation. SAM-Au surfaces were preparedusing thiourea and glutaraldehyde. The gold film substrateswere first washed in water and ethanol for 20 min each,cleaned in 1% aqua regia for 5 s, and rinsed well inwater. The cleaned substrates were immerged in 250 mM ofaqueous thiourea solution for 24 hours. Then the substrateswere activated in 5% (v/v) of glutaraldehyde in PBS for20 min. Finally the substrates were rinsed in PBS in order toeliminate nonreacted material and then be used for proteinexperiments.
As reference surfaces, p-Au surfaces were cleaned inabsolute ethanol (Sigma) for 20 min and washed thoroughlyin water before experiments.
2.3. Protein Immobilization. PBS (pH 7.4) was used to pre-pare SpA solution and reconstitute the original IgG solution(4 mg/mL, 0.1% Sodium Azide, 0.01 M PBS, pH 7.2) inidentical concentrations. The final concentrations of bothSpA and IgG solutions were 0.15 mg/mL.
To study the interaction structure of the proteins onSAM-Au surfaces, two distinct experiments were run: (i) inone experiment SpA and IgG were consecutively adsorbed

International Journal of Spectroscopy 3
(contact presence of 2 hours each); (ii) in the second one,the SpA and IgG solutions were previously mixed (SpA +IgG) in one solution, kept stable for 1 h at 20◦C, and onlythen adsorbed on the surface (contact presence 2 h). Onp-Au surface (reference), SpA and IgG were consecutivelyadsorbed for an incubation time of 16 h each.
After adsorption times, all the samples were washedin PBS (10 min.), rinsed in water, and immediately usedfor Raman measurements. Additionally, the mixed (SpA +IgG) solution was studied in drop coated dry state on p-Au surface to analyse the bulk protein-protein-interaction-related structural changes. The Raman spectra were alsorecorded for the as-received SpA powder and IgG solution(4 mg/ml, drop coated in dried state) on p-Au surfaces asreference of their native structure.
2.4. Raman Measurements. Raman spectrometer XploRA(model from Horiba) equipped with a confocal microscopewas used. The Raman signals were recorded in a spectralrange of 400–3100 cm−1 with an integration time of 300 susing a 785 nm red laser excitation, at 10 mW power,in combination with a 100x objective magnification (NA= 0.9) of an Olympus BX41 transmission and reflectionillumination microscope (Olympus, France) for focus andcollection of Raman-scattered light. The confocal holewas set to the minimum value. The dispersive system iscomprised of a single grating with 600 groves/mm, and theRaman signal is collected thanks to a front illuminatedCCD detector cooled by thermoelectric Peltier air effect(produced by Horiba, 1024×256 chip size). A filter rejectsthe Rayleigh contribution. For each sample, 3 series ofindependent measurements were carried out and for eachset, the Raman experiment was repeated 6 times to checkthe reproducibility of the measurement and to minimizethe possible artifacts and parasitic signals. Each consideredspectrum was preprocessed with a 9-point Savitzky-Golayfunction corresponding to a denoising routine (smoothingfilter), background corrected with a polynomial function,and vector normalized using the Labspec software. A moredetailed description of spectral acquisition and treatment ispresented elsewhere [23].
3. Results and Discussion
SpA and IgG are globular proteins with average molecularweights ∼42 kDa and ∼150 kDa, respectively. The secondaryconformation of SpA molecules is rich in α-helix structure(54%) and also contains 10–20% of β-structure and alarge part of coil structure [24]. IgG molecules are pre-dominantly made of β-sheet (47%), 7% of α-helices, andremaining, percentage of turns and coils [25]. First of allthe reference Raman spectra of both SpA and IgG proteinswere recorded; as evidenced in Figure 1, the as-receivedSpA and IgG proteins clearly revealed their characteristicnative secondary conformations. The amide I band around1659 cm−1 and a relatively higher intense band at 1336 cm−1
in the amide III region were observed in SpA spectrum whichare related to its α-helix secondary structure characteristics[17]. SpA spectrum also featured a vibration band around
800 1200 1600 3000
897
933
647
758 83
2 857
878
922
958
1004
1032
1128
1174
1243
1336
1416
1451
1517 15
5216
1016
7316
59 SpA
IgG
Raman shift (cm−1)
100 counts (a.u.)
Inte
nsi
ty (
cou
nts
)
C-H
—st
r.C
-H—
str.
Figure 1: The Raman spectra recorded for the as-received SpAand IgG proteins. Conditions of spectra recording: time acquisition300 s, wavelength 785 nm, nominal power laser 10 mW, optical mi-croscope objective 100x.
933 cm−1 associated with rocking vibration of CH3(δCH3)terminal groups of α-helix structure. The predominant β-sheet structure in IgG was identified by the characteristicallyamide I band around 1673 cm−1 and a higher intenseband at 1243 cm−1 in the amide III region [17]. The othervibration bands generally associated with protein structuresare assigned as follows from the literature [26]. The C–Hstretching (νC–H) vibration bands of aliphatic side-chainswere observed around 2860 cm−1 to 2940 cm−1. The CH2
deformation (ρCH2) band was observed around 1451 cm−1.Vibration bands associated with phenylalanine amino acidresidue were observed around 1610 cm−1 and 1004 cm−1.The bands associated with tyrosine were observed around857 cm−1 (buried), 832 cm−1 (exposed), 758 cm−1, and647 cm−1 (skeletal). Tryptophan (indole rings) residue bandswere observed around 1552 cm−1 and 1416 cm−1. The bandsin the region 920 cm−1 to 880 cm−1 could be assigned toρCH2 and the ones around 958 cm−1 to ρCH3 vibrations.Backbone skeletal vC–C vibration bands were also observedin the region of 1170 cm−1 to 1032 cm−1. Table 1 summarizesthe suggested assignment.
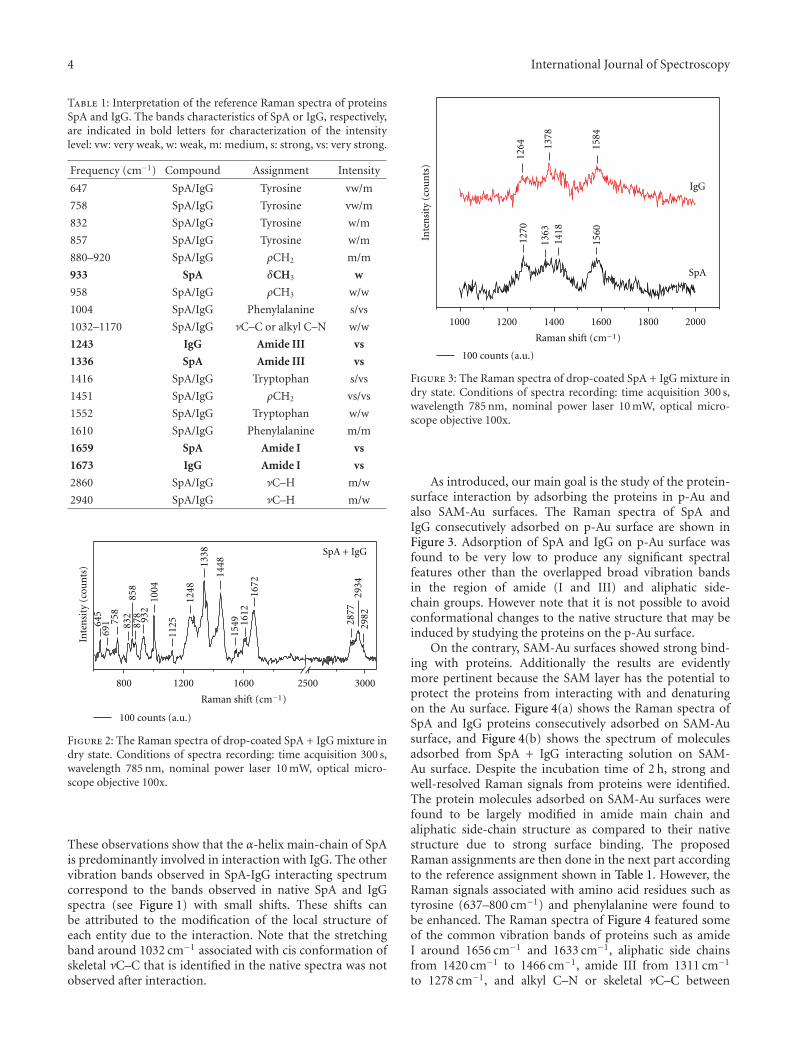
The Raman spectrum measured for the drop coated layerof previously mixed SpA + IgG solution (0.15 mg/mL) on p-Au surface is shown in Figure 2. Interesting and new spectralfeatures, assumed to be produced by SpA-IgG interaction,were observed. The amide I band was observed around1672 cm−1 corresponding to the β-sheet structure, charac-teristically considered coming from IgG. However, the amideIII region (1240 cm−1 to 1350 cm−1) showed characteristicsof α-helix structure with a relatively higher intensity bandaround 1338 cm−1 associated with bending δCα–H vibrationin main-chain of α-helix. Moreover, the band at 932 cm−1
associated with α-helix CH3 groups increased in intensitycompared with the reference SpA spectrum (see Figure 1).
4 International Journal of Spectroscopy
Table 1: Interpretation of the reference Raman spectra of proteinsSpA and IgG. The bands characteristics of SpA or IgG, respectively,are indicated in bold letters for characterization of the intensitylevel: vw: very weak, w: weak, m: medium, s: strong, vs: very strong.
Frequency (cm−1) Compound Assignment Intensity
647 SpA/IgG Tyrosine vw/m
758 SpA/IgG Tyrosine vw/m
832 SpA/IgG Tyrosine w/m
857 SpA/IgG Tyrosine w/m
880–920 SpA/IgG ρCH2 m/m
933 SpA δCH3 w
958 SpA/IgG ρCH3 w/w
1004 SpA/IgG Phenylalanine s/vs
1032–1170 SpA/IgG νC–C or alkyl C–N w/w
1243 IgG Amide III vs
1336 SpA Amide III vs
1416 SpA/IgG Tryptophan s/vs
1451 SpA/IgG ρCH2 vs/vs
1552 SpA/IgG Tryptophan w/w
1610 SpA/IgG Phenylalanine m/m
1659 SpA Amide I vs
1673 IgG Amide I vs
2860 SpA/IgG νC–H m/w
2940 SpA/IgG νC–H m/w
800 1200 1600 2500 3000
645
691 75
883
287
885
893
210
04
1125
1248
1338
1448
1549 16
12
2982
2934
2877
1672
Raman shift (cm−1)
SpA + IgG
100 counts (a.u.)
Inte
nsi
ty (
cou
nts
)
Figure 2: The Raman spectra of drop-coated SpA + IgG mixture indry state. Conditions of spectra recording: time acquisition 300 s,wavelength 785 nm, nominal power laser 10 mW, optical micro-scope objective 100x.
These observations show that the α-helix main-chain of SpAis predominantly involved in interaction with IgG. The othervibration bands observed in SpA-IgG interacting spectrumcorrespond to the bands observed in native SpA and IgGspectra (see Figure 1) with small shifts. These shifts canbe attributed to the modification of the local structure ofeach entity due to the interaction. Note that the stretchingband around 1032 cm−1 associated with cis conformation ofskeletal νC–C that is identified in the native spectra was notobserved after interaction.
1000 1200 1400 1600 1800 2000
1264 13
78
1584
1270
1363
1418
1560
SpA
IgG
Raman shift (cm−1)
100 counts (a.u.)
Inte
nsi
ty (
cou
nts
)
Figure 3: The Raman spectra of drop-coated SpA + IgG mixture indry state. Conditions of spectra recording: time acquisition 300 s,wavelength 785 nm, nominal power laser 10 mW, optical micro-scope objective 100x.
As introduced, our main goal is the study of the protein-surface interaction by adsorbing the proteins in p-Au andalso SAM-Au surfaces. The Raman spectra of SpA andIgG consecutively adsorbed on p-Au surface are shown inFigure 3. Adsorption of SpA and IgG on p-Au surface wasfound to be very low to produce any significant spectralfeatures other than the overlapped broad vibration bandsin the region of amide (I and III) and aliphatic side-chain groups. However note that it is not possible to avoidconformational changes to the native structure that may beinduced by studying the proteins on the p-Au surface.
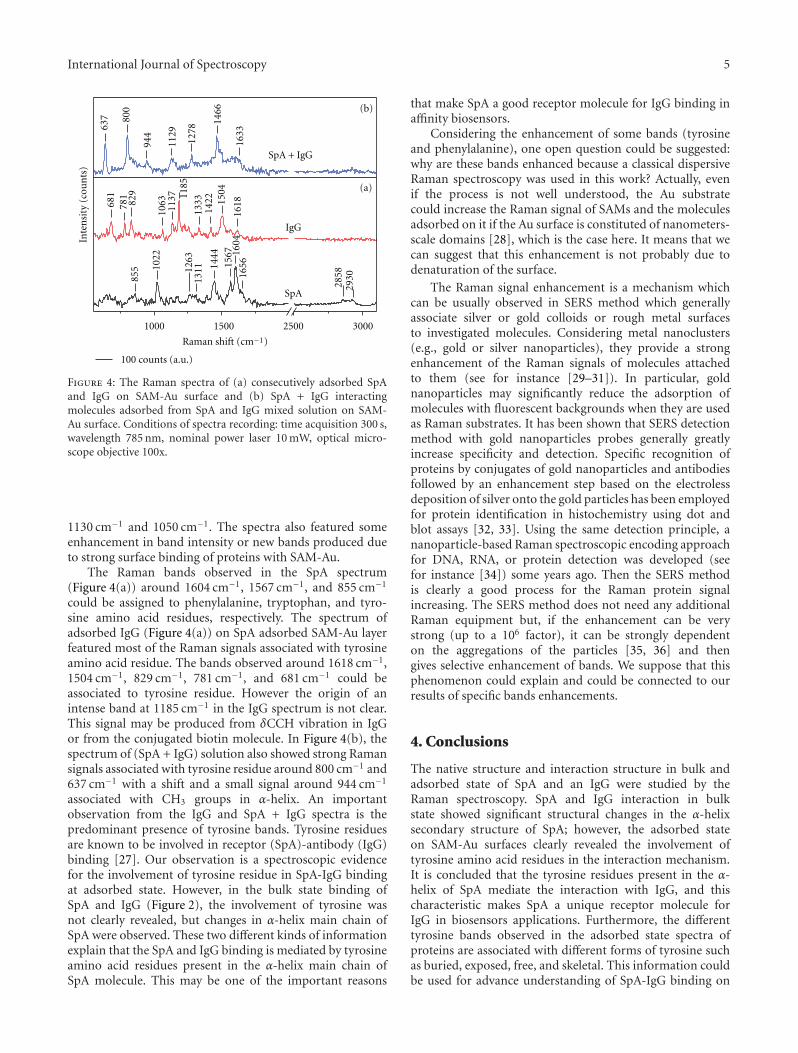
On the contrary, SAM-Au surfaces showed strong bind-ing with proteins. Additionally the results are evidentlymore pertinent because the SAM layer has the potential toprotect the proteins from interacting with and denaturingon the Au surface. Figure 4(a) shows the Raman spectra ofSpA and IgG proteins consecutively adsorbed on SAM-Ausurface, and Figure 4(b) shows the spectrum of moleculesadsorbed from SpA + IgG interacting solution on SAM-Au surface. Despite the incubation time of 2 h, strong andwell-resolved Raman signals from proteins were identified.The protein molecules adsorbed on SAM-Au surfaces werefound to be largely modified in amide main chain andaliphatic side-chain structure as compared to their nativestructure due to strong surface binding. The proposedRaman assignments are then done in the next part accordingto the reference assignment shown in Table 1. However, theRaman signals associated with amino acid residues such astyrosine (637–800 cm−1) and phenylalanine were found tobe enhanced. The Raman spectra of Figure 4 featured someof the common vibration bands of proteins such as amideI around 1656 cm−1 and 1633 cm−1, aliphatic side chainsfrom 1420 cm−1 to 1466 cm−1, amide III from 1311 cm−1
to 1278 cm−1, and alkyl C–N or skeletal νC–C between
International Journal of Spectroscopy 5
1000 1500 2500 3000
1656
2858
293085
5 1263
1311
1633
637 80
0
944
1129
1278
1466
681
781
829
1063
1137 11
85
1333
1422 15
04
1618
1022
1444
1567 16
04
SpA
IgG
Raman shift (cm−1)
(a)
(b)
SpA + IgG
100 counts (a.u.)
Inte
nsi
ty (
cou
nts
)
Figure 4: The Raman spectra of (a) consecutively adsorbed SpAand IgG on SAM-Au surface and (b) SpA + IgG interactingmolecules adsorbed from SpA and IgG mixed solution on SAM-Au surface. Conditions of spectra recording: time acquisition 300 s,wavelength 785 nm, nominal power laser 10 mW, optical micro-scope objective 100x.
1130 cm−1 and 1050 cm−1. The spectra also featured someenhancement in band intensity or new bands produced dueto strong surface binding of proteins with SAM-Au.
The Raman bands observed in the SpA spectrum(Figure 4(a)) around 1604 cm−1, 1567 cm−1, and 855 cm−1
could be assigned to phenylalanine, tryptophan, and tyro-sine amino acid residues, respectively. The spectrum ofadsorbed IgG (Figure 4(a)) on SpA adsorbed SAM-Au layerfeatured most of the Raman signals associated with tyrosineamino acid residue. The bands observed around 1618 cm−1,1504 cm−1, 829 cm−1, 781 cm−1, and 681 cm−1 could beassociated to tyrosine residue. However the origin of anintense band at 1185 cm−1 in the IgG spectrum is not clear.This signal may be produced from δCCH vibration in IgGor from the conjugated biotin molecule. In Figure 4(b), thespectrum of (SpA + IgG) solution also showed strong Ramansignals associated with tyrosine residue around 800 cm−1 and637 cm−1 with a shift and a small signal around 944 cm−1
associated with CH3 groups in α-helix. An importantobservation from the IgG and SpA + IgG spectra is thepredominant presence of tyrosine bands. Tyrosine residuesare known to be involved in receptor (SpA)-antibody (IgG)binding [27]. Our observation is a spectroscopic evidencefor the involvement of tyrosine residue in SpA-IgG bindingat adsorbed state. However, in the bulk state binding ofSpA and IgG (Figure 2), the involvement of tyrosine wasnot clearly revealed, but changes in α-helix main chain ofSpA were observed. These two different kinds of informationexplain that the SpA and IgG binding is mediated by tyrosineamino acid residues present in the α-helix main chain ofSpA molecule. This may be one of the important reasons
that make SpA a good receptor molecule for IgG binding inaffinity biosensors.
Considering the enhancement of some bands (tyrosineand phenylalanine), one open question could be suggested:why are these bands enhanced because a classical dispersiveRaman spectroscopy was used in this work? Actually, evenif the process is not well understood, the Au substratecould increase the Raman signal of SAMs and the moleculesadsorbed on it if the Au surface is constituted of nanometers-scale domains [28], which is the case here. It means that wecan suggest that this enhancement is not probably due todenaturation of the surface.
The Raman signal enhancement is a mechanism whichcan be usually observed in SERS method which generallyassociate silver or gold colloids or rough metal surfacesto investigated molecules. Considering metal nanoclusters(e.g., gold or silver nanoparticles), they provide a strongenhancement of the Raman signals of molecules attachedto them (see for instance [29–31]). In particular, goldnanoparticles may significantly reduce the adsorption ofmolecules with fluorescent backgrounds when they are usedas Raman substrates. It has been shown that SERS detectionmethod with gold nanoparticles probes generally greatlyincrease specificity and detection. Specific recognition ofproteins by conjugates of gold nanoparticles and antibodiesfollowed by an enhancement step based on the electrolessdeposition of silver onto the gold particles has been employedfor protein identification in histochemistry using dot andblot assays [32, 33]. Using the same detection principle, ananoparticle-based Raman spectroscopic encoding approachfor DNA, RNA, or protein detection was developed (seefor instance [34]) some years ago. Then the SERS methodis clearly a good process for the Raman protein signalincreasing. The SERS method does not need any additionalRaman equipment but, if the enhancement can be verystrong (up to a 106 factor), it can be strongly dependenton the aggregations of the particles [35, 36] and thengives selective enhancement of bands. We suppose that thisphenomenon could explain and could be connected to ourresults of specific bands enhancements.
4. Conclusions
The native structure and interaction structure in bulk andadsorbed state of SpA and an IgG were studied by theRaman spectroscopy. SpA and IgG interaction in bulkstate showed significant structural changes in the α-helixsecondary structure of SpA; however, the adsorbed stateon SAM-Au surfaces clearly revealed the involvement oftyrosine amino acid residues in the interaction mechanism.It is concluded that the tyrosine residues present in the α-helix of SpA mediate the interaction with IgG, and thischaracteristic makes SpA a unique receptor molecule forIgG in biosensors applications. Furthermore, the differenttyrosine bands observed in the adsorbed state spectra ofproteins are associated with different forms of tyrosine suchas buried, exposed, free, and skeletal. This information couldbe used for advance understanding of SpA-IgG binding on

6 International Journal of Spectroscopy
surfaces. This work will be very useful considering the poten-tial applications in biosensors for detection of pathogens.Actually one possible alternative way for the detection ofpathogenic bacteria is to imagine a specific functionalizedsurface (SAM-Au surface for instance) which will be able tofix microorganisms and could be detected by spectroscopy.However the understanding of this SpA-IgG interactionmechanism appears to be very important previously to anyfixation of biological element.
Acknowledgments
The present work was supported by the Grant RMB-BIORAM booked by the Region Pays de la Loire, Le ConseilGeneral de la Vendee, La Ville de la Roche sur Yon.
References
[1] R. A. Latour Jr., “Protein-surface interactions,” in Biomaterials:Protein-Surface Interactions: Encyclopedia of Biomaterials andBiomedical Engineering, G. E. Wnek and G. L. Bowlin, Eds.,pp. 270–284, Informa Healthcare, New York, NY, USA, 2008.
[2] I. S. Moreira, P. A. Fernandes, and M. J. Ramos, “Hot spots—a review of the protein-protein interface determinant amino-acid residues,” Proteins, vol. 68, no. 4, pp. 803–812, 2007.
[3] J. A. Mielczarski, J. Dong, and E. Mielczarski, “Real timeevaluation of composition and structure of concanavalina adsorbed on a polystyrene surface,” Journal of PhysicalChemistry B, vol. 112, no. 16, pp. 5228–5237, 2008.
[4] Y. L. Jeyachandran, E. Mielczarski, B. Rai, and J. A. Miel-czarski, “Quantitative and qualitative evaluation of adsorp-tion/desorption of bovine serum albumin on hydrophilic andhydrophobic surfaces,” Langmuir, vol. 25, no. 19, pp. 11614–11620, 2009.
[5] M. Rankl, T. Ruckstuhl, M. Rabe, G. R. J. Artus, A.Walser, and S. Seeger, “Conformational reorientation ofimmunoglobulin G during nonspecific interaction with sur-faces,” ChemPhysChem, vol. 7, no. 4, pp. 837–846, 2006.
[6] J. Pande, C. Pande, D. Gilg, M. Vasak, R. Callender, andJ. H. R. Kagi, “Raman, infrared, and circular dichroismspectroscopic studies on metallothionein: a predominantly“turn”-containing protein,” Biochemistry, vol. 25, no. 19, pp.5526–5532, 1986.
[7] Z. Q. Wen, L. Hecht, and L. D. Barron, “β-Sheet and associatedturn signatures in vibrational Raman optical activity spectra ofproteins,” Protein Science, vol. 3, no. 3, pp. 435–439, 1994.
[8] M. Malmsten, “Ellipsometry studies of fibronectin adsorp-tion,” Colloids and Surfaces B, vol. 3, no. 6, pp. 371–381, 1995.
[9] G. J. Thomas Jr., “New structural insights from Ramanspectroscopy of proteins and their assemblies,” Biopolymers,vol. 67, no. 4-5, pp. 214–225, 2002.
[10] R. Tuma, “Raman spectroscopy of proteins: from peptides tolarge assemblies,” Journal of Raman Spectroscopy, vol. 36, no.4, pp. 307–319, 2005.
[11] J. Filik and N. Stone, “Drop coating deposition Ramanspectroscopy of protein mixtures,” Analyst, vol. 132, no. 6, pp.544–550, 2007.
[12] X. Peng, J. Jonas, and J. L. Silva, “Molten-globule conforma-tion of Arc repressor monomers determined by high- pressure1H NMR spectroscopy,” Proceedings of the National Academyof Sciences of the United States of America, vol. 90, no. 5, pp.1776–1780, 1993.
[13] J. Dong, D. Dinakarpandian, and P. R. Carey, “Extending theraman analysis of biological samples to the 100 micromolarconcentration range,” Applied Spectroscopy, vol. 52, no. 8, pp.1117–1122, 1998.
[14] R. Goodacre, E. M. Timmins, R. Burton et al., “Rapididentification of urinary tract infection bacteria using hyper-spectral whole-organism fingerprinting and artificial neuralnetworks,” Microbiology, vol. 144, no. 5, pp. 1157–1170, 1998.
[15] A. M. Ahern and R. L. Garrell, “Protein-metal interactions inprotein-colloid conjugates probed by surface-enhanced ramanspectroscopy,” Langmuir, vol. 7, no. 2, pp. 254–261, 1991.
[16] S. F. El-Mashtoly, S. Yamauchi, M. Kumauchi, N. Hamada, F.Tokunaga, and M. Unno, “Structural changes during the pho-tocycle of photoactive yellow protein monitored by ultravioletresonance Raman spectra of tyrosine and tryptophan,” Journalof Physical Chemistry B, vol. 109, no. 49, pp. 23666–23673,2005.
[17] S. Cai and B. R. Singh, “A distinct utility of the amide IIIinfrared band for secondary structure estimation of aqueousprotein solutions using partial least squares methods,” Bio-chemistry, vol. 43, no. 9, pp. 2541–2549, 2004.
[18] R. P. Kengne-Momo, Y. L. Jeyachandran, A. Assaf et al.,“A simple method of surface functionalisation for immuno-specific immobilisation of proteins,” Analytical and Bioanalyt-ical Chemistry, vol. 398, no. 3, pp. 1249–1255, 2010.
[19] Z. A. Combs, S. Chang, T. Clark, S. Singamaneni, K. D.Anderson, and V. V. Tsukruk, “Label-free raman mappingof surface distribution of protein A and IgG biomolecules,”Langmuir, vol. 27, no. 6, pp. 3198–3205, 2011.
[20] J. Duarte, M. T. Pacheco, R. Z. Machado, L. Silveira, R. A.Zangaro, and A. B. Villaverd, “Use of near-infrared ramanspectroscopy to detect IgG and IgM antibodies against Tox-oplasma gondii in serum samples of domestic cats,” Cellularand Molecular Biology, vol. 48, no. 5, pp. 585–589, 2002.
[21] R. Kumar, M. M. Bajaj, and B. Swaroop, “Conformationalchanges in the IgG molecule of lepromatous sera using laserRaman spectroscopy,” Indian Journal of Leprosy, vol. 60, no. 3,pp. 363–373, 1988.
[22] P. C. Painter and L. E. Mosher, “The low-frequency Ramanspectrum of an antibody molecule: bovine IgG,” Biopolymers,vol. 18, no. 12, pp. 3121–3123, 1979.
[23] P. Daniel, P. Picart, L. Bendriaa et al., “Effects of toxicorganotin compounds on bacteria investigated by micro-Raman spectroscopy,” Spectroscopy Letters, vol. 41, no. 1, pp.19–28, 2008.
[24] I. Sjoholm, “Protein A from Staphylococcus aureus. Spec-tropolarimetric and spectrophotometric studies,” EuropeanJournal of Biochemistry, vol. 51, no. 1, pp. 55–61, 1975.
[25] M. Marquart, J. Deisenhofer, and R. Huber, “Crystallographicrefinement and atomic models of the intact immunoglobulinmolecule Kol and its antigen-binding fragment at 3.0 θ and 1.9θ resolution,” Journal of Molecular Biology, vol. 141, no. 4, pp.369–391, 1980.
[26] D. Naumann, “Ft-infrared and Ft-raman spectroscopy inbiomedical research,” Applied Spectroscopy Reviews, vol. 36, no.2-3, pp. 239–298, 2001.
[27] G. C. Stone, U. Sjobring, L. Bjorck, J. Sjoquist, C. V. Barber,and F. A. Nardella, “The Fc binding site for streptococcalprotein G is in the Cγ2-Cγ3 interface region of IgG and isrelated to the sites that bind staphylococcal protein A andhuman rheumatoid factors,” Journal of Immunology, vol. 143,no. 2, pp. 565–570, 1989.
[28] T. Wadayama and M. Oishi, “Surface-enhanced Raman spec-tral study of Au nano-particles/alkanethiol self-assembled

International Journal of Spectroscopy 7
monolayers/Au(1 1 1 ) heterostructures,” Surface Science, vol.600, no. 18, pp. 4352–4356, 2006.
[29] S. Nie and S. R. Emory, “Probing single molecules and singlenanoparticles by surface-enhanced Raman scattering,” Science,vol. 275, no. 5303, pp. 1102–1106, 1997.
[30] R. A. Reynolds III, C. A. Mirkin, and R. L. Letsinger,“Homogeneous, nanoparticle-based quantitative colorimetricdetection of oligonucleotides,” Journal of the American Chem-ical Society, vol. 122, no. 15, pp. 3795–3796, 2000.
[31] T. A. Taton, G. Lu, and C. A. Mirkin, “Two-color labeling ofoligonucleotide arrays via size-selective scattering of nanopar-ticle probes,” Journal of the American Chemical Society, vol.123, no. 21, pp. 5164–5165, 2001.
[32] C. S. Holgate, P. Jackson, P. N. Cowen, and C. C. Bird,“Immunogold-silver staining: new method of immunostain-ing with enhanced sensitivity,” Journal of Histochemistry andCytochemistry, vol. 31, no. 7, pp. 938–944, 1983.
[33] M. Moeremans, G. Daneels, and A. Van Dijck, “Sensitivevisualization of antigen-antibody reactions in dot and blotimmune overlay assays with immunogold and immuno-gold/silver staining,” Journal of Immunological Methods, vol.74, no. 2, pp. 353–360, 1984.
[34] Y. C. Cao, R. Jin, and C. A. Mirkin, “Nanoparticles with Ramanspectroscopic fingerprints for DNA and RNA detection,”Science, vol. 297, no. 5586, pp. 1536–1540, 2002.
[35] S. Sanchez-Cortes, J. V. Garcıa-Ramos, G. Morcillo, andA. Tinti, “Morphological study of silver colloids employedin surface-enhanced raman spectroscopy: activation whenexciting in visible and near-infrared regions,” Journal of ColloidAnd Interface Science, vol. 175, no. 2, pp. 358–368, 1995.
[36] J. Neng, M. H. Harpster, H. Zhang, J. O. Mecham, W.C. Wilson, and P. A. Johnson, “A versatile SERS-basedimmunoassay for immunoglobulin detection using antigen-coated gold nanoparticles and malachite green-conjugatedprotein A/G,” Biosensors and Bioelectronics, vol. 26, no. 3, pp.1009–1015, 2010.

Submit your manuscripts athttp://www.hindawi.com
Hindawi Publishing Corporationhttp://www.hindawi.com Volume 2014
Inorganic ChemistryInternational Journal of
Hindawi Publishing Corporation http://www.hindawi.com Volume 2014
International Journal ofPhotoenergy
Hindawi Publishing Corporationhttp://www.hindawi.com Volume 2014
Carbohydrate Chemistry
International Journal of
Hindawi Publishing Corporationhttp://www.hindawi.com Volume 2014
Journal of
Chemistry
Hindawi Publishing Corporationhttp://www.hindawi.com Volume 2014
Advances in
Physical Chemistry
Hindawi Publishing Corporationhttp://www.hindawi.com
Analytical Methods in Chemistry
Journal of
Volume 2014
Bioinorganic Chemistry and ApplicationsHindawi Publishing Corporationhttp://www.hindawi.com Volume 2014
SpectroscopyInternational Journal of
Hindawi Publishing Corporationhttp://www.hindawi.com Volume 2014
The Scientific World JournalHindawi Publishing Corporation http://www.hindawi.com Volume 2014
Medicinal ChemistryInternational Journal of
Hindawi Publishing Corporationhttp://www.hindawi.com Volume 2014
Chromatography Research International
Hindawi Publishing Corporationhttp://www.hindawi.com Volume 2014
Applied ChemistryJournal of
Hindawi Publishing Corporationhttp://www.hindawi.com Volume 2014
Hindawi Publishing Corporationhttp://www.hindawi.com Volume 2014
Theoretical ChemistryJournal of
Hindawi Publishing Corporationhttp://www.hindawi.com Volume 2014
Journal of
Spectroscopy
Analytical ChemistryInternational Journal of
Hindawi Publishing Corporationhttp://www.hindawi.com Volume 2014
Journal of
Hindawi Publishing Corporationhttp://www.hindawi.com Volume 2014
Quantum Chemistry
Hindawi Publishing Corporationhttp://www.hindawi.com Volume 2014
Organic Chemistry International
ElectrochemistryInternational Journal of
Hindawi Publishing Corporation http://www.hindawi.com Volume 2014
Hindawi Publishing Corporationhttp://www.hindawi.com Volume 2014
CatalystsJournal of