proteins by reversed-phase hplc purification of peptides...
TRANSCRIPT
The Handbook of Analysis and
Purification of Peptides and
Proteins by Reversed-Phase HPLC
Presented byVydac (The Separations Group)
17434 Mojave StreetHesperia CA 92345 USATelephone: 760-244-6107Toll-free : 1-800-247-0924
Facsimile: USA 760-244-1984
The Handbook of Analysis and Purification ofPeptides and Proteins by Reversed-Phase HPLC
Second Edition
This Handbook presents the basic principles of Reversed-Phase HPLC for theanalysis and purification of polypeptides. For further details regarding Reversed-
Phase HPLC separations of polypeptides please refer to the technical references at
the back of the Handbook or contact the Vydac Technical Support Group.
Table of Contents
Introduction ............................................................................................. Page 2
Mechanism of Interaction ....................................................................... Page 4
Chromatographic Conditions .................................................................. Page 8
Column Selection Guide ......................................................................... Page 14
Applications of Reversed-Phase HPLC ................................................ Page 20
Narrow-Bore, Micro-Bore and Capillary Columns ................................. Page 27
Answers to Frequently Asked Questions
What effect does eluent flow rate have on RP-HPLC separations? ...... Page 30
What effect does column length have on RP-HPLC separations? ........ Page 33
How much polypeptide can be purified in one RP-HPLC run? ............. Page 36
What effect do surfactants have on RP-HPLC separations? ................ Page 40
Does RP-HPLC of polypeptides affect biological activity? .................... Page 42
Scaling-Up Reversed-Phase HPLC Separations ................................... Page 44
Synergistic Separation Techniques:
High Performance Ion Exchange Chromatography ............................... Page 50
Appendices
A. The effect of column carbon load on RP-HPLC separations ............ Page 52
B. The effect of system hardware on RP-HPLC polypeptide separations . Page 54
C. Guide to Column Maintenance and Troubleshooting ........................ Page 56
Technical References ............................................................................. Page 59
The Vydac Technical Support Group is available for discussions
regarding your bio-separation questions.
Phone: 1-800-247-0924 Fax : USA 760-244-1984
Page 1
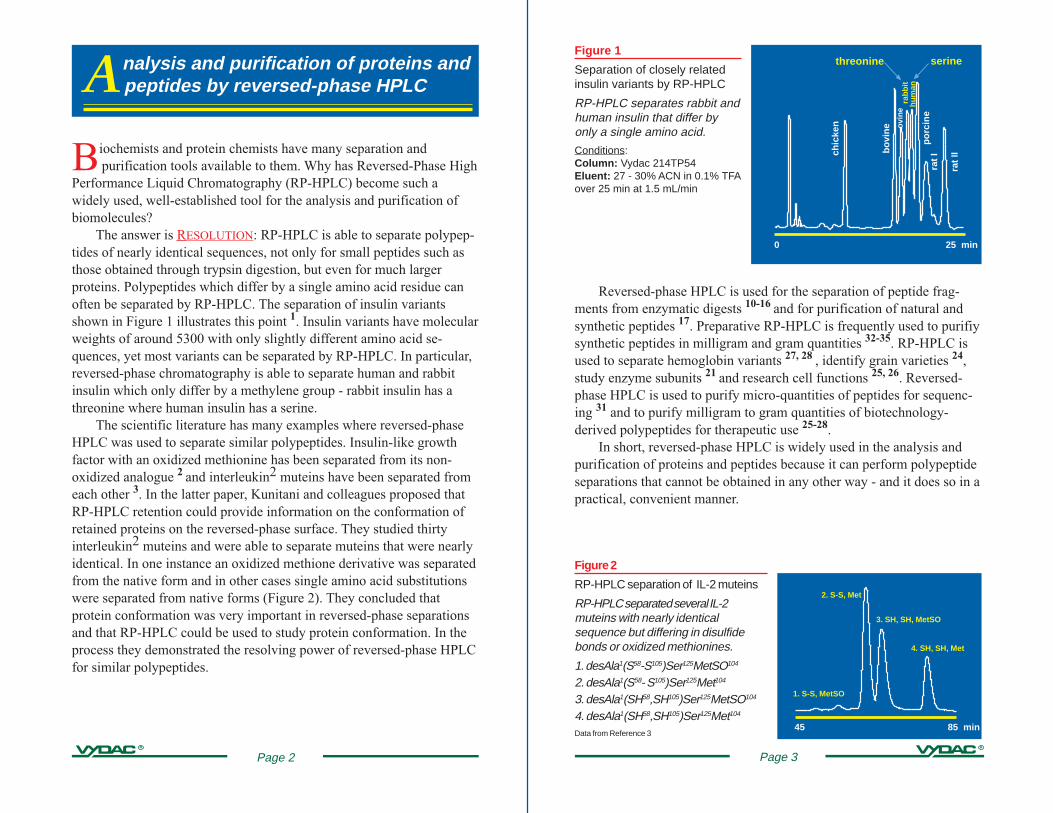
Figure 1
Separation of closely relatedinsulin variants by RP-HPLC
RP-HPLC separates rabbit andhuman insulin that differ byonly a single amino acid.
Conditions:Column: Vydac 214TP54Eluent: 27 - 30% ACN in 0.1% TFAover 25 min at 1.5 mL/min
0 25 min
rat I
Ichic
ken
rat I
porc
ine
bovi
neov
ine
rabb
ithu
man
threonine serine
Reversed-phase HPLC is used for the separation of peptide frag-ments from enzymatic digests 10-16 and for purification of natural andsynthetic peptides 17. Preparative RP-HPLC is frequently used to purifiysynthetic peptides in milligram and gram quantities 32-35. RP-HPLC isused to separate hemoglobin variants 27, 28 , identify grain varieties 24,study enzyme subunits 21 and research cell functions 25, 26. Reversed-phase HPLC is used to purify micro-quantities of peptides for sequenc-ing 31 and to purify milligram to gram quantities of biotechnology-derived polypeptides for therapeutic use 25-28.
In short, reversed-phase HPLC is widely used in the analysis andpurification of proteins and peptides because it can perform polypeptideseparations that cannot be obtained in any other way - and it does so in apractical, convenient manner.
45 85 min
1. S-S, MetSO
4. SH, SH, Met
3. SH, SH, MetSO
2. S-S, Met
Figure 2
RP-HPLC separation of IL-2 muteins
RP-HPLC separated several IL-2muteins with nearly identicalsequence but differing in disulfidebonds or oxidized methionines.
1. desAla1(S58-S105)Ser125MetSO104
2. desAla1(S58- S105)Ser125Met104
3. desAla1(SH58,SH105)Ser125MetSO104
4. desAla1(SH58,SH105)Ser125Met104
Data from Reference 3
Page 3
Analysis and purification of proteins and peptides by reversed-phase HPLC
Biochemists and protein chemists have many separation and purification tools available to them. Why has Reversed-Phase High
Performance Liquid Chromatography (RP-HPLC) become such awidely used, well-established tool for the analysis and purification ofbiomolecules?
The answer is RESOLUTION: RP-HPLC is able to separate polypep-tides of nearly identical sequences, not only for small peptides such asthose obtained through trypsin digestion, but even for much largerproteins. Polypeptides which differ by a single amino acid residue canoften be separated by RP-HPLC. The separation of insulin variantsshown in Figure 1 illustrates this point 1. Insulin variants have molecularweights of around 5300 with only slightly different amino acid se-quences, yet most variants can be separated by RP-HPLC. In particular,reversed-phase chromatography is able to separate human and rabbitinsulin which only differ by a methylene group - rabbit insulin has athreonine where human insulin has a serine.
The scientific literature has many examples where reversed-phaseHPLC was used to separate similar polypeptides. Insulin-like growthfactor with an oxidized methionine has been separated from its non-oxidized analogue 2 and interleukin2 muteins have been separated fromeach other 3. In the latter paper, Kunitani and colleagues proposed thatRP-HPLC retention could provide information on the conformation ofretained proteins on the reversed-phase surface. They studied thirtyinterleukin2 muteins and were able to separate muteins that were nearlyidentical. In one instance an oxidized methione derivative was separatedfrom the native form and in other cases single amino acid substitutionswere separated from native forms (Figure 2). They concluded thatprotein conformation was very important in reversed-phase separationsand that RP-HPLC could be used to study protein conformation. In theprocess they demonstrated the resolving power of reversed-phase HPLCfor similar polypeptides.
Page 2
Important aspects of the adsorption/desorption mechanism ofinteractions between polypeptides and the hydrophobic phase
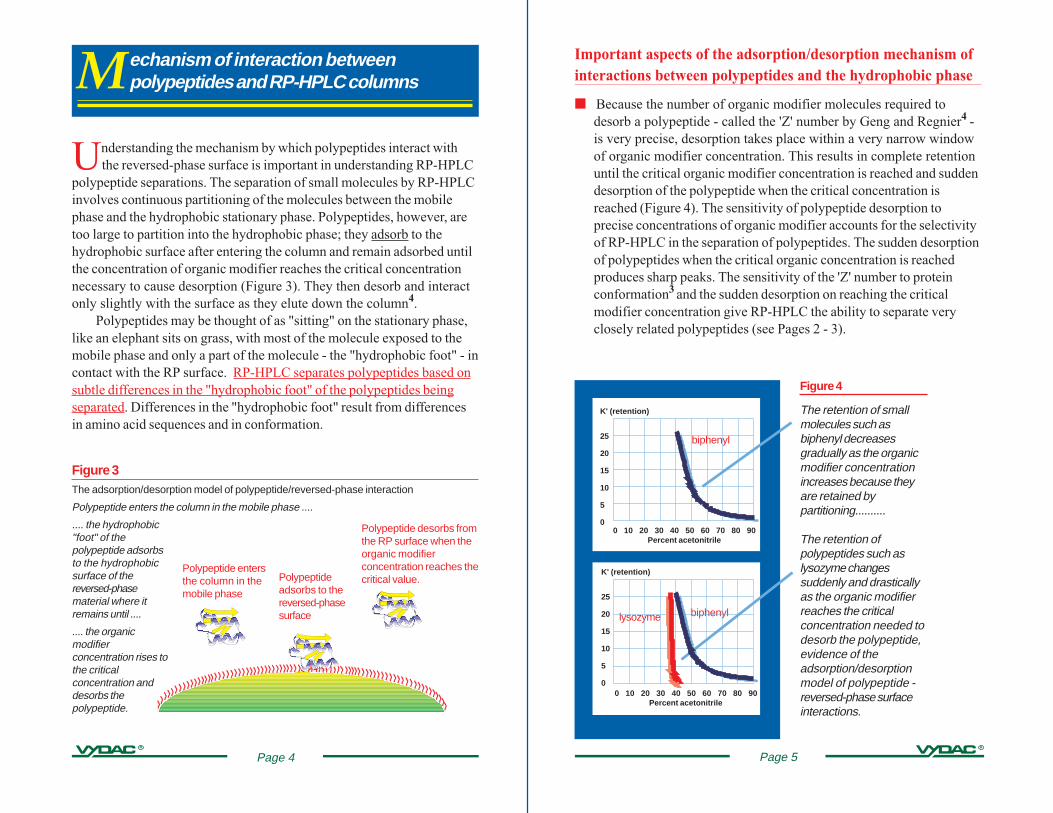
■ Because the number of organic modifier molecules required todesorb a polypeptide - called the 'Z' number by Geng and Regnier4 -is very precise, desorption takes place within a very narrow windowof organic modifier concentration. This results in complete retentionuntil the critical organic modifier concentration is reached and suddendesorption of the polypeptide when the critical concentration isreached (Figure 4). The sensitivity of polypeptide desorption toprecise concentrations of organic modifier accounts for the selectivityof RP-HPLC in the separation of polypeptides. The sudden desorptionof polypeptides when the critical organic concentration is reachedproduces sharp peaks. The sensitivity of the 'Z' number to proteinconformation3 and the sudden desorption on reaching the criticalmodifier concentration give RP-HPLC the ability to separate veryclosely related polypeptides (see Pages 2 - 3).
K' (retention)
25
20
15
10
5
00 10 20 30 40 50 60 70 80 90
Percent acetonitrile
0 10 20 30 40 50 60 70 80 90Percent acetonitrile
K' (retention)
25
20
15
10
5
0
biphenyl
lysozyme
Figure 4
The retention of smallmolecules such asbiphenyl decreasesgradually as the organicmodifier concentrationincreases because theyare retained bypartitioning..........
The retention ofpolypeptides such aslysozyme changessuddenly and drasticallyas the organic modifierreaches the criticalconcentration needed todesorb the polypeptide,evidence of theadsorption/desorptionmodel of polypeptide -reversed-phase surfaceinteractions.
biphenyl
Page 5
M echanism of interaction betweenpolypeptides and RP-HPLC columns
Understanding the mechanism by which polypeptides interact withthe reversed-phase surface is important in understanding RP-HPLC
polypeptide separations. The separation of small molecules by RP-HPLCinvolves continuous partitioning of the molecules between the mobilephase and the hydrophobic stationary phase. Polypeptides, however, aretoo large to partition into the hydrophobic phase; they adsorb to thehydrophobic surface after entering the column and remain adsorbed untilthe concentration of organic modifier reaches the critical concentrationnecessary to cause desorption (Figure 3). They then desorb and interactonly slightly with the surface as they elute down the column4.
Polypeptides may be thought of as "sitting" on the stationary phase,like an elephant sits on grass, with most of the molecule exposed to themobile phase and only a part of the molecule - the "hydrophobic foot" - incontact with the RP surface. RP-HPLC separates polypeptides based onsubtle differences in the "hydrophobic foot" of the polypeptides beingseparated. Differences in the "hydrophobic foot" result from differencesin amino acid sequences and in conformation.
Figure 3The adsorption/desorption model of polypeptide/reversed-phase interaction
Polypeptide enters the column in the mobile phase ....
.... the hydrophobic"foot" of thepolypeptide adsorbsto the hydrophobicsurface of thereversed-phasematerial where itremains until ....
.... the organicmodifierconcentration rises tothe criticalconcentration anddesorbs thepolypeptide.
Polypeptideadsorbs to thereversed-phasesurface
Polypeptide entersthe column in themobile phase
Polypeptide desorbs fromthe RP surface when theorganic modifierconcentration reaches thecritical value.
Page 4
0 10 20 30 40 50 60 70 80 90Percent acetonitrile
K' (retention)
25
20
15
10
5
0
subtle changes in the modifier concentration makes isocratic elutiondifficult because the organic modifier concentration must be main-tained very precisely. Gradient elution is usually preferred for RP-HPLC polypeptide separations, even if the gradient is very shallow -i.e., a small change in organic modifier concentration per unit time.Shallow gradients can be used very effectively to separate similarpolypeptides where isocratic separation would be impractical.
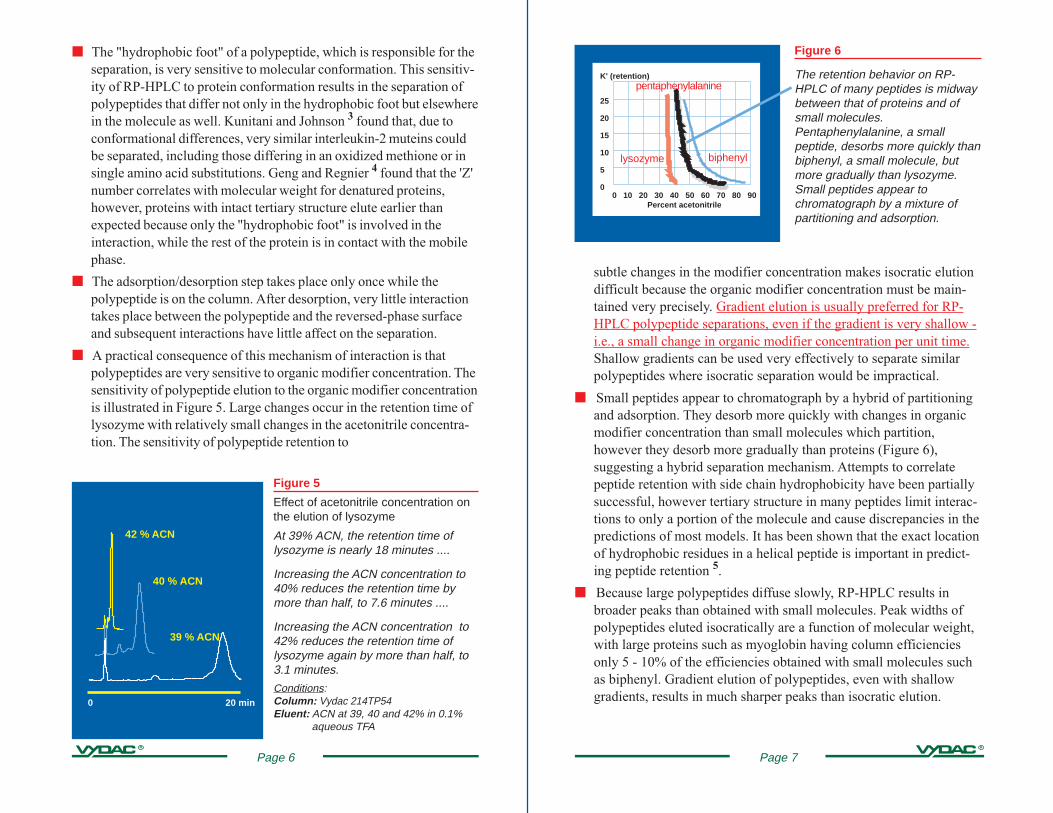
■ Small peptides appear to chromatograph by a hybrid of partitioningand adsorption. They desorb more quickly with changes in organicmodifier concentration than small molecules which partition,however they desorb more gradually than proteins (Figure 6),suggesting a hybrid separation mechanism. Attempts to correlatepeptide retention with side chain hydrophobicity have been partiallysuccessful, however tertiary structure in many peptides limit interac-tions to only a portion of the molecule and cause discrepancies in thepredictions of most models. It has been shown that the exact locationof hydrophobic residues in a helical peptide is important in predict-ing peptide retention 5.
■ Because large polypeptides diffuse slowly, RP-HPLC results inbroader peaks than obtained with small molecules. Peak widths ofpolypeptides eluted isocratically are a function of molecular weight,with large proteins such as myoglobin having column efficienciesonly 5 - 10% of the efficiencies obtained with small molecules suchas biphenyl. Gradient elution of polypeptides, even with shallowgradients, results in much sharper peaks than isocratic elution.
Figure 6
The retention behavior on RP-HPLC of many peptides is midwaybetween that of proteins and ofsmall molecules.Pentaphenylalanine, a smallpeptide, desorbs more quickly thanbiphenyl, a small molecule, butmore gradually than lysozyme.Small peptides appear tochromatograph by a mixture ofpartitioning and adsorption.
lysozyme biphenyl
pentaphenylalanine
Page 7
■ The "hydrophobic foot" of a polypeptide, which is responsible for theseparation, is very sensitive to molecular conformation. This sensitiv-ity of RP-HPLC to protein conformation results in the separation ofpolypeptides that differ not only in the hydrophobic foot but elsewherein the molecule as well. Kunitani and Johnson 3 found that, due toconformational differences, very similar interleukin-2 muteins couldbe separated, including those differing in an oxidized methione or insingle amino acid substitutions. Geng and Regnier 4 found that the 'Z'number correlates with molecular weight for denatured proteins,however, proteins with intact tertiary structure elute earlier thanexpected because only the "hydrophobic foot" is involved in theinteraction, while the rest of the protein is in contact with the mobilephase.
■ The adsorption/desorption step takes place only once while thepolypeptide is on the column. After desorption, very little interactiontakes place between the polypeptide and the reversed-phase surfaceand subsequent interactions have little affect on the separation.
■ A practical consequence of this mechanism of interaction is thatpolypeptides are very sensitive to organic modifier concentration. Thesensitivity of polypeptide elution to the organic modifier concentrationis illustrated in Figure 5. Large changes occur in the retention time oflysozyme with relatively small changes in the acetonitrile concentra-tion. The sensitivity of polypeptide retention to
40 % ACN
42 % ACN
0 20 min
Figure 5
Effect of acetonitrile concentration onthe elution of lysozyme
At 39% ACN, the retention time oflysozyme is nearly 18 minutes ....
Increasing the ACN concentration to40% reduces the retention time bymore than half, to 7.6 minutes ....
Increasing the ACN concentration to42% reduces the retention time oflysozyme again by more than half, to3.1 minutes.
Conditions:Column: Vydac 214TP54Eluent: ACN at 39, 40 and 42% in 0.1%
aqueous TFA
39 % ACN
Page 6

Figure 8
UV spectra of TFA in solutions of variousconcentration ratios of acetonitrile:water
The adsorption spectrum of TFA shiftsas the acetonitrile:water ratio changescausing a baseline shift in typicalpeptide gradient chromatograms.
210 230 250 270Wavelength (nm)
adso
rban
ce
Elution gradients with a constant concentration of TFA - i.e., thesame concentration of TFA in both Solvent A and Solvent B - some-times result in a drifting baseline when monitoring at 210 - 220 nm. Thechange in dielectric constant as the solvent environment goes fromaqueous to non-aqueous affects π-π electron interactions which, in turn,changes the adsorption spectrum in the 190 to 250 nm region (Figure 7).
A close look at the UV spectra of TFA at various organic modifier(acetonitrile) concentrations (Figure 8) shows that the wavelength mustbe adjusted to precisely 215-216 nm to avoid the shift in adsorptionspectra which causes the baseline drift. In practice it is nearly impos-sible to adjust the detection wavelength that precisely.
Recommendation: adjust the wavelength as close to 215 nm as possibleAND put 15% less TFA in Solvent B as in Solvent A to compensate fora slight adsorption shift. For example, use 0.1% TFA in Solvent A and0.085% TFA in Solvent B.
It is important to use good quality TFA and to obtain this in smallamounts. Poor quality or aged TFA may have impurities that chromato-graph in the reversed-phase system, causing spurious peaks to appear(see Appendix C). Water can also have hydrophobic impurities whichchromatograph and cause spurious peaks.
0% ACN(Water)
Page 9
50% ACN
100% ACN
90 % ACN
Figure 7
Comparison of the UV spectra ofTFA in water and in acetonitrile
Differences in dielectric constantmodify pi-pi electron transitionsand result in different spectra forTFA in water and in acetonitrile.
Data from Reference 7
Chromatographic conditions forseparating polypeptides by RP-HPLC
The desorption and elution of polypeptides from reversed-phaseHPLC columns is accomplished with aqueous solvents which
contain an organic modifier and either an ion-pairing agent or a buffer.The organic modifier solubilizes and desorbs the polypeptide from thehydrophobic surface while the ion-pair agent or buffer sets the eluent pHand interacts with the polypeptide to enhance the separation.
Ion-pairing agents and buffers.Ion-pairing agents interact with polypeptides in solution to enhance
separation and to help solubilize polypeptides.
■ The most common ion-pairing agent is trifluoroacetic acid (TFA),which is used in most RP-HPLC polypeptide separations. TFA iswidely used because:
✓ It is volatile and easily removed from collected fractions;✓ It has little UV adsorption at low wavelengths;✓ And, it has a long history of proven reliability in RP-HPLC
polypeptide separations.
TFA is normally used at concentrations of about 0.1% (w/v). TFAconcentrations up to 0.5% have been useful in solubilizing larger ormore hydrophobic proteins and lower concentrations are occasionallyused for tryptic digest separations. The use of TFA concentrations below0.1% may degrade peak shape and is not recommended for polypeptideslarger than a few hundred molecular weight.
abso
rban
ce
.01 M TFA in acetonitrile
.01 M TFA in water
190 210 230 250 270 290Wavelength (nm)
Page 8
The effect of pH on peptideseparations
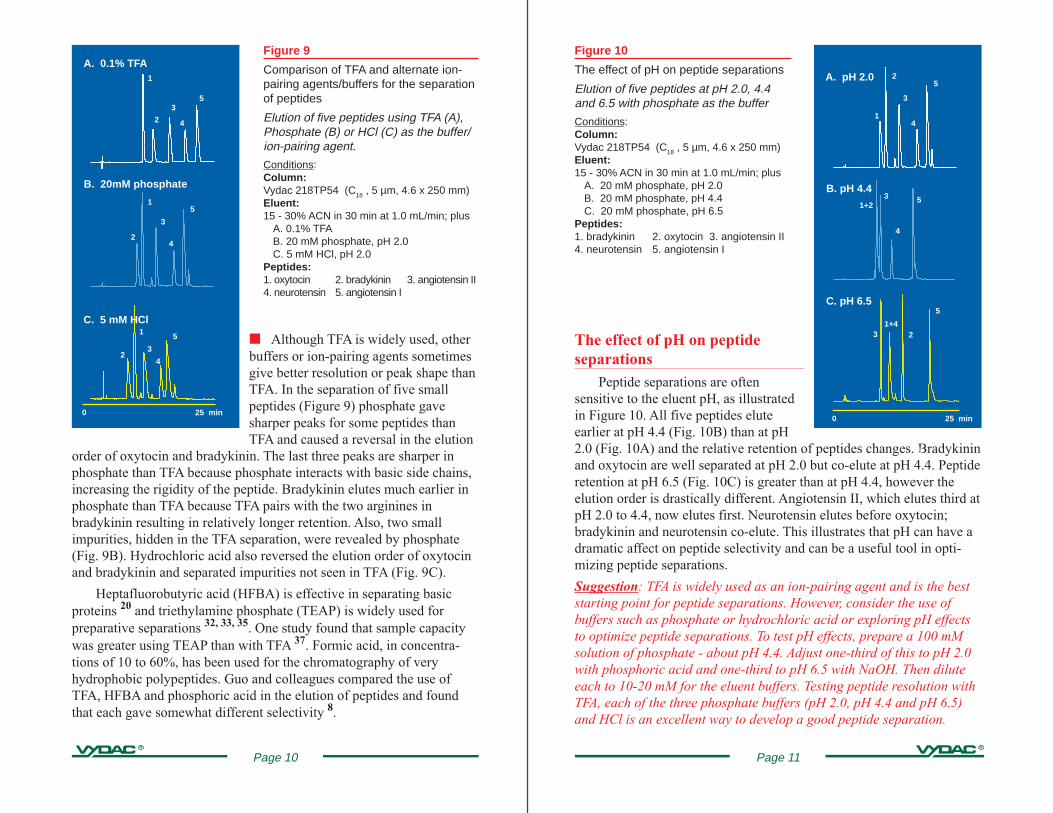
Peptide separations are oftensensitive to the eluent pH, as illustratedin Figure 10. All five peptides eluteearlier at pH 4.4 (Fig. 10B) than at pH2.0 (Fig. 10A) and the relative retention of peptides changes. Bradykininand oxytocin are well separated at pH 2.0 but co-elute at pH 4.4. Peptideretention at pH 6.5 (Fig. 10C) is greater than at pH 4.4, however theelution order is drastically different. Angiotensin II, which elutes third atpH 2.0 to 4.4, now elutes first. Neurotensin elutes before oxytocin;bradykinin and neurotensin co-elute. This illustrates that pH can have adramatic affect on peptide selectivity and can be a useful tool in opti-mizing peptide separations.
Suggestion: TFA is widely used as an ion-pairing agent and is the beststarting point for peptide separations. However, consider the use ofbuffers such as phosphate or hydrochloric acid or exploring pH effectsto optimize peptide separations. To test pH effects, prepare a 100 mMsolution of phosphate - about pH 4.4. Adjust one-third of this to pH 2.0with phosphoric acid and one-third to pH 6.5 with NaOH. Then diluteeach to 10-20 mM for the eluent buffers. Testing peptide resolution withTFA, each of the three phosphate buffers (pH 2.0, pH 4.4 and pH 6.5)and HCl is an excellent way to develop a good peptide separation.
Figure 10
The effect of pH on peptide separations
Elution of five peptides at pH 2.0, 4.4and 6.5 with phosphate as the buffer
Conditions:Column:Vydac 218TP54 (C18 , 5 µm, 4.6 x 250 mm)Eluent:15 - 30% ACN in 30 min at 1.0 mL/min; plus
A. 20 mM phosphate, pH 2.0B. 20 mM phosphate, pH 4.4C. 20 mM phosphate, pH 6.5
Peptides:1. bradykinin 2. oxytocin 3. angiotensin II4. neurotensin 5. angiotensin I
Page 11
1+23
5
A. pH 2.0
B. pH 4.4
0 25 min
21+4
C. pH 6.55
3
5
4
5
4
3
2
1
Figure 9
Comparison of TFA and alternate ion-pairing agents/buffers for the separationof peptides
Elution of five peptides using TFA (A),Phosphate (B) or HCl (C) as the buffer/ion-pairing agent.
Conditions:Column:Vydac 218TP54 (C18 , 5 µm, 4.6 x 250 mm)Eluent:15 - 30% ACN in 30 min at 1.0 mL/min; plus
A. 0.1% TFAB. 20 mM phosphate, pH 2.0C. 5 mM HCl, pH 2.0
Peptides:1. oxytocin 2. bradykinin 3. angiotensin II4. neurotensin 5. angiotensin I
■ Although TFA is widely used, otherbuffers or ion-pairing agents sometimesgive better resolution or peak shape thanTFA. In the separation of five smallpeptides (Figure 9) phosphate gavesharper peaks for some peptides thanTFA and caused a reversal in the elution
order of oxytocin and bradykinin. The last three peaks are sharper inphosphate than TFA because phosphate interacts with basic side chains,increasing the rigidity of the peptide. Bradykinin elutes much earlier inphosphate than TFA because TFA pairs with the two arginines inbradykinin resulting in relatively longer retention. Also, two smallimpurities, hidden in the TFA separation, were revealed by phosphate(Fig. 9B). Hydrochloric acid also reversed the elution order of oxytocinand bradykinin and separated impurities not seen in TFA (Fig. 9C).
Heptafluorobutyric acid (HFBA) is effective in separating basicproteins 20 and triethylamine phosphate (TEAP) is widely used forpreparative separations 32, 33, 35. One study found that sample capacitywas greater using TEAP than with TFA 37. Formic acid, in concentra-tions of 10 to 60%, has been used for the chromatography of veryhydrophobic polypeptides. Guo and colleagues compared the use ofTFA, HFBA and phosphoric acid in the elution of peptides and foundthat each gave somewhat different selectivity 8.
Page 10
A. 0.1% TFA
B. 20mM phosphate
0 25 min
1
2
3
4
5
2
1
3
4
5
2
1
3
4
5
C. 5 mM HCl
We recommend beginning gradients at no less than 3 to 5% organicmodifier concentration. Gradients beginning with less organic modifiermay cause column equilibration to be long or irreproducible because ofthe difficulty in "wetting" the surface. We also recommend endinggradients at no more than 95% organic modifier. High organic concen-trations may remove all traces of water from the organic phase, alsomaking column equilibration more difficult. For the best reproducibilityand equilibration, avoid extremes in organic modifier composition.
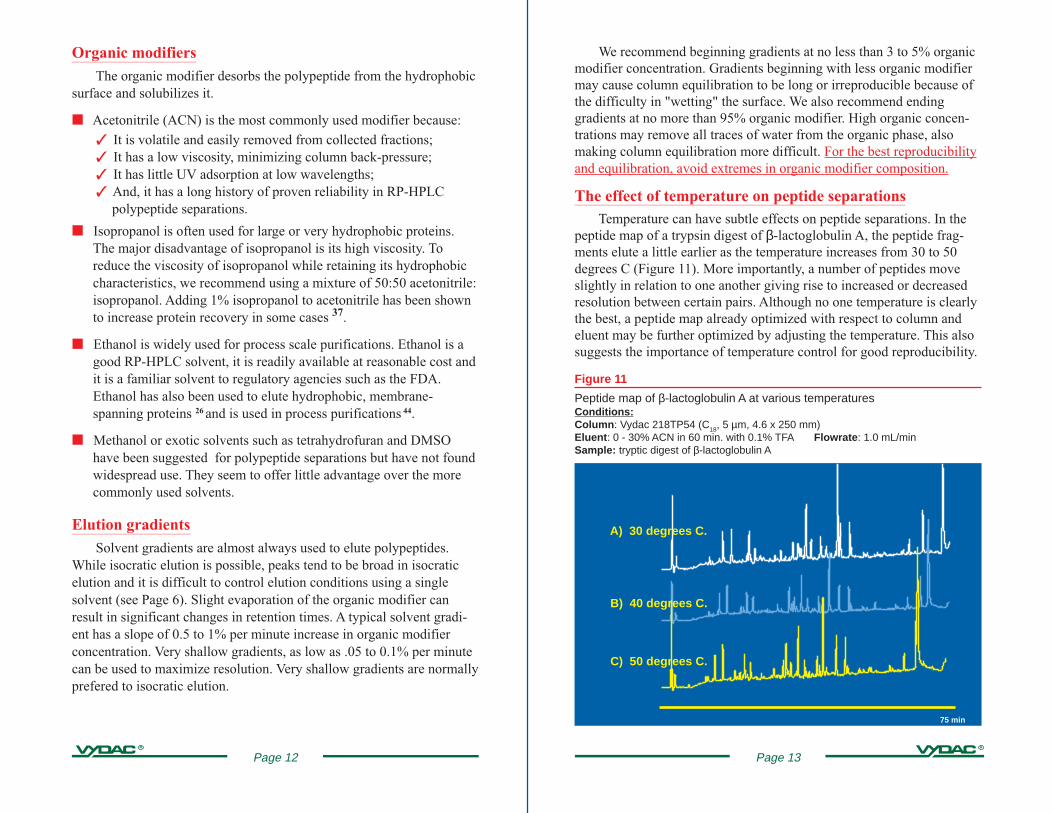
The effect of temperature on peptide separationsTemperature can have subtle effects on peptide separations. In the
peptide map of a trypsin digest of β-lactoglobulin A, the peptide frag-ments elute a little earlier as the temperature increases from 30 to 50degrees C (Figure 11). More importantly, a number of peptides moveslightly in relation to one another giving rise to increased or decreasedresolution between certain pairs. Although no one temperature is clearlythe best, a peptide map already optimized with respect to column andeluent may be further optimized by adjusting the temperature. This alsosuggests the importance of temperature control for good reproducibility.
75 min
Figure 11
Peptide map of β-lactoglobulin A at various temperaturesConditions:Column : Vydac 218TP54 (C18, 5 µm, 4.6 x 250 mm)Eluent : 0 - 30% ACN in 60 min. with 0.1% TFA Flowrate : 1.0 mL/minSample: tryptic digest of β-lactoglobulin A
C) 50 degrees C.
B) 40 degrees C.
A) 30 degrees C.
Page 13
Organic modifiersThe organic modifier desorbs the polypeptide from the hydrophobic
surface and solubilizes it.
■ Acetonitrile (ACN) is the most commonly used modifier because:✓ It is volatile and easily removed from collected fractions;✓ It has a low viscosity, minimizing column back-pressure;✓ It has little UV adsorption at low wavelengths;✓ And, it has a long history of proven reliability in RP-HPLC
polypeptide separations.
■ Isopropanol is often used for large or very hydrophobic proteins.The major disadvantage of isopropanol is its high viscosity. Toreduce the viscosity of isopropanol while retaining its hydrophobiccharacteristics, we recommend using a mixture of 50:50 acetonitrile:isopropanol. Adding 1% isopropanol to acetonitrile has been shownto increase protein recovery in some cases 37.
■ Ethanol is widely used for process scale purifications. Ethanol is agood RP-HPLC solvent, it is readily available at reasonable cost andit is a familiar solvent to regulatory agencies such as the FDA.Ethanol has also been used to elute hydrophobic, membrane-spanning proteins 26 and is used in process purifications 44.
■ Methanol or exotic solvents such as tetrahydrofuran and DMSOhave been suggested for polypeptide separations but have not foundwidespread use. They seem to offer little advantage over the morecommonly used solvents.
Elution gradientsSolvent gradients are almost always used to elute polypeptides.
While isocratic elution is possible, peaks tend to be broad in isocraticelution and it is difficult to control elution conditions using a singlesolvent (see Page 6). Slight evaporation of the organic modifier canresult in significant changes in retention times. A typical solvent gradi-ent has a slope of 0.5 to 1% per minute increase in organic modifierconcentration. Very shallow gradients, as low as .05 to 0.1% per minutecan be used to maximize resolution. Very shallow gradients are normallyprefered to isocratic elution.
Page 12

■ Phase type. The length of the hydrophobic ligand on the reversed-phase surface - whether it be C
18, C
8, C
4, etc. - makes little differ-
ence in many polypeptide separations because of the mechanism ofinteraction with the reversed-phase surface (see Pgs. 4-7). Althoughmany proteins and peptides can be separated equally well on any ofseveral RP-HPLC columns, experience does suggest that certainreversed-phase columns will separate polypeptides with specificcharacteristics better than others. C
18 is normally used for small
peptides and C4 is used for larger peptides and proteins. C
8 offers an
alternate reversed-phase with intermediate characteristics. Phenylreversed-phase is slightly less hydrophobic than C
4 and may offer
unique selectivity for some polypeptides. Table 1 and Figure 12give specific recommendations.
Figure 12Guide to selection of reversed-phase columns for polypeptide separations
C4 (214TP)
C18 Small Pore (201HS)
Increasing hydrophilicity Increasing hydrophobicity
Mol
ecul
ar w
eigh
t10
0,00
0
10,
000
1
,000
1
00
C8 (208TP)
C18 (218TP)
Page 15
Polypeptide Application
✔ peptides < 5,000 MW✔ enzymatic digest fragments✔ natural and synthetic peptides
✔ polypeptides > 5,000 MW✔ hydrophobic polypeptides
✔ peptides < 20,000 MW✔ enzymatic digest fragments✔ natural and synthetic peptides
✔ large, hydrophobic proteins✔ peptides with aromatic side-chains
✔ small peptides (2-10 aa)
✔ basic or very hydrophilic peptides
Recommended RP Column
C18 (218TP)
C4 (214TP)
C8 (208TP)
Phenyl (219TP)
Small pore C18 (201HS)
Table 1
Recommended HPLC columns for polypeptide separation applications
Selecting the optimum reversed-phase HPLC column for the analysisor purification of a polypeptide sample depends on the characteris-
tics of the polypeptide and impurities to be chromatographed, the natureof the sample itself, and the purpose of the chromatography.
■ Silica pore size. 300 angstrom pore silica dominates the reversed-phase separation of polypeptides because resolution is generallybest with this pore diameter silica 9 - even for small peptides.Smaller pore silicas ( 60-120 angstrom) may sometimes separatesmall or hydrophilic peptides better than large pore silica.
■ Particle size. Five micron materials give the best resolution and arerecommended for analytical and small scale preparative separationswith columns of 1.0 mm (microbore), 2.1 mm (narrowbore) and 4.6mm (analytical) diameter. Larger 10 mm diameter (semi-prepara-tive) columns may be packed with either five or ten micron materi-als and 22 mm diameter (preparative) columns are packed with tenmicron materials. Process chromatography columns are generallypacked with 10-15, 15-20 or 20-30 micron materials.
Column selection guide for the separationof polypeptides by reversed-phase HPLC
Page 14

The separation of tryptic digest fragments of β-lactoglobulin A onthree different RP-HPLC columns illustrates the subtle effects thatdifferent phases sometimes have on reversed-phase separations ofpeptides (Figure 14). Although the separations are similar, there aredistinct differences between them. The C
4 column has slightly less
retention and a somewhat different peptide fragment elution pattern thanthe more commonly used C
18 column. The small pore C
18 column also
has a different elution pattern than the large pore C18
column, althoughfewer fragments appear suggesting that, for this digest, there is lessresolution with the small pore C
18 column. For other digests or samples
the small pore column may give better resolution. Testing the separationon different columns is the only practical way of determining whichcolumn will give the best resolution. Selectivity differences betweenreversed-phase columns are used in some laboratories to perform two-dimensional peptide separations (Figure 17, Page 22) 11.
0 60 min
C. Small pore C 18 (201HS54)
B. C4 (214TP54)
A. C18 (218TP54)
Figure 14
Separation of a tryptic digest on different reversed-phase columns
Conditions:Columns: Vydac 218TP54 (C18); 214TP54 (C4); 201HS54 (Small pore C18);Eluent: 0 - 30 % ACN in 0.1% aqueous TFA over 60 minutes at 1.0 mLmin.Sample: tryptic digest of β-lactoglobulin A
Page 17
Figure 13Peptide separation on different reversed-phase columns
Conditions:Columns: Vydac 218TP54 (C18); 214TP54 (C4); 219TP54 (phenyl); 201HS54 (Small pore C18);Eluent: 15 - 30 % ACN in 0.1% aqueous TFA over 30 minutes at 1.0 mL/min.Sample: 1. oxytocin, 2. bradykinin, 3. angiotensin II, 4. neurotensin, 5. angiotensin I.
A. C18 (218TP54)
2
5
43
1
4 + 5
1
23
B. C4 (214TP54)
5
43
2
1
2
13
4
5
Beyond the recommendations in Table 1, subtle differences inreversed-phase hydrophobic surfaces sometimes result in differences inRP-HPLC selectivity for peptides that can be used to optimize specificpeptide separations. The separation of five peptides illustrates this(Figure 13). RP-HPLC selectivity for the five peptides is about the sameon the C
18 and C
4 columns, although the C
4 column has slightly shorter
retention (Figures 13A and 13B). The phenyl column has both shorterretention and different selectivity than the C
18 column. Bradykinin, with
two phenylalanines, is retained somewhat longer, relative to the otherpeptides, on the phenyl column than on the C
18 column and angiotensin I
- with one histidine - and angiotensin II - with two histidines - both eluteearlier relative to the other peptides on the phenyl column than on theC
18 column (Figure 13C). Selectivity on the small pore C
18 column
(Figure 13D) is markedly different from the large pore columns. All fivepeptides are more strongly retained, with the cyclic oxytocin being verystrongly retained, switching places with bradykinin. Neurotensin, alarger peptide is also more strongly retained and an impurity appearsafter angiotensin I that does not appear on the large pore columns.
C. Phenyl
(219TP54)
D. Small pore C 18
(201HS54)
Page 16

Table 2Characteristics of Reversed-Phase HPLC Columns of Different Diameters
Sample capacity
Optimum: .05 to 10 µg
Optimum: .2 to 50 µg
Optimum: 1 to 200 µg
Optimum: up to 1 mg
Practical: up to 40 mg
Optimum: up to 5 mg
Practical: up to 200 mg
Optimum: up to 25 mg
Practical: up to 1-5 g
Optimum: up to 125 mg
Practical: up to 5-25 g
Diameter(internal)
1.0 mm
2.1 mm
4.6 mm
10 mm
22 mm
50 mm
100 mm
RecommendedFlow rate
25 - 50 µL/min
100 - 300 µL/min
.5 - 1.5 mL/min
2.5 - 7.5 mL/min
10 - 30 mL/min
50 - 100 mL/min
150 - 300 mL/min
Preparative
Semi-preparative
Analytical
Narrowbore
Microbore
Process
Page 19
These data illustrate the empirical nature of reversed-phasecolumn selection for peptide separations. Although certainrecommendations can be made, each laboratory must determineexperimentally which of the available reversed-phase columnswill best separate their particular sample, always keeping inmind that subtle differences in reversed-phase surfaces mayaffect peptide selectivity (See Appendix A).
■ Column diameter. The choice of column diameter depends on therequired sample load and flow rate. Analytical - 4.6 mm i.d. -columns are the standard for general HPLC separations and offerthe best performance for samples of 1 - 100 µg. Small bore columns(1.0 and 2.1 mm i.d.) can improve sensitivity and reduce solventusage (see Page 27). Larger diameter columns are used for purifica-tion of larger amounts of polypeptide with the optimum diameter afunction of the required sample capacity and the flow rate capabilityof the HPLC system. Sample capacities and recommended flowrates for columns of various diameters are given in Table 2.
■ Column length. Column length does not significantly affect mostpolypeptide separations (see Page 33). For this reason columns of 5- 15 cm length are recommended for proteins and larger peptides.Small peptides, such as those resulting from trypsin digests, arebetter separated on longer columns and columns of 15 - 25 cmlength are recommended for the separation of synthetic and naturalpeptides and for enzymatic digest maps. Short columns can be usedwith fast gradients for rapid analysis at reduced resolution.
Page 18
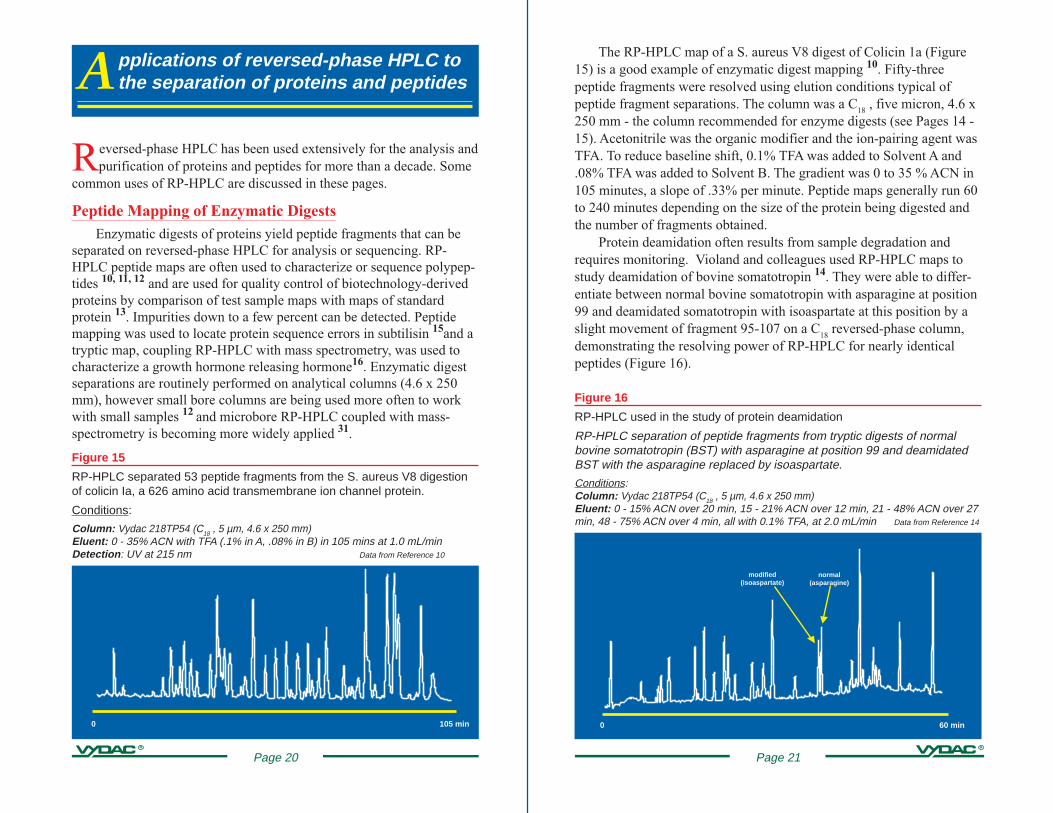
The RP-HPLC map of a S. aureus V8 digest of Colicin 1a (Figure15) is a good example of enzymatic digest mapping 10. Fifty-threepeptide fragments were resolved using elution conditions typical ofpeptide fragment separations. The column was a C
18 , five micron, 4.6 x
250 mm - the column recommended for enzyme digests (see Pages 14 -15). Acetonitrile was the organic modifier and the ion-pairing agent wasTFA. To reduce baseline shift, 0.1% TFA was added to Solvent A and.08% TFA was added to Solvent B. The gradient was 0 to 35 % ACN in105 minutes, a slope of .33% per minute. Peptide maps generally run 60to 240 minutes depending on the size of the protein being digested andthe number of fragments obtained.
Protein deamidation often results from sample degradation andrequires monitoring. Violand and colleagues used RP-HPLC maps tostudy deamidation of bovine somatotropin 14. They were able to differ-entiate between normal bovine somatotropin with asparagine at position99 and deamidated somatotropin with isoaspartate at this position by aslight movement of fragment 95-107 on a C
18 reversed-phase column,
demonstrating the resolving power of RP-HPLC for nearly identicalpeptides (Figure 16).
0 60 min
Figure 16
RP-HPLC used in the study of protein deamidation
RP-HPLC separation of peptide fragments from tryptic digests of normalbovine somatotropin (BST) with asparagine at position 99 and deamidatedBST with the asparagine replaced by isoaspartate.
Conditions:Column: Vydac 218TP54 (C18 , 5 µm, 4.6 x 250 mm)Eluent: 0 - 15% ACN over 20 min, 15 - 21% ACN over 12 min, 21 - 48% ACN over 27min, 48 - 75% ACN over 4 min, all with 0.1% TFA, at 2.0 mL/min Data from Reference 14
modified(isoaspartate)
normal(asparagine)
Page 21
Applications of reversed-phase HPLC tothe separation of proteins and peptides
0 105 min
Reversed-phase HPLC has been used extensively for the analysis andpurification of proteins and peptides for more than a decade. Some
common uses of RP-HPLC are discussed in these pages.
Peptide Mapping of Enzymatic DigestsEnzymatic digests of proteins yield peptide fragments that can be
separated on reversed-phase HPLC for analysis or sequencing. RP-HPLC peptide maps are often used to characterize or sequence polypep-tides 10, 11, 12 and are used for quality control of biotechnology-derivedproteins by comparison of test sample maps with maps of standardprotein 13. Impurities down to a few percent can be detected. Peptidemapping was used to locate protein sequence errors in subtilisin 15and atryptic map, coupling RP-HPLC with mass spectrometry, was used tocharacterize a growth hormone releasing hormone16. Enzymatic digestseparations are routinely performed on analytical columns (4.6 x 250mm), however small bore columns are being used more often to workwith small samples 12 and microbore RP-HPLC coupled with mass-spectrometry is becoming more widely applied 31.
Figure 15
RP-HPLC separated 53 peptide fragments from the S. aureus V8 digestionof colicin Ia, a 626 amino acid transmembrane ion channel protein.
Conditions:
Column: Vydac 218TP54 (C18 , 5 µm, 4.6 x 250 mm)Eluent: 0 - 35% ACN with TFA (.1% in A, .08% in B) in 105 mins at 1.0 mL/minDetection : UV at 215 nm Data from Reference 10
Page 20
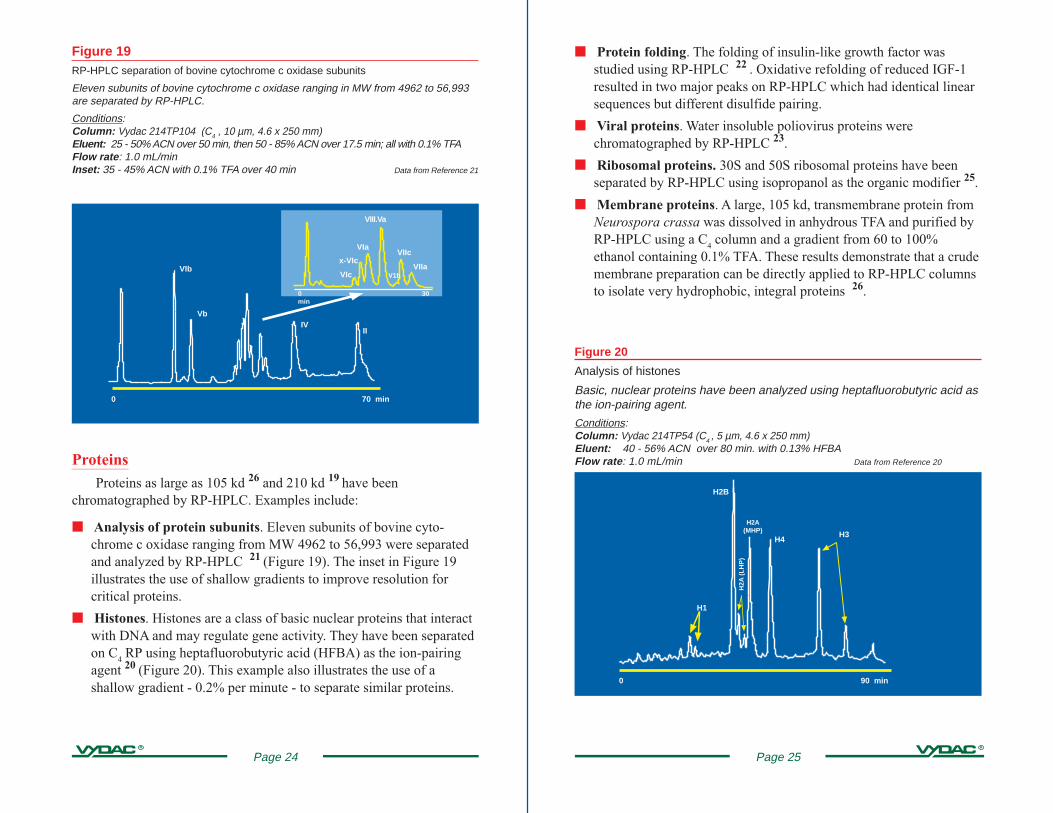
Natural and Synthetic PeptidesRP-HPLC is often used for the isolation and characterization of
natural peptides. Scarborough and colleagues 17 used a C18
, five micron,4.6 x 250 mm column - the recommended column for small peptides - toisolate two octapeptides with cardioacceleratory activity from a cock-roach extract (Figure 18). The elution conditions are a good example forisolation of natural peptides. The organic modifier was acetonitrile andthe ion-pairing agent was 0.1% TFA. Elution began with a ten minutehold at 18% ACN to quickly remove weakly bound components. Theactive peptides were then eluted with a gradual gradient from 18 to 30%ACN over 60 minutes, a gradient slope of 0.2% per minute. This is agood example of the use of a shallow gradient to maximize resolutionfor the peptides of interest. Finally, strongly bound components of theextract were removed with a more rapid gradient from 30 to 60% ACNover 30 minutes.
RP-HPLC was used to separate peptides related to Alzheimer'sdisease 18 and is widely used to purify synthetic peptides (Pages 44-49).
0 100 min
Figure 18
RP-HPLC separation of natural peptides
RP-HPLC was used to separate two octapeptides with cardioacceleratoryactivity from an extract of Periplaneta americana - american cockroach.
Conditions:Column: Vydac 218TP54 (C18 , 5 µm, 4.6 x 250 mm)Eluent: Hold at 18% ACN for 10 min; 18 - 30% ACN from 10 - 70 min, 30 - 60% ACNfrom 70 - 100 min; all with 0.1% TFA Data from Reference 17
Octapeptides with cardioacceleratory activity
Page 23
Figure 17
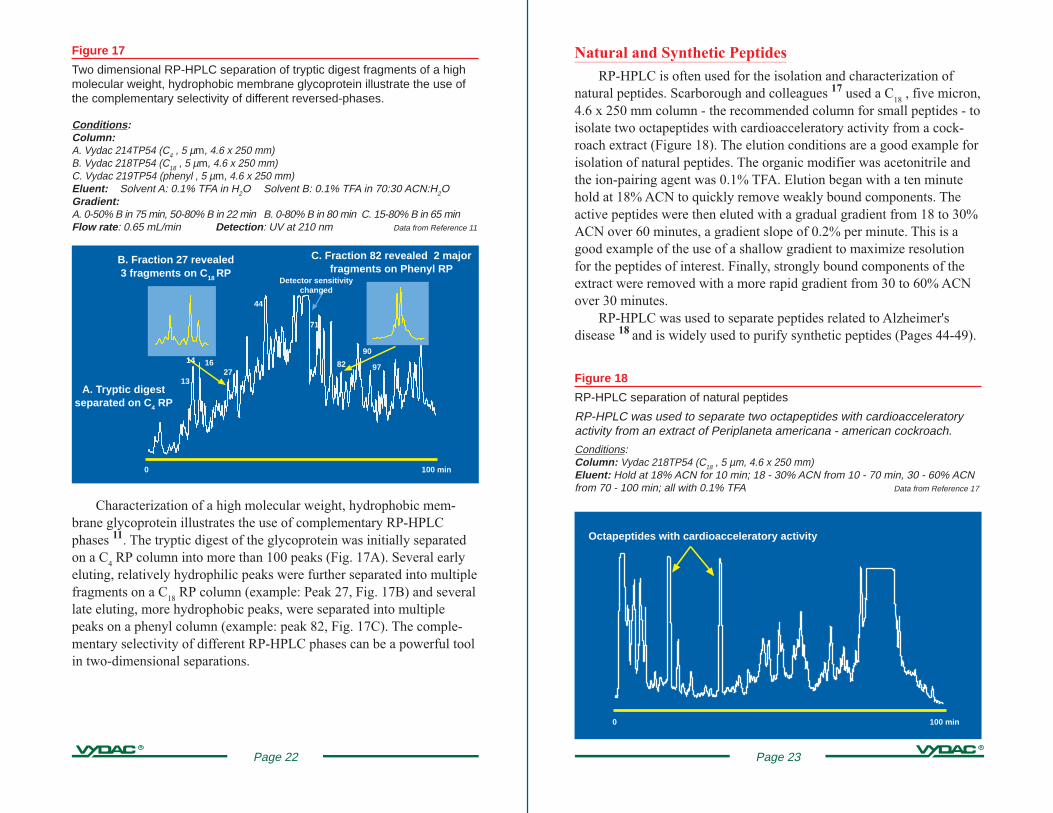
Two dimensional RP-HPLC separation of tryptic digest fragments of a highmolecular weight, hydrophobic membrane glycoprotein illustrate the use ofthe complementary selectivity of different reversed-phases.
Conditions:Column:A. Vydac 214TP54 (C4 , 5 µm, 4.6 x 250 mm)B. Vydac 218TP54 (C18 , 5 µm, 4.6 x 250 mm)C. Vydac 219TP54 (phenyl , 5 µm, 4.6 x 250 mm)Eluent: Solvent A: 0.1% TFA in H2O Solvent B: 0.1% TFA in 70:30 ACN:H2OGradient:A. 0-50% B in 75 min, 50-80% B in 22 min B. 0-80% B in 80 min C. 15-80% B in 65 minFlow rate : 0.65 mL/min Detection : UV at 210 nm Data from Reference 11
0 100 min
B. Fraction 27 revealed3 fragments on C 18 RP
13
14 1627
44
Characterization of a high molecular weight, hydrophobic mem-brane glycoprotein illustrates the use of complementary RP-HPLCphases 11. The tryptic digest of the glycoprotein was initially separatedon a C
4 RP column into more than 100 peaks (Fig. 17A). Several early
eluting, relatively hydrophilic peaks were further separated into multiplefragments on a C
18 RP column (example: Peak 27, Fig. 17B) and several
late eluting, more hydrophobic peaks, were separated into multiplepeaks on a phenyl column (example: peak 82, Fig. 17C). The comple-mentary selectivity of different RP-HPLC phases can be a powerful toolin two-dimensional separations.
A. Tryptic digestseparated on C 4 RP
C. Fraction 82 revealed 2 majorfragments on Phenyl RP
71
90
9782
Detector sensitivitychanged
Page 22
■ Protein folding. The folding of insulin-like growth factor wasstudied using RP-HPLC 22 . Oxidative refolding of reduced IGF-1resulted in two major peaks on RP-HPLC which had identical linearsequences but different disulfide pairing.
■ Viral proteins. Water insoluble poliovirus proteins werechromatographed by RP-HPLC 23.
■ Ribosomal proteins. 30S and 50S ribosomal proteins have beenseparated by RP-HPLC using isopropanol as the organic modifier 25.
■ Membrane proteins. A large, 105 kd, transmembrane protein fromNeurospora crassa was dissolved in anhydrous TFA and purified byRP-HPLC using a C
4 column and a gradient from 60 to 100%
ethanol containing 0.1% TFA. These results demonstrate that a crudemembrane preparation can be directly applied to RP-HPLC columnsto isolate very hydrophobic, integral proteins 26.
H2B
H2A
(LH
P)
0 90 min
Figure 20
Analysis of histones
Basic, nuclear proteins have been analyzed using heptafluorobutyric acid asthe ion-pairing agent.
Conditions:Column: Vydac 214TP54 (C4 , 5 µm, 4.6 x 250 mm)Eluent: 40 - 56% ACN over 80 min. with 0.13% HFBAFlow rate : 1.0 mL/min Data from Reference 20
H2A(MHP)
H4H3
H1
Page 25
Figure 19RP-HPLC separation of bovine cytochrome c oxidase subunits
Eleven subunits of bovine cytochrome c oxidase ranging in MW from 4962 to 56,993are separated by RP-HPLC.
Conditions:Column: Vydac 214TP104 (C4 , 10 µm, 4.6 x 250 mm)Eluent: 25 - 50% ACN over 50 min, then 50 - 85% ACN over 17.5 min; all with 0.1% TFAFlow rate : 1.0 mL/minInset: 35 - 45% ACN with 0.1% TFA over 40 min Data from Reference 21
0 30min
ProteinsProteins as large as 105 kd 26 and 210 kd 19 have been
chromatographed by RP-HPLC. Examples include:
■ Analysis of protein subunits. Eleven subunits of bovine cyto-chrome c oxidase ranging from MW 4962 to 56,993 were separatedand analyzed by RP-HPLC 21 (Figure 19). The inset in Figure 19illustrates the use of shallow gradients to improve resolution forcritical proteins.
■ Histones. Histones are a class of basic nuclear proteins that interactwith DNA and may regulate gene activity. They have been separatedon C
4 RP using heptafluorobutyric acid (HFBA) as the ion-pairing
agent 20 (Figure 20). This example also illustrates the use of ashallow gradient - 0.2% per minute - to separate similar proteins.
0 70 min
VIb
VbIV
II
VIc
x-VIc
VIa
VIII.Va
VIIa
VIIc
V1b
Page 24

N arrowbore, microbore and capillaryreversed-phase HPLC columns
Small bore and capillary HPLC columns are often used to separatepolypeptides. Benefits from using small bore columns include:
■ Reduction in solvent usage. Flow rates from 5 nanoliters per minutewith 50 micron capillary columns to 200 microliters per minutewith narrowbore columns drastically reduce the amount of solventneeded for polypeptide separations.
■ Increased detection sensitivity. Polypeptides elute in smallervolumes of solvent at the reduced flow rates of small bore columnsand UV detector response increases in proportion to the reduction inflow rate. A narrowbore column with a flow rate of 200 microlitersper minute gives a five-fold increase in sensitivity compared withan analytical column run at a flow rate of 1.0 mL/min.
■ Ability to work with smaller samples. Increased detection sensitivitymeans that smaller amounts of polypeptide can be detected. Trypticdigests of as little as 5 nanomoles of protein have been separatedand collected using narrowbore RP-HPLC columns.
■ Interface with mass spectrometry or other complementary tech-niques. Direct transfer of the HPLC eluent into instruments such asmass spectrometometers is possible with small bore columns.
Figure 22
Separation of the tryptic digest of carboxymethylated transferrin on anarrowbore RP-HPLC column (Reference 12)
Conditions in text. Data courtesy of K. Stone and K.Williams,Yale University
0 100 min
Page 27
Figure 21
Identification of rice varieties by RP-HPLC separation of extractable proteins
RP-HPLC profiles of ethanol-soluble endosperm proteins provide a methodto identify rice varieties.
Conditions:Column: Vydac 214TP54 (C4 , 5 µm, 4.6 x 250 mm)Eluent: Solvent A: .11% TFA in H2O Solvent B: .085% TFA in ACNGradient : 28 - 36% B in 5 min, 36 - 47% B in 45 min, with a final 4 min hold at 47%Flow rate : 1.0 mL/min Temperature : 60o C Data from Reference 24
0 60 min
Variety IR-42
VarietyMilyang 42
Variety H4
Protein profiles areunique to each variety
■ Hemoglobin variants. A RP-HPLC method using a C4 column has
been developed for the separation of globin chains 27. This methodhas been used to study hemoglobin variants in both animals andhumans. RP-HPLC has helped to detect at least fourteen abnormalhematological states in humans and was used to study a silent mutantinvolving substitution of threonine for methionine 28.
■ Protein characterization. Proteins are routinely purified forsequencing and characterization by RP-HPLC, for example thepurification of an acid soluble protein from Clostridium perfringenspores 29.
■ Grain proteins. Grain varieties cannot usually be identified byphysical appearance, so methods based on RP-HPLC profiles ofsoluble proteins have been developed to identify grain varieties(Reference 24). RP-HPLC profiles of alcohol-soluble endospermproteins - glutelins - were obtained on C
4 columns and used to
identify varieties of rice 21.
Page 26

An article by Davis and Lee provides valuable information forgetting the best performance using microbore and capillary columns 30
and is recommended reading for anyone embarking on the use of smallbore columns. Another recent article discussed the use of microborecolumns with mass spectrometery 31.
The separation of a tryptic digest of myoglobin (Figure 23) wasperformed on a 1.0 mm C
18 microbore column (218TP51) at a flow rate
of 50 µL/min with a gradient from 5 to 70% acetonitrile with 0.1% TFAover 90 minutes.
Fragments from the Lys C digest of cytochrome c were separated(Figure 24) on capillary columns of 500 micron (i.d.) and 160 micron(i.d.) using a gradient from 2 to 62 % acetonitrile with 0.1% TFA over60 minutes 30. Flow rates were 20 µL/min on the 500 micron columnand 2 µL/min on the 160 micron column. The capillary columns werepacked with five micron, C
18 material (Vydac 218TPB5).
0 40 min
0 50 min
0.16 mm i.d., 2 µL/min
0.5 mm i.d., 20 µL/min
Figure 24Separation of a Lys C digest of cytochrome c on capillary RP-HPLC columns
Conditions in text.
Data from Reference 30
Page 29
Figure 23
Separation of a tryptic digest of myoglobin on a microbore RP-HPLC column
Conditions in text. Data courtesy of Dr. John Crabb, Alton Jones Cell Science Center
0 70 min
Narrowbore columnsNarrowbore columns of 2.1 mm i.d. are run at flow rates of 100 -
300 microliters per minute. Narrowbore columns are a practical step formost laboratories to take in reducing solvent usage and improvingdetection sensitivity. Some standard HPLC systems can operate at theselow flow rates with little or no modification. In the example shown(Figure 22), the tryptic digest of carboxymethylated transferrin wasseparated on a C
18 narrowbore column (218TP52) at 200 microliters per
minute using a complex gradient from 2 to 98% B, where Solvent A is.06% TFA in water and Solvent B is .056% TFA in 80:20acetonitrile:water.
Microbore and Capillary columnsMicrobore columns of 1.0 mm i.d. offer a five-fold increase in
detection sensitivity and reduction in solvent usage over narrowborecolumns but require specialized equipment. Capillary columns - lessthan 1.0 mm i.d. - offer even greater sensitivity and solvent reductionbut also require specialized equipment and special care. Modificationsto standard systems are possible but are expensive and require goodHPLC experience. The use of microbore or capillary columns should beapproached with great care.
Page 28
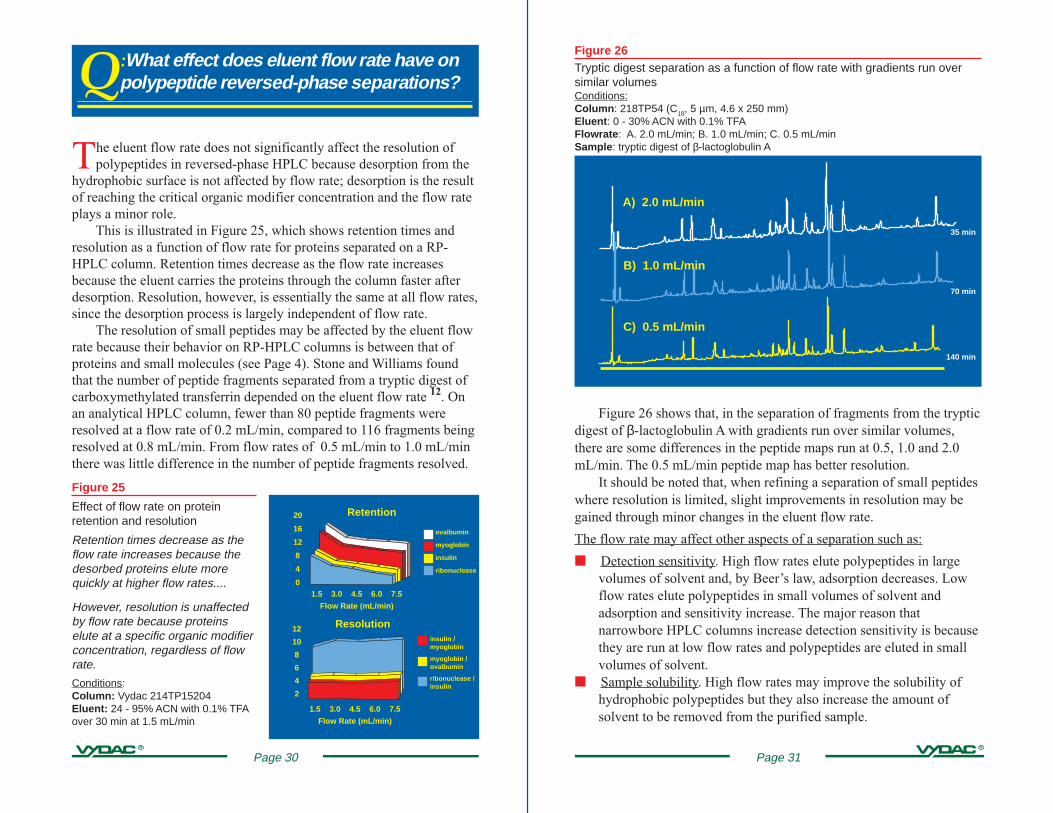
Figure 26Tryptic digest separation as a function of flow rate with gradients run oversimilar volumesConditions:Column : 218TP54 (C18, 5 µm, 4.6 x 250 mm)Eluent : 0 - 30% ACN with 0.1% TFAFlowrate : A. 2.0 mL/min; B. 1.0 mL/min; C. 0.5 mL/minSample : tryptic digest of β-lactoglobulin A
Figure 26 shows that, in the separation of fragments from the trypticdigest of β-lactoglobulin A with gradients run over similar volumes,there are some differences in the peptide maps run at 0.5, 1.0 and 2.0mL/min. The 0.5 mL/min peptide map has better resolution.
It should be noted that, when refining a separation of small peptideswhere resolution is limited, slight improvements in resolution may begained through minor changes in the eluent flow rate.
The flow rate may affect other aspects of a separation such as:
■ Detection sensitivity. High flow rates elute polypeptides in largevolumes of solvent and, by Beer’s law, adsorption decreases. Lowflow rates elute polypeptides in small volumes of solvent andadsorption and sensitivity increase. The major reason thatnarrowbore HPLC columns increase detection sensitivity is becausethey are run at low flow rates and polypeptides are eluted in smallvolumes of solvent.
■ Sample solubility. High flow rates may improve the solubility ofhydrophobic polypeptides but they also increase the amount ofsolvent to be removed from the purified sample.
140 min
A) 2.0 mL/min
B) 1.0 mL/min
C) 0.5 mL/min
Page 31
Q:What effect does eluent flow rate have onpolypeptide reversed-phase separations?
The eluent flow rate does not significantly affect the resolution ofpolypeptides in reversed-phase HPLC because desorption from the
hydrophobic surface is not affected by flow rate; desorption is the resultof reaching the critical organic modifier concentration and the flow rateplays a minor role.
This is illustrated in Figure 25, which shows retention times andresolution as a function of flow rate for proteins separated on a RP-HPLC column. Retention times decrease as the flow rate increasesbecause the eluent carries the proteins through the column faster afterdesorption. Resolution, however, is essentially the same at all flow rates,since the desorption process is largely independent of flow rate.
The resolution of small peptides may be affected by the eluent flowrate because their behavior on RP-HPLC columns is between that ofproteins and small molecules (see Page 4). Stone and Williams foundthat the number of peptide fragments separated from a tryptic digest ofcarboxymethylated transferrin depended on the eluent flow rate 12. Onan analytical HPLC column, fewer than 80 peptide fragments wereresolved at a flow rate of 0.2 mL/min, compared to 116 fragments beingresolved at 0.8 mL/min. From flow rates of 0.5 mL/min to 1.0 mL/minthere was little difference in the number of peptide fragments resolved.
Figure 25
Effect of flow rate on proteinretention and resolution
Retention times decrease as theflow rate increases because thedesorbed proteins elute morequickly at higher flow rates....
However, resolution is unaffectedby flow rate because proteinselute at a specific organic modifierconcentration, regardless of flowrate.
Conditions:Column: Vydac 214TP15204Eluent: 24 - 95% ACN with 0.1% TFAover 30 min at 1.5 mL/min
20
16
12
8
4
0
12
10
8
6
4
2
1.5 3.0 4.5 6.0 7.5
Flow Rate (mL/min)
Retention
1.5 3.0 4.5 6.0 7.5
Flow Rate (mL/min)
Resolutioninsulin /myoglobin
myoglobin /ovalbumin
ribonuclease /insulin
ovalbumin
myoglobin
insulin
ribonuclease
Page 30
70 min
35 min
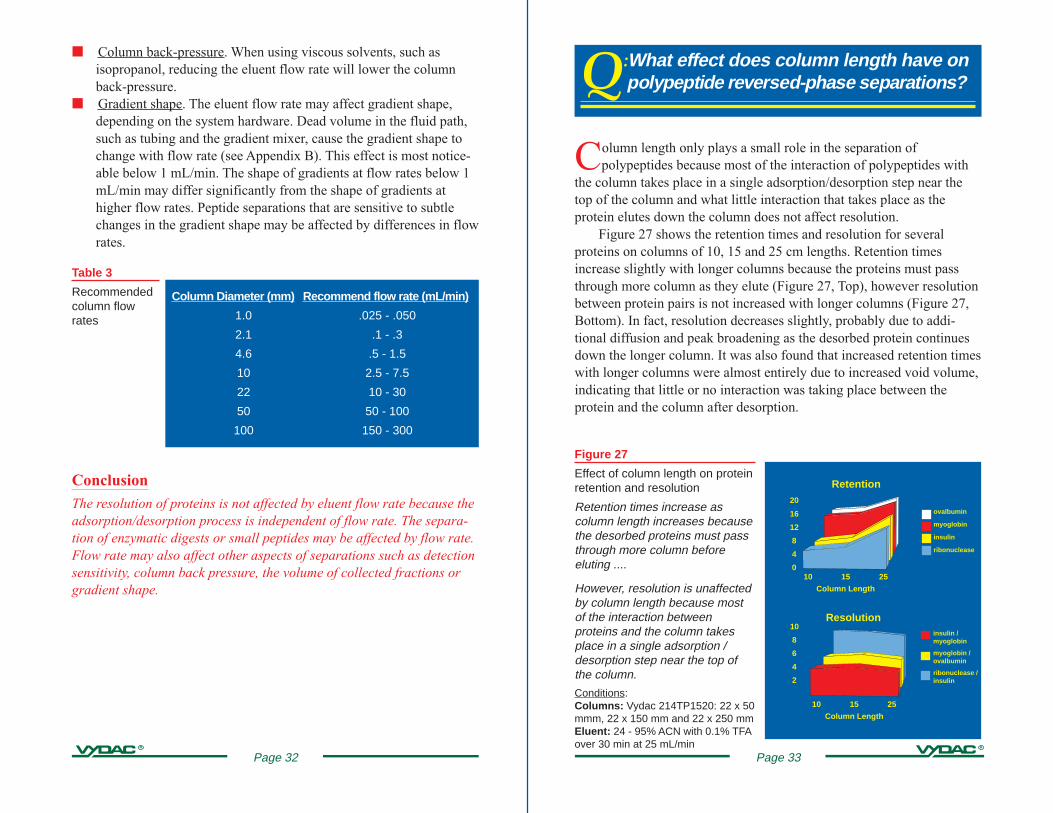
Q:What effect does column length have on polypeptide reversed-phase separations?
Column length only plays a small role in the separation ofpolypeptides because most of the interaction of polypeptides with
the column takes place in a single adsorption/desorption step near thetop of the column and what little interaction that takes place as theprotein elutes down the column does not affect resolution.
Figure 27 shows the retention times and resolution for severalproteins on columns of 10, 15 and 25 cm lengths. Retention timesincrease slightly with longer columns because the proteins must passthrough more column as they elute (Figure 27, Top), however resolutionbetween protein pairs is not increased with longer columns (Figure 27,Bottom). In fact, resolution decreases slightly, probably due to addi-tional diffusion and peak broadening as the desorbed protein continuesdown the longer column. It was also found that increased retention timeswith longer columns were almost entirely due to increased void volume,indicating that little or no interaction was taking place between theprotein and the column after desorption.
Retention
Resolution
20
16
12
8
4
010 15 25
Column Length
10 15 25
Column Length
10
8
6
4
2
ovalbumin
myoglobin
insulin
ribonuclease
insulin /myoglobin
myoglobin /ovalbumin
ribonuclease /insulin
Figure 27
Effect of column length on proteinretention and resolution
Retention times increase ascolumn length increases becausethe desorbed proteins must passthrough more column beforeeluting ....
However, resolution is unaffectedby column length because mostof the interaction betweenproteins and the column takesplace in a single adsorption /desorption step near the top ofthe column.
Conditions:Columns: Vydac 214TP1520: 22 x 50mmm, 22 x 150 mm and 22 x 250 mmEluent: 24 - 95% ACN with 0.1% TFAover 30 min at 25 mL/min
Page 33
■ Column back-pressure. When using viscous solvents, such asisopropanol, reducing the eluent flow rate will lower the columnback-pressure.
■ Gradient shape. The eluent flow rate may affect gradient shape,depending on the system hardware. Dead volume in the fluid path,such as tubing and the gradient mixer, cause the gradient shape tochange with flow rate (see Appendix B). This effect is most notice-able below 1 mL/min. The shape of gradients at flow rates below 1mL/min may differ significantly from the shape of gradients athigher flow rates. Peptide separations that are sensitive to subtlechanges in the gradient shape may be affected by differences in flowrates.
ConclusionThe resolution of proteins is not affected by eluent flow rate because theadsorption/desorption process is independent of flow rate. The separa-tion of enzymatic digests or small peptides may be affected by flow rate.Flow rate may also affect other aspects of separations such as detectionsensitivity, column back pressure, the volume of collected fractions orgradient shape.
Column Diameter (mm) Recommend flow rate (mL/min)
1.0 .025 - .050
2.1 .1 - .3
4.6 .5 - 1.5
10 2.5 - 7.5
22 10 - 30
50 50 - 100
100 150 - 300
Table 3
Recommendedcolumn flowrates
Page 32
Column length may affect other aspects of the separation.
■ Sample capacity has been shown to be a function of column volumewhich, for columns of equal diameter, means longer columns.Consequently, to maximize sample capacity select the longestavailable column in a given diameter.
■ Column back-pressure is a function of column length. When usingmore viscous solvents, such as isopropanol, shorter columns willresult in more moderate back-pressures.
ConclusionShort, 50 to 150 mm, length columns are recommend for the separationof large peptides and proteins. Longer columns, 150 to 250 mm, arerecommended for the separation of small peptides and enzymaticdigests. Long columns (with the largest volumes) are recommended toachieve maximum sample capacity.
Page 35
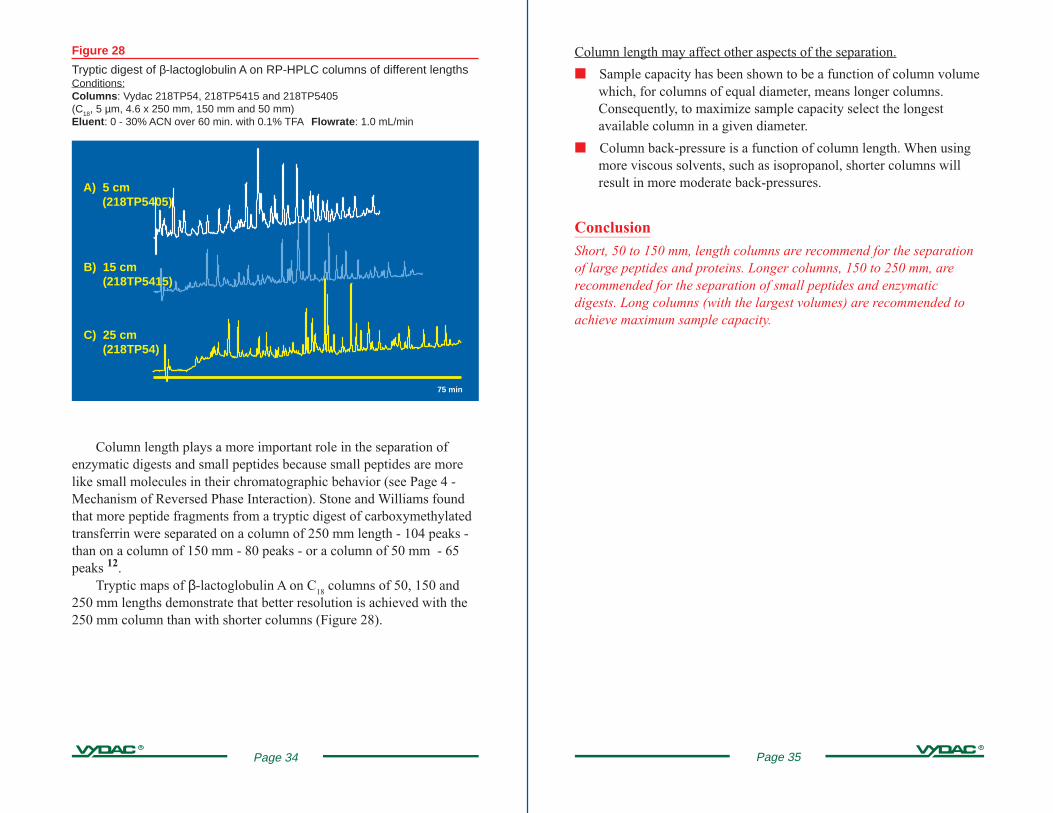
Figure 28
Tryptic digest of β-lactoglobulin A on RP-HPLC columns of different lengthsConditions:Columns : Vydac 218TP54, 218TP5415 and 218TP5405(C18, 5 µm, 4.6 x 250 mm, 150 mm and 50 mm)Eluent : 0 - 30% ACN over 60 min. with 0.1% TFA Flowrate : 1.0 mL/min
Column length plays a more important role in the separation ofenzymatic digests and small peptides because small peptides are morelike small molecules in their chromatographic behavior (see Page 4 -Mechanism of Reversed Phase Interaction). Stone and Williams foundthat more peptide fragments from a tryptic digest of carboxymethylatedtransferrin were separated on a column of 250 mm length - 104 peaks -than on a column of 150 mm - 80 peaks - or a column of 50 mm - 65peaks 12.
Tryptic maps of β-lactoglobulin A on C18
columns of 50, 150 and250 mm lengths demonstrate that better resolution is achieved with the250 mm column than with shorter columns (Figure 28).
75 min
A) 5 cm(218TP5405)
B) 15 cm(218TP5415)
C) 25 cm(218TP54)
Page 34
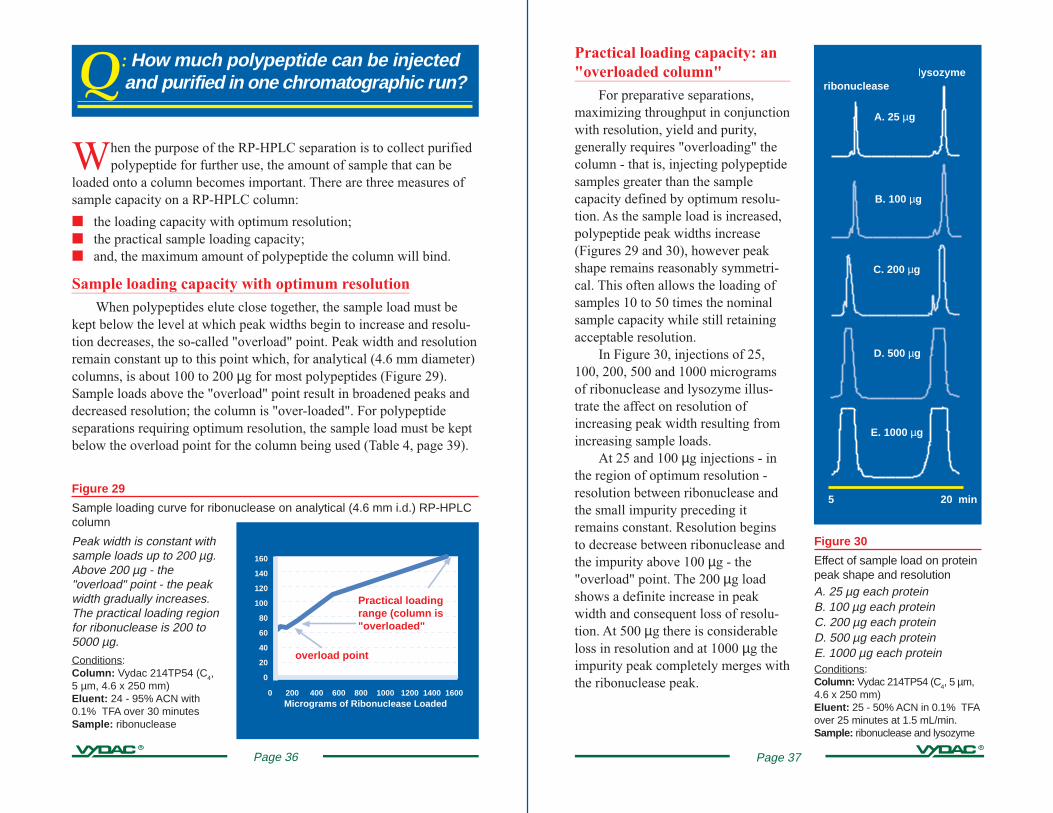
A. 25 µg
B. 100 µg
C. 200 µg
D. 500 µg
E. 1000 µg
lysozymeribonuclease
Practical loading capacity: an"overloaded column"
For preparative separations,maximizing throughput in conjunctionwith resolution, yield and purity,generally requires "overloading" thecolumn - that is, injecting polypeptidesamples greater than the samplecapacity defined by optimum resolu-tion. As the sample load is increased,polypeptide peak widths increase(Figures 29 and 30), however peakshape remains reasonably symmetri-cal. This often allows the loading ofsamples 10 to 50 times the nominalsample capacity while still retainingacceptable resolution.
In Figure 30, injections of 25,100, 200, 500 and 1000 microgramsof ribonuclease and lysozyme illus-trate the affect on resolution ofincreasing peak width resulting fromincreasing sample loads.
At 25 and 100 µg injections - inthe region of optimum resolution -resolution between ribonuclease andthe small impurity preceding itremains constant. Resolution beginsto decrease between ribonuclease andthe impurity above 100 µg - the"overload" point. The 200 µg loadshows a definite increase in peakwidth and consequent loss of resolu-tion. At 500 µg there is considerableloss in resolution and at 1000 µg theimpurity peak completely merges withthe ribonuclease peak.
5 20 min
Figure 30
Effect of sample load on proteinpeak shape and resolutionA. 25 µg each proteinB. 100 µg each proteinC. 200 µg each proteinD. 500 µg each proteinE. 1000 µg each proteinConditions:Column: Vydac 214TP54 (C4, 5 µm,4.6 x 250 mm)Eluent: 25 - 50% ACN in 0.1% TFAover 25 minutes at 1.5 mL/min.Sample: ribonuclease and lysozyme
Page 37
Q: How much polypeptide can be injected and purif ied in one chromatographic run?
When the purpose of the RP-HPLC separation is to collect purifiedpolypeptide for further use, the amount of sample that can be
loaded onto a column becomes important. There are three measures ofsample capacity on a RP-HPLC column:
■ the loading capacity with optimum resolution;■ the practical sample loading capacity;■ and, the maximum amount of polypeptide the column will bind.
Sample loading capacity with optimum resolutionWhen polypeptides elute close together, the sample load must be
kept below the level at which peak widths begin to increase and resolu-tion decreases, the so-called "overload" point. Peak width and resolutionremain constant up to this point which, for analytical (4.6 mm diameter)columns, is about 100 to 200 µg for most polypeptides (Figure 29).Sample loads above the "overload" point result in broadened peaks anddecreased resolution; the column is "over-loaded". For polypeptideseparations requiring optimum resolution, the sample load must be keptbelow the overload point for the column being used (Table 4, page 39).
Pea
k w
idth
(mm
)
160
140
120
100
80
60
40
20
0
overload point
Practical loadingrange (column is"overloaded"
0 200 400 600 800 1000 1200 1400 1600Micrograms of Ribonuclease Loaded
Figure 29
Sample loading curve for ribonuclease on analytical (4.6 mm i.d.) RP-HPLCcolumn
Peak width is constant withsample loads up to 200 µg.Above 200 µg - the"overload" point - the peakwidth gradually increases.The practical loading regionfor ribonuclease is 200 to5000 µg.
Conditions:Column: Vydac 214TP54 (C4,5 µm, 4.6 x 250 mm)Eluent: 24 - 95% ACN with0.1% TFA over 30 minutesSample: ribonuclease
Page 36
Page 39
Tips for optimizing throughput and resolution
Tip # 1Resolution between closely eluting polypeptides may be affected bysample concentration. Dilute samples appear to spread out over thecolumn surface better than concentrated samples and this results inslightly better resolution.
Suggestion: Use dilute samples to improve resolution and sampleloading capacity.
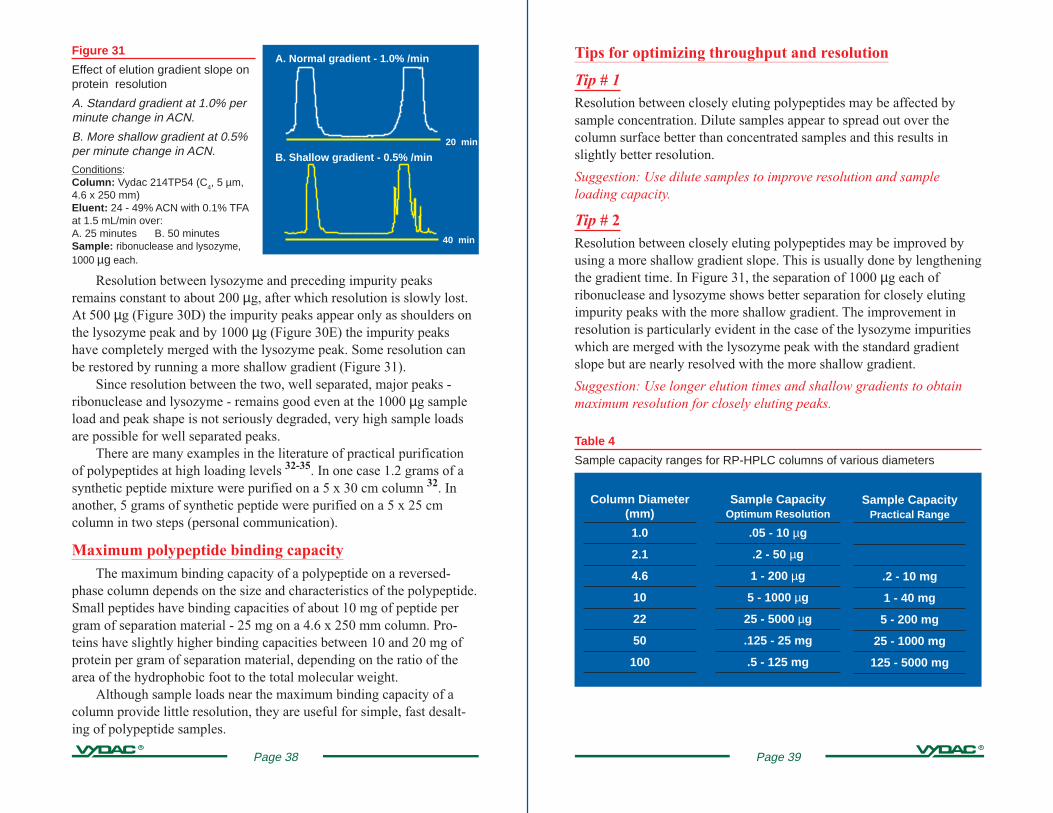
Tip # 2Resolution between closely eluting polypeptides may be improved byusing a more shallow gradient slope. This is usually done by lengtheningthe gradient time. In Figure 31, the separation of 1000 µg each ofribonuclease and lysozyme shows better separation for closely elutingimpurity peaks with the more shallow gradient. The improvement inresolution is particularly evident in the case of the lysozyme impuritieswhich are merged with the lysozyme peak with the standard gradientslope but are nearly resolved with the more shallow gradient.
Suggestion: Use longer elution times and shallow gradients to obtainmaximum resolution for closely eluting peaks.
Column Diameter(mm)
1.0
2.1
4.6
10
22
50
100
Sample CapacityOptimum Resolution
.05 - 10 µg
.2 - 50 µg
1 - 200 µg
5 - 1000 µg
25 - 5000 µg
.125 - 25 mg
.5 - 125 mg
Sample CapacityPractical Range
.2 - 10 mg
1 - 40 mg
5 - 200 mg
25 - 1000 mg
125 - 5000 mg
Table 4
Sample capacity ranges for RP-HPLC columns of various diameters
Figure 31
Effect of elution gradient slope onprotein resolution
A. Standard gradient at 1.0% perminute change in ACN.
B. More shallow gradient at 0.5%per minute change in ACN.
Conditions:Column: Vydac 214TP54 (C4, 5 µm,4.6 x 250 mm)Eluent: 24 - 49% ACN with 0.1% TFAat 1.5 mL/min over:A. 25 minutes B. 50 minutesSample: ribonuclease and lysozyme,1000 µg each.
A. Normal gradient - 1.0% /min
B. Shallow gradient - 0.5% /min
Resolution between lysozyme and preceding impurity peaksremains constant to about 200 µg, after which resolution is slowly lost.At 500 µg (Figure 30D) the impurity peaks appear only as shoulders onthe lysozyme peak and by 1000 µg (Figure 30E) the impurity peakshave completely merged with the lysozyme peak. Some resolution canbe restored by running a more shallow gradient (Figure 31).
Since resolution between the two, well separated, major peaks -ribonuclease and lysozyme - remains good even at the 1000 µg sampleload and peak shape is not seriously degraded, very high sample loadsare possible for well separated peaks.
There are many examples in the literature of practical purificationof polypeptides at high loading levels 32-35. In one case 1.2 grams of asynthetic peptide mixture were purified on a 5 x 30 cm column 32. Inanother, 5 grams of synthetic peptide were purified on a 5 x 25 cmcolumn in two steps (personal communication).
Maximum polypeptide binding capacityThe maximum binding capacity of a polypeptide on a reversed-
phase column depends on the size and characteristics of the polypeptide.Small peptides have binding capacities of about 10 mg of peptide pergram of separation material - 25 mg on a 4.6 x 250 mm column. Pro-teins have slightly higher binding capacities between 10 and 20 mg ofprotein per gram of separation material, depending on the ratio of thearea of the hydrophobic foot to the total molecular weight.
Although sample loads near the maximum binding capacity of acolumn provide little resolution, they are useful for simple, fast desalt-ing of polypeptide samples.
40 min
20 min
Page 38
A. No SDS
B. With 0.5% SDS
C. After SDS
Figure 33
Effect of surfactants on C4 RP-HPLC of polypeptides
Surfactant affects chromatography(B) but does not harm column orsubsequent separations (C).
Conditions:Column: Vydac 214TP54Eluent: 24-95% ACN in 0.1% TFA over30 min at 1.5 mL/minSample : ribonuclease, insulin, lysozyme,myoglobin and ovalbumin
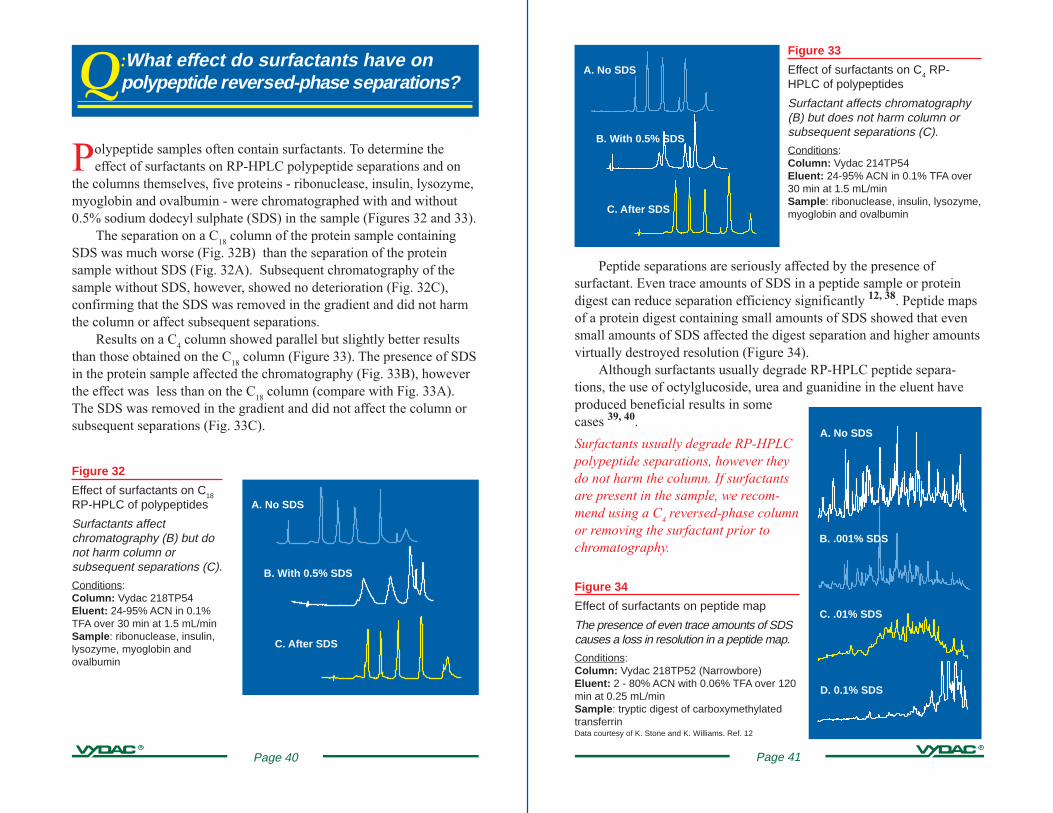
Peptide separations are seriously affected by the presence ofsurfactant. Even trace amounts of SDS in a peptide sample or proteindigest can reduce separation efficiency significantly 12, 38. Peptide mapsof a protein digest containing small amounts of SDS showed that evensmall amounts of SDS affected the digest separation and higher amountsvirtually destroyed resolution (Figure 34).
Although surfactants usually degrade RP-HPLC peptide separa-tions, the use of octylglucoside, urea and guanidine in the eluent haveproduced beneficial results in somecases 39, 40.
Surfactants usually degrade RP-HPLCpolypeptide separations, however theydo not harm the column. If surfactantsare present in the sample, we recom-mend using a C
4 reversed-phase column
or removing the surfactant prior tochromatography.
Figure 34
Effect of surfactants on peptide map
The presence of even trace amounts of SDScauses a loss in resolution in a peptide map.
Conditions:Column: Vydac 218TP52 (Narrowbore)Eluent: 2 - 80% ACN with 0.06% TFA over 120min at 0.25 mL/minSample : tryptic digest of carboxymethylatedtransferrinData courtesy of K. Stone and K. Williams. Ref. 12
A. No SDS
B. .001% SDS
D. 0.1% SDS
C. .01% SDS
Page 41
Q:What effect do surfactants have onpolypeptide reversed-phase separations?
Polypeptide samples often contain surfactants. To determine theeffect of surfactants on RP-HPLC polypeptide separations and on
the columns themselves, five proteins - ribonuclease, insulin, lysozyme,myoglobin and ovalbumin - were chromatographed with and without0.5% sodium dodecyl sulphate (SDS) in the sample (Figures 32 and 33).
The separation on a C18
column of the protein sample containingSDS was much worse (Fig. 32B) than the separation of the proteinsample without SDS (Fig. 32A). Subsequent chromatography of thesample without SDS, however, showed no deterioration (Fig. 32C),confirming that the SDS was removed in the gradient and did not harmthe column or affect subsequent separations.
Results on a C4 column showed parallel but slightly better results
than those obtained on the C18
column (Figure 33). The presence of SDSin the protein sample affected the chromatography (Fig. 33B), howeverthe effect was less than on the C
18 column (compare with Fig. 33A).
The SDS was removed in the gradient and did not affect the column orsubsequent separations (Fig. 33C).
Figure 32
Effect of surfactants on C18
RP-HPLC of polypeptides
Surfactants affectchromatography (B) but donot harm column orsubsequent separations (C).
Conditions:Column: Vydac 218TP54Eluent: 24-95% ACN in 0.1%TFA over 30 min at 1.5 mL/minSample : ribonuclease, insulin,lysozyme, myoglobin andovalbumin
A. No SDS
B. With 0.5% SDS
C. After SDS
Page 40
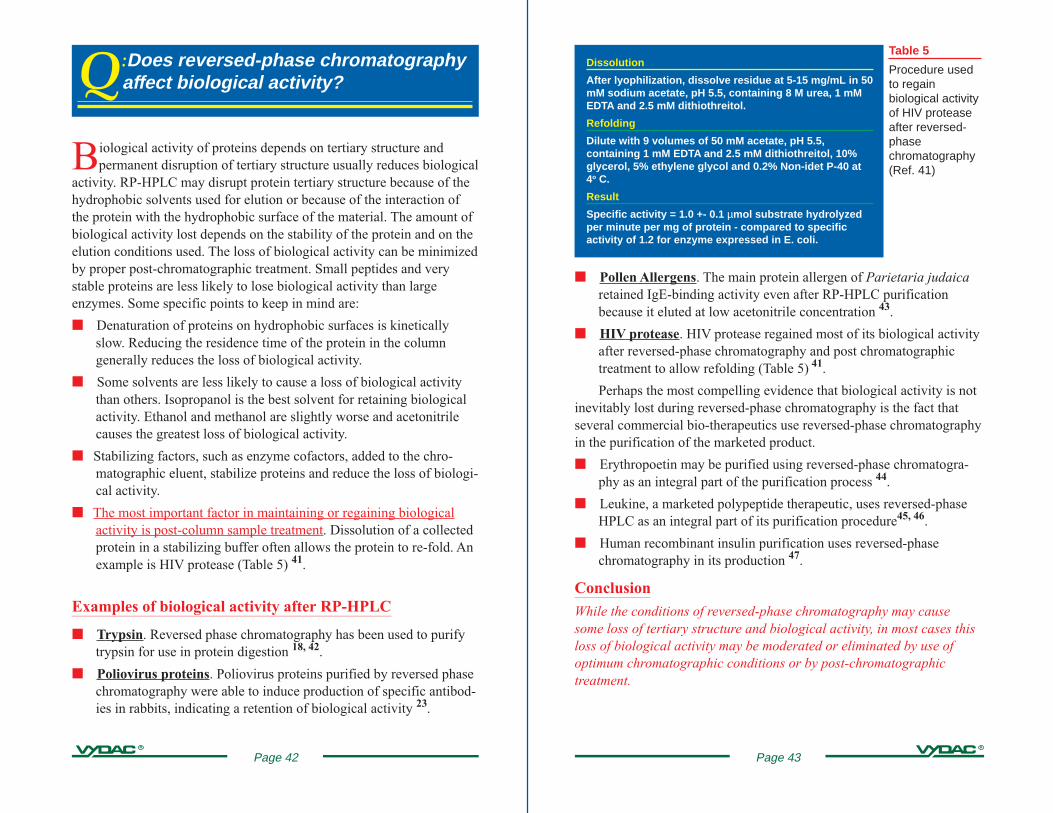
Dissolution
After lyophilization, dissolve residue at 5-15 mg/mL in 50mM sodium acetate, pH 5.5, containing 8 M urea, 1 mMEDTA and 2.5 mM dithiothreitol.
Refolding
Dilute with 9 volumes of 50 mM acetate, pH 5.5,containing 1 mM EDTA and 2.5 mM dithiothreitol, 10%glycerol, 5% ethylene glycol and 0.2% Non-idet P-40 at4o C.
Result
Specific activity = 1.0 +- 0.1 µmol substrate hydrolyzedper minute per mg of protein - compared to specificactivity of 1.2 for enzyme expressed in E. coli.
Table 5
Procedure usedto regainbiological activityof HIV proteaseafter reversed-phasechromatography(Ref. 41)
■ Pollen Allergens. The main protein allergen of Parietaria judaicaretained IgE-binding activity even after RP-HPLC purificationbecause it eluted at low acetonitrile concentration 43.
■ HIV protease. HIV protease regained most of its biological activityafter reversed-phase chromatography and post chromatographictreatment to allow refolding (Table 5) 41.
Perhaps the most compelling evidence that biological activity is notinevitably lost during reversed-phase chromatography is the fact thatseveral commercial bio-therapeutics use reversed-phase chromatographyin the purification of the marketed product.
■ Erythropoetin may be purified using reversed-phase chromatogra-phy as an integral part of the purification process 44.
■ Leukine, a marketed polypeptide therapeutic, uses reversed-phaseHPLC as an integral part of its purification procedure45, 46.
■ Human recombinant insulin purification uses reversed-phasechromatography in its production 47.
ConclusionWhile the conditions of reversed-phase chromatography may causesome loss of tertiary structure and biological activity, in most cases thisloss of biological activity may be moderated or eliminated by use ofoptimum chromatographic conditions or by post-chromatographictreatment.
Page 43
Q:Does reversed-phase chromatographyaffect biological activity?
Biological activity of proteins depends on tertiary structure andpermanent disruption of tertiary structure usually reduces biological
activity. RP-HPLC may disrupt protein tertiary structure because of thehydrophobic solvents used for elution or because of the interaction ofthe protein with the hydrophobic surface of the material. The amount ofbiological activity lost depends on the stability of the protein and on theelution conditions used. The loss of biological activity can be minimizedby proper post-chromatographic treatment. Small peptides and verystable proteins are less likely to lose biological activity than largeenzymes. Some specific points to keep in mind are:
■ Denaturation of proteins on hydrophobic surfaces is kineticallyslow. Reducing the residence time of the protein in the columngenerally reduces the loss of biological activity.
■ Some solvents are less likely to cause a loss of biological activitythan others. Isopropanol is the best solvent for retaining biologicalactivity. Ethanol and methanol are slightly worse and acetonitrilecauses the greatest loss of biological activity.
■ Stabilizing factors, such as enzyme cofactors, added to the chro-matographic eluent, stabilize proteins and reduce the loss of biologi-cal activity.
■ The most important factor in maintaining or regaining biologicalactivity is post-column sample treatment. Dissolution of a collectedprotein in a stabilizing buffer often allows the protein to re-fold. Anexample is HIV protease (Table 5) 41.
Examples of biological activity after RP-HPLC
■ Trypsin. Reversed phase chromatography has been used to purifytrypsin for use in protein digestion 18, 42.
■ Poliovirus proteins. Poliovirus proteins purified by reversed phasechromatography were able to induce production of specific antibod-ies in rabbits, indicating a retention of biological activity 23.
Page 42
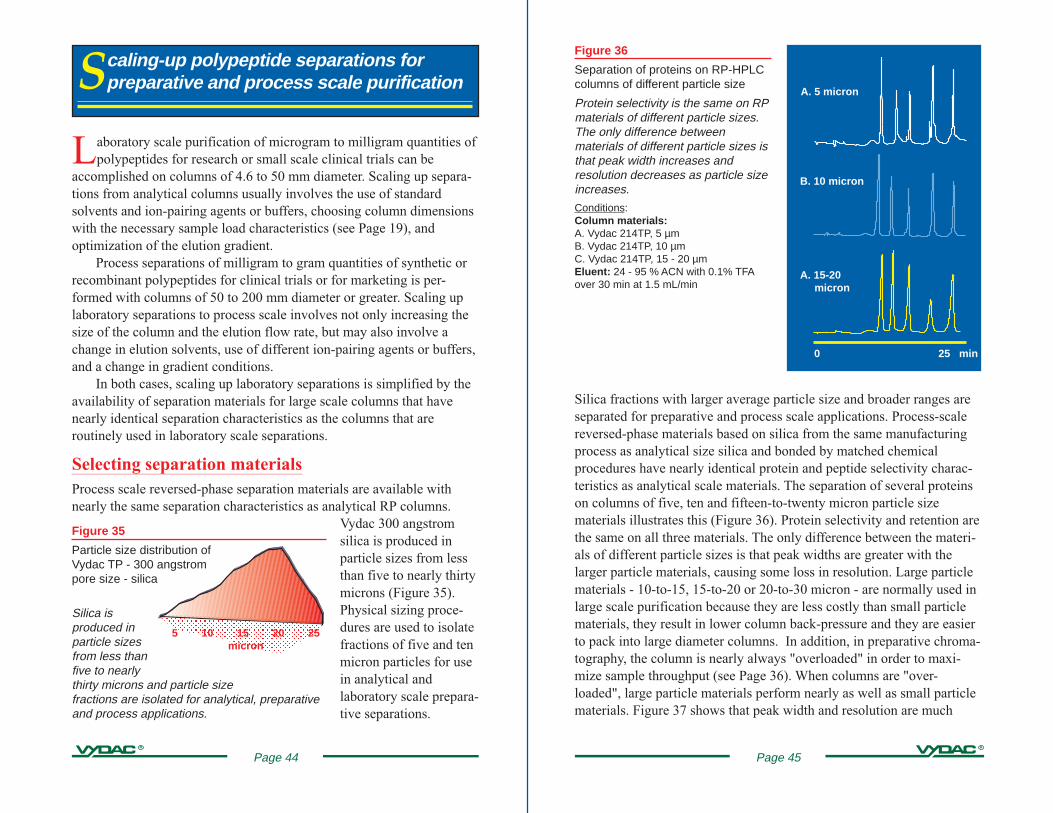
Figure 36
Separation of proteins on RP-HPLCcolumns of different particle size
Protein selectivity is the same on RPmaterials of different particle sizes.The only difference betweenmaterials of different particle sizes isthat peak width increases andresolution decreases as particle sizeincreases.
Conditions:Column materials:A. Vydac 214TP, 5 µmB. Vydac 214TP, 10 µmC. Vydac 214TP, 15 - 20 µmEluent: 24 - 95 % ACN with 0.1% TFAover 30 min at 1.5 mL/min
A. 5 micron
B. 10 micron
A. 15-20micron
0 25 min
Silica fractions with larger average particle size and broader ranges areseparated for preparative and process scale applications. Process-scalereversed-phase materials based on silica from the same manufacturingprocess as analytical size silica and bonded by matched chemicalprocedures have nearly identical protein and peptide selectivity charac-teristics as analytical scale materials. The separation of several proteinson columns of five, ten and fifteen-to-twenty micron particle sizematerials illustrates this (Figure 36). Protein selectivity and retention arethe same on all three materials. The only difference between the materi-als of different particle sizes is that peak widths are greater with thelarger particle materials, causing some loss in resolution. Large particlematerials - 10-to-15, 15-to-20 or 20-to-30 micron - are normally used inlarge scale purification because they are less costly than small particlematerials, they result in lower column back-pressure and they are easierto pack into large diameter columns. In addition, in preparative chroma-tography, the column is nearly always "overloaded" in order to maxi-mize sample throughput (see Page 36). When columns are "over-loaded", large particle materials perform nearly as well as small particlematerials. Figure 37 shows that peak width and resolution are much
Page 45
Laboratory scale purification of microgram to milligram quantities ofpolypeptides for research or small scale clinical trials can be
accomplished on columns of 4.6 to 50 mm diameter. Scaling up separa-tions from analytical columns usually involves the use of standardsolvents and ion-pairing agents or buffers, choosing column dimensionswith the necessary sample load characteristics (see Page 19), andoptimization of the elution gradient.
Process separations of milligram to gram quantities of synthetic orrecombinant polypeptides for clinical trials or for marketing is per-formed with columns of 50 to 200 mm diameter or greater. Scaling uplaboratory separations to process scale involves not only increasing thesize of the column and the elution flow rate, but may also involve achange in elution solvents, use of different ion-pairing agents or buffers,and a change in gradient conditions.
In both cases, scaling up laboratory separations is simplified by theavailability of separation materials for large scale columns that havenearly identical separation characteristics as the columns that areroutinely used in laboratory scale separations.
Selecting separation materialsProcess scale reversed-phase separation materials are available withnearly the same separation characteristics as analytical RP columns.
Vydac 300 angstromsilica is produced inparticle sizes from lessthan five to nearly thirtymicrons (Figure 35).Physical sizing proce-dures are used to isolatefractions of five and tenmicron particles for usein analytical andlaboratory scale prepara-tive separations.
Figure 35
Particle size distribution ofVydac TP - 300 angstrompore size - silica
Silica isproduced inparticle sizesfrom less thanfive to nearlythirty microns and particle sizefractions are isolated for analytical, preparativeand process applications.
Scaling-up polypeptide separations forpreparative and process scale purification
Page 44
5 10 15 20 25micron
■ Gradient characteristics: To retain the resolution obtained on ananalytical column while increasing column diameter, the gradientshape must be maintained by keeping the ratio of the gradientvolume to the column volume constant. For example, a 22 mmdiameter column has about 23 times the volume of a 4.6 mm diam-eter column of the same length (22 divided by 4.6, squared). A 1.0mL/min gradient over 30 minutes on an analytical column has avolume of 30 mL. To transfer the method to a 22 mm column, thegradient volume should be increased 23 times to 690 mL. The flowrate can be increased 23 times while maintaining the gradient timeconstant or the flow rate can be partially increased while lengtheningthe gradient time. For instance, a flow rate of 23 mL/min for 30minutes would result in a gradient volume of 690 mL. However, aflow rate of 10 mL/min for 69 min would give the same gradientvolume, hence the same gradient shape and sample resolution. Ineither case the separation would be comparable to that obtained onan analytical column. In practice the gradient is often made moreshallow - i.e., a smaller increase in organic modifier concentrationper unit time - to increase resolution, particularly for the mainpeptide to be collected.
Process-scale purification: More than five grams of peptide■ Elution solvent: The organic solvents commonly used in laboratory
scale chromatography often pose problems of cost, disposal or safetyin a process environment. Solvents such as ethanol are more practi-cal for process chromatography. Ethanol is relatively non-toxic, non-flammable when mixed with water and is available at low cost andknown and understood by regulatory agencies such as the FDA.Ethanol is presently used in large scale process purifications 44.
■ Ion-pairing agent or buffer: Ion pairing agents commonly used foranalytical chromatography are less practical for process scalechromatography. Alternate ion-pairing agents or buffers useful forprocess chromatography include acetic acid - which also converts thepolypeptide to the acetate form, useful in formulations - and phos-phate. Acetate is presently used in the purification of bio-technologyderived therapeutics 46.
■ Gradient characteristics: The comments in the laboratory scalepurification section regarding scaling up elution gradients to largercolumns apply to process scale purifications (see above).
Page 47
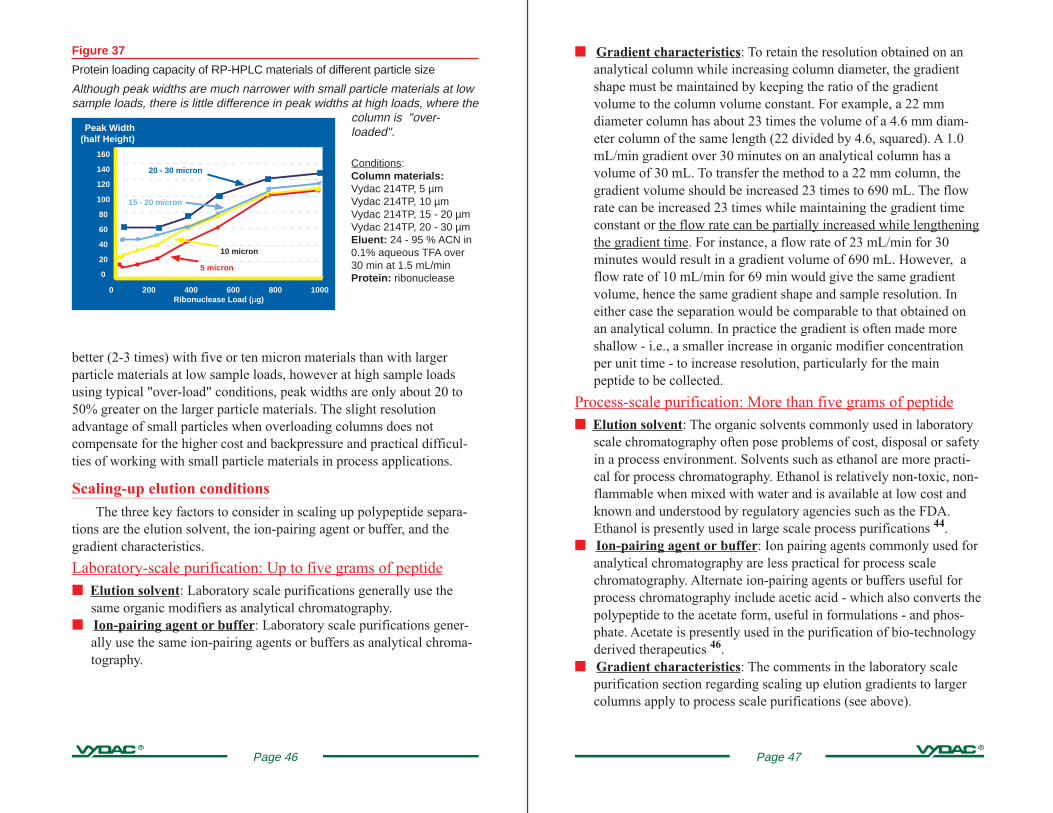
Figure 37
Protein loading capacity of RP-HPLC materials of different particle size
Although peak widths are much narrower with small particle materials at lowsample loads, there is little difference in peak widths at high loads, where the
column is "over-loaded".
Conditions:Column materials:Vydac 214TP, 5 µmVydac 214TP, 10 µmVydac 214TP, 15 - 20 µmVydac 214TP, 20 - 30 µmEluent: 24 - 95 % ACN in0.1% aqueous TFA over30 min at 1.5 mL/minProtein: ribonuclease
20 - 30 micron
better (2-3 times) with five or ten micron materials than with largerparticle materials at low sample loads, however at high sample loadsusing typical "over-load" conditions, peak widths are only about 20 to50% greater on the larger particle materials. The slight resolutionadvantage of small particles when overloading columns does notcompensate for the higher cost and backpressure and practical difficul-ties of working with small particle materials in process applications.
Scaling-up elution conditionsThe three key factors to consider in scaling up polypeptide separa-
tions are the elution solvent, the ion-pairing agent or buffer, and thegradient characteristics.
Laboratory-scale purification: Up to five grams of peptide■ Elution solvent: Laboratory scale purifications generally use the
same organic modifiers as analytical chromatography.■ Ion-pairing agent or buffer: Laboratory scale purifications gener-
ally use the same ion-pairing agents or buffers as analytical chroma-tography.
0 200 400 600 800 1000Ribonuclease Load ( µg)
15 - 20 micron
10 micron
5 micron
Page 46
Peak Width(half Height)
160
140
120
100
80
60
40
20
0
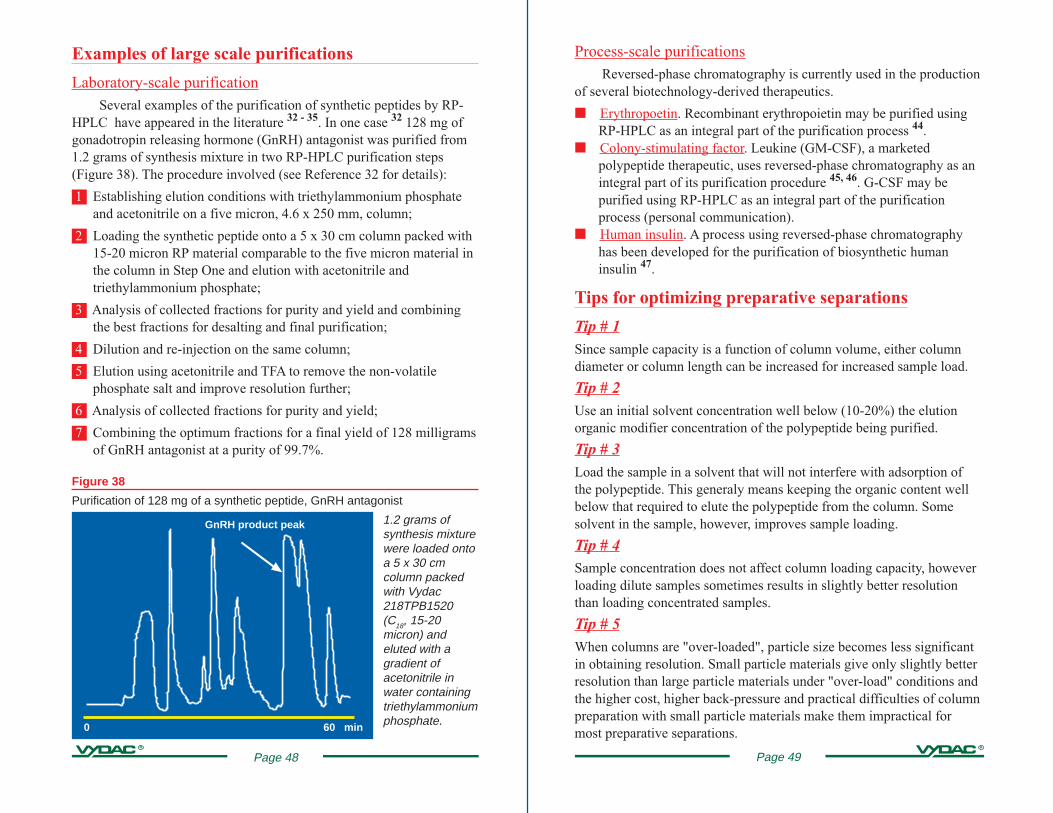
Process-scale purifications Reversed-phase chromatography is currently used in the production
of several biotechnology-derived therapeutics.
■ Erythropoetin. Recombinant erythropoietin may be purified usingRP-HPLC as an integral part of the purification process 44.
■ Colony-stimulating factor. Leukine (GM-CSF), a marketedpolypeptide therapeutic, uses reversed-phase chromatography as anintegral part of its purification procedure 45, 46. G-CSF may bepurified using RP-HPLC as an integral part of the purificationprocess (personal communication).
■ Human insulin. A process using reversed-phase chromatographyhas been developed for the purification of biosynthetic humaninsulin 47.
Tips for optimizing preparative separations
Tip # 1Since sample capacity is a function of column volume, either columndiameter or column length can be increased for increased sample load.
Tip # 2Use an initial solvent concentration well below (10-20%) the elutionorganic modifier concentration of the polypeptide being purified.
Tip # 3Load the sample in a solvent that will not interfere with adsorption ofthe polypeptide. This generaly means keeping the organic content wellbelow that required to elute the polypeptide from the column. Somesolvent in the sample, however, improves sample loading.
Tip # 4Sample concentration does not affect column loading capacity, howeverloading dilute samples sometimes results in slightly better resolutionthan loading concentrated samples.
Tip # 5When columns are "over-loaded", particle size becomes less significantin obtaining resolution. Small particle materials give only slightly betterresolution than large particle materials under "over-load" conditions andthe higher cost, higher back-pressure and practical difficulties of columnpreparation with small particle materials make them impractical formost preparative separations.
Page 49
0 60 min
GnRH product peak
Figure 38
Purification of 128 mg of a synthetic peptide, GnRH antagonist
1.2 grams ofsynthesis mixturewere loaded ontoa 5 x 30 cmcolumn packedwith Vydac218TPB1520(C18, 15-20micron) andeluted with agradient ofacetonitrile inwater containingtriethylammoniumphosphate.
Page 48
Examples of large scale purifications
Laboratory-scale purification Several examples of the purification of synthetic peptides by RP-
HPLC have appeared in the literature 32 - 35. In one case 32 128 mg ofgonadotropin releasing hormone (GnRH) antagonist was purified from1.2 grams of synthesis mixture in two RP-HPLC purification steps(Figure 38). The procedure involved (see Reference 32 for details):
1 Establishing elution conditions with triethylammonium phosphateand acetonitrile on a five micron, 4.6 x 250 mm, column;
2 Loading the synthetic peptide onto a 5 x 30 cm column packed with15-20 micron RP material comparable to the five micron material inthe column in Step One and elution with acetonitrile andtriethylammonium phosphate;
3 Analysis of collected fractions for purity and yield and combiningthe best fractions for desalting and final purification;
4 Dilution and re-injection on the same column;
5 Elution using acetonitrile and TFA to remove the non-volatilephosphate salt and improve resolution further;
6 Analysis of collected fractions for purity and yield;
7 Combining the optimum fractions for a final yield of 128 milligramsof GnRH antagonist at a purity of 99.7%.
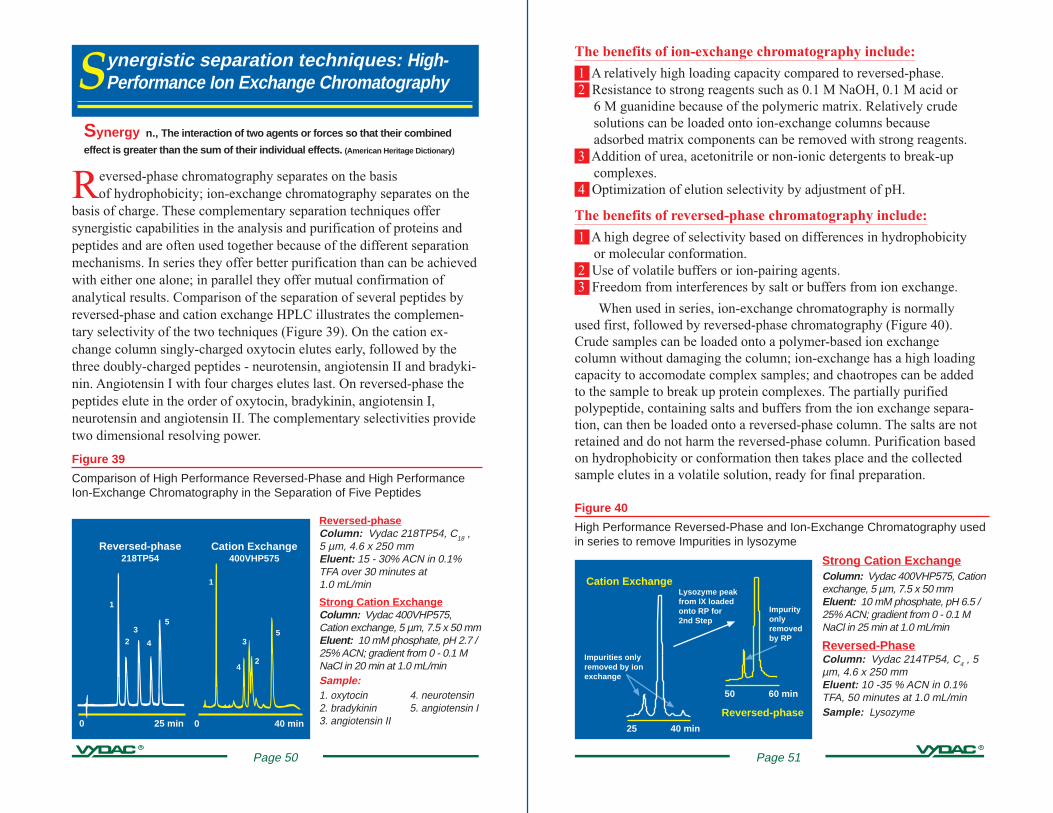
Figure 40
High Performance Reversed-Phase and Ion-Exchange Chromatography usedin series to remove Impurities in lysozyme
Strong Cation ExchangeColumn: Vydac 400VHP575, Cationexchange, 5 µm, 7.5 x 50 mmEluent: 10 mM phosphate, pH 6.5 /25% ACN; gradient from 0 - 0.1 MNaCl in 25 min at 1.0 mL/min
Reversed-PhaseColumn: Vydac 214TP54, C4 , 5µm, 4.6 x 250 mmEluent: 10 -35 % ACN in 0.1%TFA, 50 minutes at 1.0 mL/minSample: Lysozyme
50 60 min
25 40 min
Impurities onlyremoved by ionexchange
Impurityonlyremovedby RP
Lysozyme peakfrom IX loadedonto RP for2nd Step
Reversed-phase
Cation Exchange
Page 51
The benefits of ion-exchange chromatography include:
1 A relatively high loading capacity compared to reversed-phase. 2 Resistance to strong reagents such as 0.1 M NaOH, 0.1 M acid or
6 M guanidine because of the polymeric matrix. Relatively crudesolutions can be loaded onto ion-exchange columns becauseadsorbed matrix components can be removed with strong reagents.
3 Addition of urea, acetonitrile or non-ionic detergents to break-upcomplexes.
4 Optimization of elution selectivity by adjustment of pH.
The benefits of reversed-phase chromatography include:
1 A high degree of selectivity based on differences in hydrophobicityor molecular conformation.
2 Use of volatile buffers or ion-pairing agents. 3 Freedom from interferences by salt or buffers from ion exchange.
When used in series, ion-exchange chromatography is normallyused first, followed by reversed-phase chromatography (Figure 40).Crude samples can be loaded onto a polymer-based ion exchangecolumn without damaging the column; ion-exchange has a high loadingcapacity to accomodate complex samples; and chaotropes can be addedto the sample to break up protein complexes. The partially purifiedpolypeptide, containing salts and buffers from the ion exchange separa-tion, can then be loaded onto a reversed-phase column. The salts are notretained and do not harm the reversed-phase column. Purification basedon hydrophobicity or conformation then takes place and the collectedsample elutes in a volatile solution, ready for final preparation.
Synergistic separation techniques: High-Performance Ion Exchange Chromatography
Synergy n., The interaction of two agents or forces so that their combined
effect is greater than the sum of their individual effects. (American Heritage Dictionary)
Figure 39
Comparison of High Performance Reversed-Phase and High PerformanceIon-Exchange Chromatography in the Separation of Five Peptides
Reversed-phaseColumn: Vydac 218TP54, C18 ,5 µm, 4.6 x 250 mmEluent: 15 - 30% ACN in 0.1%TFA over 30 minutes at1.0 mL/min
Strong Cation ExchangeColumn: Vydac 400VHP575,Cation exchange, 5 µm, 7.5 x 50 mmEluent: 10 mM phosphate, pH 2.7 /25% ACN; gradient from 0 - 0.1 MNaCl in 20 min at 1.0 mL/minSample:1. oxytocin 4. neurotensin2. bradykinin 5. angiotensin I3. angiotensin II
1
23
4
5
Cation Exchange400VHP575
Reversed-phase218TP54
0 25 min 0 40 min
5
2
3
4
1
Reversed-phase chromatography separates on the basisof hydrophobicity; ion-exchange chromatography separates on the
basis of charge. These complementary separation techniques offersynergistic capabilities in the analysis and purification of proteins andpeptides and are often used together because of the different separationmechanisms. In series they offer better purification than can be achievedwith either one alone; in parallel they offer mutual confirmation ofanalytical results. Comparison of the separation of several peptides byreversed-phase and cation exchange HPLC illustrates the complemen-tary selectivity of the two techniques (Figure 39). On the cation ex-change column singly-charged oxytocin elutes early, followed by thethree doubly-charged peptides - neurotensin, angiotensin II and bradyki-nin. Angiotensin I with four charges elutes last. On reversed-phase thepeptides elute in the order of oxytocin, bradykinin, angiotensin I,neurotensin and angiotensin II. The complementary selectivities providetwo dimensional resolving power.
Page 50
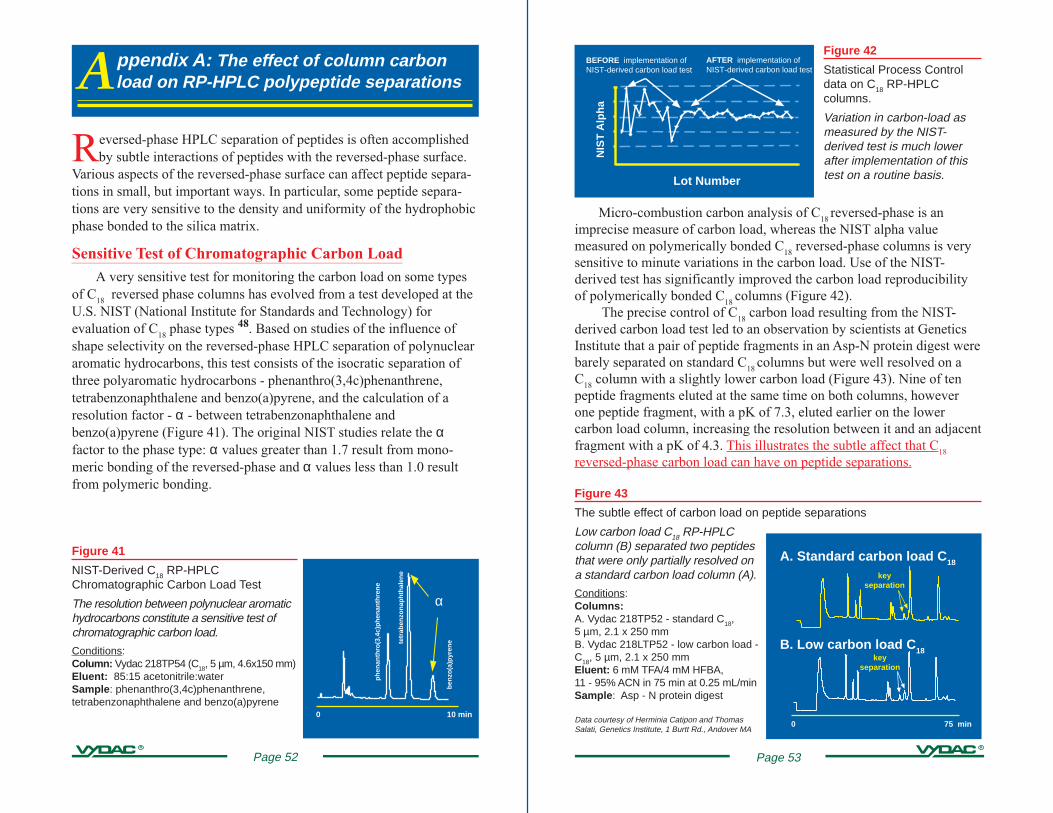
BEFORE implementation ofNIST-derived carbon load test
AFTER implementation ofNIST-derived carbon load test
Lot Number
NIS
T A
lpha
Figure 42
Statistical Process Controldata on C18 RP-HPLCcolumns.
Variation in carbon-load asmeasured by the NIST-derived test is much lowerafter implementation of thistest on a routine basis.
Micro-combustion carbon analysis of C18
reversed-phase is animprecise measure of carbon load, whereas the NIST alpha valuemeasured on polymerically bonded C
18 reversed-phase columns is very
sensitive to minute variations in the carbon load. Use of the NIST-derived test has significantly improved the carbon load reproducibilityof polymerically bonded C
18 columns (Figure 42).
The precise control of C18
carbon load resulting from the NIST-derived carbon load test led to an observation by scientists at GeneticsInstitute that a pair of peptide fragments in an Asp-N protein digest werebarely separated on standard C
18 columns but were well resolved on a
C18
column with a slightly lower carbon load (Figure 43). Nine of tenpeptide fragments eluted at the same time on both columns, howeverone peptide fragment, with a pK of 7.3, eluted earlier on the lowercarbon load column, increasing the resolution between it and an adjacentfragment with a pK of 4.3. This illustrates the subtle affect that C
18
reversed-phase carbon load can have on peptide separations.
Figure 43
The subtle effect of carbon load on peptide separations
Low carbon load C18 RP-HPLCcolumn (B) separated two peptidesthat were only partially resolved ona standard carbon load column (A).
Conditions:Columns:A. Vydac 218TP52 - standard C18,5 µm, 2.1 x 250 mmB. Vydac 218LTP52 - low carbon load -C18, 5 µm, 2.1 x 250 mmEluent: 6 mM TFA/4 mM HFBA,11 - 95% ACN in 75 min at 0.25 mL/minSample : Asp - N protein digest
Data courtesy of Herminia Catipon and ThomasSalati, Genetics Institute, 1 Burtt Rd., Andover MA
0 75 min
keyseparation
B. Low carbon load C 18
A. Standard carbon load C 18
keyseparation
Page 53
Reversed-phase HPLC separation of peptides is often accomplishedby subtle interactions of peptides with the reversed-phase surface.
Various aspects of the reversed-phase surface can affect peptide separa-tions in small, but important ways. In particular, some peptide separa-tions are very sensitive to the density and uniformity of the hydrophobicphase bonded to the silica matrix.
Sensitive Test of Chromatographic Carbon LoadA very sensitive test for monitoring the carbon load on some types
of C18
reversed phase columns has evolved from a test developed at theU.S. NIST (National Institute for Standards and Technology) forevaluation of C
18 phase types 48. Based on studies of the influence of
shape selectivity on the reversed-phase HPLC separation of polynucleararomatic hydrocarbons, this test consists of the isocratic separation ofthree polyaromatic hydrocarbons - phenanthro(3,4c)phenanthrene,tetrabenzonaphthalene and benzo(a)pyrene, and the calculation of aresolution factor - α - between tetrabenzonaphthalene andbenzo(a)pyrene (Figure 41). The original NIST studies relate the αfactor to the phase type: α values greater than 1.7 result from mono-meric bonding of the reversed-phase and α values less than 1.0 resultfrom polymeric bonding.
0 10 min
Figure 41
NIST-Derived C18 RP-HPLCChromatographic Carbon Load Test
The resolution between polynuclear aromatichydrocarbons constitute a sensitive test ofchromatographic carbon load.
Conditions:Column: Vydac 218TP54 (C18, 5 µm, 4.6x150 mm)Eluent: 85:15 acetonitrile:waterSample : phenanthro(3,4c)phenanthrene,tetrabenzonaphthalene and benzo(a)pyrene
α
phen
anth
ro(3
,4c)
phen
anth
rene
tetr
aben
zona
phth
alen
e
benz
o(a)
pyre
ne
Appendix A: The effect of column carbonload on RP-HPLC polypeptide separations
Page 52
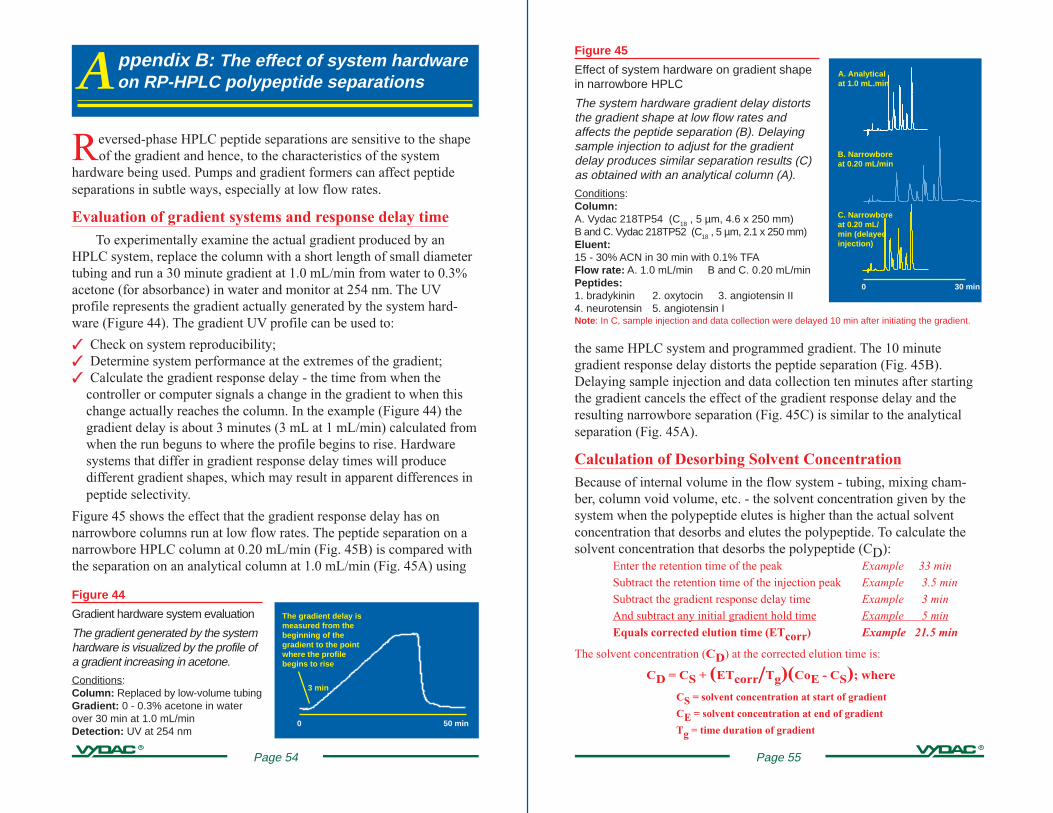
Figure 45
Effect of system hardware on gradient shapein narrowbore HPLC
The system hardware gradient delay distortsthe gradient shape at low flow rates andaffects the peptide separation (B). Delayingsample injection to adjust for the gradientdelay produces similar separation results (C)as obtained with an analytical column (A).
Conditions:Column:A. Vydac 218TP54 (C18 , 5 µm, 4.6 x 250 mm)B and C. Vydac 218TP52 (C18 , 5 µm, 2.1 x 250 mm)Eluent:15 - 30% ACN in 30 min with 0.1% TFAFlow rate: A. 1.0 mL/min B and C. 0.20 mL/minPeptides:1. bradykinin 2. oxytocin 3. angiotensin II4. neurotensin 5. angiotensin INote : In C, sample injection and data collection were delayed 10 min after initiating the gradient.
0 30 min
A. Analyticalat 1.0 mL.min
B. Narrowboreat 0.20 mL/min
C. Narrowboreat 0.20 mL/min (delayedinjection)
the same HPLC system and programmed gradient. The 10 minutegradient response delay distorts the peptide separation (Fig. 45B).Delaying sample injection and data collection ten minutes after startingthe gradient cancels the effect of the gradient response delay and theresulting narrowbore separation (Fig. 45C) is similar to the analyticalseparation (Fig. 45A).
Calculation of Desorbing Solvent ConcentrationBecause of internal volume in the flow system - tubing, mixing cham-ber, column void volume, etc. - the solvent concentration given by thesystem when the polypeptide elutes is higher than the actual solventconcentration that desorbs and elutes the polypeptide. To calculate thesolvent concentration that desorbs the polypeptide (CD):
Enter the retention time of the peak Example 33 minSubtract the retention time of the injection peak Example 3.5 minSubtract the gradient response delay time Example 3 minAnd subtract any initial gradient hold time Example 5 minEquals corrected elution time (ETcorr) Example 21.5 min
The solvent concentration (CD) at the corrected elution time is:
CD = CS + (ETcorr/Tg)(CoE - CS); where
CS = solvent concentration at start of gradient
CE = solvent concentration at end of gradient
Tg = time duration of gradient
Page 55
Reversed-phase HPLC peptide separations are sensitive to the shapeof the gradient and hence, to the characteristics of the system
hardware being used. Pumps and gradient formers can affect peptideseparations in subtle ways, especially at low flow rates.
Evaluation of gradient systems and response delay timeTo experimentally examine the actual gradient produced by an
HPLC system, replace the column with a short length of small diametertubing and run a 30 minute gradient at 1.0 mL/min from water to 0.3%acetone (for absorbance) in water and monitor at 254 nm. The UVprofile represents the gradient actually generated by the system hard-ware (Figure 44). The gradient UV profile can be used to:
✓ Check on system reproducibility;✓ Determine system performance at the extremes of the gradient;✓ Calculate the gradient response delay - the time from when the
controller or computer signals a change in the gradient to when thischange actually reaches the column. In the example (Figure 44) thegradient delay is about 3 minutes (3 mL at 1 mL/min) calculated fromwhen the run beguns to where the profile begins to rise. Hardwaresystems that differ in gradient response delay times will producedifferent gradient shapes, which may result in apparent differences inpeptide selectivity.
Figure 45 shows the effect that the gradient response delay has onnarrowbore columns run at low flow rates. The peptide separation on anarrowbore HPLC column at 0.20 mL/min (Fig. 45B) is compared withthe separation on an analytical column at 1.0 mL/min (Fig. 45A) using
Appendix B: The effect of system hardwareon RP-HPLC polypeptide separations
0 50 min
The gradient delay ismeasured from thebeginning of thegradient to the pointwhere the profilebegins to rise
Figure 44
Gradient hardware system evaluation
The gradient generated by the systemhardware is visualized by the profile ofa gradient increasing in acetone.
Conditions:Column: Replaced by low-volume tubingGradient: 0 - 0.3% acetone in waterover 30 min at 1.0 mL/minDetection: UV at 254 nm
3 min
Page 54
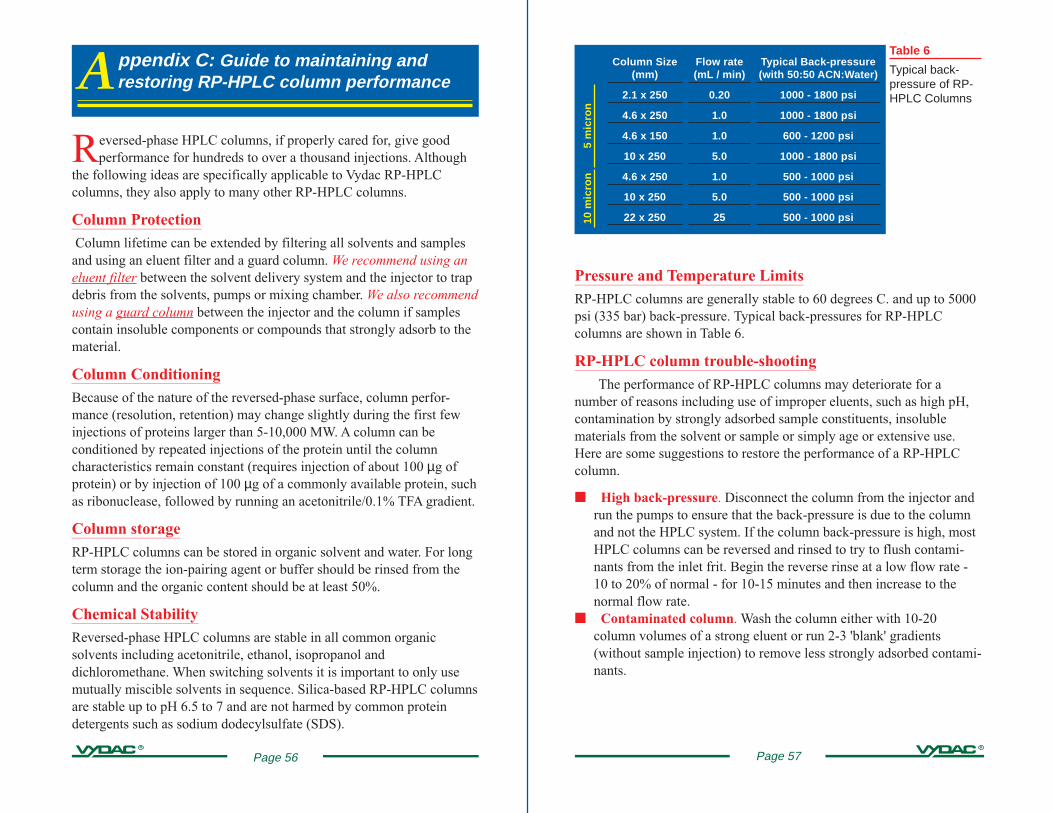
10 m
icro
n5
mic
ron
Column Size(mm)
2.1 x 250
4.6 x 250
4.6 x 150
10 x 250
4.6 x 250
10 x 250
22 x 250
Flow rate(mL / min)
0.20
1.0
1.0
5.0
1.0
5.0
25
Typical Back-pressure(with 50:50 ACN:Water)
1000 - 1800 psi
1000 - 1800 psi
600 - 1200 psi
1000 - 1800 psi
500 - 1000 psi
500 - 1000 psi
500 - 1000 psi
Table 6
Typical back-pressure of RP-HPLC Columns
Pressure and Temperature LimitsRP-HPLC columns are generally stable to 60 degrees C. and up to 5000psi (335 bar) back-pressure. Typical back-pressures for RP-HPLCcolumns are shown in Table 6.
RP-HPLC column trouble-shootingThe performance of RP-HPLC columns may deteriorate for a
number of reasons including use of improper eluents, such as high pH,contamination by strongly adsorbed sample constituents, insolublematerials from the solvent or sample or simply age or extensive use.Here are some suggestions to restore the performance of a RP-HPLCcolumn.
■ High back-pressure. Disconnect the column from the injector andrun the pumps to ensure that the back-pressure is due to the columnand not the HPLC system. If the column back-pressure is high, mostHPLC columns can be reversed and rinsed to try to flush contami-nants from the inlet frit. Begin the reverse rinse at a low flow rate -10 to 20% of normal - for 10-15 minutes and then increase to thenormal flow rate.
■ Contaminated column. Wash the column either with 10-20column volumes of a strong eluent or run 2-3 'blank' gradients(without sample injection) to remove less strongly adsorbed contami-nants.
Page 57
Reversed-phase HPLC columns, if properly cared for, give goodperformance for hundreds to over a thousand injections. Although
the following ideas are specifically applicable to Vydac RP-HPLCcolumns, they also apply to many other RP-HPLC columns.
Column Protection Column lifetime can be extended by filtering all solvents and samplesand using an eluent filter and a guard column. We recommend using aneluent filter between the solvent delivery system and the injector to trapdebris from the solvents, pumps or mixing chamber. We also recommendusing a guard column between the injector and the column if samplescontain insoluble components or compounds that strongly adsorb to thematerial.
Column ConditioningBecause of the nature of the reversed-phase surface, column perfor-mance (resolution, retention) may change slightly during the first fewinjections of proteins larger than 5-10,000 MW. A column can beconditioned by repeated injections of the protein until the columncharacteristics remain constant (requires injection of about 100 µg ofprotein) or by injection of 100 µg of a commonly available protein, suchas ribonuclease, followed by running an acetonitrile/0.1% TFA gradient.
Column storageRP-HPLC columns can be stored in organic solvent and water. For longterm storage the ion-pairing agent or buffer should be rinsed from thecolumn and the organic content should be at least 50%.
Chemical StabilityReversed-phase HPLC columns are stable in all common organicsolvents including acetonitrile, ethanol, isopropanol anddichloromethane. When switching solvents it is important to only usemutually miscible solvents in sequence. Silica-based RP-HPLC columnsare stable up to pH 6.5 to 7 and are not harmed by common proteindetergents such as sodium dodecylsulfate (SDS).
Appendix C: Guide to maintaining andrestoring RP-HPLC column performance
Page 56
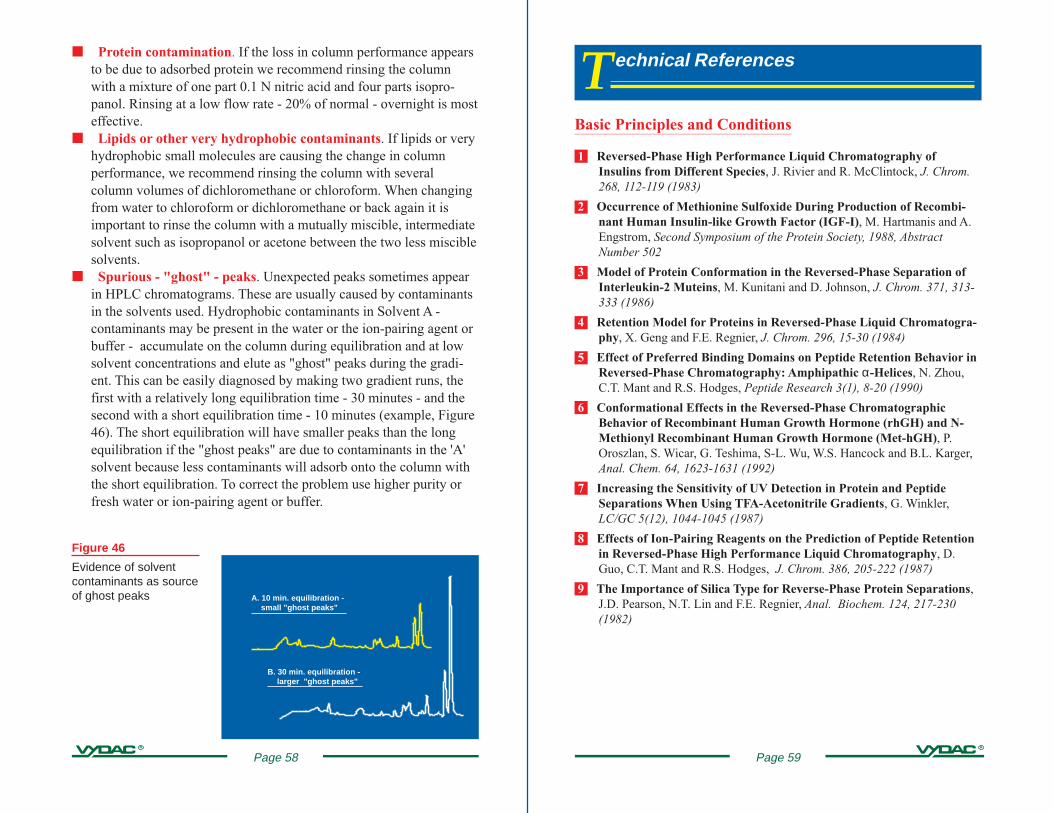
Technical References
Basic Principles and Conditions
1 Reversed-Phase High Performance Liquid Chromatography ofInsulins from Different Species, J. Rivier and R. McClintock, J. Chrom.268, 112-119 (1983)
2 Occurrence of Methionine Sulfoxide During Production of Recombi-nant Human Insulin-like Growth Factor (IGF-I), M. Hartmanis and A.Engstrom, Second Symposium of the Protein Society, 1988, AbstractNumber 502
3 Model of Protein Conformation in the Reversed-Phase Separation ofInterleukin-2 Muteins, M. Kunitani and D. Johnson, J. Chrom. 371, 313-333 (1986)
4 Retention Model for Proteins in Reversed-Phase Liquid Chromatogra-phy, X. Geng and F.E. Regnier, J. Chrom. 296, 15-30 (1984)
5 Effect of Preferred Binding Domains on Peptide Retention Behavior inReversed-Phase Chromatography: Amphipathic α-Helices, N. Zhou,C.T. Mant and R.S. Hodges, Peptide Research 3(1), 8-20 (1990)
6 Conformational Effects in the Reversed-Phase ChromatographicBehavior of Recombinant Human Growth Hormone (rhGH) and N-Methionyl Recombinant Human Growth Hormone (Met-hGH), P.Oroszlan, S. Wicar, G. Teshima, S-L. Wu, W.S. Hancock and B.L. Karger,Anal. Chem. 64, 1623-1631 (1992)
7 Increasing the Sensitivity of UV Detection in Protein and PeptideSeparations When Using TFA-Acetonitrile Gradients, G. Winkler,LC/GC 5(12), 1044-1045 (1987)
8 Effects of Ion-Pairing Reagents on the Prediction of Peptide Retentionin Reversed-Phase High Performance Liquid Chromatography, D.Guo, C.T. Mant and R.S. Hodges, J. Chrom. 386, 205-222 (1987)
9 The Importance of Silica Type for Reverse-Phase Protein Separations,J.D. Pearson, N.T. Lin and F.E. Regnier, Anal. Biochem. 124, 217-230(1982)
Page 59
■ Protein contamination. If the loss in column performance appearsto be due to adsorbed protein we recommend rinsing the columnwith a mixture of one part 0.1 N nitric acid and four parts isopro-panol. Rinsing at a low flow rate - 20% of normal - overnight is mosteffective.
■ Lipids or other very hydrophobic contaminants. If lipids or veryhydrophobic small molecules are causing the change in columnperformance, we recommend rinsing the column with severalcolumn volumes of dichloromethane or chloroform. When changingfrom water to chloroform or dichloromethane or back again it isimportant to rinse the column with a mutually miscible, intermediatesolvent such as isopropanol or acetone between the two less misciblesolvents.
■ Spurious - "ghost" - peaks. Unexpected peaks sometimes appearin HPLC chromatograms. These are usually caused by contaminantsin the solvents used. Hydrophobic contaminants in Solvent A -contaminants may be present in the water or the ion-pairing agent orbuffer - accumulate on the column during equilibration and at lowsolvent concentrations and elute as "ghost" peaks during the gradi-ent. This can be easily diagnosed by making two gradient runs, thefirst with a relatively long equilibration time - 30 minutes - and thesecond with a short equilibration time - 10 minutes (example, Figure46). The short equilibration will have smaller peaks than the longequilibration if the "ghost peaks" are due to contaminants in the 'A'solvent because less contaminants will adsorb onto the column withthe short equilibration. To correct the problem use higher purity orfresh water or ion-pairing agent or buffer.
A. 10 min. equilibration -small "ghost peaks"
B. 30 min. equilibration -larger "ghost peaks"
Figure 46
Evidence of solventcontaminants as sourceof ghost peaks
Page 58
20 Separation and Purification of S49 Mouse Lymphoma Histones byReversed-Phase High Performance Liquid Chromatography, M.C.McCroskey, V.E. Groppi, and J.D. Pearson, Anal. Biochem. 169, 427-432(1987)
21 Subunit Analysis of Bovine Cytochrome c Oxidase by Reverse PhaseHigh Performance Liquid Chromatography, N. C. Robinson, M.D. Daleand L.H. Talbert, Arch. of Biochem. and Biophys. 281(2), 239-244 (1990)
22 Oxidative Refolding of Insulin-like Growth Factor 1 Yields TwoProducts of Similar Thermodynamic Stability: A Bifurcating Protein-Folding Pathway, J.A. Miller, L.O. Narhi, Q-X. Hua, R. Rosenfeld, T.Arakawa, M. Rohde, S. Prestrelski, S. Lauren, K.S. Stoney, L. Tsai andM.A. Weiss, Biochem. 32, 5203-5213 (1993)
23 Characterization of a Solvent System for Separation of Water-insolublePoliovirus Proteins by Reversed-Phase High-Performance LiquidChromatography, J. Heukeshoven and R. Dernick, J. Chrom. 326, 91-101(1985)
24 Rice Cultivar Identification by High-Performance Liquid Chromato-graphy of Endosperm Proteins, F.R. Huebner, J.A. Bietz, B.D. Webb andB.O. Juliano, Cereal Chem. 67(2), 129-135 (1990)
25 Application of High-Performance Liquid Chromatographic Tech-niques to the Separation of Ribosomal Proteins of Different Organ-isms, R.M. Kamp, A. Bosserhoff, D. Kamp and B. Wittman-Liebold, J.Chrom. 317, 181-192 (1984)
26 Purification of Integral Plasma Membrane Proteins by Reverse-PhaseHigh Performance Liquid Chromatography, M.R. Sussman, Anal.Biochem. 169, 395-399 (1988)
27 High Performance Liquid Chromatographic Separations of the GlobinChains of Non-human Hemoglobins, W.A. Schroeder, J.B. Shelton, J.R.Shelton, V. Huynh and D.B. Teplow, Hemoglobin 9(4), 461-482 (1985)
28 Hb Astec or alpha 2/76 (EF5) Met to Thr (beta-2) detection of a SilentMutant by High Performance Liquid Chromatography, J.B. Shelton,J.R. Shelton, W.A. Schroeder and D.R. Powars, Hemoglobin 9, 325-332(1985)
29 Isolation and amino acid sequence of an acid soluble protein fromClostridium perfringens spores, P.E. Granum, M. Richardson and H.Blom, FEMS Microbiology Letters 42, 225-230 (1987)
Page 61
Applications
10 A new strategy for mapping the topography of a transmembraneprotein using mass spectrometry, A.M. Falick, S.F. Mel, R.M. Stroudand A.L. Burlingame, in Techniques in Protein Chemistry (T. Hugli,editor), Academic Press, New York (1989)
11 Microscale Structure Analysis of a High Molecular Weight, Hydropho-bic Membrane Glycoprotein Fraction with Platelet-Derived GrowthFactor-Dependent Kinase Activity, P. Tempst, D. Woo, D.B. Teplow, R.Aebersold, L.E. Hood and S.B.H. Kent, J. Chrom. 359, 403-412 (1986)
12 Enzymatic digestion of proteins and HPLC peptide isolation in the sub-nanomole range, K. Stone and K. Williams, 2nd Symposium of the ProteinSociety, 1988, Abstract T911
13 The Role of Quality Control in Biotechnology: An Analytical Perspec-tive, R.L. Garnick, N.J. Solli and P.A. Papa, Anal. Chem. 60, 2546-2557(1988)
14 Purification and Characterization of Recombinant Bovine Somatotro-pin Containing an Isoaspartyl Residue, M.R. Schlittler, P.C. Toren, N.R.Siegel and B.N. Violand, Ninth ISPPP, 1989, Abstract 621
15 Peptide Mapping of Subtilisins as a Practical Tool for Locating ProteinSequence Errors during Extensive Protein Engineering Projects, T.Christianson and C. Paech, Anal. Biochem. 223, 119-129 (1994)
16 Characterization of Tryptic Peptides of a Potent Growth HormoneReleasing Hormone Analog by Reversed Phase High PerformanceLiquid Chromatography - Ionspray Mass Spectrometry, J.P. Chang,J.M. Richardson and R.M. Riggin, J. Liq. Chrom. 17(13), 2881-2894(1994)
17 Isolation and primary structure of two peptides withcardioacceleratory and hyperglycemic activity from the corporacardiaca of Periplaneta americana, R.M. Scarborough, G.C. Jamieson, F.Kalish, S.J. Kramer, G.A. McEnroe, C.A. Miller and D.A. Schooley, Proc.Nat. Acad. Sci. 81, 5575-5579 (1984)
18 Increased levels of Hemoglobin-derived and Other Peptides inAlzheimer's Disease Cerebellum, J.R. Slemmon, C.M. Hughes, G.A.Campbell and D.G. Flood, J. of Neuroscience 14(4), 2225-2235 (1994)
19 Separation and Purification of Individual Neurofilament Proteins byReversed-Phase High-Performance Liquid Chromatography, K-S. Hui,M. Hui, F-C. Chiu, M. Banay-Schwartz, T. Deguzman, R.S. Sacchi and A.Lajtha, Anal. Biochem. 153, 230-234 (1986)
Page 60
Page 63
40 Use of a Urea and Guanidine-HCl -Propanol Solvent System to Purifya Growth Inhibitory Glycopeptide by High Performance LiquidChromatography, B.G. Sharifi, C.C. Bascom, V.K. Khurana and T.C.Johnson, J. Chrom. 324, 173-180 (1985)
41 Substrate Analogue Inhibition and Active Site Titration of PurifiedRecombinant HIV-1 Protease, A.G. Tomasselli, M.K. Olsen, J.O. Hui,D.J. Staples, T.K. Sawyer, R.L. Heinrikson and C-S. C. Tomich, Biochem-istry 29, 264-269 (1990)
42 A Simple and Rapid Purification of Commercial Trypsin andChymotrypsin by Reverse-Phase High-Performance Liquid Chroma-tography, K. Titani, T. Sasagawa, K. Resing and K.A. Walsh, Anal.Biochem. 123, 408-412 (1982)
43 HPLC Purification of the Main Allergen of Parietaria judaica Pollen, F.Polo, R. Ayuso and J. Carriera, Molecular Immunology 27(2), 151-157(1990)
Other44 Erythropoetin purification, Por-Hsiung and T. Strickland, U.S. Patent No.
04667016
45 Expression, Purification and Characterization of Recombinant MurineGranulocyte-Macrophage Colony-Stimulating Factor and BovineInterleukin-2 From Yeast, V. Price, D. Mochizuki, C.J. March, D.Cosman, M.C. Deeley, R. Klinke, W. Clevenger, S. Gillis, P. Baker and D.Urdal, Gene 55, 287-293 (1987)
46 Production of Recombinant Human Colony Stimulating Factors inYeast, S. Gillis, D. Urdal, W. Clevenger, R. Klinke, H. Sassenfeld, V. Priceand D. Cosman, Behring Institute Research Communications 83, 1-7(1988)
47 Production Scale Purification of Biosynthetic Human Insulin ByReversed-Phase High-Performance Liquid Chromatography, E.P.Kroeff, R.A. Owens, E.L. Campbell, R.D. Johnson and H.I. Marks, J.Chrom. 461, 45-61 (1989)
48 Appendix to SRM 869: Column Selectivity Test Mixture for LiquidChromatography, United States National Institute of Standards andTechnology
Micro-bore, Narrow-bore and Capillary Columns
30 Analysis of peptide mixtures by capillary high performance liquidchromatography: A practical guide to small-scale separations, M.T.Davis and T.D. Lee, Protein Science 1, 935-944 (1992)
31 Microbore reversed-phase high-performance liquid chromatographicpurification of peptides for combined chemical sequencing-laser-desorption mass spectrometric analysis, C. Elicone, M. Lui, S.Germanos, H. Erdjument-Bromage and P. Tempst, J. Chrom. A, 676, 121-137 (1994)
Preparative Chromatography
32 Reversed-Phase High Performance Liquid Chromatography: Prepara-tive Purification of Synthetic Peptides, J. Rivier, R. McClintock, R.Galyean, and H. Anderson, J. Chrom. 288, 303-328 (1984)
33 Preparative Reverse Phase High Performance Liquid Chromatogra-phy: Effects of Buffer pH on the Purification of Synthetic Peptides, C.Hoeger, R. Galyean, J. Boublik, R. McClintock and J. Rivier,Biochromatography 2, 134-142 (1987)
34 High Performance Preparative Scale Purification of Human EpidermalGrowth Factor, R.F. Burgoyne, M.F. Charette and T. Kierstead, Journal ofAnalysis and Purification, October 1986, 48-53
35 Practical Aspects of Preparative Reversed-phase Chromatography ofSynthetic Peptides, C.A. Hoeger, R. Galyean, R.A. McClintock and J.E.Rivier, in HPLC of Peptides and Proteins: Separation, Analysis andConformation, Pages 753-764
Practical Aspects of Reversed-phase Chromatography
36 Factors affecting the separation and loading capacity of proteins inpreparative gradient elution high-performance liquid chromatogra-phy, Y-B. Yang, K. Harrison, D. Carr and G. Guiochon, J. Chrom. 590, 35-47 (1992)
37 Synthetic Peptide Purification by Application of Linear SolventStrength Gradient Theory, J.C. Ford and J.A. Smith, J. Chrom. 483, 131-143 (1989)
38 Micropreparative Separation of Peptides Derived from SodiumDodecyl Sulfate-Solubilized Proteins, A. Bosserhoff, J. Wallach and R.W.Frank, J. Chrom. 473, 71-77 (1989)
39 Prevention of Aggregation of Synthetic Membrane Protein by Additionof Detergent, J.M. Tomich, L.W. Carson, K.J. Kanes, N.J. Vogelaar, M.R.Emerling and J.H. Richards, Anal. Biochem. 174, 197-203 (1988)
Page 62

Digest of colicin Ia, a transmembrane protein (see Figure 15, Page 20)
For further information regarding Vydac HPLC columns forbioseparations or to contact one of our Technical Specialists:
By mail:17434 Mojave StreetHesperia CA 92345 USA
By phone:USA 760-244-6107 or1-800-247-0924 (Toll-free in NorthAmerica)
By Facsimile:USA 760-244-1984